
nLossFinder—A Graphical User Interface Program for the Nontargeted Detection of DNA Adducts

 ,
, 
Abstract
:1. Introduction
2. Methods
2.1. nLossFinder GUI and Algorithms
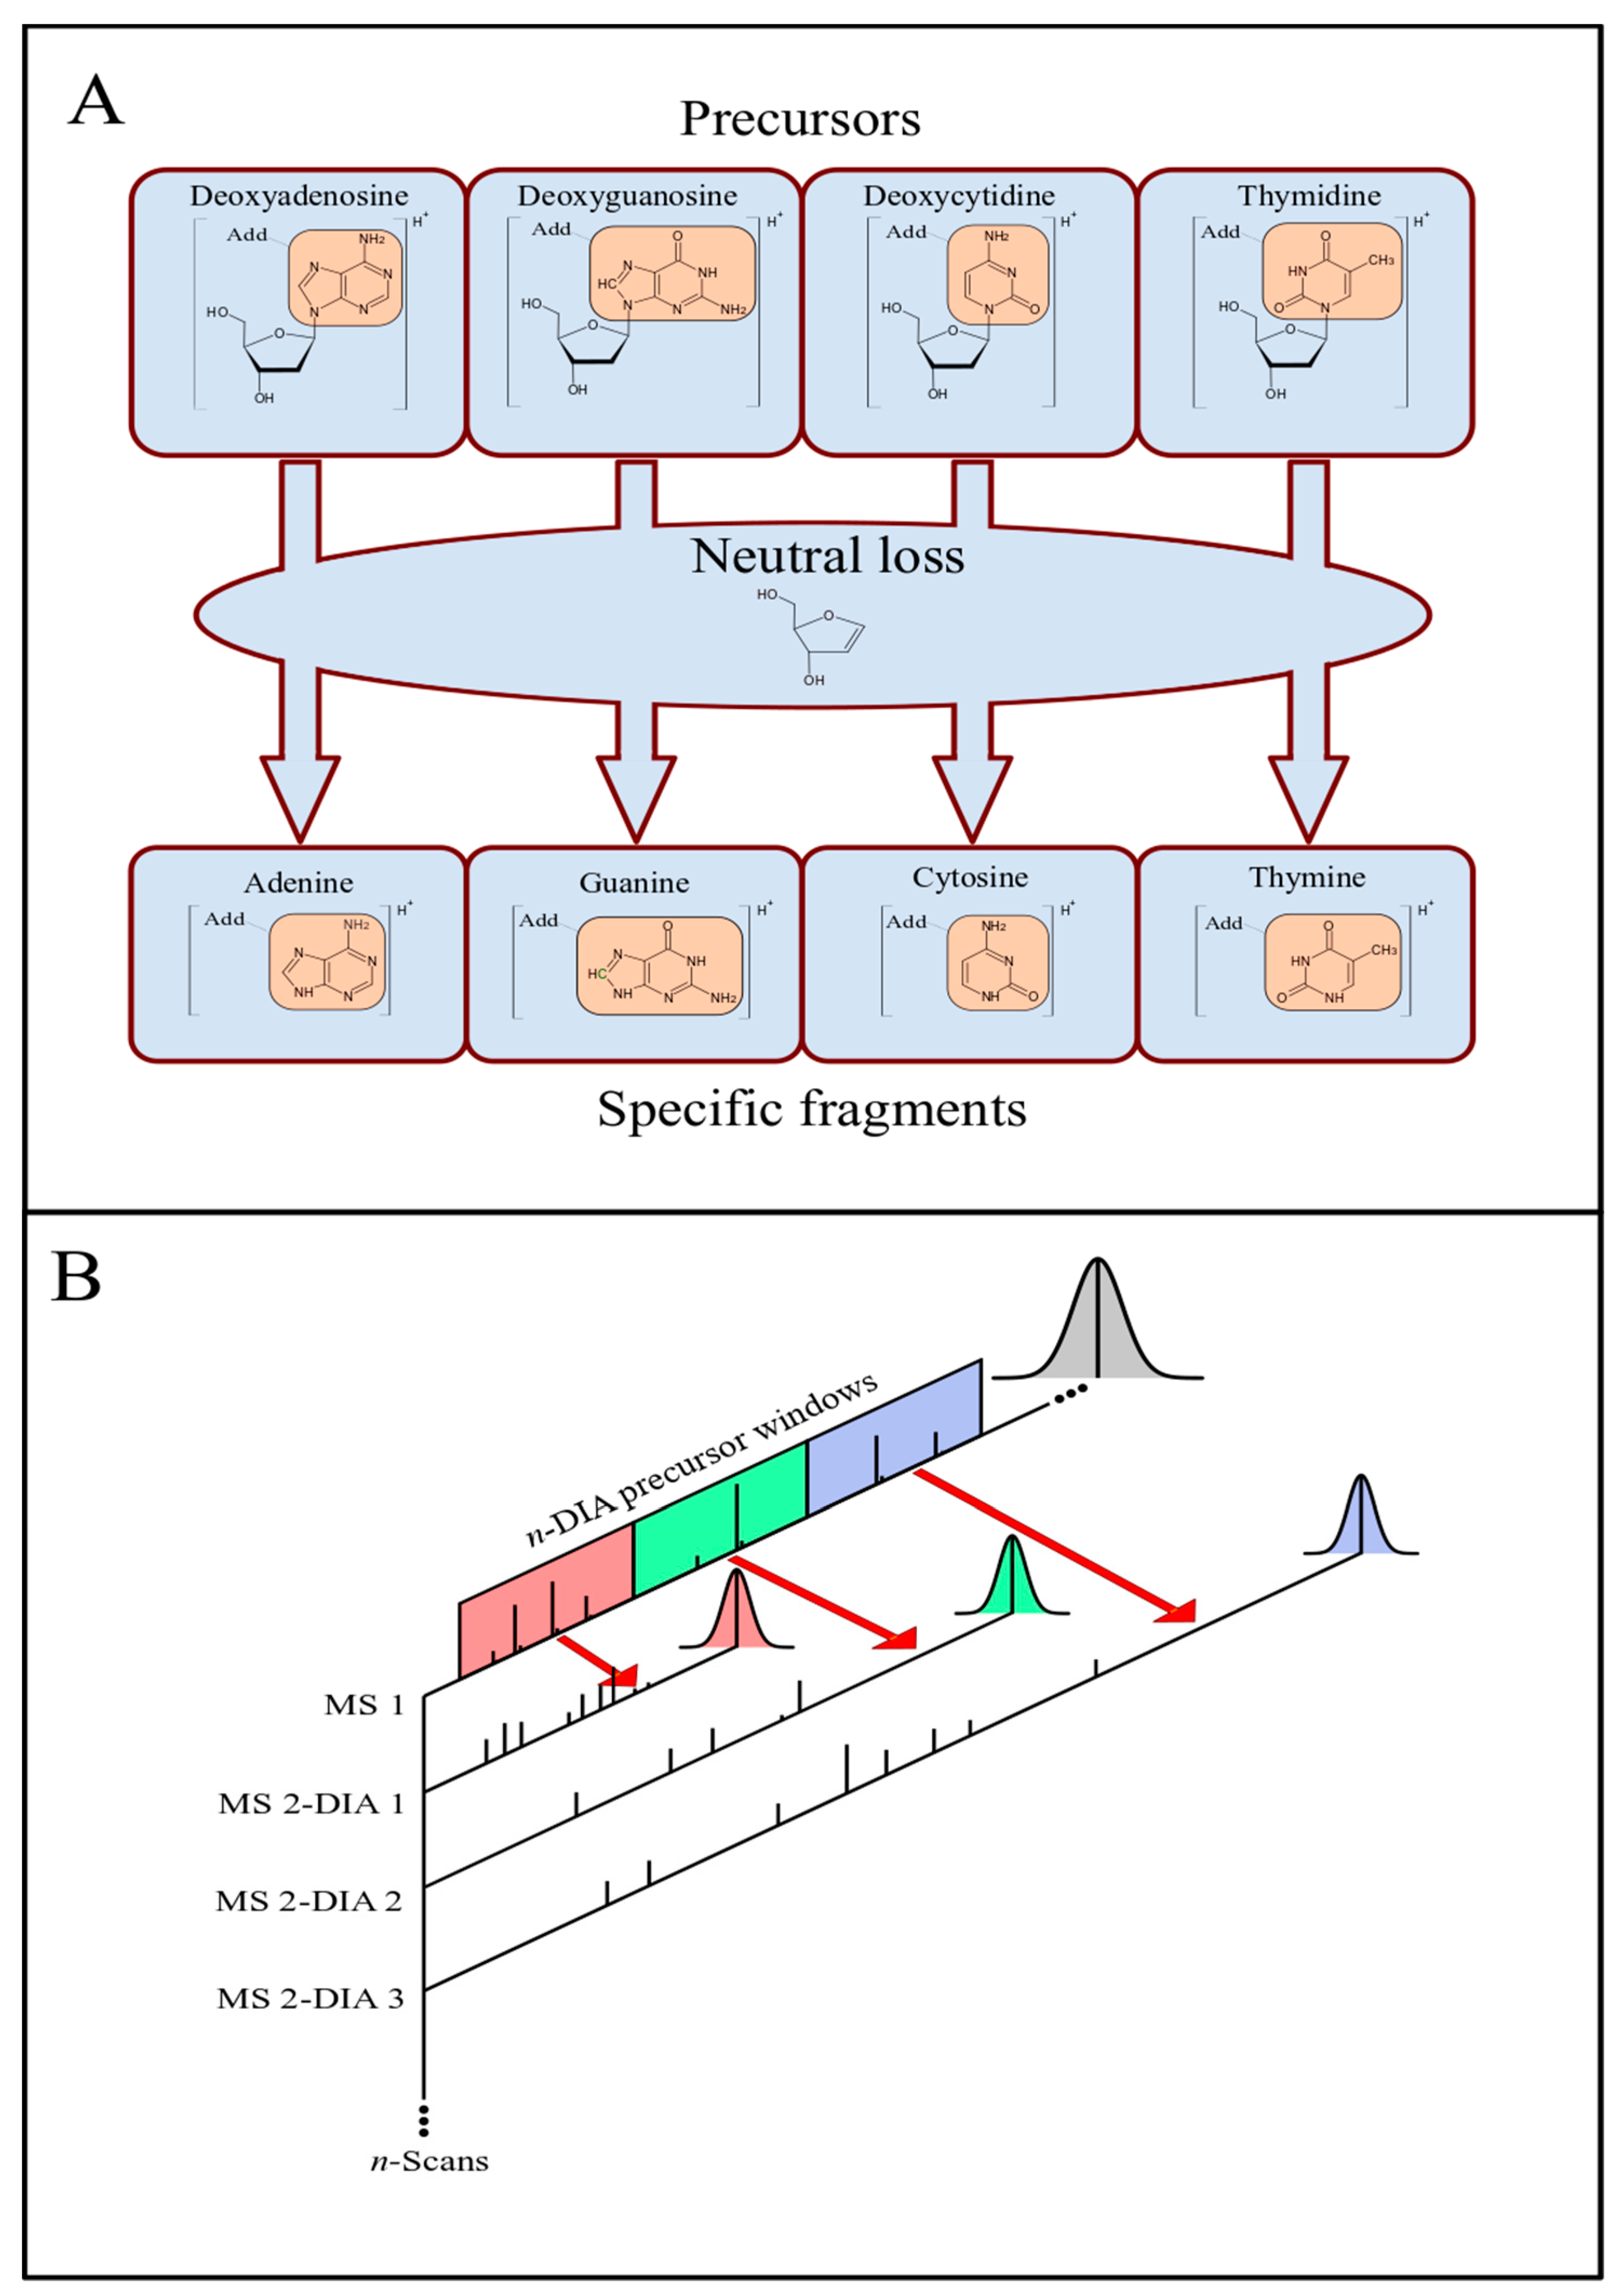
- Separation of the raw data into one MS1 dataset and n-MS2 datasets (n is the number of DIA windows).
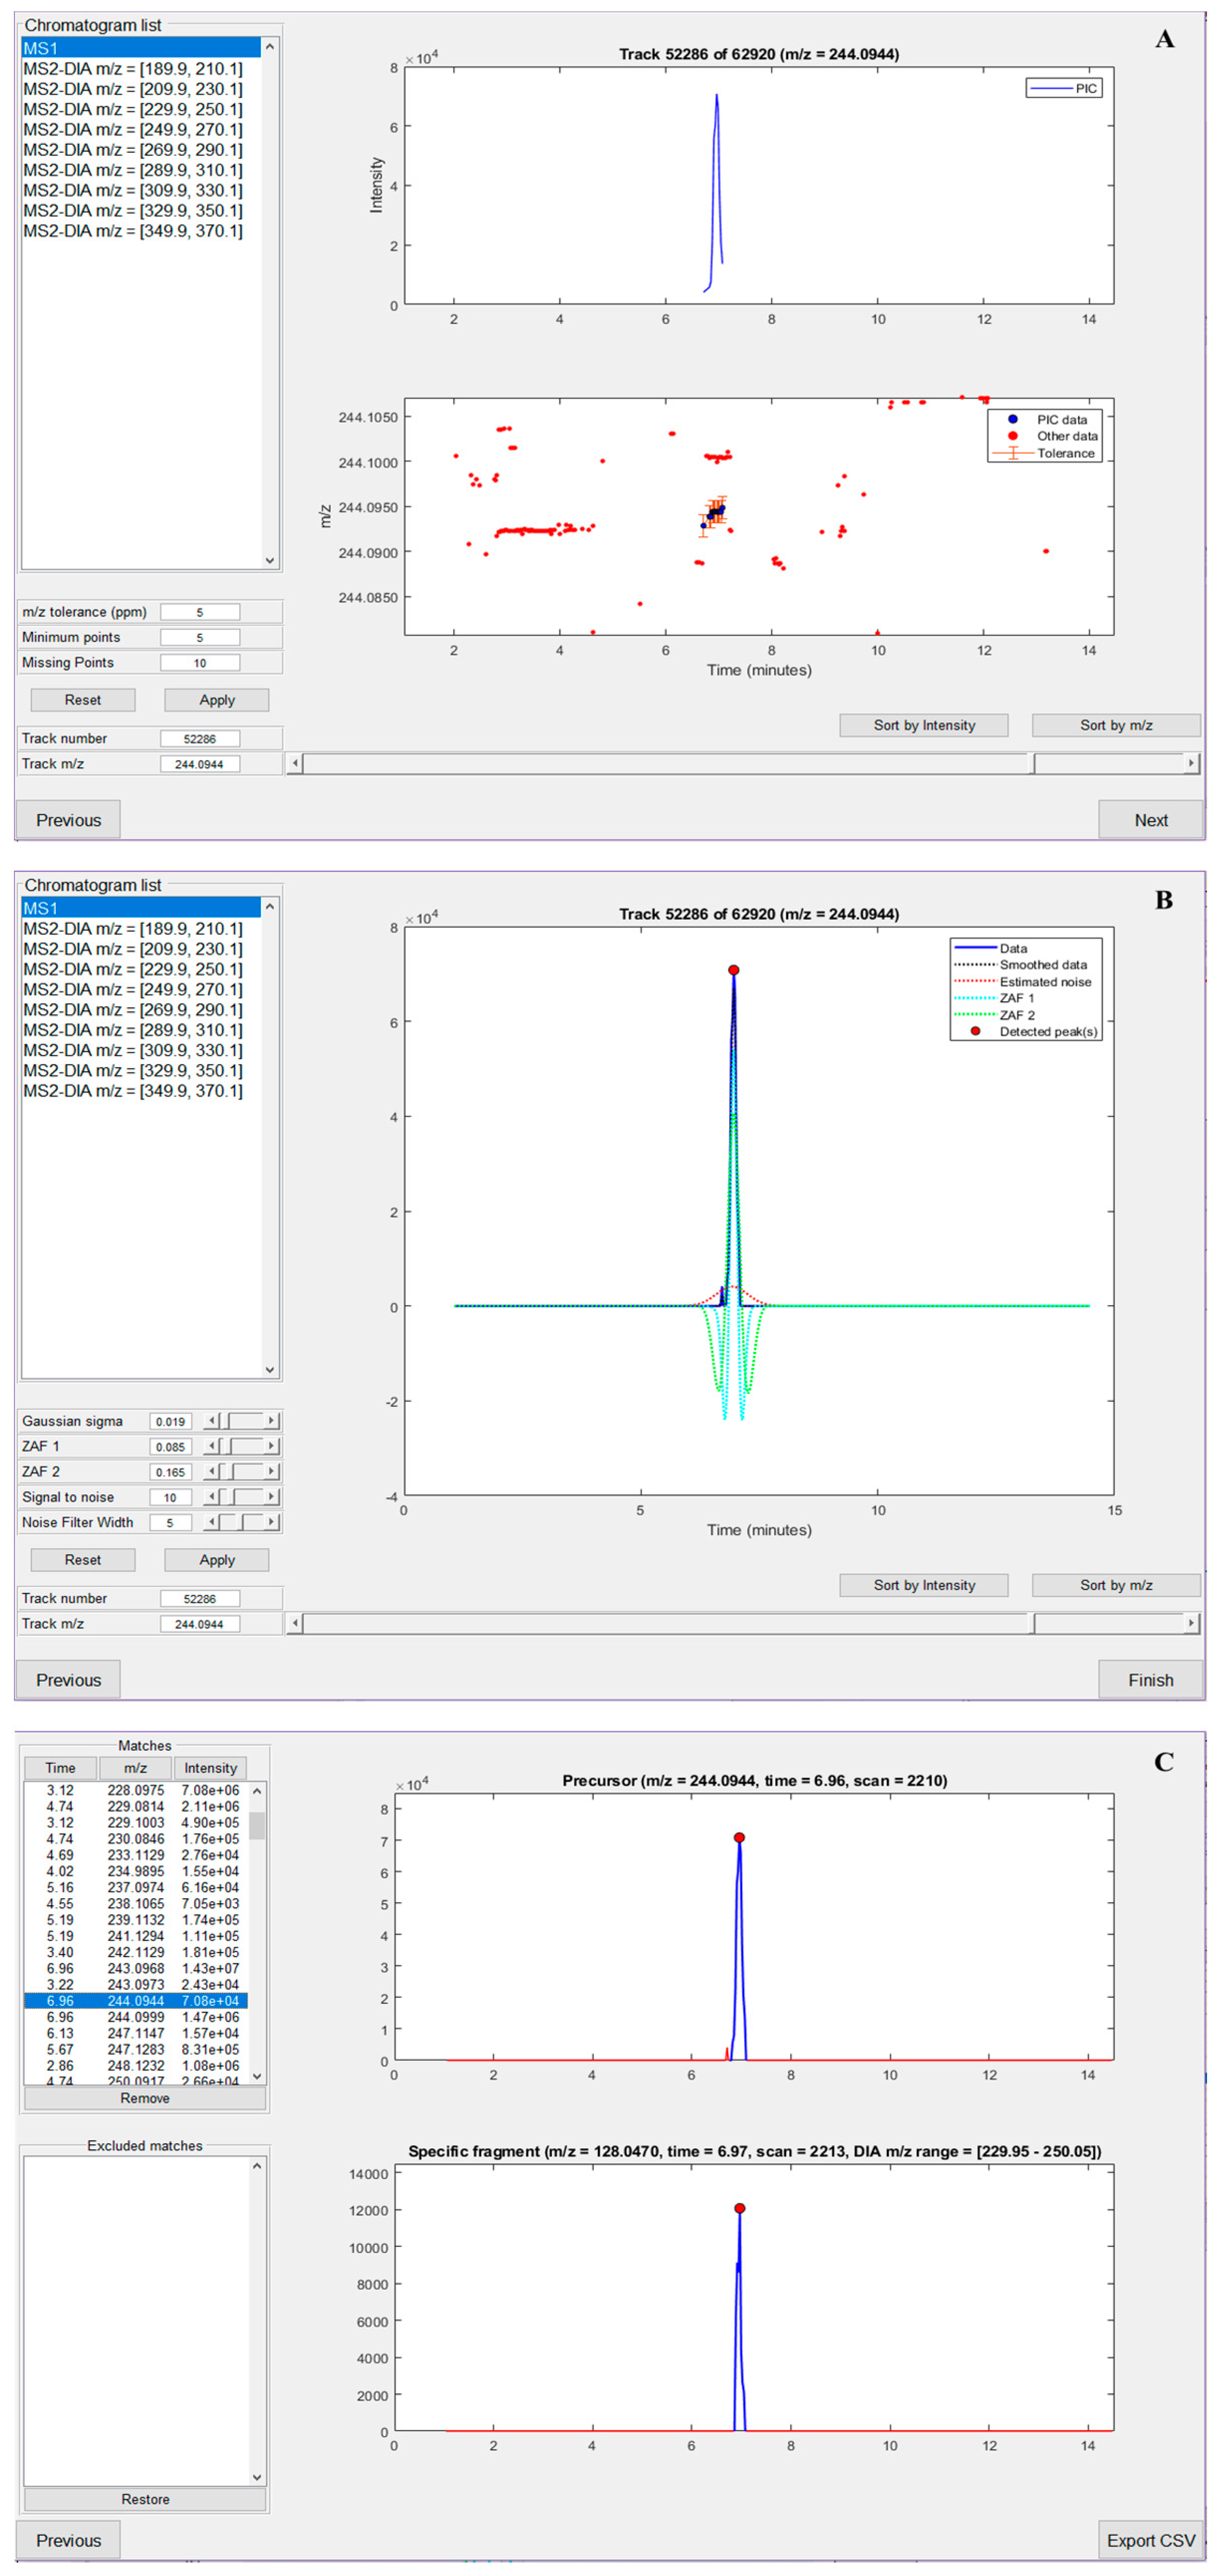
- Extraction of PICs from each dataset.
- Detection of peaks in the PICs.
- Matching precursor peaks in MS1 with specific (adducted nucleobase) fragments peaks in MS2 that correspond to the neutral loss of interest.
2.2. Experimental
3. Results and Discussion
4. Conclusions
Supplementary Materials
Author Contributions
Funding
Institutional Review Board Statement
Informed Consent Statement
Data Availability Statement
Acknowledgments
Conflicts of Interest
References
- Tretyakova, N.; Villalta, P.W.; Kotapati, S. Mass Spectrometry of Structurally Modified DNA. Chem. Rev. 2013, 113, 2395–2436. [Google Scholar] [CrossRef] [PubMed] [Green Version]
- Koc, H.; Swenberg, J.A. Applications of mass spectrometry for quantitation of DNA adducts. J. Chromatogr. B 2002, 778, 323–343. [Google Scholar] [CrossRef]
- Motwani, H.V.; Westberg, E.; Lindh, C.; Abramsson-Zetterberg, L.; Törnqvist, M. Serum albumin adducts, DNA adducts and micronuclei frequency measured in benzo[a]pyrene-exposed mice for estimation of genotoxic potency. Mutat. Res. Toxicol. Environ. Mutagen. 2020, 849, 503127. [Google Scholar] [CrossRef] [PubMed]
- Hemeryck, L.Y.; Decloedt, A.I.; Vanden Bussche, J.; Geboes, K.P.; Vanhaecke, L. High resolution mass spectrometry based profiling of diet-related deoxyribonucleic acid adducts. Anal. Chimi. Acta 2015, 892, 123–131. [Google Scholar] [CrossRef]
- Balbo, S.; Hecht, S.S.; Upadhyaya, P.; Villalta, P.W. Application of a High-Resolution Mass-Spectrometry-Based DNA Adductomics Approach for Identification of DNA Adducts in Complex Mixtures. Anal. Chem. 2014, 86, 1744–1752. [Google Scholar] [CrossRef]
- Gorokhova, E.; Martella, G.; Motwani, N.H.; Tretyakova, N.Y.; Sundelin, B.; Motwani, H.V. DNA epigenetic marks are linked to embryo aberrations in amphipods. Sci. Rep. 2020, 10, 655. [Google Scholar] [CrossRef] [Green Version]
- Wang, R.; Yin, Y.; Zhu, Z.-J. Advancing untargeted metabolomics using data-independent acquisition mass spectrometry technology. Anal. Bioanal. Chem. 2019, 411, 4349–4357. [Google Scholar] [CrossRef]
- Venable, J.D.; Dong, M.-Q.; Wohlschlegel, J.; Dillin, A.; Yates, J.R. Automated approach for quantitative analysis of complex peptide mixtures from tandem mass spectra. Nat. Methods 2004, 1, 39–45. [Google Scholar] [CrossRef] [PubMed]
- Geromanos, S.J.; Vissers, J.P.C.; Silva, J.C.; Dorschel, C.A.; Li, G.-Z.; Gorenstein, M.V.; Bateman, R.H.; Langridge, J.I. The detection, correlation, and comparison of peptide precursor and product ions from data independent LC-MS with data dependant LC-MS/MS. PROTEOMICS 2009, 9, 1683–1695. [Google Scholar] [CrossRef] [PubMed]
- Walmsley, S.J.; Guo, J.; Wang, J.; Villalta, P.W.; Turesky, R.J. Methods and challenges for computational data analysis for dna adductomics. Chem. Res. Toxicol. 2019, 32, 2156–2168. [Google Scholar] [CrossRef] [PubMed]
- Guo, J.; Villalta, P.W.; Turesky, R.J. Data-independent mass spectrometry approach for screening and identification of DNA adducts. Anal. Chem. 2017, 89, 11728–11736. [Google Scholar] [CrossRef]
- Bilbao, A.; Varesio, E.; Luban, J.; Strambio-De-Castillia, C.; Hopfgartner, G.; Müller, M.; Lisacek, F. Processing strategies and software solutions for data-independent acquisition in mass spectrometry. PROTEOMICS 2015, 15, 964–980. [Google Scholar] [CrossRef]
- Backer, H.; Leppänen, J.-M.; Brusendorff, A.C.; Forsius, K.; Stankiewicz, M.; Mehtonen, J.; Pyhälä, M.; Laamanen, M.; Paulomäki, H.; Vlasov, N.; et al. HELCOM Baltic Sea Action Plan—A regional programme of measures for the marine environment based on the Ecosystem Approach. Mar. Pollut. Bull. 2010, 60, 642–649. [Google Scholar] [CrossRef]
- Förstner, U. Sediment-associated contaminants—An overview of scientific bases for developing remedial options. Hydrobiologia 1987, 149, 221–246. [Google Scholar] [CrossRef]
- Stolt, R.; Torgrip, R.J.O.; Lindberg, J.; Csenki, L.; Kolmert, J.; Schuppe-Koistinen, I.; Jacobsson, S.P. Second-Order Peak Detection for Multicomponent High-Resolution LC/MS Data. Anal. Chem. 2006, 78, 975–983. [Google Scholar] [CrossRef] [PubMed]
- Olivon, F.; Grelier, G.; Roussi, F.; Litaudon, M.; Touboul, D. MZmine 2 Data-Preprocessing to Enhance Molecular Networking Reliability. Anal. Chem. 2017, 89, 7836–7840. [Google Scholar] [CrossRef] [PubMed]
- Pfeuffer, J.; Sachsenberg, T.; Alka, O.; Walzer, M.; Fillbrunn, A.; Nilse, L.; Schilling, O.; Reinert, K.; Kohlbacher, O. OpenMS—A platform for reproducible analysis of mass spectrometry data. J. Biotechnol. 2017, 261, 142–148. [Google Scholar] [CrossRef] [PubMed]
- Smith, C.A.; Want, E.J.; O’Maille, G.; Abagyan, R.; Siuzdak, G. XCMS: Processing Mass Spectrometry Data for Metabolite Profiling Using Nonlinear Peak Alignment, Matching, and Identification. Anal. Chem. 2006, 78, 779–787. [Google Scholar] [CrossRef] [PubMed]
- Benton, H.P.; Wong, D.M.; Trauger, S.A.; Siuzdak, G. XCMS2: Processing Tandem Mass Spectrometry Data for Metabolite Identification and Structural Characterization. Anal. Chem. 2008, 80, 6382–6389. [Google Scholar] [CrossRef] [PubMed] [Green Version]
- Tengstrand, E.; Lindberg, J.; Åberg, K.M. TracMass 2—A Modular Suite of Tools for Processing Chromatography-Full Scan Mass Spectrometry Data. Anal. Chem. 2014, 86, 3435–3442. [Google Scholar] [CrossRef]
- Åberg, K.M.; Torgrip, R.J.O.; Kolmert, J.; Schuppe-Koistinen, I.; Lindberg, J. Feature detection and alignment of hyphenated chromatographic–mass spectrometric data: Extraction of pure ion chromatograms using Kalman tracking. J. Chromatogr. A 2008, 1192, 139–146. [Google Scholar] [CrossRef] [PubMed]
- Danielsson, R.; Bylund, D.; Markides, K.E. Matched filtering with background suppression for improved quality of base peak chromatograms and mass spectra in liquid chromatography–mass spectrometry. Anal. Chim. Acta 2002, 454, 167–184. [Google Scholar] [CrossRef]
- MATLAB Version 9.8.0; Mathworks Inc.: Natick, MA, USA, 2020.
- Sampson, D. GUI Layout Toolbox. Available online: https://www.mathworks.com/matlabcentral/fileexchange/47982-gui-layout-toolbox (accessed on 28 June 2020).
- Chambers, M.C.; Maclean, B.; Burke, R.; Amodei, D.; Ruderman, D.L.; Neumann, S.; Gatto, L.; Fischer, B.; Pratt, B.; Egertson, J.; et al. A cross-platform toolkit for mass spectrometry and proteomics. Nat. Biotechnol. 2012, 30, 918–920. [Google Scholar] [CrossRef] [PubMed]
- Sourceforge. Proteowizard Version 3. Available online: http://proteowizard.sourceforge.net (accessed on 28 June 2020).
- Lehtonen, K.K.; Sundelin, B.; Lang, T.; Strand, J. Development of Tools for Integrated Monitoring and Assessment of Hazardous Substances and Their Biological Effects in the Baltic Sea. AMBIO 2014, 43, 69–81. [Google Scholar] [CrossRef] [PubMed] [Green Version]


| Experiment a | Number of Precursor DIA Windows | Window Width (m/z) | Precursor Range (m/z) | Total Putative Adducts Found b | Peak Quality | ||
|---|---|---|---|---|---|---|---|
| CT5 | 31 | 5 | 197.5 | - | 352.5 | 68 | Good |
| CT10 | 16 | 10 | 195 | - | 355 | 115 | Good |
| CT20 | 9 | 20 | 190 | - | 370 | 162 | Good |
| CT50 | 4 | 50 | 175 | - | 375 | 64 | Slight noisy |
| CT100 | 3 | 100 | 150 | - | 450 | 55 | Moderate noisy |
| CT350 | 1 | 350 | 175 | - | 525 | 14 | Very noisy |
Publisher’s Note: MDPI stays neutral with regard to jurisdictional claims in published maps and institutional affiliations. |
© 2021 by the authors. Licensee MDPI, Basel, Switzerland. This article is an open access article distributed under the terms and conditions of the Creative Commons Attribution (CC BY) license (https://creativecommons.org/licenses/by/4.0/).
Share and Cite
Sousa, P.F.M.; Martella, G.; Åberg, K.M.; Esfahani, B.; Motwani, H.V. nLossFinder—A Graphical User Interface Program for the Nontargeted Detection of DNA Adducts. Toxics 2021, 9, 78. https://doi.org/10.3390/toxics9040078
Sousa PFM, Martella G, Åberg KM, Esfahani B, Motwani HV. nLossFinder—A Graphical User Interface Program for the Nontargeted Detection of DNA Adducts. Toxics. 2021; 9(4):78. https://doi.org/10.3390/toxics9040078
Chicago/Turabian StyleSousa, Pedro F. M., Giulia Martella, K. Magnus Åberg, Bahare Esfahani, and Hitesh V. Motwani. 2021. "nLossFinder—A Graphical User Interface Program for the Nontargeted Detection of DNA Adducts" Toxics 9, no. 4: 78. https://doi.org/10.3390/toxics9040078
APA StyleSousa, P. F. M., Martella, G., Åberg, K. M., Esfahani, B., & Motwani, H. V. (2021). nLossFinder—A Graphical User Interface Program for the Nontargeted Detection of DNA Adducts. Toxics, 9(4), 78. https://doi.org/10.3390/toxics9040078