Article

Building a Code-Based Model to Describe Syngas Production from Biomass

by
Simon Brinkmann
* and
Bernhard C. Seyfang
Life Sciences and Engineering, Bingen University of Applied Sciences, Berlinstraße 109, 55441 Bingen am Rhein, Germany
*
Author to whom correspondence should be addressed.
ChemEngineering 2024, 8(5), 94; https://doi.org/10.3390/chemengineering8050094
Submission received: 11 July 2024 / Revised: 3 September 2024 / Accepted: 5 September 2024 / Published: 12 September 2024
(This article belongs to the Special Issue Process Intensification for Chemical Engineering and Processing)

Abstract

:
Due to growing interest in providing and storing sufficient renewable energies, energy generation from biomass is becoming increasingly important. Biomass gasification represents the process of converting biomass into hydrogen-rich syngas. A one-dimensional kinetic reactor model was developed to simulate biomass gasification processes as an alternative to cost-intensive experiments. The presented model stands out as it contains the additional value of universal use with different biomass types and a more comprehensive application due to its integration into the DWSIM process simulator. The model consists of mass and energy balances based on the kinetics of selected reactions. Two different reactor schemes are simulated: (1) a fixed bed reactor and (2) a fluidized bed reactor. The operating mode can be set as isothermal or non-isothermal. The model was programmed using Python and integrated into DWSIM. Depending on incoming mass flows (biomass, oxygen, steam), biomass type, reactor type, reactor dimensions, temperature, and pressure, the model predicts the mass flows of char, tar, hydrogen, carbon monoxide, carbon dioxide, methane, and water. Comparison with experimental data from the literature validates the results gained from our model.

1. Introduction

Using biomass as an energy source is essential for the global energy mix. At 10.7%, gaining energy from biomass is the world’s fourth largest energy source behind petroleum, coal, and natural gas [1]. For energy use, biomass must be processed. Biomass is initially available in farm products like grain or wheat, in lignocellulosic material like straw or wood, or in animal products ranging from small insects to large animal remains. Biomass is converted into usable energy sources by biochemical or thermochemical processes. Biochemical processes include digestion or fermentation. Bacteria or enzymes decompose the biomass into gases. Gasification and liquefaction of biomass are thermochemical processes. Under high temperatures, oxidation and reduction reactions produce a gas consisting mainly of hydrogen, carbon monoxide, carbon dioxide, and methane. The product gas is used for energy or material purposes. Energy use includes combustion of product gas or use in fuel cells. For material use, the gas is used for ammonia, methanol, or biofuel production [2]. This work focuses on thermochemical biomass gasification. Fixed bed reactors, fluidized bed reactors, and entrained flow reactors are used for this process. The state of the art is the use of fluidized bed reactors due to their excellent mixing properties and high heat and mass transfer. The reactor design and determination of the product gas composition are performed using experimental tests or theoretical models. As experiments are expensive and time-consuming, theoretical models are becoming more critical. Modeling biomass gasification must integrate many parallel and sequential process steps. Homogeneous and heterogeneous reactions co-occur, depending on various influencing factors like temperature, pressure, or biomass composition.
Nevertheless, in theory, the processes are well investigated. Various researchers have reviewed and summarized the current state of modeling biomass gasification [3,4,5]. Numerous theoretical models have been created to describe biomass gasification. These approaches can be divided into computational fluid dynamics (CFD), kinetic, and black-box models. Only a few CFD models are discussed using fluid dynamics simulations [6,7]. The advantages of CFD models are high accuracies and two- or three-dimensional views of the reactor. This means that temperature, pressure, and material composition can be calculated at every point in the reactor. Disadvantages are high computing times and low applicability, as integration in process simulators such as Aspen Plus is impossible. Black-box models describe incoming and outgoing mass flows while neglecting process steps inside the reactor [8,9]. Calculations of outgoing mass flows are often performed by equilibrium or empirical approaches. Since no reaction rates and reactor specifications are considered, equilibrium models are less accurate. Nevertheless, black-box models are popular because of their simple structure, short computing times, and easy integration into process simulators. Gibbs reactors are frequently used in process simulators. In addition to CFD and black box models, kinetic models are widely used [10,11]. Mass and energy balances are considered using theoretical approaches, such as Kunii et al.’s bubble emulsion approach [12]. The concentration profiles in the reactor are calculated considering kinetics and reaction rates. Advantages include good integration into process simulators and high accuracies achieved by considering reaction rates and reactor specifications.
Current publications aim to create a universal model that predicts valid statements about syngas compositions. Models are often presented in process simulators like Aspen Plus. Tepper [13] created a kinetic model for a fluidized bed reactor in his dissertation, which includes twelve reactions. The fluidization effects are based on the bubble emulsion model. He validated his model with his experimental results. The incoming biomass was defined as C6H9O4 and is not universally selectable. The programming was not integrated into a process simulator. Puig-Gamero et al. [10] created a model in Aspen Plus. The process was divided into drying, pyrolysis, oxidation, and gasification. Pyrolysis was simulated with a yield reactor and coupled with Excel calculations. A plug flow reactor was chosen for oxidation and gasification reactions. The kinetic model comprises fourteen reactions. No fluidized bed reactor was considered. González-Vázquez et al. [14] developed an equilibrium model in Aspen Plus that predicts the syngas composition of different biomass types with eight reactions. Overall, two models were created. The first non-stoichiometric model simulates pyrolysis in a yield reactor. A Gibbs reactor is chosen to model further oxidation and gasification reactions. The second stoichiometric model contains a yield reactor for pyrolysis, a stoichiometric reactor for oxidation, and an equilibrium reactor for gasification. Both models were validated with experimental results of a fluidized bed reactor. However, no fluidized bed effects were considered in the Aspen Plus model itself. Zhu et al. [15] also created an equilibrium model in Aspen Plus. Pyrolysis is represented in a yield reactor. Oxidation and gasification reactions are simulated in a continuous stirred tank reactor. The model can be used for different types of biomasses. Tavares et al. [16] modeled the gasification of Portuguese forest residues with their equilibrium model. Aspen Plus was selected to simulate the process. Pyrolysis was modeled with a yield reactor. All other reactions were simulated in a Gibbs reactor. Abdul Azeez et al. [17] developed three models that consider the equilibrium approach and the kinetics approach. Pyrolysis is represented in all three models with a yield reactor. In model 1, gasification is viewed as an equilibrium reaction in a Gibbs reactor. In models 2 and 3, the kinetics approach with six reactions is selected. Model 2 includes a continuously stirred tank, and model 3 is a fluidized bed reactor.
A summary of these publications shows that many models were created in combination with process simulators. Nevertheless, most models are based on less accurate equilibrium approaches. Kinetic models considering fluidized bed reactors, which are most used in practice, are rarely integrated into process simulators. To close this research gap, this work combines all the previous publications’ advantages to obtain a universal and valid reactor model. This model should fulfill the following requirements:
  • Includes the creation of a kinetic gasification model.
  • Universally applicable for all biomass types.
  • Contains all important reactor types (fixed bed and fluidized bed reactor).
  • Includes essential process parameters and substance mass flows.
  • Contains enough reactions with reaction rates derived from scientific studies.
  • Allows integration into the DWSIM process simulator.
  • Validation with experimental data from the literature is feasible.
DWSIM is a cape-open flow diagram simulator that can simulate chemical processes. It is an alternative to Aspen Plus or CHEMCAD. The integration of programmed Python scripts into the simulator is an advantage.

2. Modeling Method

The gasification model is based on eleven reactions that are shown in Table 1. The reactions can be divided into the pyrolysis of biomass (R1), oxidation reactions (R2–R6), and gasification reactions (R7–R11).
Considered products of the gasification process are char, tar, carbon monoxide, carbon dioxide, hydrogen, methane, and water. The following assumptions are made to model biomass gasification:
  • All gaseous components have ideal behavior.
  • Char consists entirely of carbon.
  • Tar is a mixture of condensable organics. It is represented by ethyne (C2H2).
  • The pressure is uniform in the reactor. No pressure losses take place.
  • Particle abrasion, agglomeration, and fragmentation are neglected.
  • The reactor is considered ideal. Dispersion effects are neglected.
Ethyne is used as a representative of tar because it is a tar component and has a balanced hydrocarbon ratio. The discussion assesses the effects of referring to only one representative component and neglecting oxygen in tar.
Data from scientific experiments are analyzed for each reaction to determine the reaction kinetics. Arrhenius describes the temperature dependence:
k ( T ) = A 0 · e E A R T
Criteria for selecting the appropriate kinetics are the experimental conditions; process conditions such as the temperature range, pressure range, and oxygen supply; and the differentiation between micro- and macro-kinetics. The chosen kinetics for the gasification model are summarized in Table 2.
Pyrolysis (R1) involves the decomposition of biomass into its product components. Two kinetic approaches are combined: (1) Neves et al. [19] use a semi-empirical approach to describe the kinetics. They define a system of balance equations and empirical equations to represent the decomposition of biomass to char, tar, carbon monoxide, carbon dioxide, methane, hydrogen, and water. The incoming biomass stream is specified by the mass fraction of carbon ( w C , b i o ), hydrogen ( w H , b i o ), and oxygen ( w O , b i o ).
w C , t a r w C , C H 4 w C , C O w C ; C O 2 0 0 w O , t a r 0 w O , C O w O , C O 2 w O , H 2 O 0 w H , t a r w H , C H 4 0 0 w H , H 2 O w H , H 2 0 0 1 0 0 1 0 1 0.146 0 0 0 0 0 0 0 0 1 · w t a r w C H 4 w C O w C O 2 w H 2 O w H 2 = w C , b i o w C , c h a r · w c h a r w O , b i o w O , c h a r · w c h a r w H , b i o w H , c h a r · w c h a r 0 2.18 · 10 4 2
The first three equations are carbon, oxygen, and hydrogen mass balances. The other equations are empirically determined approaches. The equations are solved using 1 = w H 2 / w C O and 2 = 1.145 · 1 e x p ( 0.11 · 10 2 · T ) 9.384 . Thus, mass fractions of char ( w c h a r ), tar ( w t a r ), hydrogen ( w H 2 ), carbon monoxide ( w C O ), carbon dioxide ( w C O 2 ), methane ( w C H 4 ), and water ( w H 2 O ) are determined. The time dependence of the kinetic expression is essential to describe the concentration curve in the reactor. Since the approach of Neves et al. [19] specifies the mass fractions independent of the decomposition time, the pyrolysis reaction R1 is coupled with another approach. (2) Wagenaar et al. [20] describe the decomposition of biomass depending on the time, as seen in Table 2. As a result, the two coupled approaches describe the biomass distribution into its components as a function of time.
Oxidation reactions (R2–R6) describe char, tar, and gas combustion. Tar and gas reactions (R3–R6) are homogeneous gas–gas reactions. The oxidation of char (R2) is a heterogeneous solid–gas reaction. The reaction is assumed to be first order, and the effective reaction constant considers the micro-kinetics, the internal mass transfer through the particle pore, and the external mass transfer through the gas film surrounding the particle:
k c h a r , e f f = 1 1 β A · a v + 1 η p o r e · k c h a r
Internal and external mass transport values are calculated using the Sherwood number, Thiele module, and diffusion coefficients. The char reaction causes the particle diameter to decrease over time to represent shrinking. A particle model considers this effect. The shrinking unreacted particle model (SUPM) is chosen for the gasification model. The diameter shrinks in relation to the turnover:
d p = d p . 0 · 1 X C h a r 1 3
The ash formed does not stick to the particle but separates directly. Besides the SUPM, more particle models are available. Gómez-Barea and Leckner [3] summarized different particle models in their review article.
Gasification reactions (R7–R11) are fundamental for hydrogen production. The Boudouard reaction (R7) and steam gasification (R8) are heterogeneous solid–gas reactions. The SUPM again considers the influence of char particle size. As these are higher-order reactions, the effective reaction constant is calculated using an internal and external efficiency factor:
k c h a r , e f f = k c h a r · η p = k c h a r · η e · η i
The efficiency factors are calculated using internal and external Damkoehler numbers. Gómez-Barea and Leckner [3] describe a procedure to determine these numbers.
Mass and energy balances are based on two different reactor types. The fixed bed reactor is shown in Figure 1a and the fluidized bed reactor is shown in Figure 1b.
The reaction rate and the flow rate of the gas determine the difference in concentration of the individual components d C i . The mass balance is calculated iteratively using concentration gradients of each component i :
d C i d h = r m o l , i · A r e a c t o r V ˙ g a s
The energy balance consists of reaction heat, heat transfer between particle bed and gas, and heat transfer between reactor wall and gas inside:
0 = ρ g · c p , g · u 0 · d T d h + k g s · d A d V · T T s + k w · d A d V · T T w H R · r m o l , i
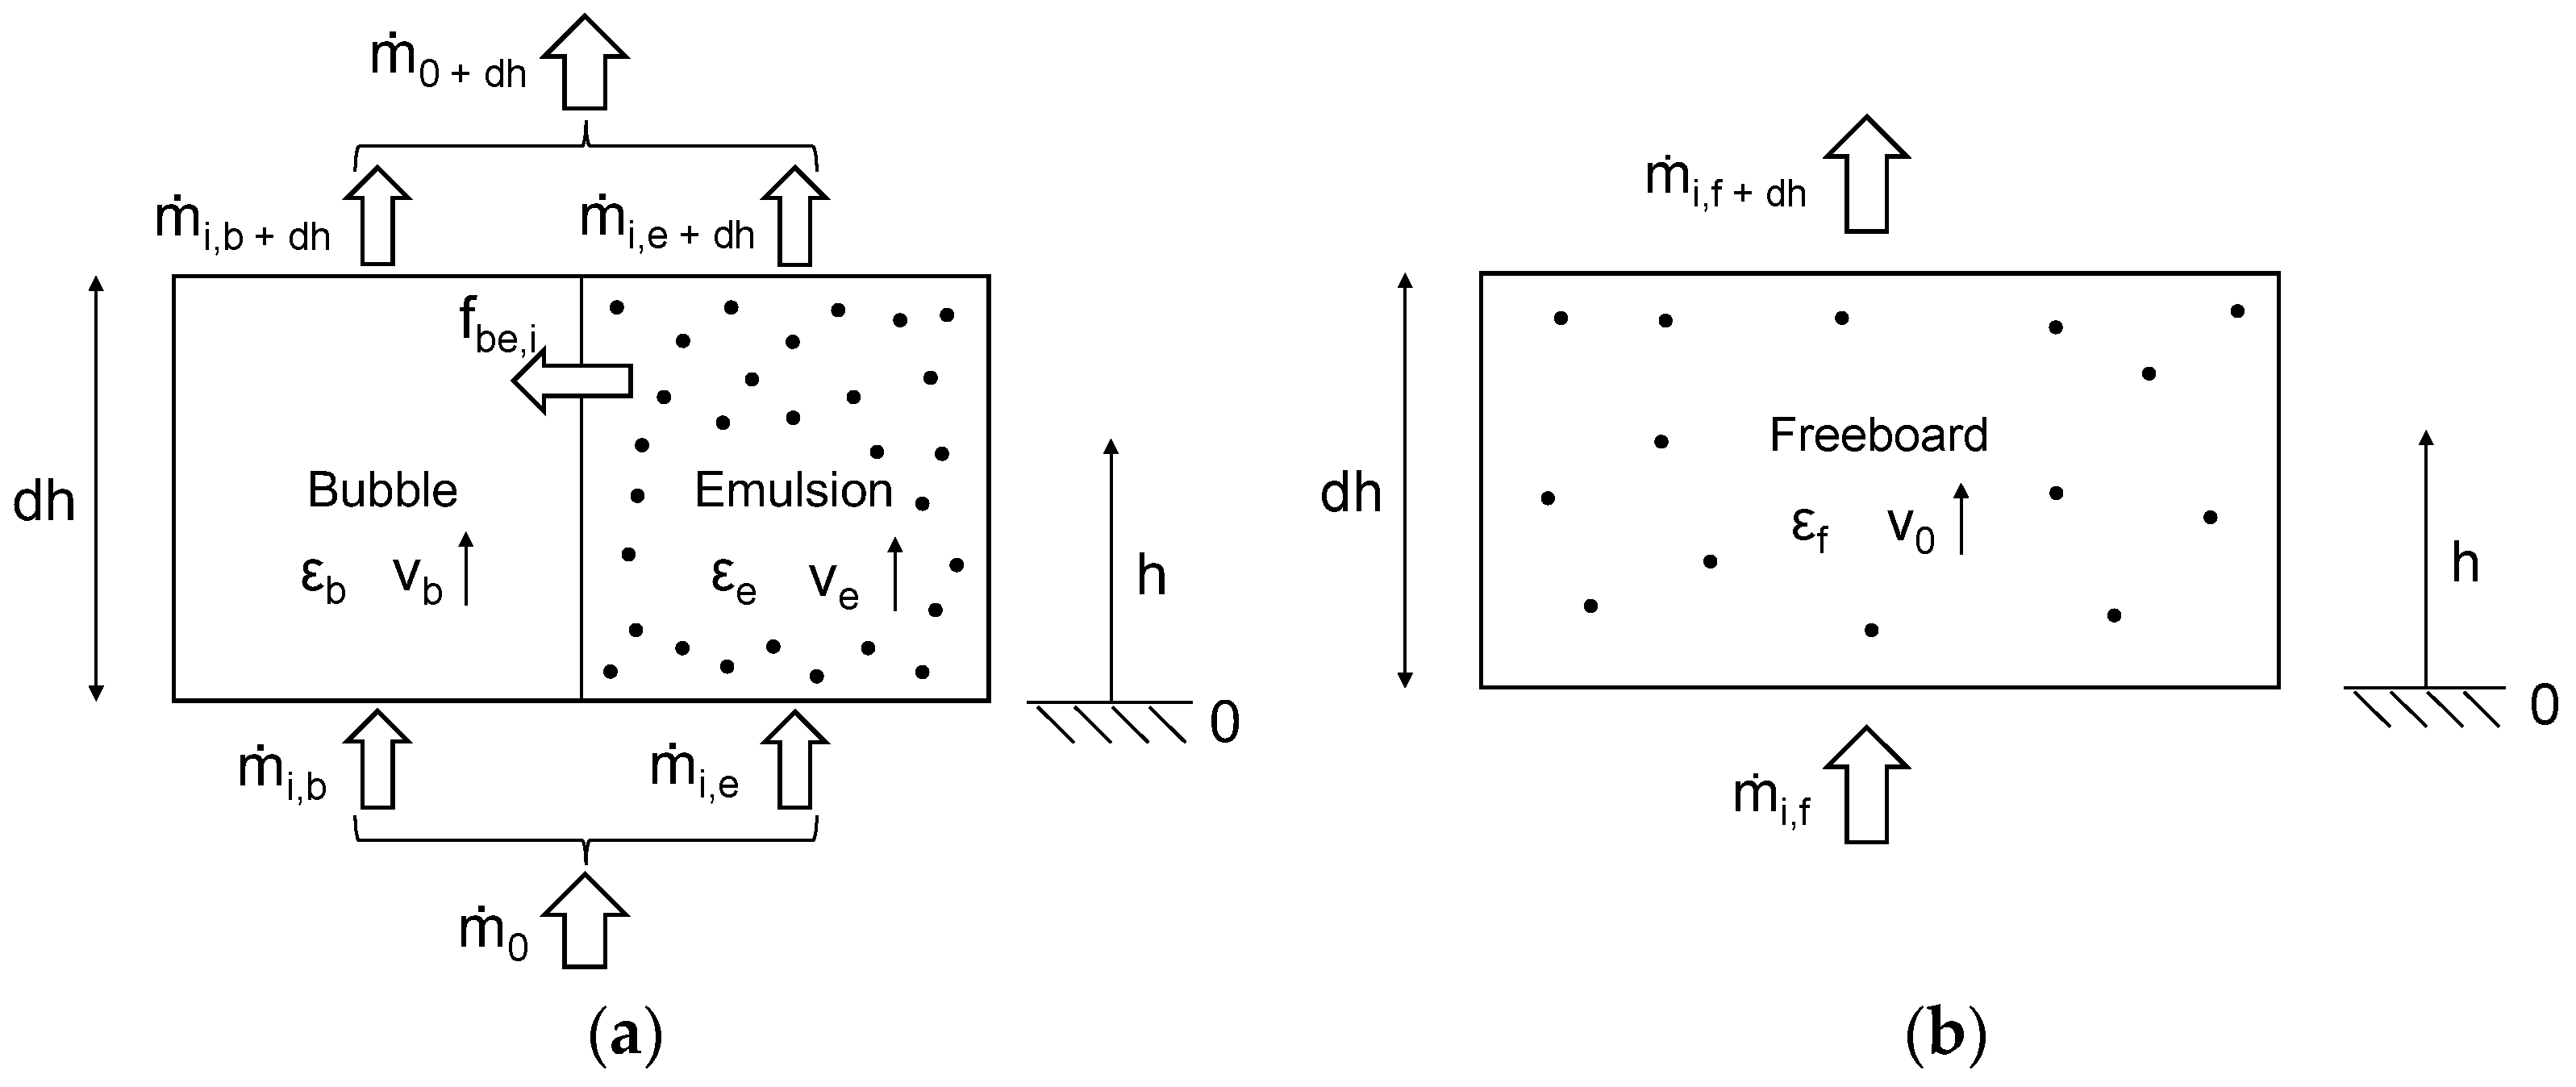
The balances for the fluidized bed reactor (see Figure 1b) are solved using the bubble emulsion model. The fluidized bed reactor is divided into the fluidized bed and the freeboard (see Figure 2).
The fluidized bed section (see Figure 2a) contains bubble and emulsion phases. The incoming mass flow m ˙ 0 splits into the mass flow for bubble phase m ˙ i , b and the mass flow for emulsion phase m ˙ i , e . The bubble phase consists only of gas and does not contain solids. The emulsion phase contains gases and solids. Solids are particles that are shown as black dots in Figure 1b and Figure 2. The mass flow difference in the bubble phase for component i (see (8)) depends on the reaction rate of homogeneous gas reactions r m , g g , i b and the exchange mass flow between bubble and emulsion f b e , i , which occurs due to the concentration difference between the bubble and emulsion phases. Similarly, the mass flow difference of the emulsion for component i is shown in (9). In addition to the reaction rate of homogeneous reactions r m , g g , i e and the exchange mass flow f b e , i , the reaction rate of heterogeneous gas–solid reactions r m , g s , i e is also included [3].
1 A r e a c t o r d m ˙ i , b d h = ε b · r m , g g , i b + f b e , i
1 A r e a c t o r d m ˙ i , e d h = ε e 1 ε b r m , g g , i e + 1 ε e 1 ε b · r m , g s , i e f b e , i
At the end of the fluidized bed, the two mass flows of the bubble and emulsion phases merge again to become a mass flow m ˙ i , f that runs through the freeboard. On the surface of the fluidized bed, solids splash upward into the freeboard. The freeboard section (see Figure 2b) consists of a gas mixture and a few solid particles entrained from the fluidized bed. The mass flow difference in the freeboard considers reaction rates of homogeneous reactions r m , g g , i f and heterogeneous reactions r m , g s , i f [3]:
1 A r e a c t o r d m ˙ i , f d h = ε f · r m , g g , i f + 1 ε f · r m , g s , i f
The fraction of particles in the freeboard 1 ε f is a function of freeboard height. At the fluid bed surface, particles splash upwards and get entrained. Particles fall again or are carried upwards depending on the particle diameter and sinking velocity. From the surface, the char particle fraction decreases until they reach the end of the reactor. The entrainment and particle fraction are calculated using equations from Kunii et al. [12]. The energy balance is calculated analogously to the fixed bed reactor using (7). In summary, this approach considers detailed fluidization and mixing effects. A practical, theoretical model is created by dividing the reactor into different sections and phases.
As a result, the final model can be utilized to simulate two types of reactors: a fixed bed and a fluidized bed reactor. Each reactor can be modeled with two different operating modes. The isothermal operating mode assumes that the temperature in the entire reactor is constant. The advantages of this variant are that the model is very robust and less prone to errors due to temperature negligence. The results are valid despite the simplification. In the non-isothermal operating mode, the temperature changes with the coupled energy balance, dependent on reaction enthalpy and heat transfer between gas, particle bed, and reactor wall. The advantage is the insight into the heat balance. This shows how much heat the oxygen supply generates and what heat is transferred to the reactor bed or the environment. However, this model variant is more error-prone due to the temperature profile.
The model was programmed in Python to be used independent of process simulators. The substance data are calculated in Python. Estimated equations from VDI Heat Atlas [32] are used to calculate the density, viscosity, thermal conductivity, diffusion coefficients, vapor pressure, and enthalpy of vaporization. The gases are assumed to be ideal due to their main applications at atmospheric pressure. No real gas corrections are made.
The Python code was implemented into the open-source process simulation tool “DWSIM” for better operability. In addition to the advantage of simple applications, other processes can be integrated into the process simulator in addition to biomass gasification. Although Python calculates the material data, the Peng–Robinson thermodynamic model is preset in DWSIM. If the gasification model is extended with further process steps, DWSIM uses this equation of state. The Peng–Robinson equation of state is used as we are dealing exclusively with gases in a low-temperature range.
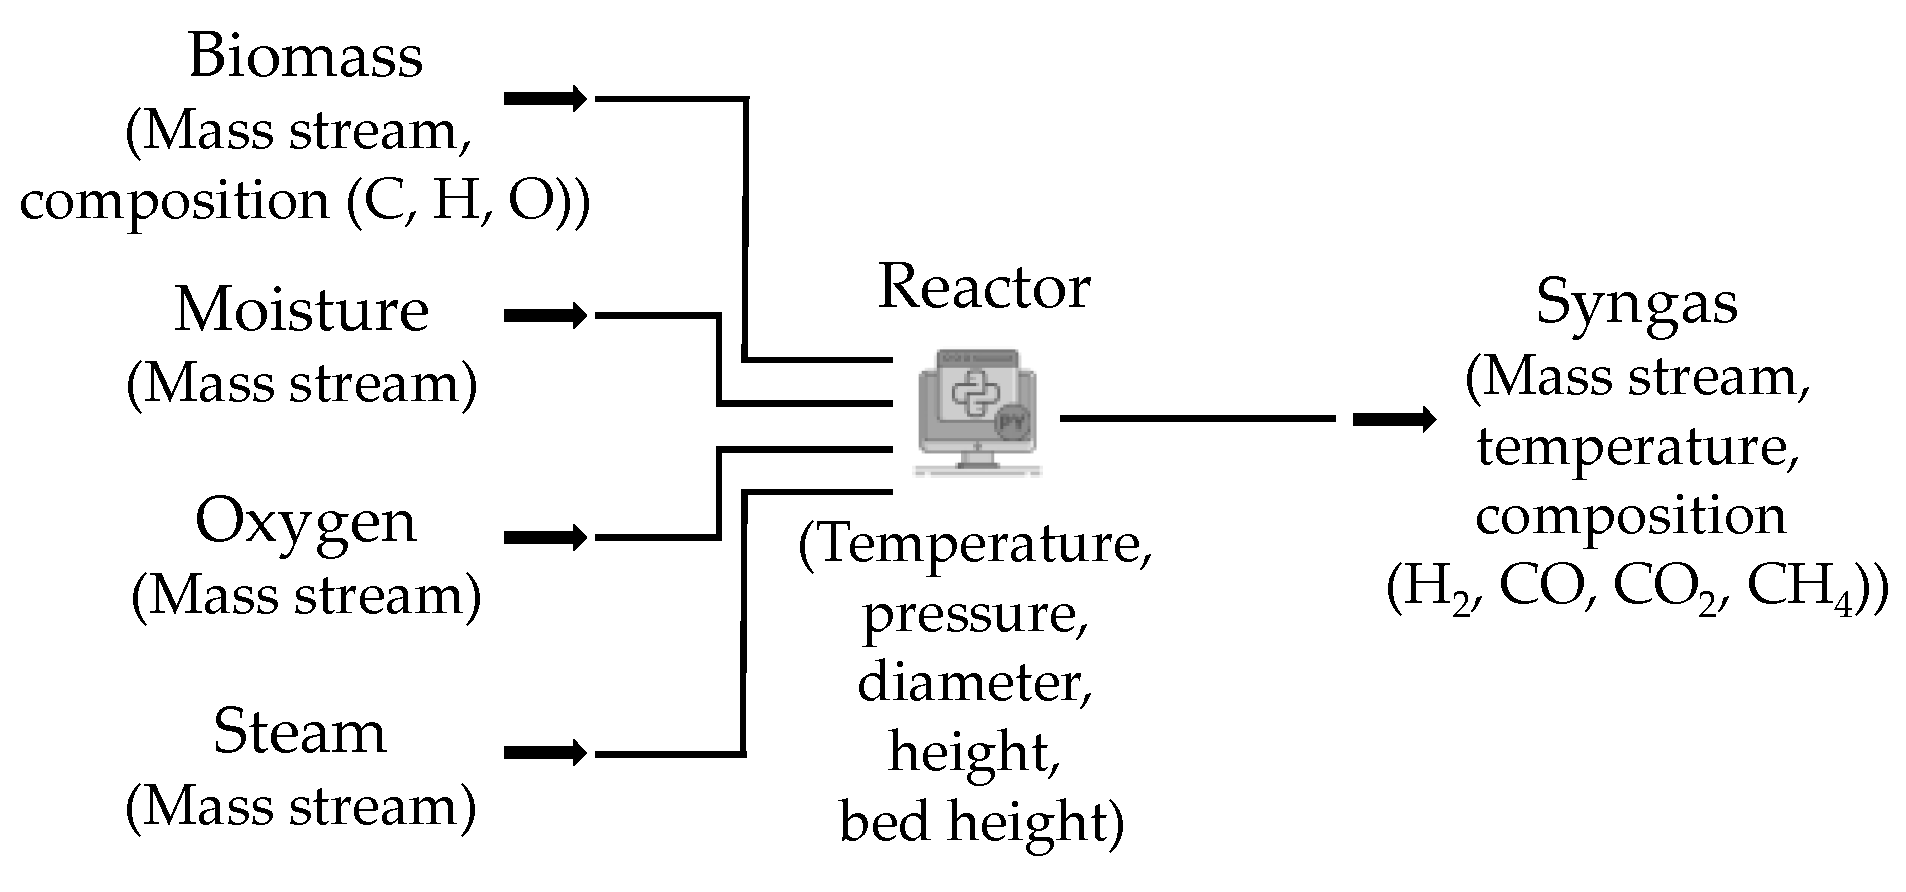
Figure 3 shows the structure of the created gasification model. The DWSIM template is divided into four incoming mass flows; the reactor, where the Python programming is stored; and the outgoing syngas mass flow.
The gasification model considers the following criteria:
  • Mass stream of incoming biomass.
  • Biomass specification into the mass fractions of carbon (C), hydrogen (H), and oxygen (O).
  • Moisture content of incoming biomass.
  • Mass stream of added oxygen.
  • Mass stream of added steam.
  • Process temperature and pressure.
  • Reactor dimensions: diameter, total height, and bed height.
After simulation, output variables are the product mass flow, temperature, and syngas composition consisting of hydrogen, carbon monoxide, carbon dioxide, and methane.

3. Results

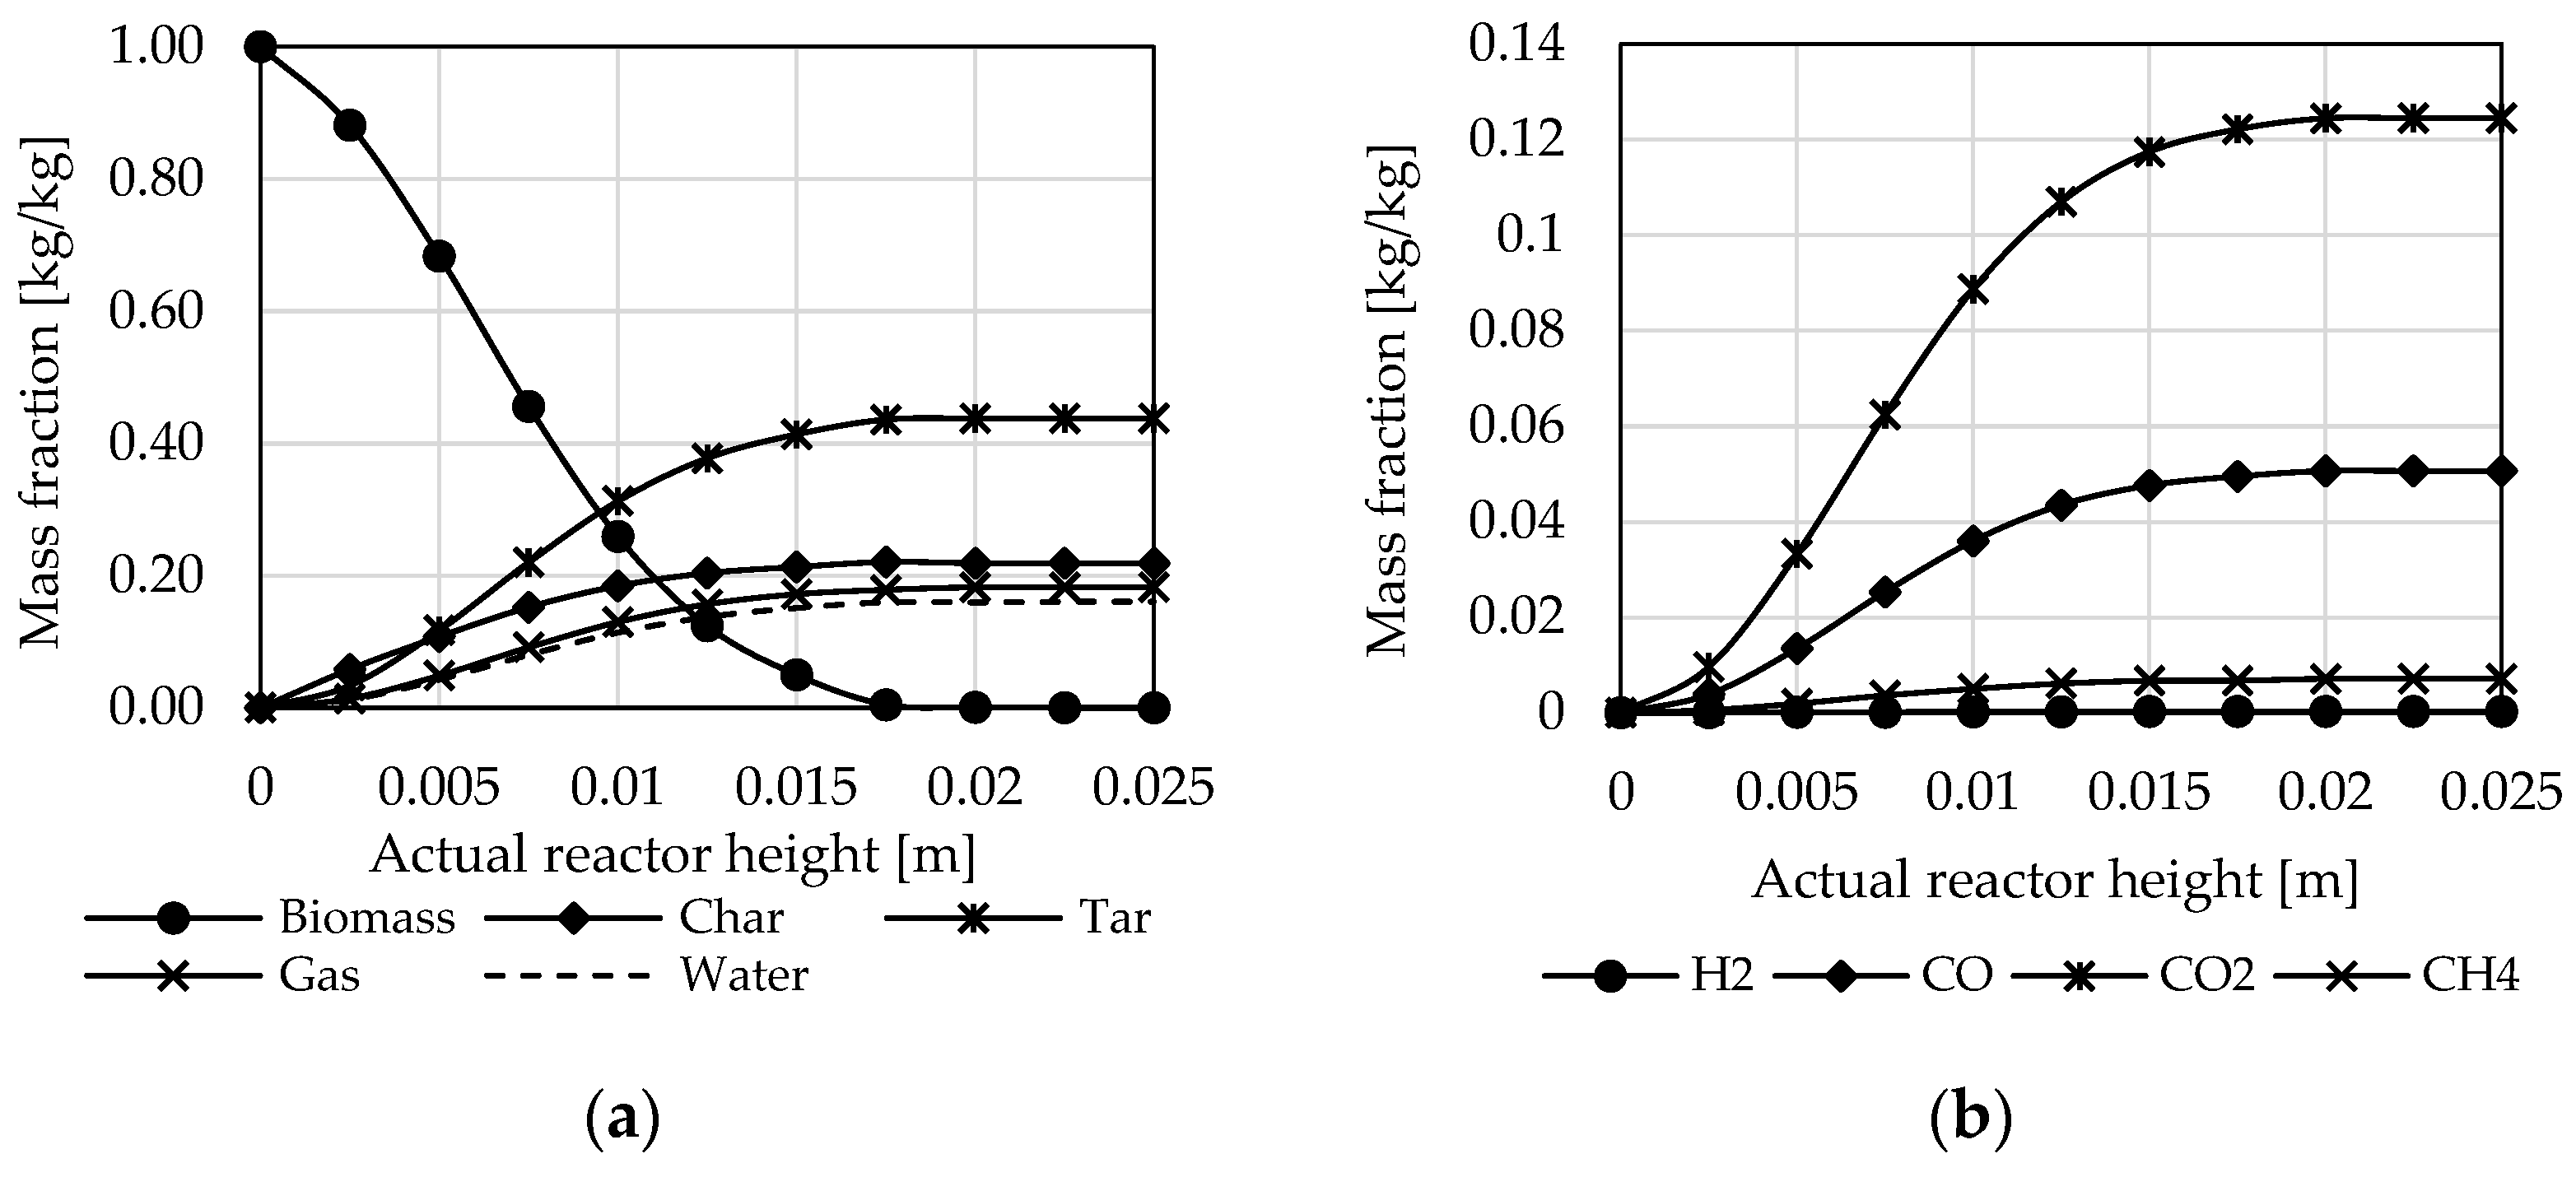
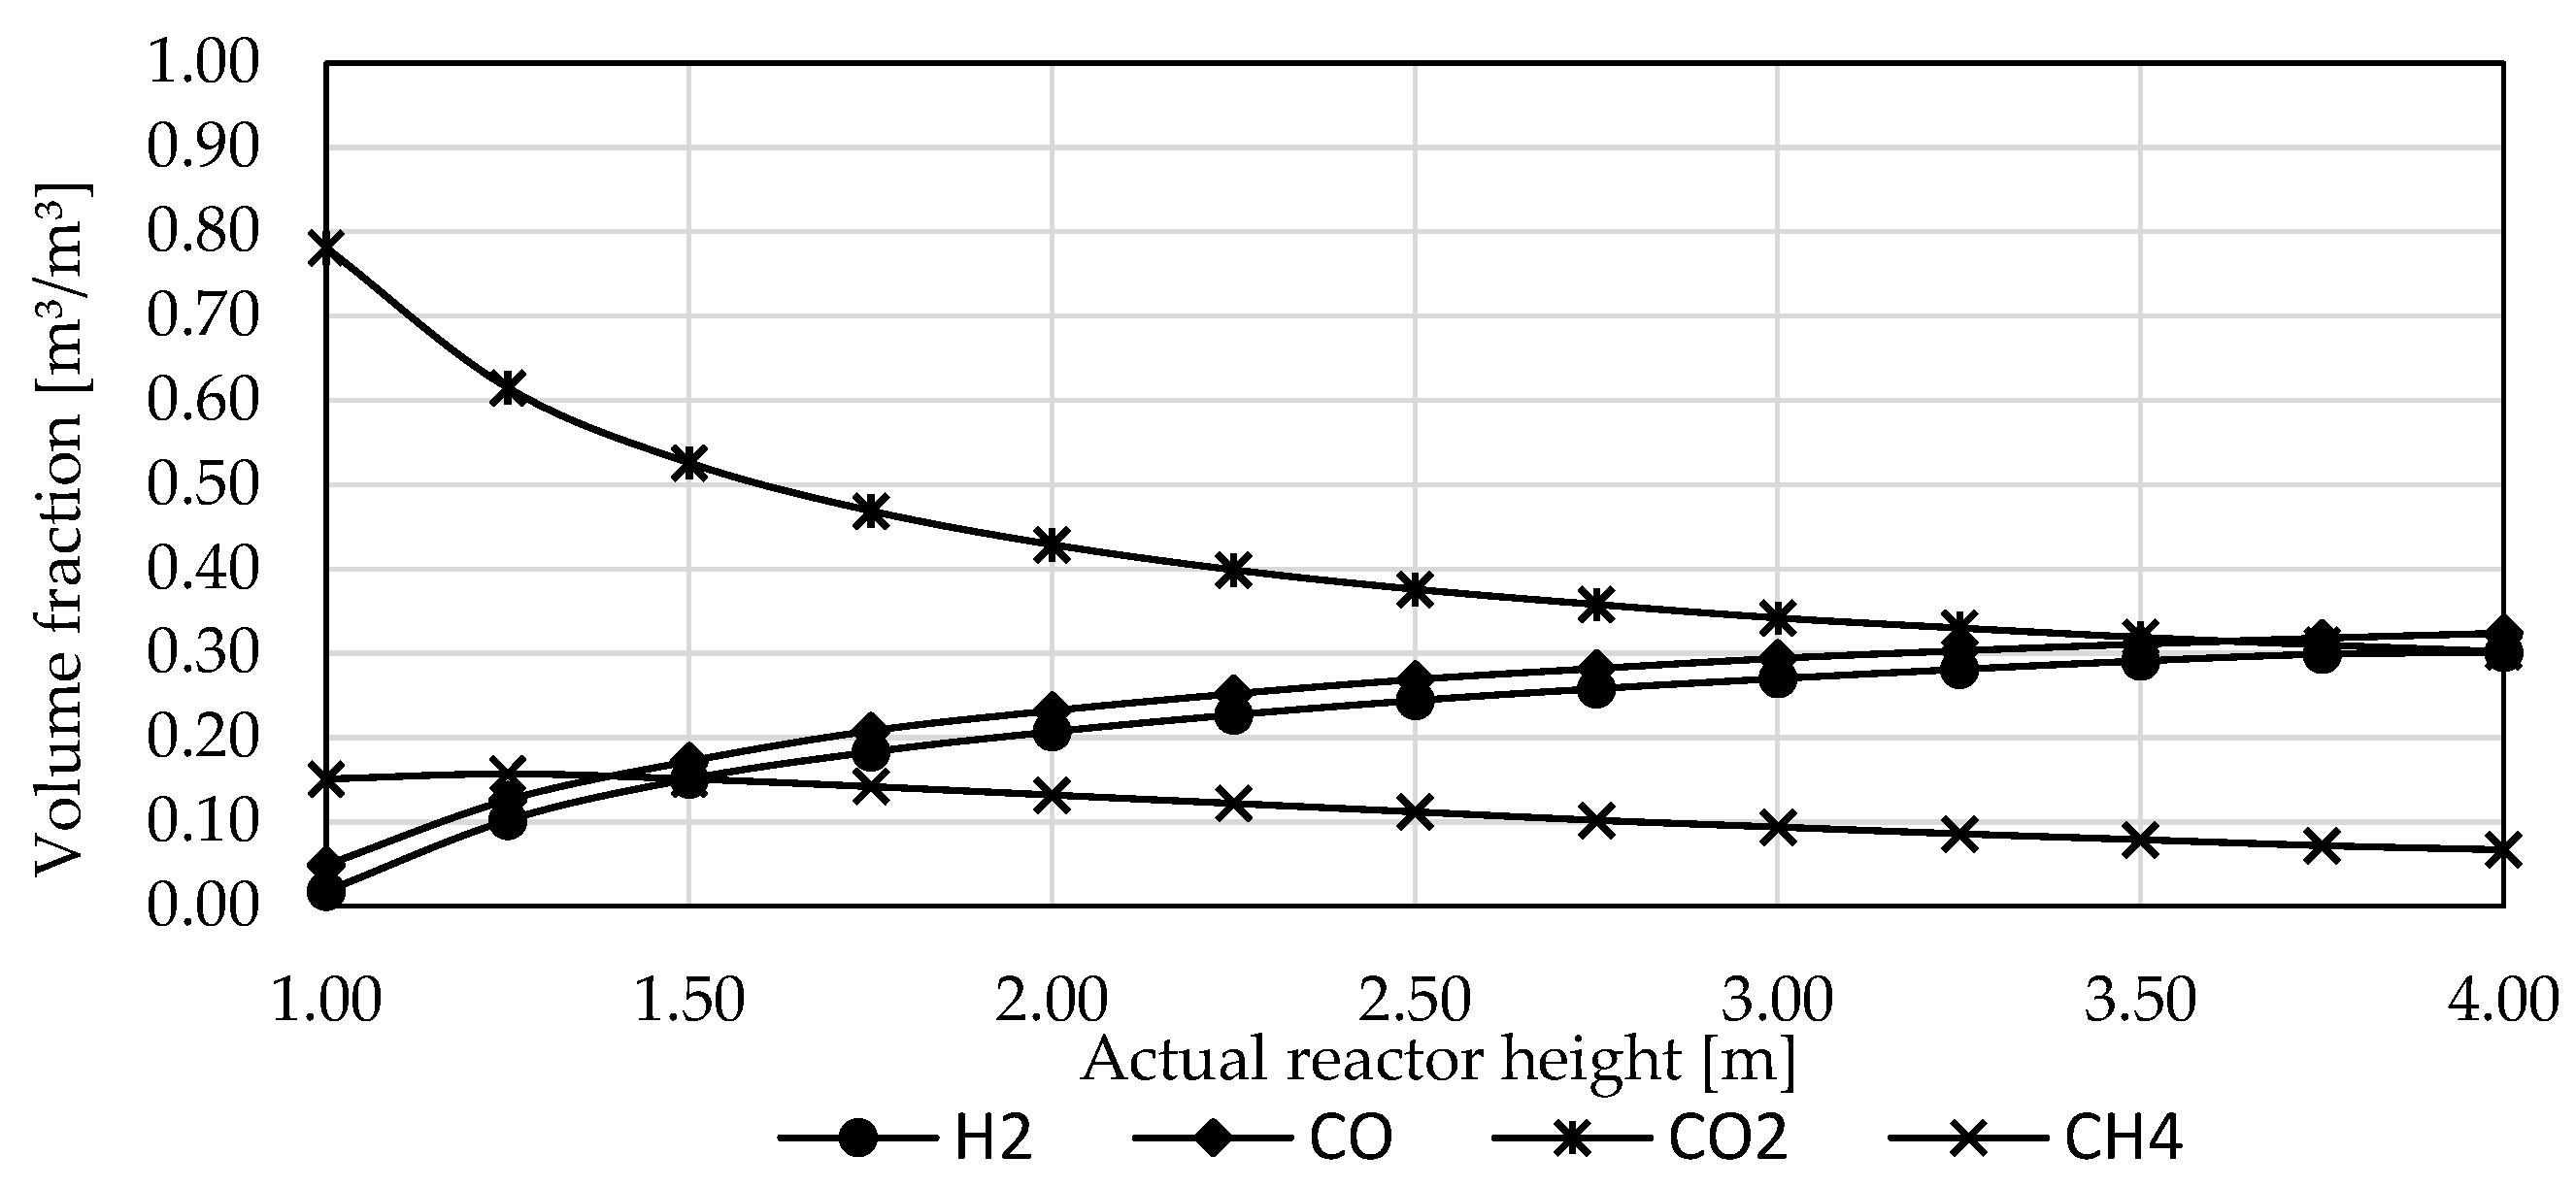
The developed gasification model describes the concentration curves in the reactor and the final syngas composition by changing various input parameters. Figure 4, Figure 5 and Figure 6 show the mass fraction curves of an isothermal fluidized bed reactor with a total reactor height of h = 4   m and a diameter of D = 1.5   m . The starting pyrolysis (R1) is shown in Figure 4.
The main product of biomass decomposition is tar. Char, water, and gas have a similarly high proportion. When looking at the gas composition, carbon dioxide and carbon monoxide are produced mainly. Hydrogen and methane are present in small quantities. After an actual reactor height of h x = 0.025   m , biomass is completely decomposed. Reactions R2–R11 proceed in the fluidized bed, which is shown in Figure 5.
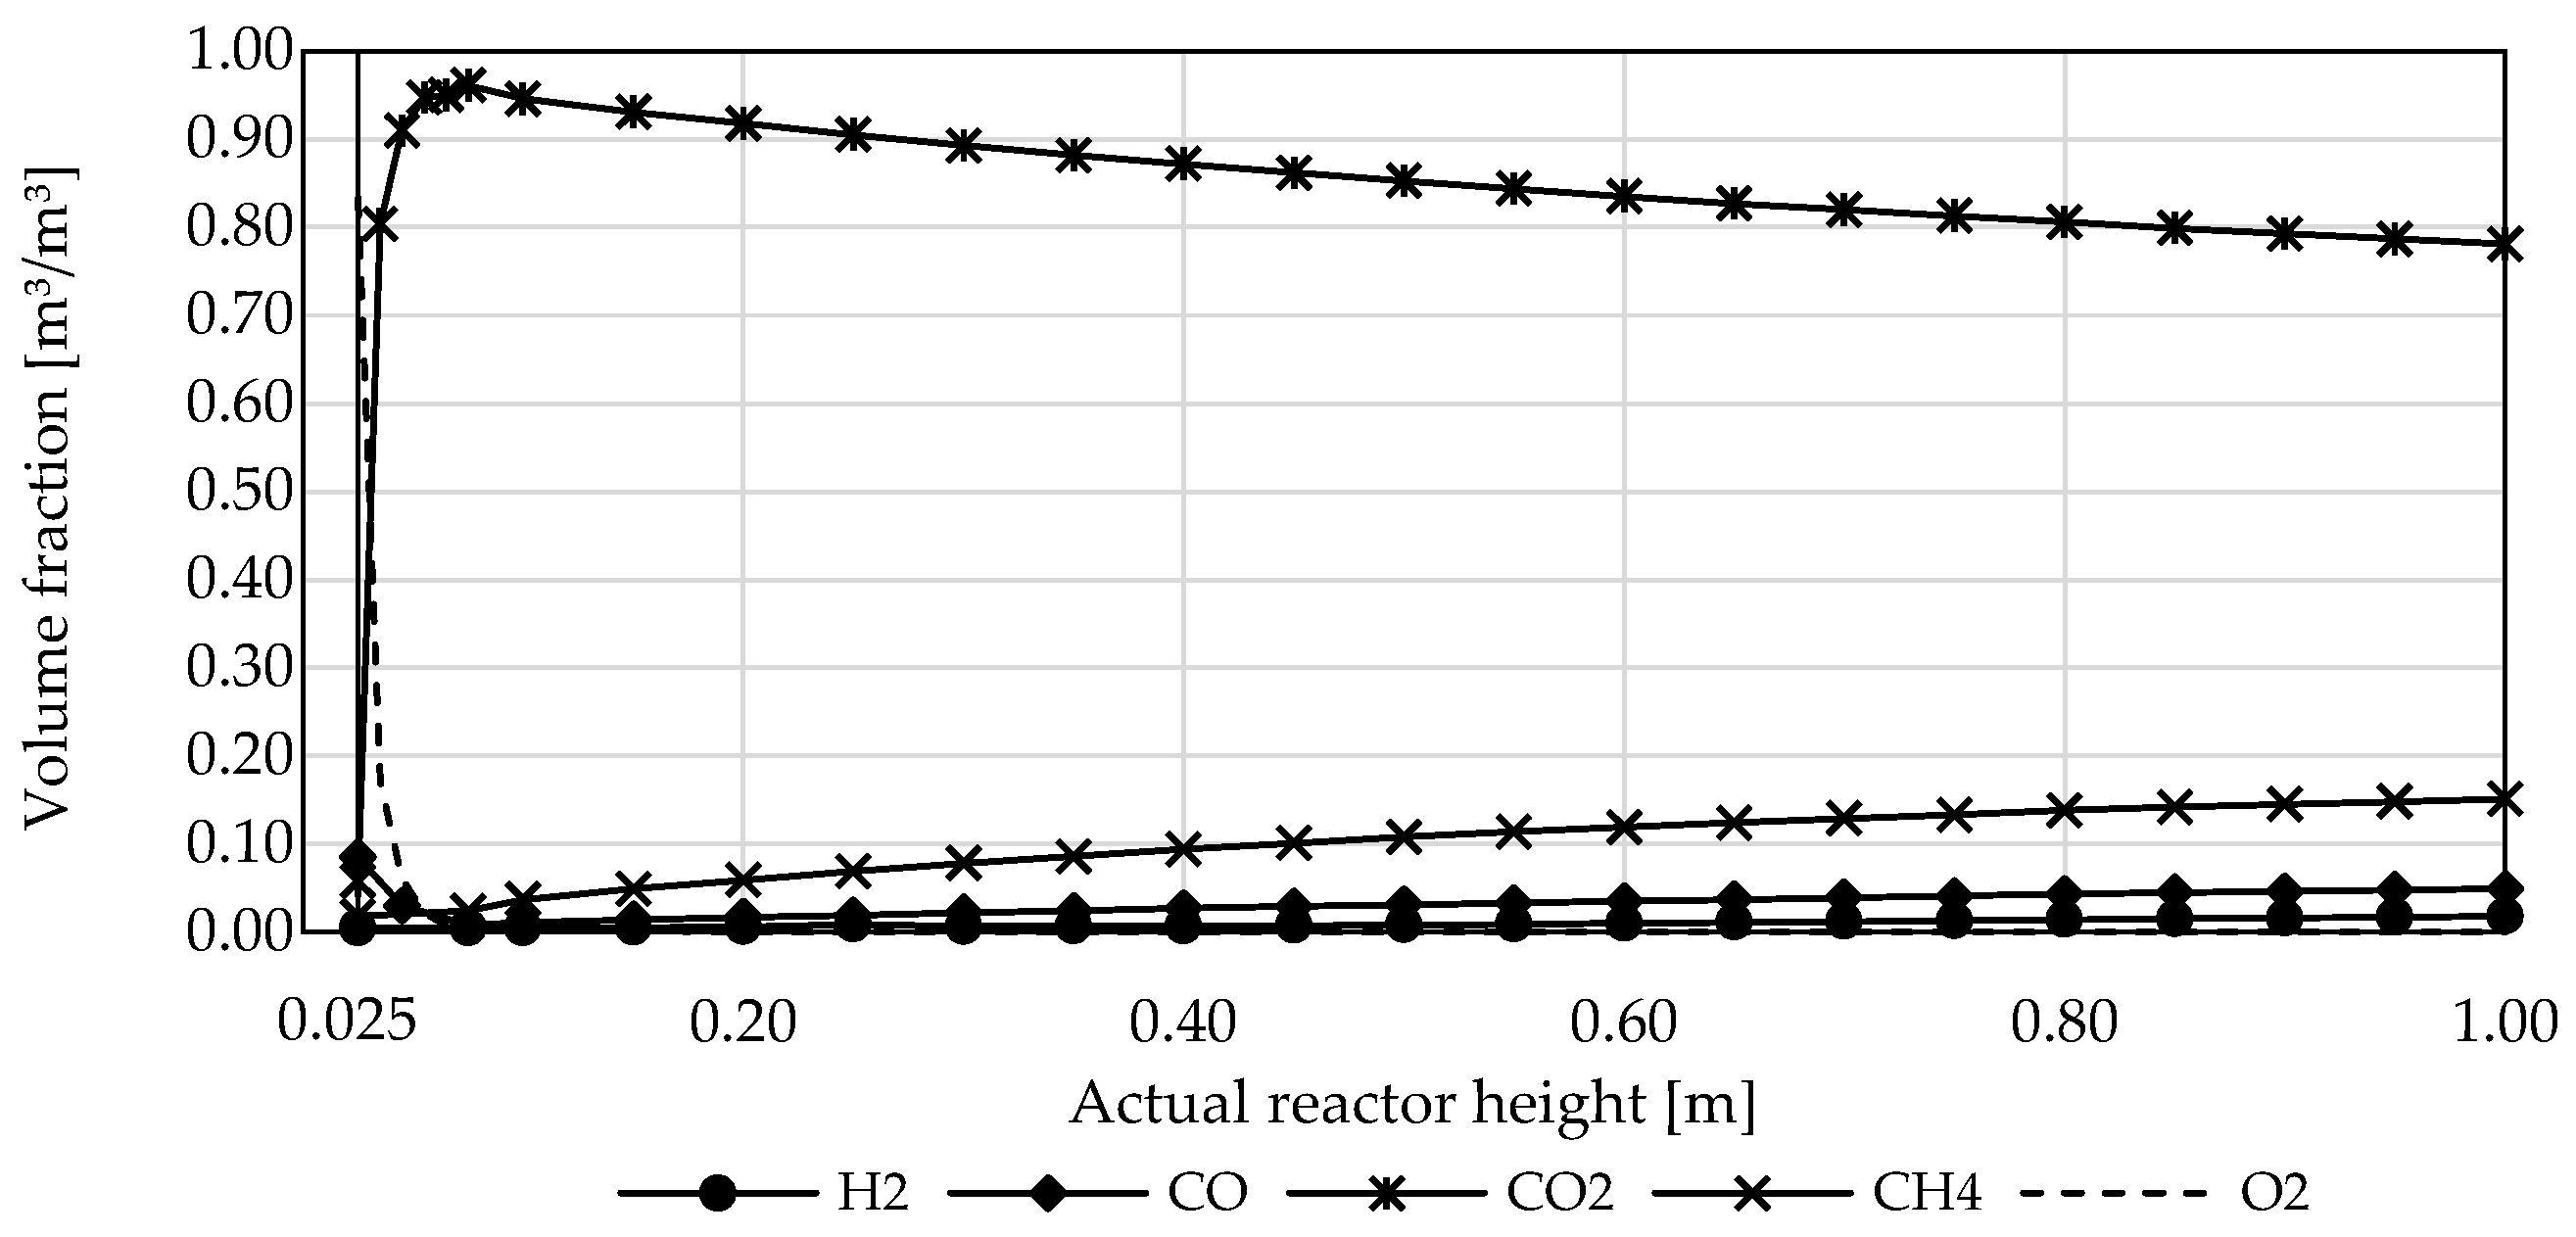
In the fluidized bed, homogeneous and heterogeneous reactions are calculated using the bubble emulsion model. From h x = 0.025   m to h x = 0.10   m , fast and exothermic oxidation reactions R2–R6 influence the volume fraction. The slower gasification reactions proceed after the supplied oxygen is completely burned. At h x = 1.00   m , the syngas leaves the fluidized bed and enters the freeboard, which is shown in Figure 6.
Mostly homogeneous gas reactions (R9–R11) occur in the freeboard. Heterogeneous reactions (R7–R8) by splashed-up particles have a minor influence on the syngas composition. The hydrogen content increases because of the water–gas shift reaction and methanation. When syngas leaves the reactor at h x = 4.00   m , the components are almost in equilibrium.
The developed universal gasification model allows changing various input parameters. The model results are, therefore, displayed as a function of these variables.

3.1. Influence of Biomass Composition

Biomass variation is shown in Table 3. Four types with different amounts of carbon, hydrogen, and oxygen are listed. Their pyrolysis product compositions are compared.
The minor difference in the initial biomass composition has a limited influence on the product composition. It is noticeable that char, hydrogen, carbon monoxide, and methane have constant values. Thus, the biomass type in the model influences the proportion of tar, carbon dioxide, and water. Mass balances can explain the results. As tar consists of hydrocarbons, it increases at high biomass carbon contents. The carbon dioxide content increases when the biomass oxygen content increases. Suppose the biomass has a high hydrogen content, then especially the proportion of formed water increases.

3.2. Influence of Incoming Mass Stream Ratios

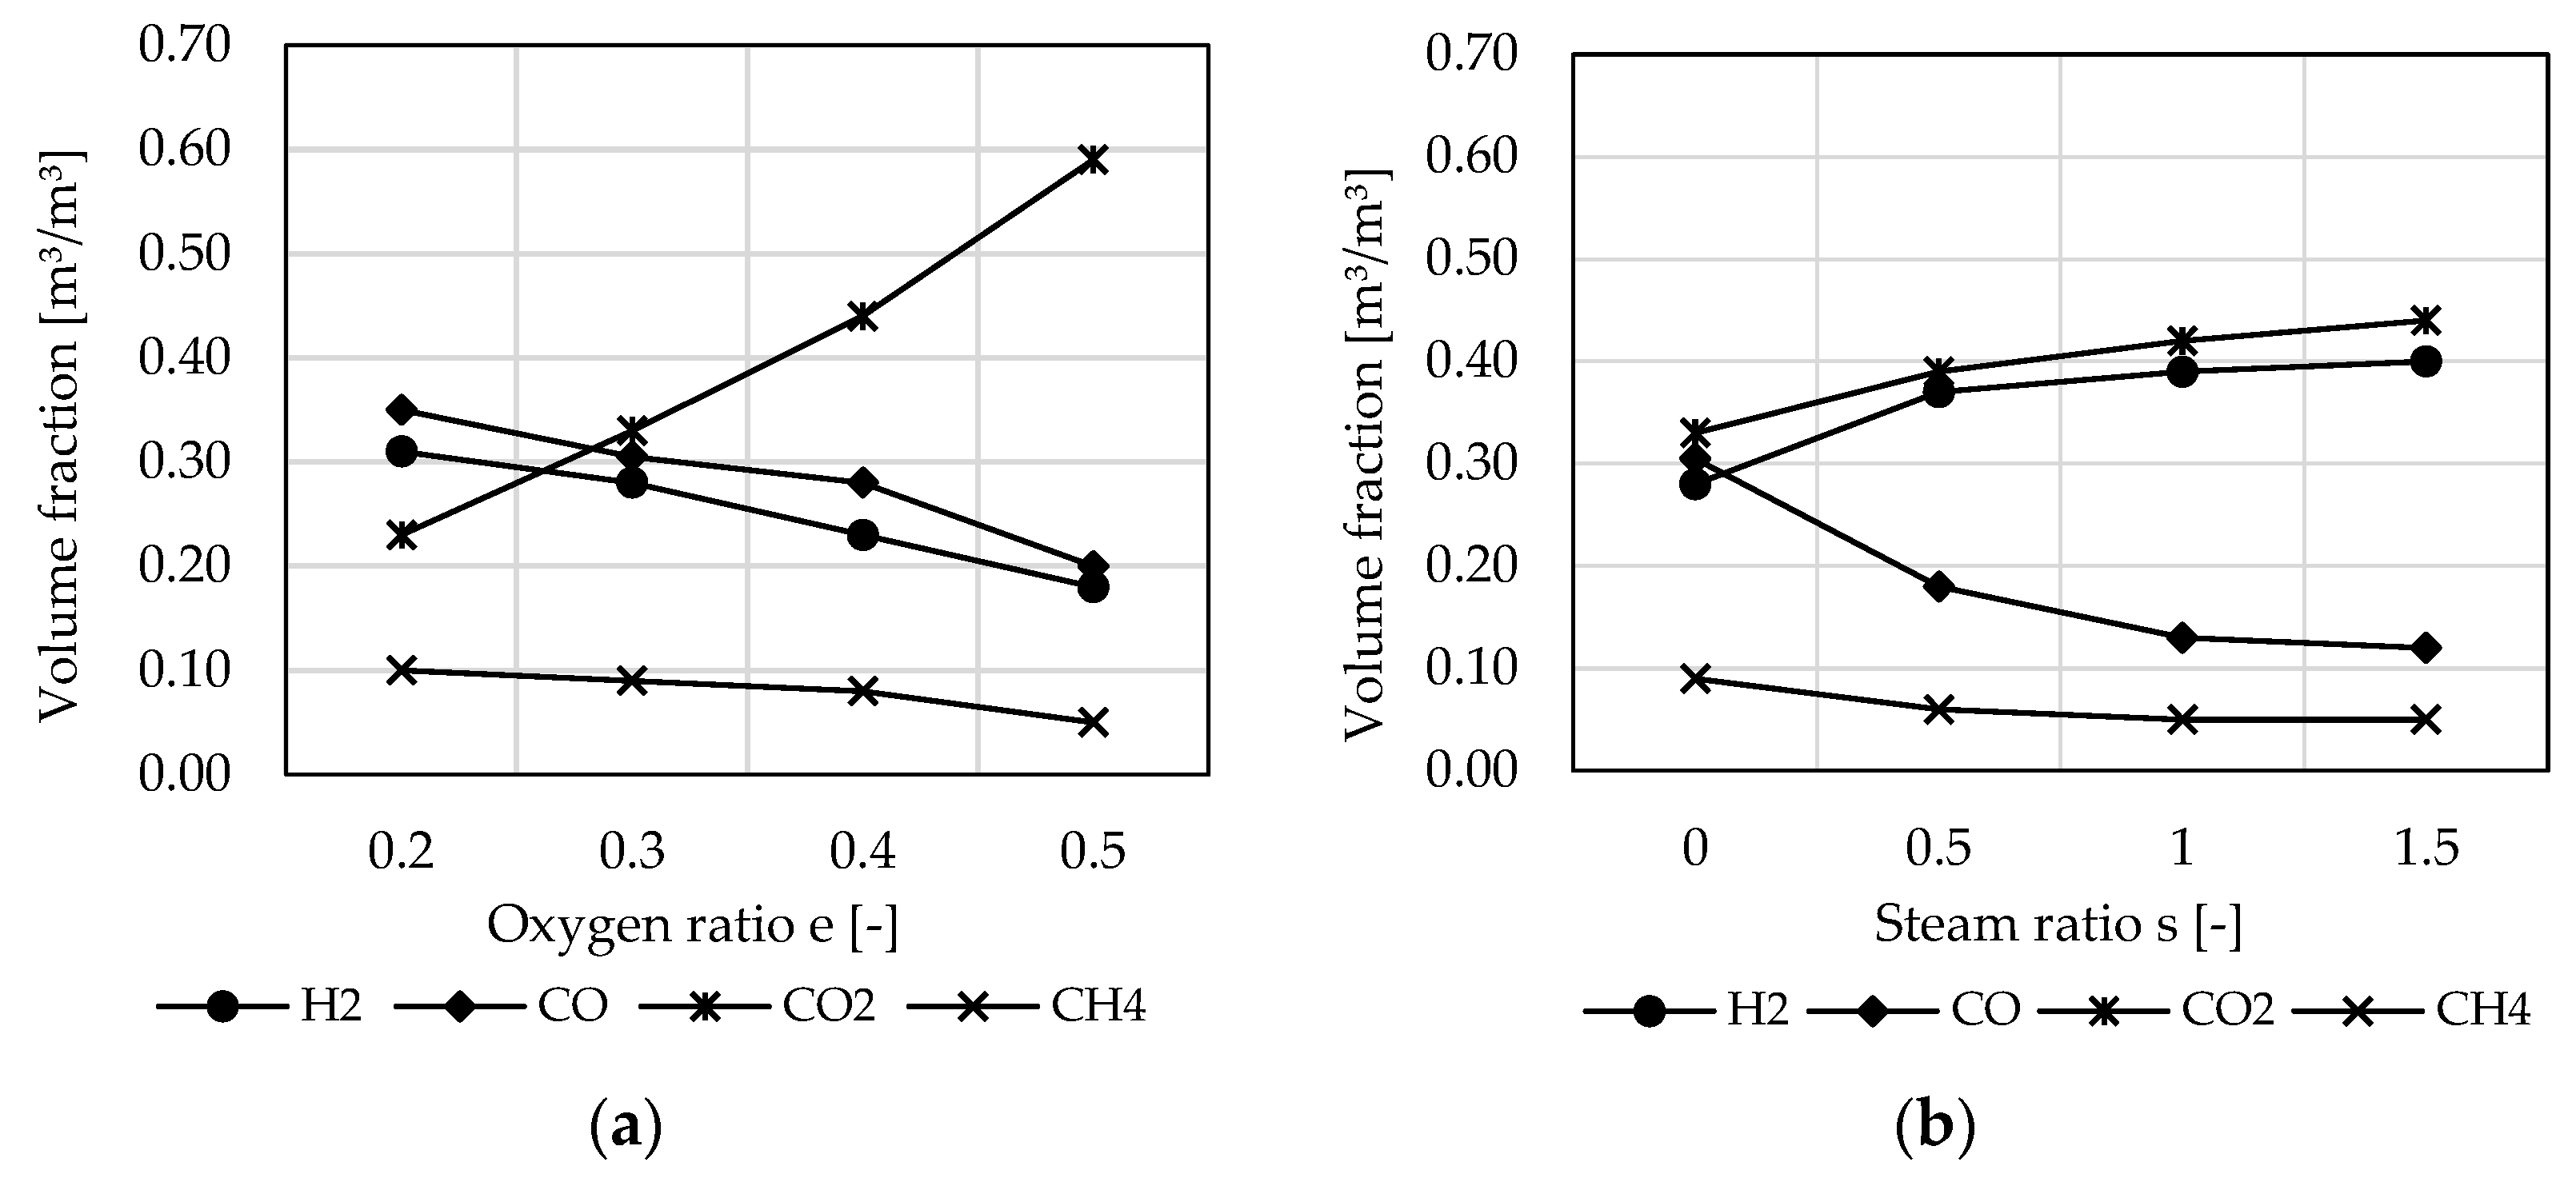
Figure 7 shows the syngas composition by varying the amount of incoming oxygen and steam.
Setup is an isothermal fluidized bed with a height of h = 3   m and a diameter of D = 1.5   m and a specified biomass mass fraction of C = 0.50 , H = 0.07 , and O = 0.42 . The predicted syngas composition comprises hydrogen, carbon monoxide, carbon dioxide, and methane.
The oxygen ratio is the relation between the actual mass stream of oxygen supplied and the mass stream of oxygen needed for complete combustion. The change in the oxygen ratio (see Figure 7a) has a considerable influence on the syngas composition. The more oxygen is added to the gasification process, the more oxidation reactions (R2–R6) occur. As a result, more components combust to carbon dioxide and water. The fraction of carbon dioxide in the stream exiting the reactor increases, and further main gas components, including hydrogen, carbon monoxide, and methane, decrease. The advantage of increasing the oxygen ratio is that more heat is added to the process due to higher combustion rates. A certain minimum amount of heat is required for gasification reactions to run and thus produce hydrogen-rich syngas. The steam ratio is the relation between the steam and biomass mass streams. Adding steam influences the equilibrium of the water–gas shift reaction (R10). As a result, hydrogen and carbon dioxide proportions increase (see Figure 7b). Therefore, steam is an essential factor in increasing hydrogen content. As steam generation is energy-intensive, it is necessary to check which quantities of steam supplied are economical.

3.3. Influence of Reactor Design and Process Parameters

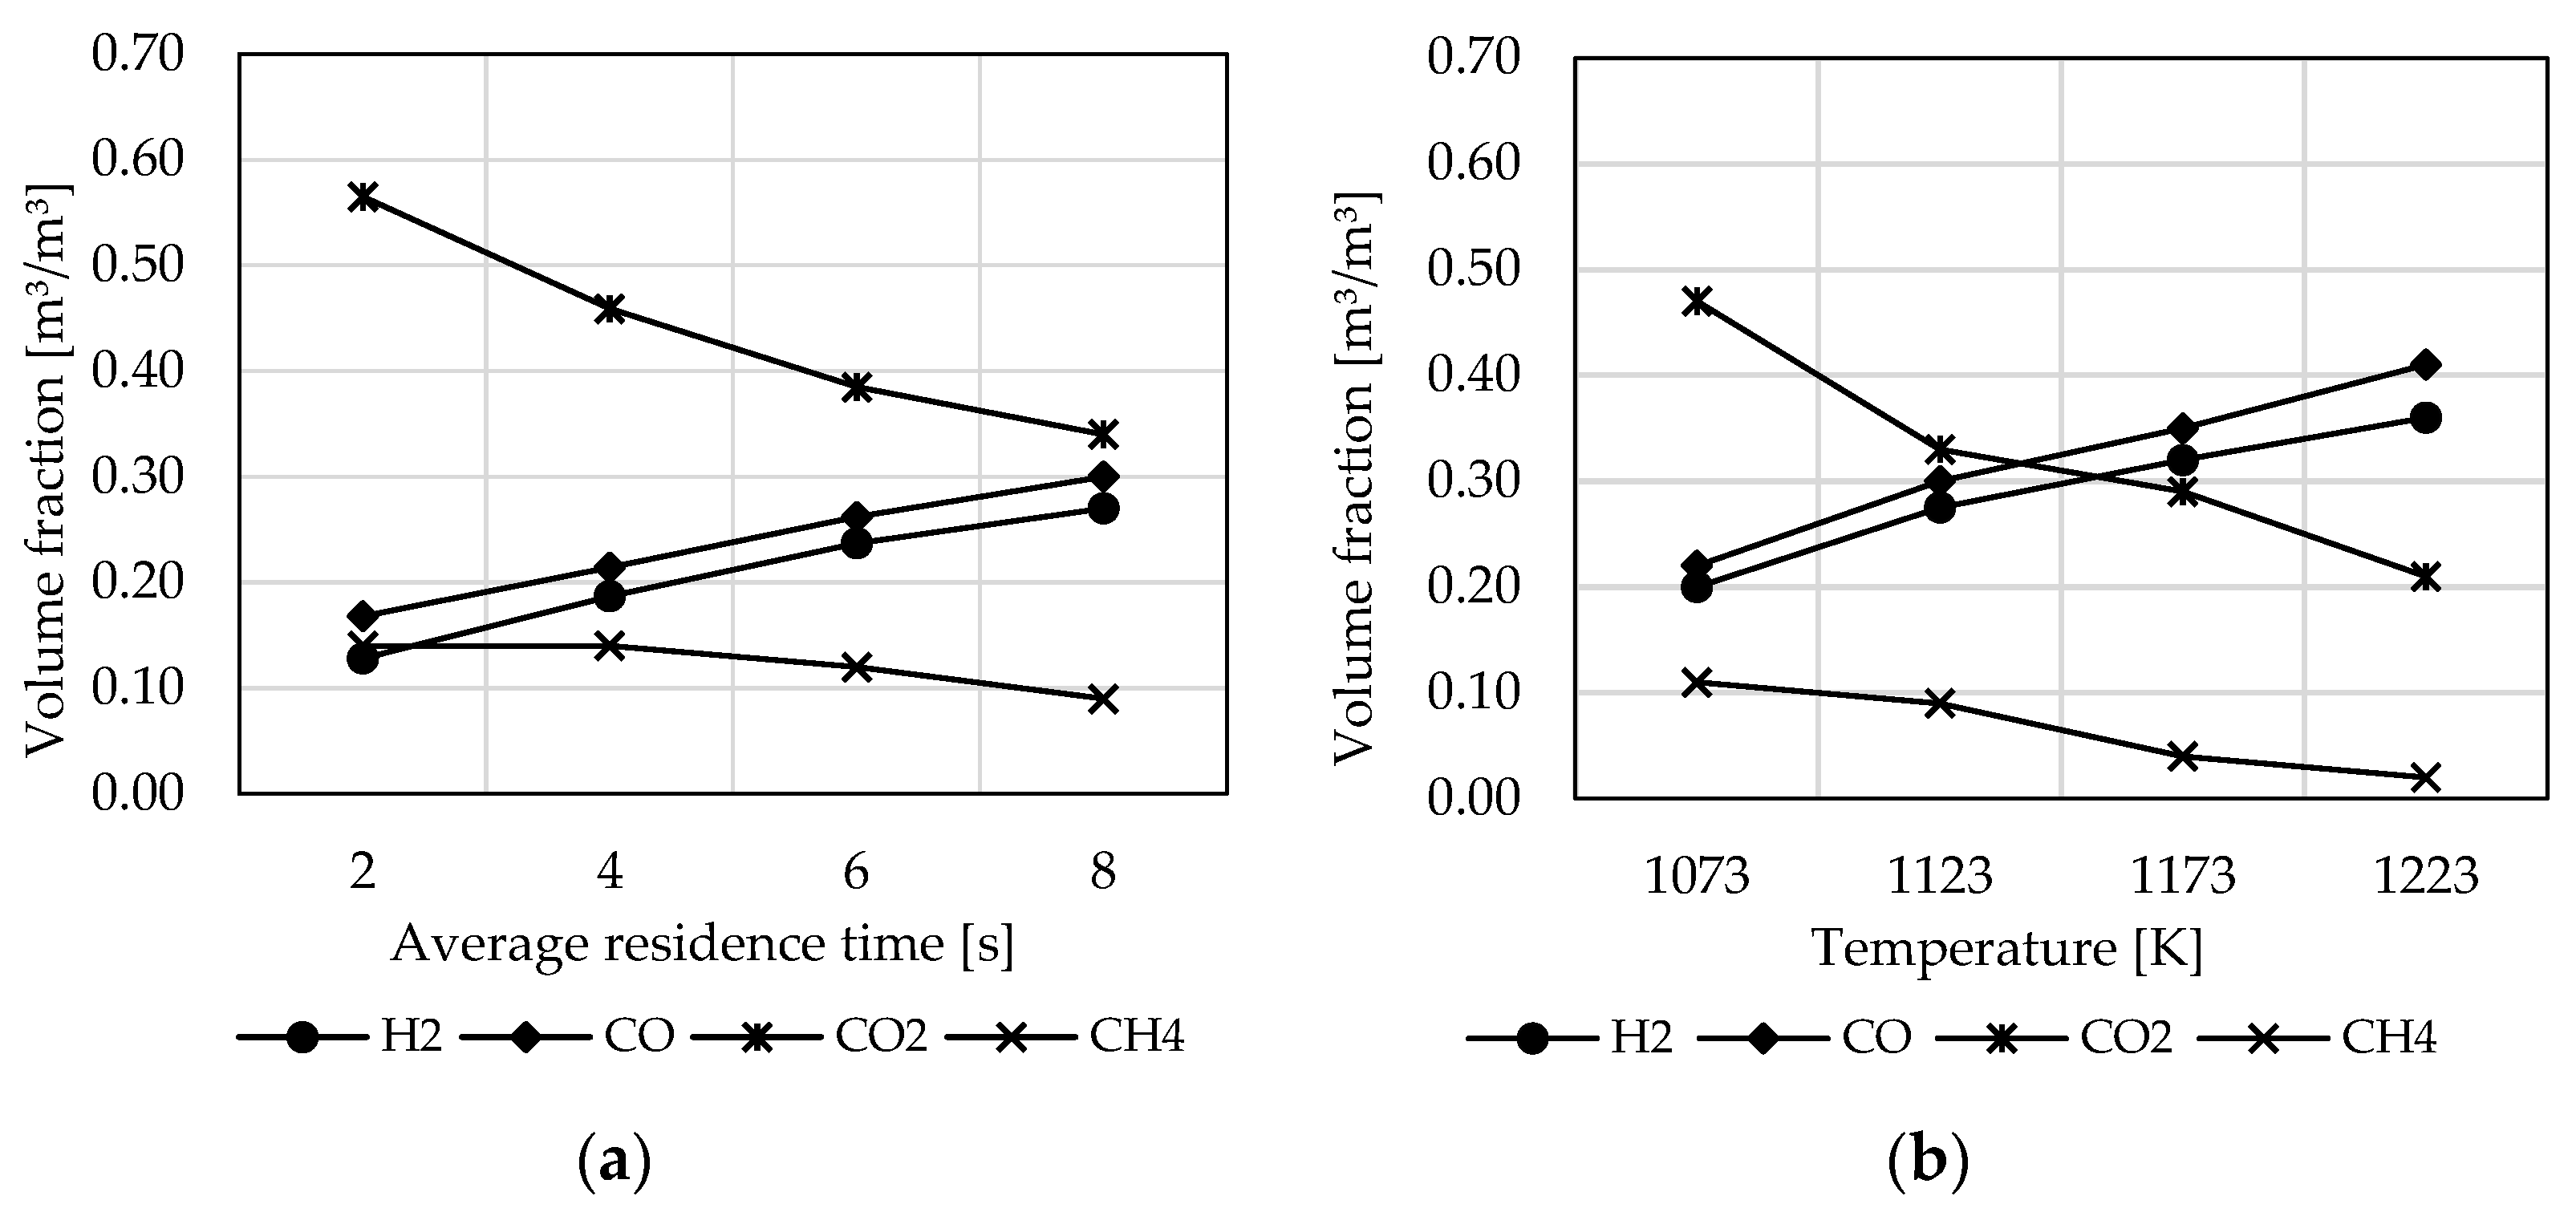
Varying average residence times and temperatures, results are shown in Figure 8. Setup is an isothermal fluidized bed reactor with a diameter of D = 3   m and a specified biomass of C = 0.50 , H = 0.07 , and O = 0.42 . Incoming mass streams or reactor design, especially reactor diameter or height, influence the average residence time. In Figure 8a, residence time is varied by changing reactor heights between h = 0.8   m and h = 3.2   m . Varying residence times influence the progress, especially the water–gas shift reaction and methanation. Figure 8a clearly shows that the average residence time must be increased further than τ = 8   s to achieve equilibrium.
In addition, the syngas composition is predicted as a function of the temperature in Figure 8b. An increase in temperature causes the chemical reactions to run more quickly. As oxidation reactions (R2–R6) run rapidly and are limited by the oxygen ratio, the temperature increase primarily affects the gasification reaction rate (R7–R11). The increase in hydrogen production at higher temperatures is mainly caused by the influence of the water–gas shift reaction (R10). By increasing the temperature, the reaction runs faster, and the equilibrium constant K e q , s h i f t is increased so that more hydrogen is produced in a shorter time. In addition, the reaction rate and the equilibrium constant K e q , m e t h of methanation (R11) increase, which is why more methane is converted, and thus, the methane fraction is reduced. Due to equilibrium reactions, the proportion of carbon monoxide increases, and the proportion of carbon dioxide decreases. However, an increase in temperature is accompanied by increased energy consumption and more complex process control.

3.4. Influence of Reactor Type

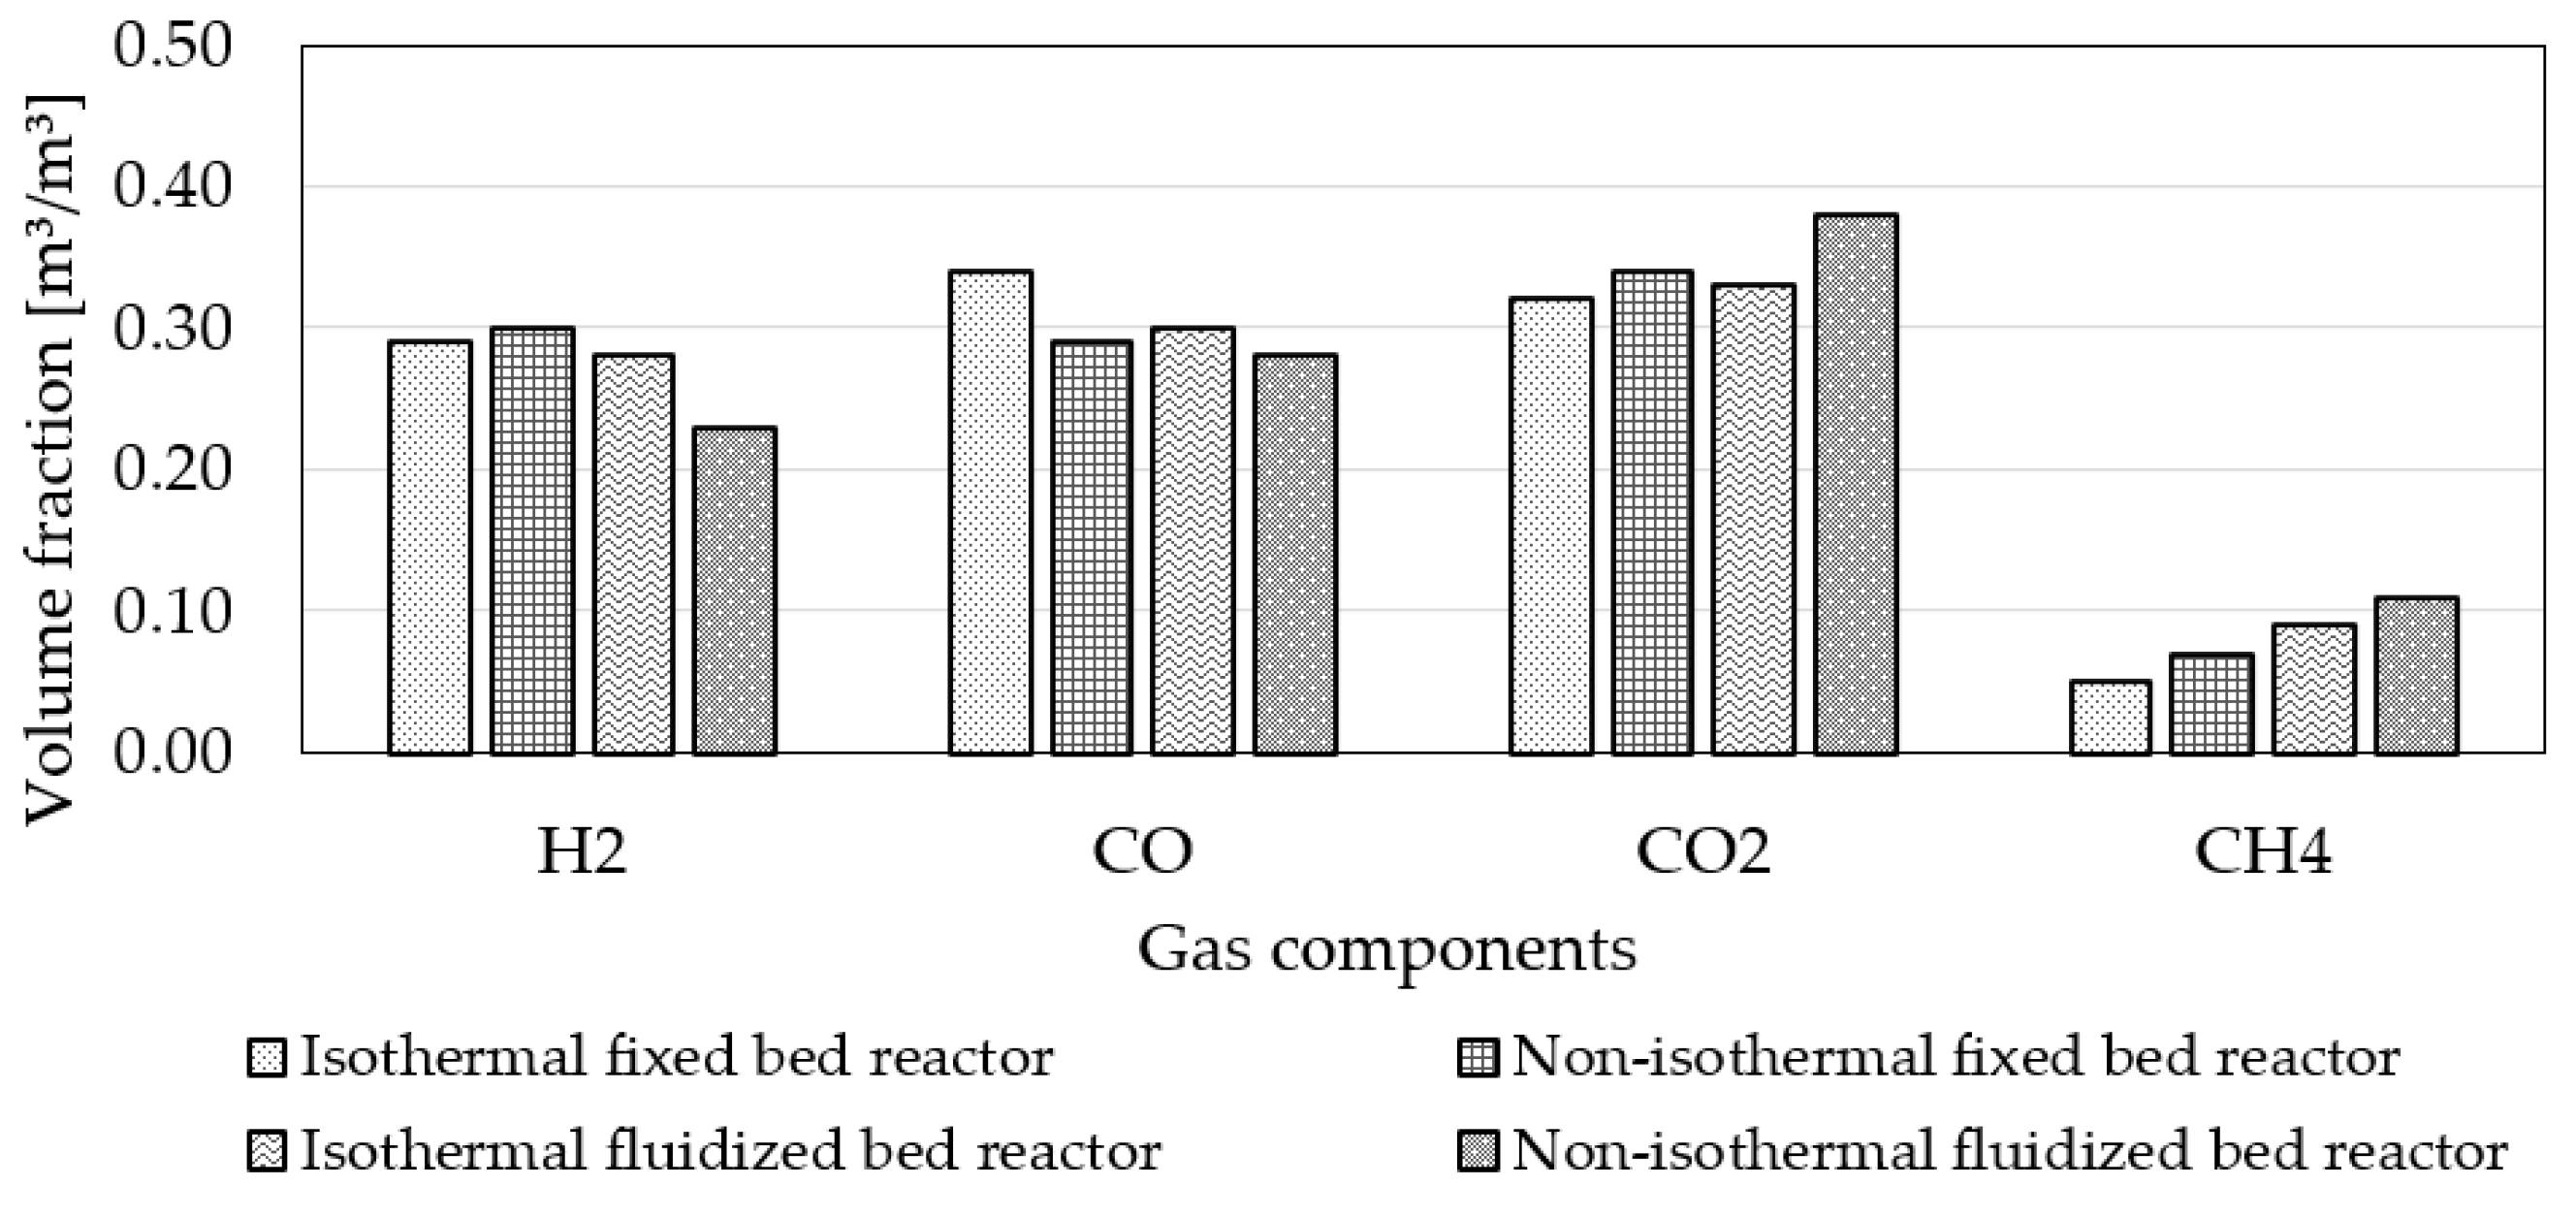
Since there are four model variations possible with the fixed bed reactor and the fluidized bed reactor, each with an isothermal and non-isothermal operating mode, the predictions of the different variants are compared in Figure 9.
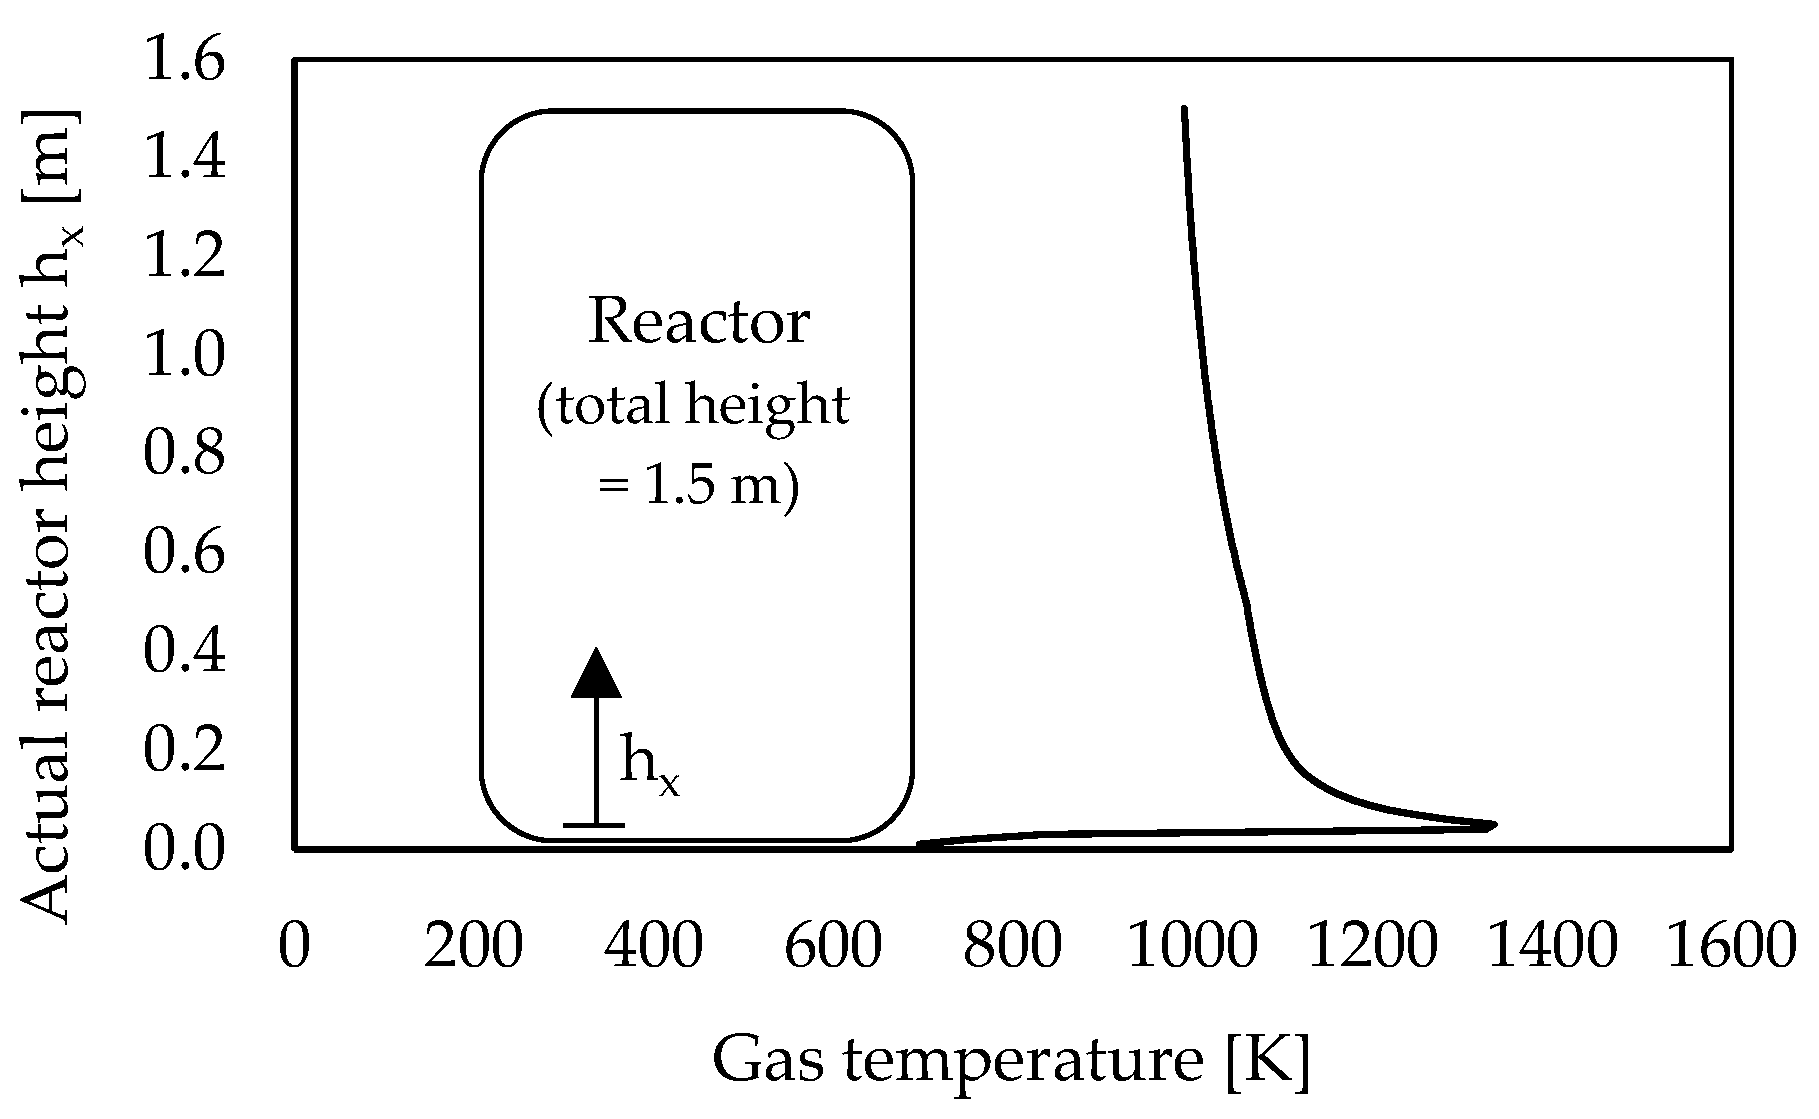
Biomass is specified with C = 0.50 , H = 0.07 , and O = 0.42 . Distributions of gas components of all model variants are in the same order of proportions. Minor differences between the models can be explained as follows: Two different reactor models are used based on various energy and mass balances. The reactions in the isothermal models always take place at the same temperature. Referring to non-isothermal models, a temperature profile is created that strongly influences the reactions. This can be seen in Figure 10. In a reactor with a total height of h = 1.5   m , the one-dimensional temperature profile is calculated from the reactor bottom to the top. Biomass is specified with C = 0.50 , H = 0.07 , and O = 0.42 .
After pyrolysis (R1), the combustion reactions (R2–R6) take place directly, as these are much faster than the gasification reactions. The exothermic reactions cause the gas temperature to rise rapidly, as can be observed at the reactor inlet from h 0 = 0   m to h 1 = 0.05   m in Figure 10. Temperature rises from T 0 = 650   K to T 1 = 1350   K . Only the endothermic gasification reactions (R7–R12) occur when the oxygen is used up. This causes the gas temperature to drop again to approximately T e n d = 1000   K by the end of the reactor at a height of h e n d = 1.5   m .

4. Discussion

To confirm the validity of the model predictions, the gasification model is compared to experimental investigations presented in the literature. For this purpose, the experimental results of Manyá et al. [33], Kang et al. [34], de Andrés et al. [35], and Tepper [13] are considered. Table 4 shows the boundary conditions of the experiments published in the scientific articles used for the model.
All authors conducted an elemental analysis of biomass for their experiments. The model requires the proportions of carbon (C), hydrogen (H), and oxygen (O) that are shown in Table 4. These three proportions are not 100%, as other elements such as nitrogen, sulfur, or heavy metals are present in biomass.
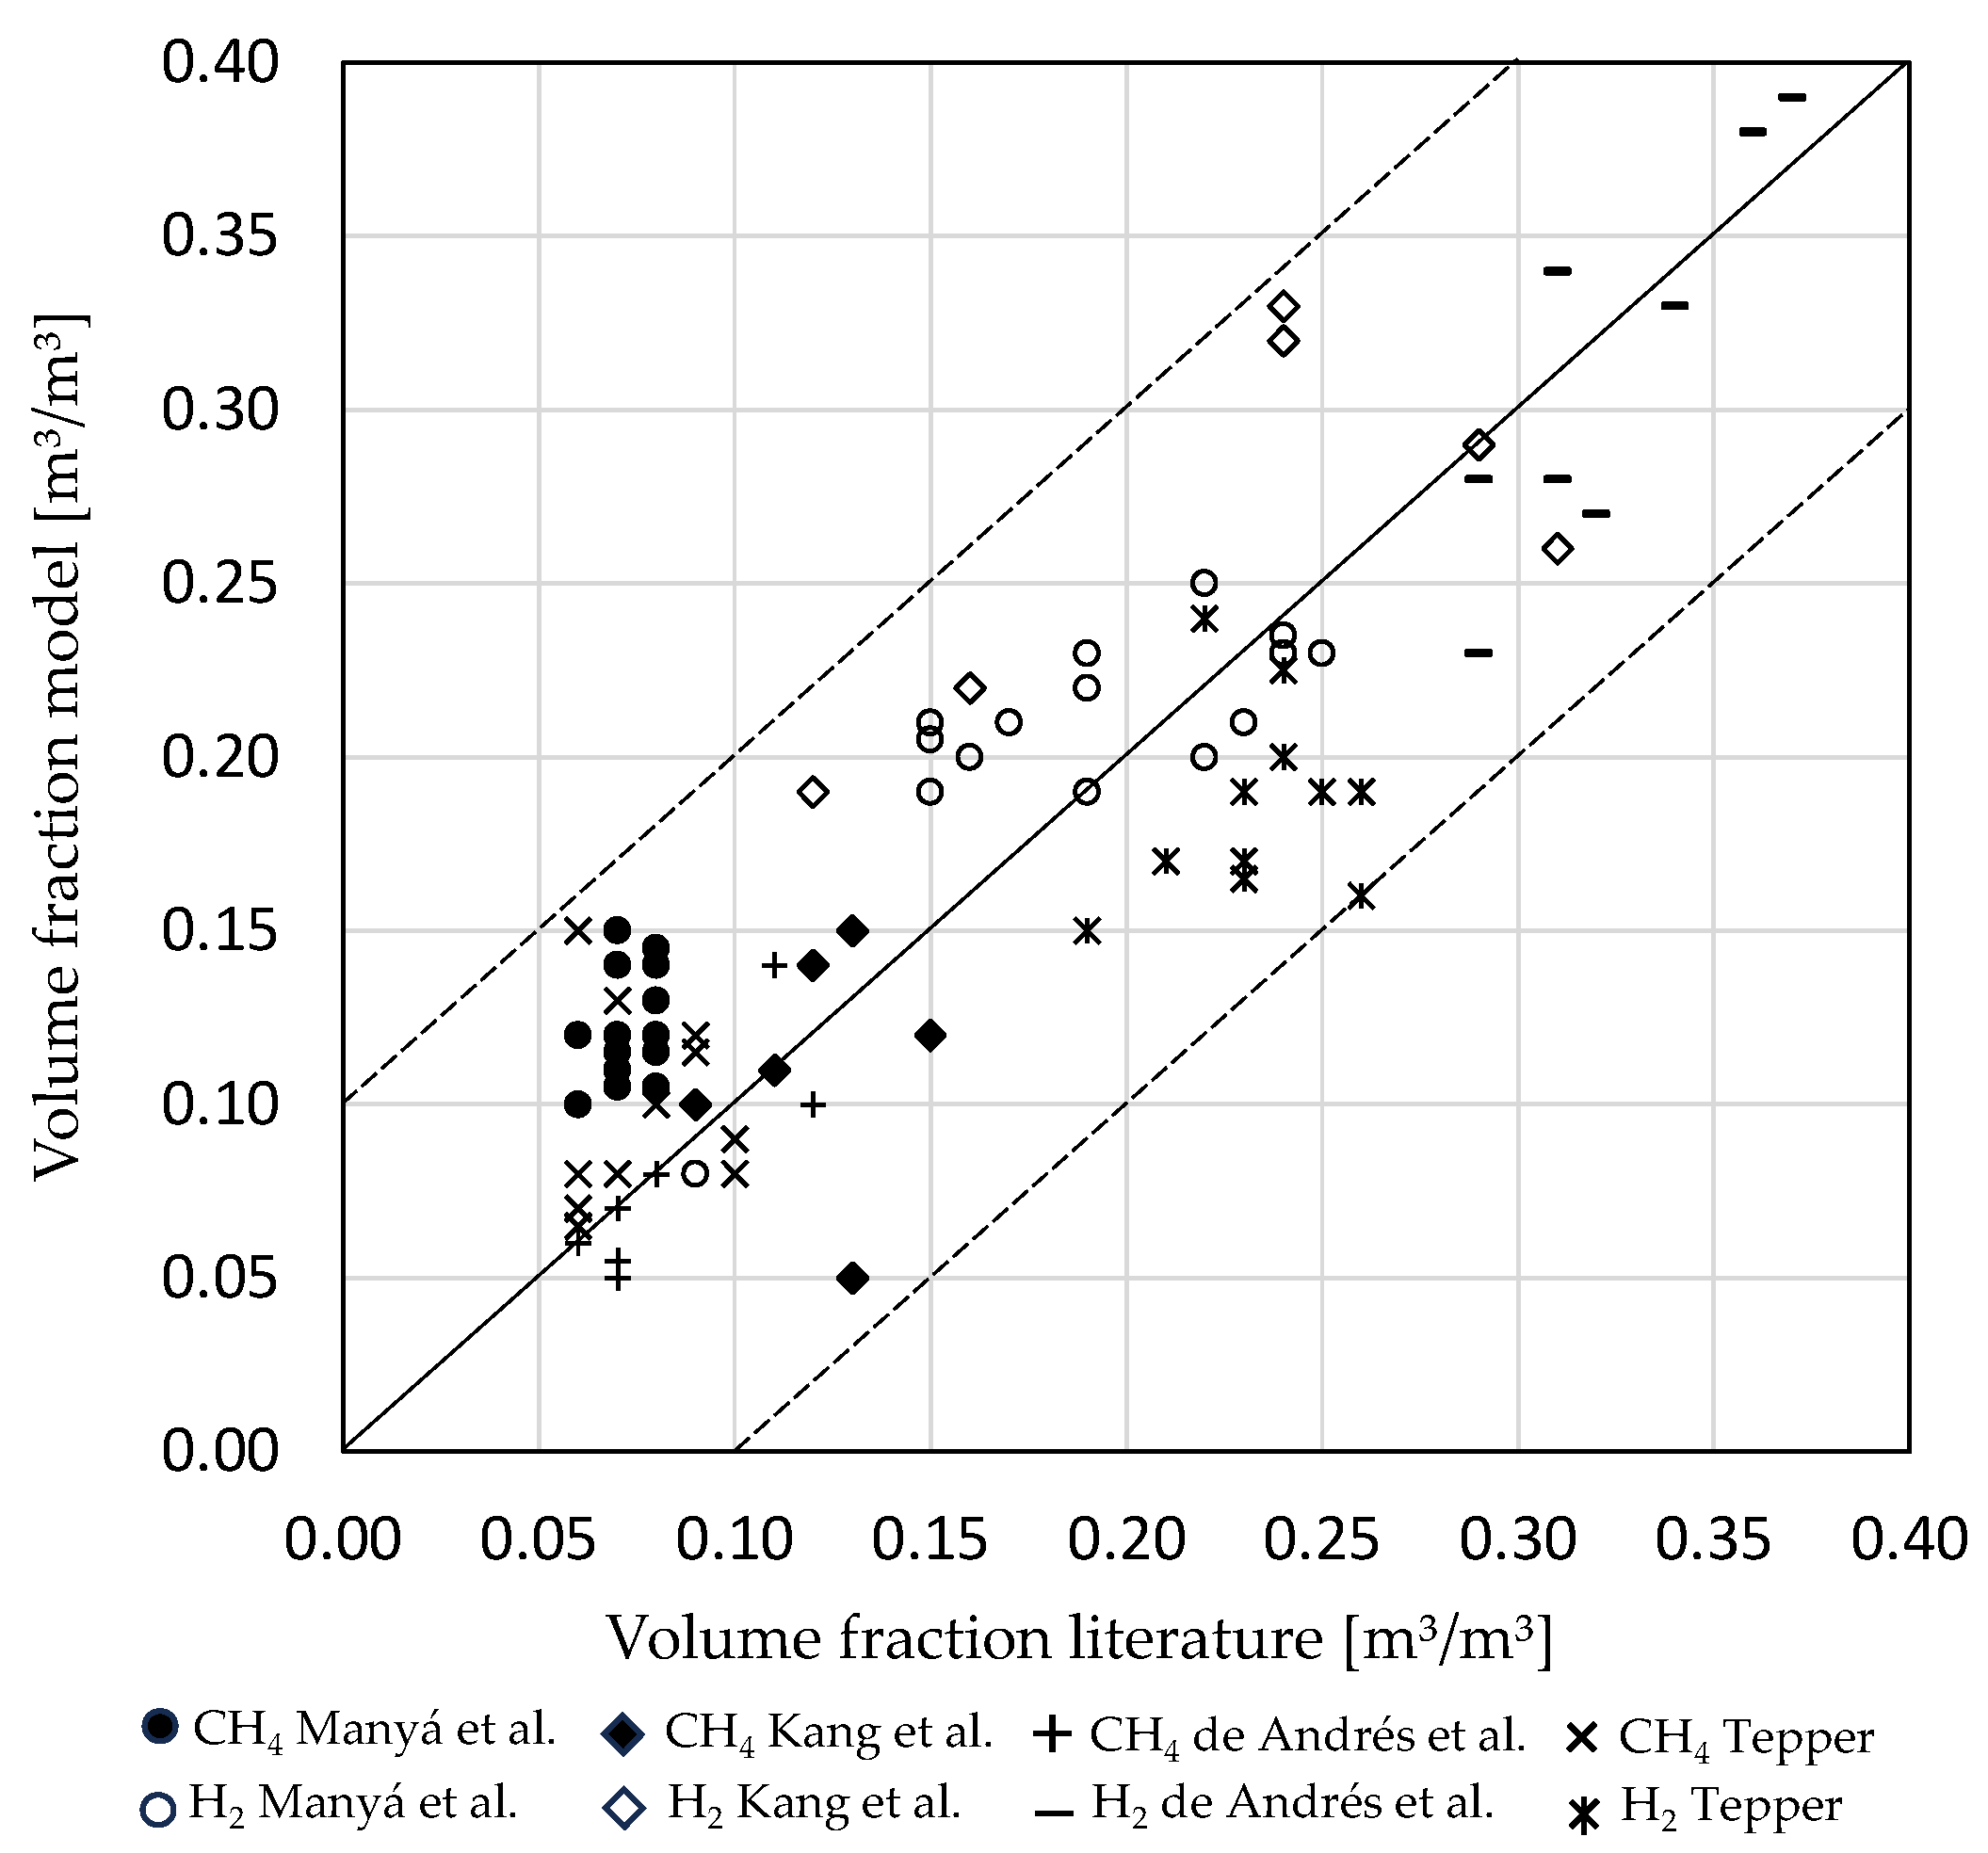
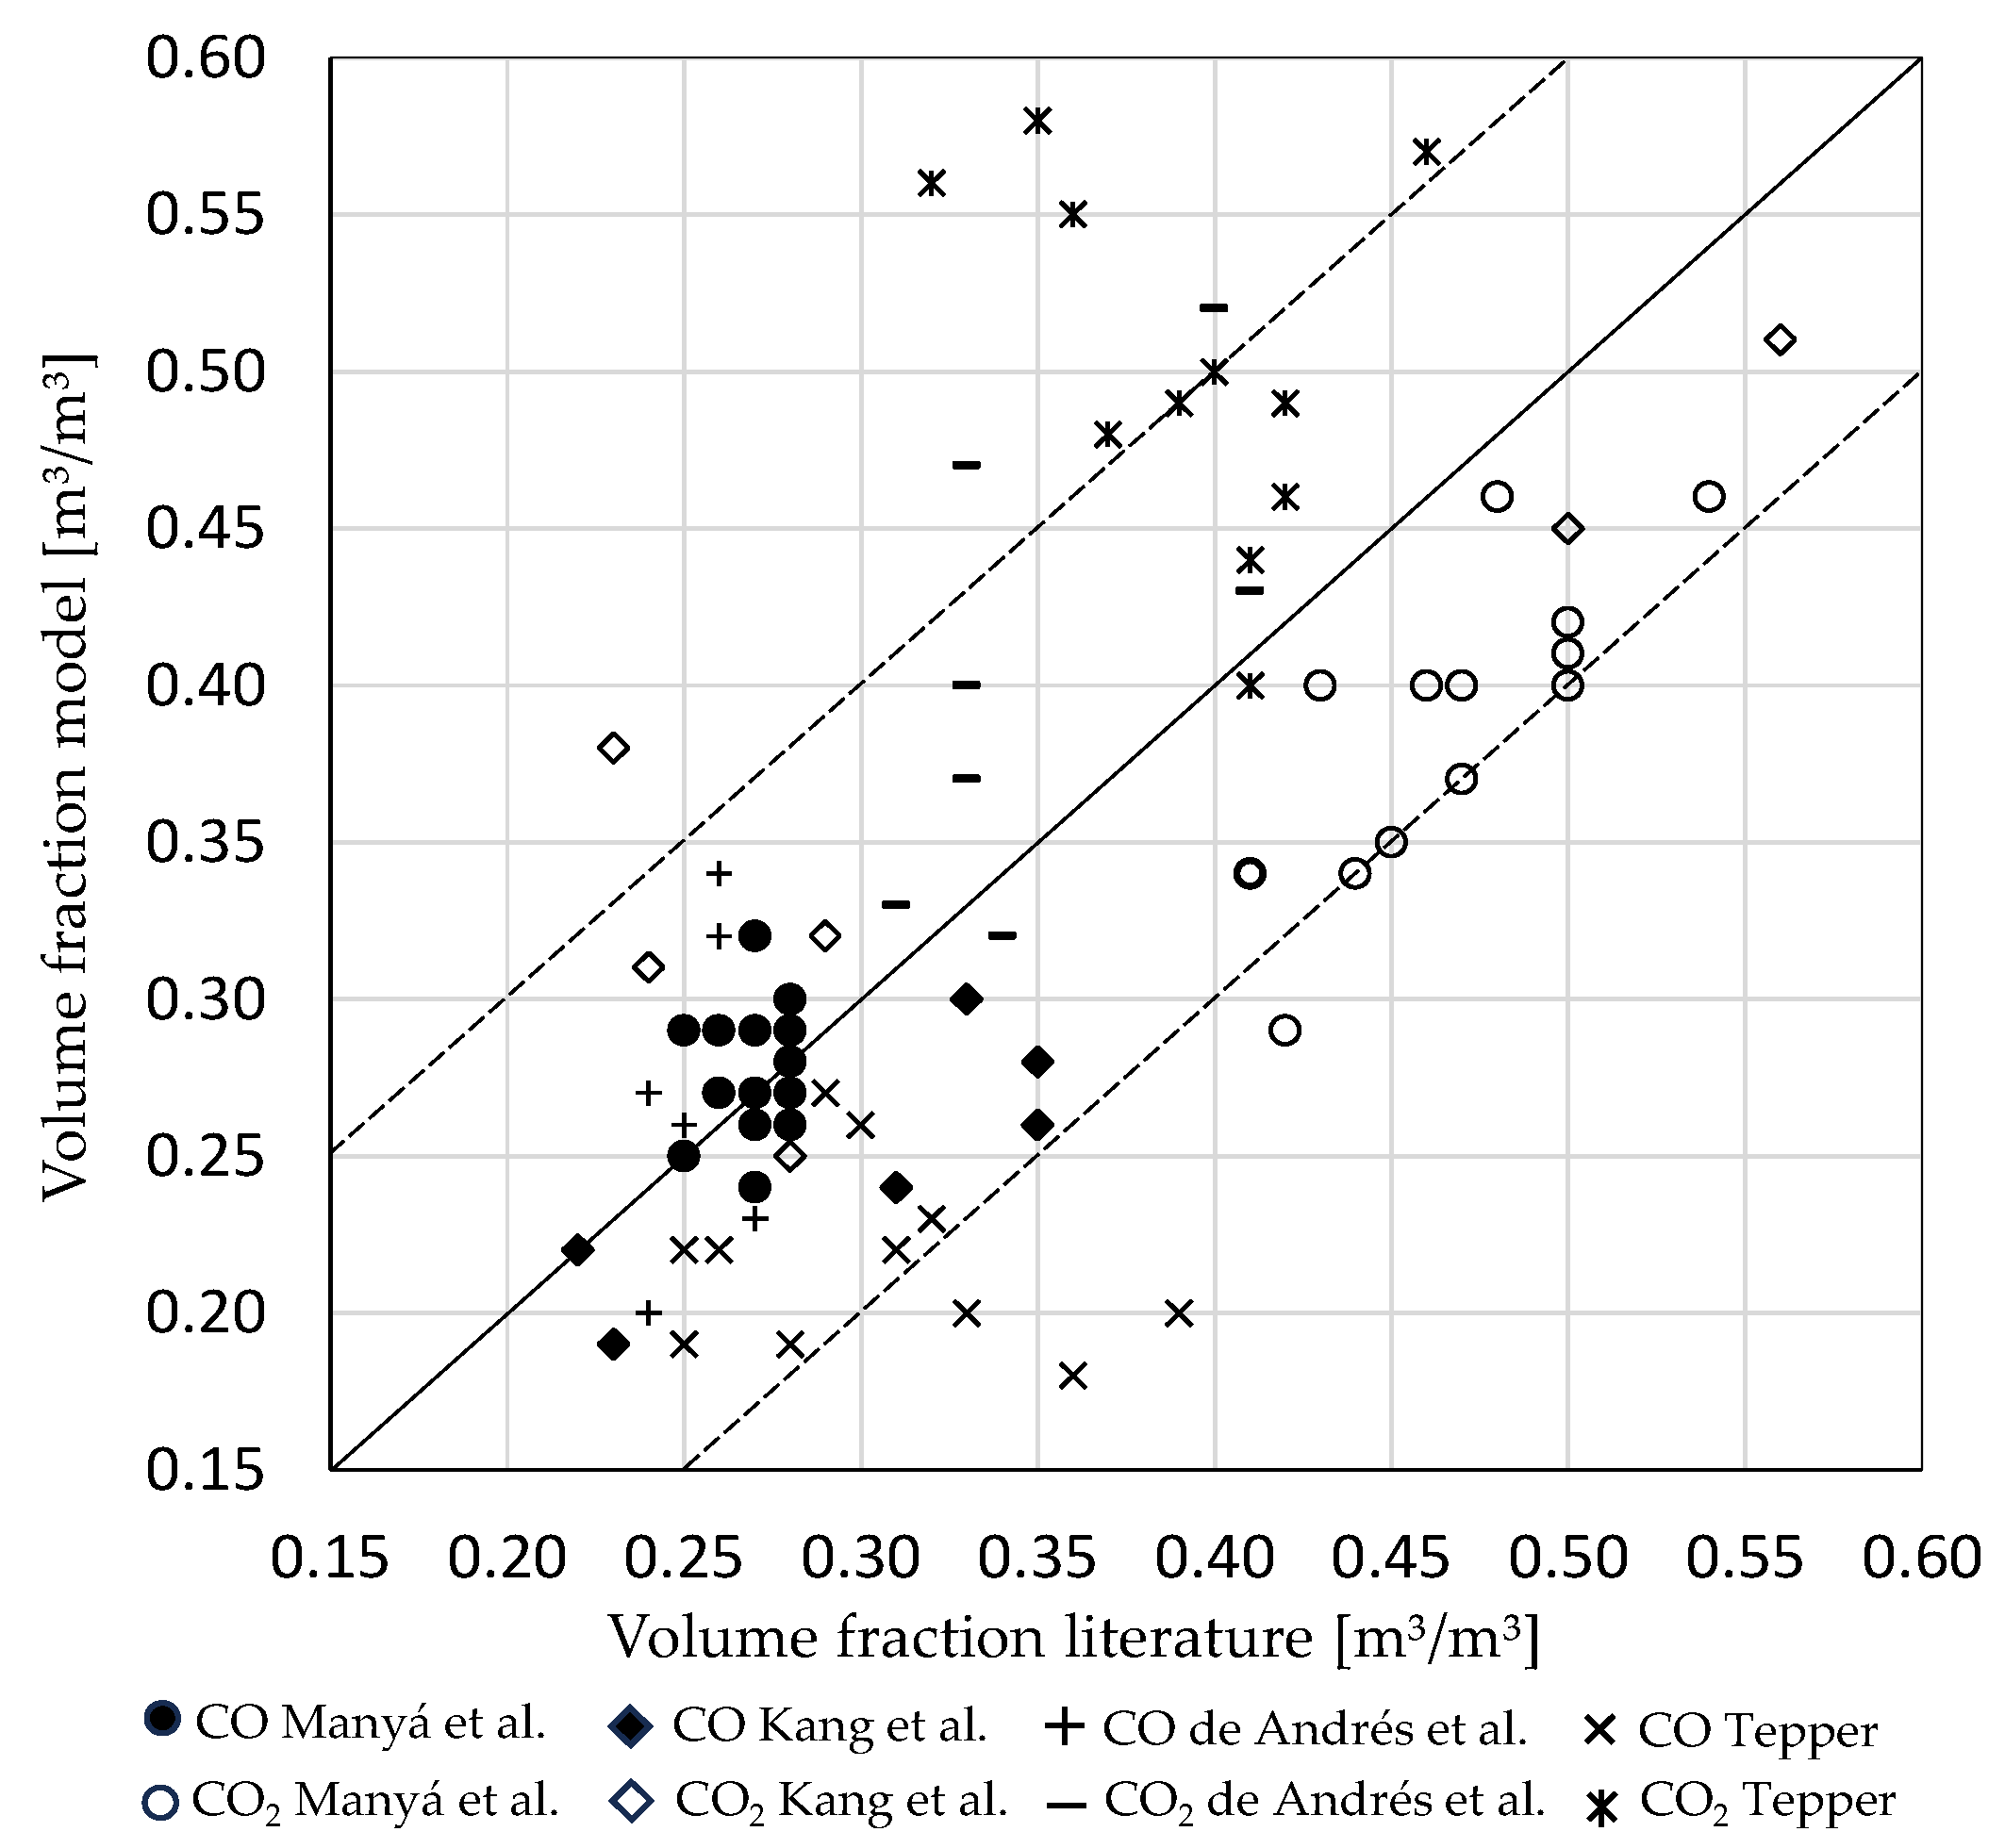
Experimental syngas compositions of hydrogen, carbon monoxide, carbon dioxide, and methane are compared with calculated syngas compositions from the isothermal fluidized bed reactor model. The comparison is shown in Figure 11 and Figure 12. Appendix A contains a table with detailed test results and input parameters. The main components, hydrogen, carbon monoxide, carbon dioxide, and methane, are normalized to 100%.
In Figure 11, the model’s predicted hydrogen and methane fractions agree very well with the compared values. The maximum deviation is s = ± 0.1 . For hydrogen, our model calculation is in accordance with values from de Andrés et al. [35]. Their results are derived from a setup where steam can be separately supplied. This confirms that modeling the separate steam supply also provides valid results. Compared to Manyá et al. [33] and Kang et al. [34], hydrogen values tend to be predicted too high. For Tepper [13], the predictions are too low. Regarding the methane fraction, the model calculations are generally higher than the experimental results.
In Figure 12, validation for carbon monoxide and carbon dioxide is shown. The agreement is acceptable but is more widely distributed than the results for hydrogen and methane in Figure 11. This means that model simulations of hydrogen and methane values are accurate. However, carbon monoxide and carbon dioxide values still require more optimization regarding accuracy and distribution between the two values. Particularly striking is the comparison of carbon monoxide and carbon dioxide with Tepper. Several values are outside the range of s = ± 0.1 . These values are test results with high oxidation numbers e > 0.45 . Concerning Figure 7a, it is noticeable that the modeled carbon dioxide value rises strongly at high oxygen ratios. This makes it clear that significant deviations occur at this model boundary. Nevertheless, the overall carbon monoxide and carbon dioxide ratio agrees well with Tepper [13]. For example, in experiment 10 (see Table A1), the value for carbon monoxide is v C O = 0.36 , and the value for carbon dioxide is v C O 2 = 0.35 , so they have a total of v C O + C O 2 = 0.71 . The model predicts a value for carbon monoxide of v C O = 0.18 and a value of carbon dioxide of v C O 2 = 0.58 , so they have a total of v C O + C O 2 = 0.76 . That means that only the distribution of the two components at high oxygen ratios is not exact and must be optimized.
In summary, the model is successfully validated. Due to deviations in the boundary regions, the model should be used in the temperature range of T = 1050 1200   K and the oxygen ratio should be e = 0.1 0.4 to obtain valid results. Only the isothermal fluidized bed reactor was validated with experimental results, which has the most practical application. Regarding Figure 11 and Figure 12, the model predictions relate to deviations. This inaccuracy can be related to assumptions used in the model and to experimental uncertainties. Possible errors in modeling the gasification process are as follows:
  • Selection of the reactions: Only eleven reactions are considered due to the simplified approach. However, more reactions are known to influence the syngas composition.
  • Substance data are estimated and show inaccuracies.
  • Reaction kinetics: Different kinetic data exist for the same chemical equations, which show significant differences in the reaction rate.
  • Considered substances: The primary substances are biomass, char, tar, water, oxygen, hydrogen, carbon monoxide, carbon dioxide, and methane. Char is assumed to consist entirely of carbon. Tar is a complex mixture of different aromatics but is considered in the model to be simplified as ethyne. If tar is described by other substances such as ethane or benzene or defined by a composition of different aromatics, this has a direct influence on the tar reactions R3 and R9. Carbon monoxide, hydrogen, and methane proportions change and influence the equilibrium reactions R10 and R11.
  • In some cases, process parameters, such as the average gas residence time in the reactor, are assumed.
  • Ideal assumptions: The heat and mass balance equations are based on ideal reactor models. Real occurring effects, like dispersion effects, are neglected.
  • Catalysts: The fluidized bed consists of biomass and char particles. The use of a catalyst in the fluidized bed is neglected. In practice, a solid inert material or a catalyst is added, influencing the reactions.
In addition to modeling, errors also occur during experimental implementation. Different experimental setups, test procedures, and methods of evaluating and analyzing the biomass and syngas result in uncertainties.
This work focuses on creating a generalized and detailed biomass gasification model to be integrated into the DWSIM process simulator for simple application. Despite achieving these goals, limitations are imposed on this work and the model. Fluidization with air cannot be represented in the model since the substance nitrogen is not accounted for. In addition, no particle model for pyrolysis has been integrated so far. In the case of pyrolysis, however, inhibitions due to heat and mass transport are neglected. In general, only the isothermal fluidizing bed reactor model was validated. The other models were neglected and only compared to each other. Therefore, further model variants like the fixed bed reactor or non-isothermal fluidized bed reactor should be validated in the future, and deviations that are too large, such as carbon monoxide and carbon dioxide distribution, should be reduced.

5. Conclusions

A gasification model was created to predict syngas composition produced from biomass. Overall, a model with four model variants was programmed. The model consists of the isothermal fixed bed reactor, the non-isothermal fixed bed reactor, the isothermal fluidized bed reactor, and the non-isothermal fluidized bed reactor. The programming was performed using Python and integrated into DWSIM for a better application. Experimental results from the literature validated the fluidized bed reactor. The gasification model shows good agreement with experimental results. The recommended application is at temperature ranges of T = 1050 1200   K and oxygen ratios of e = 0.1 0.4 .

Author Contributions

Conceptualization, S.B. and B.C.S.; methodology, S.B. and B.C.S.; software, S.B.; validation, S.B.; writing—original draft preparation, S.B.; writing—review and editing, B.C.S.; visualization, S.B. and B.C.S.; supervision, B.C.S.; project administration, S.B. and B.C.S. All authors have read and agreed to the published version of the manuscript.

Funding

This research received no external funding.

Data Availability Statement

The datasets presented in this article are not readily available because of privacy reasons. Requests to access the datasets should be directed to Simon Brinkmann.

Conflicts of Interest

The authors declare no conflict of interest.

Abbreviations/Nomenclature

m ˙ 0 Initial mass flow [kg/s]
m ˙ h Mass flow after height h [kg/s]
m ˙ i , b Mass flow (component i) in bubble phase [kg/s]
m ˙ i , e Mass flow (component i) in emulsion phase [kg/s]
m ˙ i , f Mass flow (component i) in freeboard [kg/s]
V ˙ g a s Volume stream gas [m3/s]
H R Reaction enthalpy [J/mol]
A 0 Pre-exponential factor for reaction kinetics
A r e a c t o r Cross-sectional area reactor [m2]
a v Volume-related specific surface [1/m]
C Concentration [mol/m3]
c p , g Heat capacity gas [J/(kg∙K)]
d p Particle diameter [m]
d p . 0 Initial particle diameter [m]
D r e a c t o r Reactor diameter [m]
e Oxygen ratio
E A Activation energy [J/(mol)]
f b e , i Mass transfer (component i) between bubble and emulsion phases [kg/(m3∙s)]
h Height [m]
k Reaction constant
k e f f Effective reaction constant
K e q Equilibrium constant
k g s Overall heat transfer coefficient between gas and particle bed [W/(m2∙K)]
k w Overall heat transfer coefficient between gas and reactor wall [W/(m2∙K)]
P Pressure [Pa]
P i Partial pressure of component i [Pa]
R Ideal gas constant [J/(mol∙K)]
r Reaction rate [mol/(m3∙s)]
r m , g g , i b Reaction rate for homogeneous reactions (component i) in bubble phase [kg/(m3∙s)]
r m , g g , i e Reaction rate for homogeneous reactions (component i) emulsion phase [kg/(m3∙s)]
r m , g g , i f Reaction rate for homogeneous reactions (component i) in freeboard [kg/(m3∙s)]
r m , g s , i e Reaction rate for heterogeneous reactions (component i) in emulsion phase [kg/(m3∙s)]
r m , g s , i f Reaction rate for heterogeneous reactions (component i) in emulsion phase [kg/(m3∙s)]
r m o l , i Molar reaction rate (component i) [mol/(m3∙s)]
t Time [s]
T Temperature [K]
T s Temperature at particle surface [K]
T w Temperature at wall [K]
u 0 Superficial velocity in the reactor [m/s]
V Volume [m3]
w i Mass fraction (component i)
w e , i Mass fraction (element e) of component i
X Turnover
β A Mass transfer coefficient [m/s]
ε b Void fraction bubble phase
ε e Void fraction emulsion phase
ε f Void fraction freeboard
η e External efficiency factor
η i Internal efficiency factor
η p Particle efficiency factor
η p o r e Pore efficiency factor
ρ g Density gas [kg/m3]
τ g a s Average gas residence time [s]

Appendix A

Table A1. Comparison between experimental and modeled results.
AuthorTemperature [K]Oxygen
Ratio [-]
Volume Fraction
Experimental Results [-]
Volume Fraction
Modeled [-]
H2COCO2CH4H2COCO2CH4
Manyá et al. [33]
111230.2440.240.270.410.080.230.290.340.14
211230.3070.190.260.470.080.220.290.370.12
311230.3490.160.270.500.070.200.270.420.11
411230.2380.230.270.420.070.250.320.290.15
511230.2860.190.280.450.080.230.300.350.13
611230.3280.150.280.500.070.210.280.400.12
711230.3410.150.280.500.070.210.270.410.12
811230.2970.170.280.470.080.210.270.400.12
911230.2450.240.250.440.070.230.290.340.14
1011230.2910.230.270.430.070.210.270.400.12
1111230.3430.190.270.410.070.230.290.340.14
1211230.2420.250.270.410.070.230.290.340.14
1311230.2930.220.260.460.060.200.270.400.12
1411230.3380.150.250.540.070.190.250.460.11
Kang et al. [34]
110730.20.310.310.230.150.260.240.380.12
211300.20.240.330.290.130.330.300.320.05
310730.10.240.350.280.130.320.280.250.15
410730.150.290.350.240.120.290.260.310.14
510730.250.160.220.500.110.220.220.450.11
610730.30.120.230.560.090.190.190.510.10
de Andrés et al. [35]
110730.20.320.250.310.110.270.260.330.14
211230.20.340.260.270.120.330.340.230.10
311230.30.310.260.340.090.280.320.320.08
411230.40.290.240.410.060.230.270.430.07
510730.30.290.230.400.080.280.130.520.08
611230.30.360.240.330.070.380.200.370.05
710730.30.310.220.390.070.340.100.470.08
811230.30.370.230.330.070.390.140.400.05
Tepper [13]
111000.320.220.290.410.080.240.270.400.10
211180.380.240.300.410.060.230.260.440.07
310990.400.240.320.390.060.200.230.490.08
410450.330.260.280.400.060.160.190.500.15
510690.330.250.250.420.070.190.220.460.13
610800.370.260.260.420.070.190.220.460.13
711000.470.230.250.460.060.170.190.570.07
810720.350.230.310.370.090.190.220.480.12
910960.450.210.330.360.100.170.200.550.08
1010780.450.190.360.350.100.150.180.580.09
1110950.450.230.390.320.070.170.200.560.08

References

  1. Pawlik, V. Verteilung der Weltweiten Energieerzeugung nach Energieträger im Jahr 2022. Statista 2024. Available online: https://de.statista.com/statistik/daten/studie/167998/umfrage/weltweiter-energiemix-nach-energietraeger (accessed on 2 September 2024).
  2. Basu, P. Biomass Gasification, Pyrolysis and Torrefaction, 2nd ed.; Elsevier: Chennai, India, 2013. [Google Scholar]
  3. Gómez-Barea, A.; Leckner, B. Modeling of biomass gasification in fluidized bed. Prog. Energy Combust. Sci. 2010, 36, 444–509. [Google Scholar] [CrossRef]
  4. Baruah, D.; Baruah, D.C. Modeling of biomass gasification: A review. Renew. Sustain. Energy Rev. 2014, 39, 806–815. [Google Scholar] [CrossRef]
  5. Mohan, D.; Pittman, C.U., Jr.; Steele, P.H. Pyrolysis of Wood/Biomass for Bio-oil:  A Critical Review. Energy Fuels 2006, 20, 848–889. [Google Scholar] [CrossRef]
  6. Gerber, S.; Behrendt, F.; Oevermann, M. An Eulerian modeling approach of wood gasification in a bubbling fluidized bed reactor using char as bed material. Fuel 2010, 89, 2903–2917. [Google Scholar] [CrossRef]
  7. Wang, Y.; Yan, L. CFD modeling of a fluidized bed sewage sludge gasifier for syngas. Asia-Pac. J. Chem. Eng. 2008, 3, 161–170. [Google Scholar] [CrossRef]
  8. Kinoshita, C.M.; Wang, Y.; Takahashi, P.K. Chemical Equilibrium Computations for Gasification of Biomass to Produce Methanol. Energy Sources 1991, 13, 361–368. [Google Scholar] [CrossRef]
  9. Li, X.; Grace, J.R.; Watkinson, A.P.; Lim, C.J.; Ergüdenler, A. Equilibrium modeling of gasification: A free energy minimization approach and its application to a circulating fluidized bed coal gasifier. Fuel 2001, 80, 195–207. [Google Scholar] [CrossRef]
  10. Puig-Gamero, M.; Pio, D.T.; Tarelho, L.A.C.; Sánchez, P.; Sanchez-Silva, L. Simulation of biomass gasification in bubbling fluidized bed reactor using Aspen Plus®. Energy Convers. Manag. 2021, 235, 113981. [Google Scholar] [CrossRef]
  11. Nikoo, M.B.; Mahinpey, N. Simulation of biomass gasification in fluidized bed reactor using ASPEN PLUS. Biomass. Bioenergy 2008, 32, 1245–1254. [Google Scholar] [CrossRef]
  12. Kunii, D.; Levenspiel, O.; Brenner, H. Fluidization Engineering, 2nd ed.; Butterworth-Heinemann: Oxford, UK, 2013. [Google Scholar]
  13. Tepper, H. Zur Vergasung von Rest- und Abfallholz in Wirbelschichtreaktoren für Dezentrale Energieversorgungsanlagen. 2005. Available online: https://opendata.uni-halle.de//handle/1981185920/10692 (accessed on 3 June 2024).
  14. Pilar González-Vázquez, M.; Rubiera, F.; Pevida, C.; Pio, D.T.; Tarelho, L.A.C. Thermodynamic Analysis of Biomass Gasification Using Aspen Plus: Comparison of Stoichiometric and Non-Stoichiometric Models. Energies 2021, 14, 189. [Google Scholar] [CrossRef]
  15. Zhu, F.; Shen, L.; Xu, P.; Yuan, H.; Hu, M.; Qi, J.; Chen, J. Numerical Simulation of an Improved Updraft Biomass Gasifier Based on Aspen Plus. Int. J. Environ. Res. Public Health 2022, 19, 17089. [Google Scholar] [CrossRef]
  16. Tavares, R.; Monteiro, E.; Tabet, F.; Rouboa, A. Numerical investigation of optimum operating conditions for syngas and hydrogen production from biomass gasification using Aspen Plus. Renew. Energy 2020, 146, 1309–1314. [Google Scholar] [CrossRef]
  17. Azeez, K.T.A.; Poyilil, S.C.M.; Palatel, A. Aspen Plus Simulation of Biomass Gasification: A Comprehensive Model Incorporating Reaction Kinetics, Hydrodynamics and Tar Production. Process Integr. Optim. Sustain. 2022, 7, 255–268. [Google Scholar] [CrossRef]
  18. Arthur, J.R. Reactions between carbon and oxygen. Trans. Faraday Soc. 1951, 47, 164–178. [Google Scholar] [CrossRef]
  19. Neves, D.; Thunman, H.; Matos, A.; Tarelho, L.; Gómez-Barea, A. Characterization and prediction of biomass pyrolysis products. Prog. Energy Combust. Sci. 2011, 37, 611–630. [Google Scholar] [CrossRef]
  20. Wagenaar, B.M.; Prins, W.; van Swaaij, W.P.M. Flash pyrolysis kinetics of pine wood. Fuel Process Technol. 1993, 36, 291–298. [Google Scholar] [CrossRef]
  21. Adánez, J.; de Diego, L.F.; García-Labiano, F.; Abad, A.; Abanades, J.C. Determination of Biomass Char Combustion Reactivities for FBC Applications by a Combined Method. Ind. Eng. Chem. Res. 2001, 40, 4317–4323. [Google Scholar] [CrossRef]
  22. Smooth, L.D.; Smith, P.J. Coal Combustion and Gasification, 1st ed.; Springer: New York, NY, USA, 1985. [Google Scholar]
  23. Mitani, T.; Williams, F.A. Studies of cellular flames in hydrogen, oxygen, nitrogen mixtures. Combust. Flame 1980, 39, 169–190. [Google Scholar] [CrossRef]
  24. Groppi, G.; Tronconi, E.; Forzatti, P.; Berg, M. Mathematical modelling of catalytic combustors fuelled by gasified biomasses. Catal. Today 2000, 59, 151–162. [Google Scholar] [CrossRef]
  25. Dryer, F.L.; Glassman, I. High-temperature oxidation of CO and CH4. Symp. Int. Combust. 1973, 14, 987–1003. [Google Scholar] [CrossRef]
  26. Cozzani, V. Reactivity in Oxygen and Carbon Dioxide of Char Formed in the Pyrolysis of Refuse-Derived Fuel. Ind. Eng. Chem. Res. 2000, 39, 864–872. [Google Scholar] [CrossRef]
  27. Barrio, M.; Gøbel, B.; Rimes, H.; Henriksen, U.; Hustad, J.E.; Sørensen, L.H. Steam Gasification of Wood Char and the Effect of Hydrogen Inhibition on the Chemical Kinetics. In Progress in Thermochemical Biomass Conversion; John Wiley & Sons, Ltd.: Hoboken, NJ, USA, 2001; pp. 32–46. [Google Scholar] [CrossRef]
  28. Cozzani, V.; Nicolella, C.; Petarca, L.; Rovatti, M.; Tognotti, L. A Fundamental Study on Conventional Pyrolysis of a Refuse-Derived Fuel. Ind. Eng. Chem. Res. 1995, 34, 2006–2020. [Google Scholar] [CrossRef]
  29. Biba, V.; Macak, J.; Klose, E.; Malecha, J. Mathematical model for coal gasification under pressure. Ind. Eng. Chem. Process. Dev. 1978, 17, 92–98. [Google Scholar] [CrossRef]
  30. Yoon, H.; Wei, J.; Denn, M.M. A model for moving-bed coal gasification reactors. AIChE J. 1978, 24, 885–903. [Google Scholar] [CrossRef]
  31. Jones, W.P.; Lindstedt, R.P. Global reaction schemes for hydrocarbon combustion. Combust. Flame 1988, 73, 233–249. [Google Scholar] [CrossRef]
  32. Stephan, P.; Kabelac, S.; Kind, M.; Mewes, D.; Schaber, K.; Wetzel, T. VDI-Wärmeatlas: Fachlicher Träger VDI-Gesellschaft Verfahrenstechnik und Chemieingenieurwesen, 12th ed.; Springer: Berlin/Heidelberg, Germany, 2019. [Google Scholar]
  33. Manyà, J.J.; Aznar, M.; Sánchez, J.L.; Arauzo, J.; Murillo, M.B. Further Experiments on Sewage Sludge Air Gasification:  Influence of the Nonstationary Period on the Overall Results. Ind. Eng. Chem. Res. 2006, 45, 7313–7320. [Google Scholar] [CrossRef]
  34. Kang, S.-W.; Dong, J.-I.; Kim, J.-M.; Lee, W.-C.; Hwang, W.-G. Gasification and its emission characteristics for dried sewage sludge utilizing a fluidized bed gasifier. J. Mater. Cycles Waste Manag. 2011, 13, 180–185. [Google Scholar] [CrossRef]
  35. de Andrés, J.M.; Narros, A.; Rodríguez, M.E. Air-steam gasification of sewage sludge in a bubbling bed reactor: Effect of alumina as a primary catalyst. Fuel Process Technol. 2011, 92, 433–440. [Google Scholar] [CrossRef]
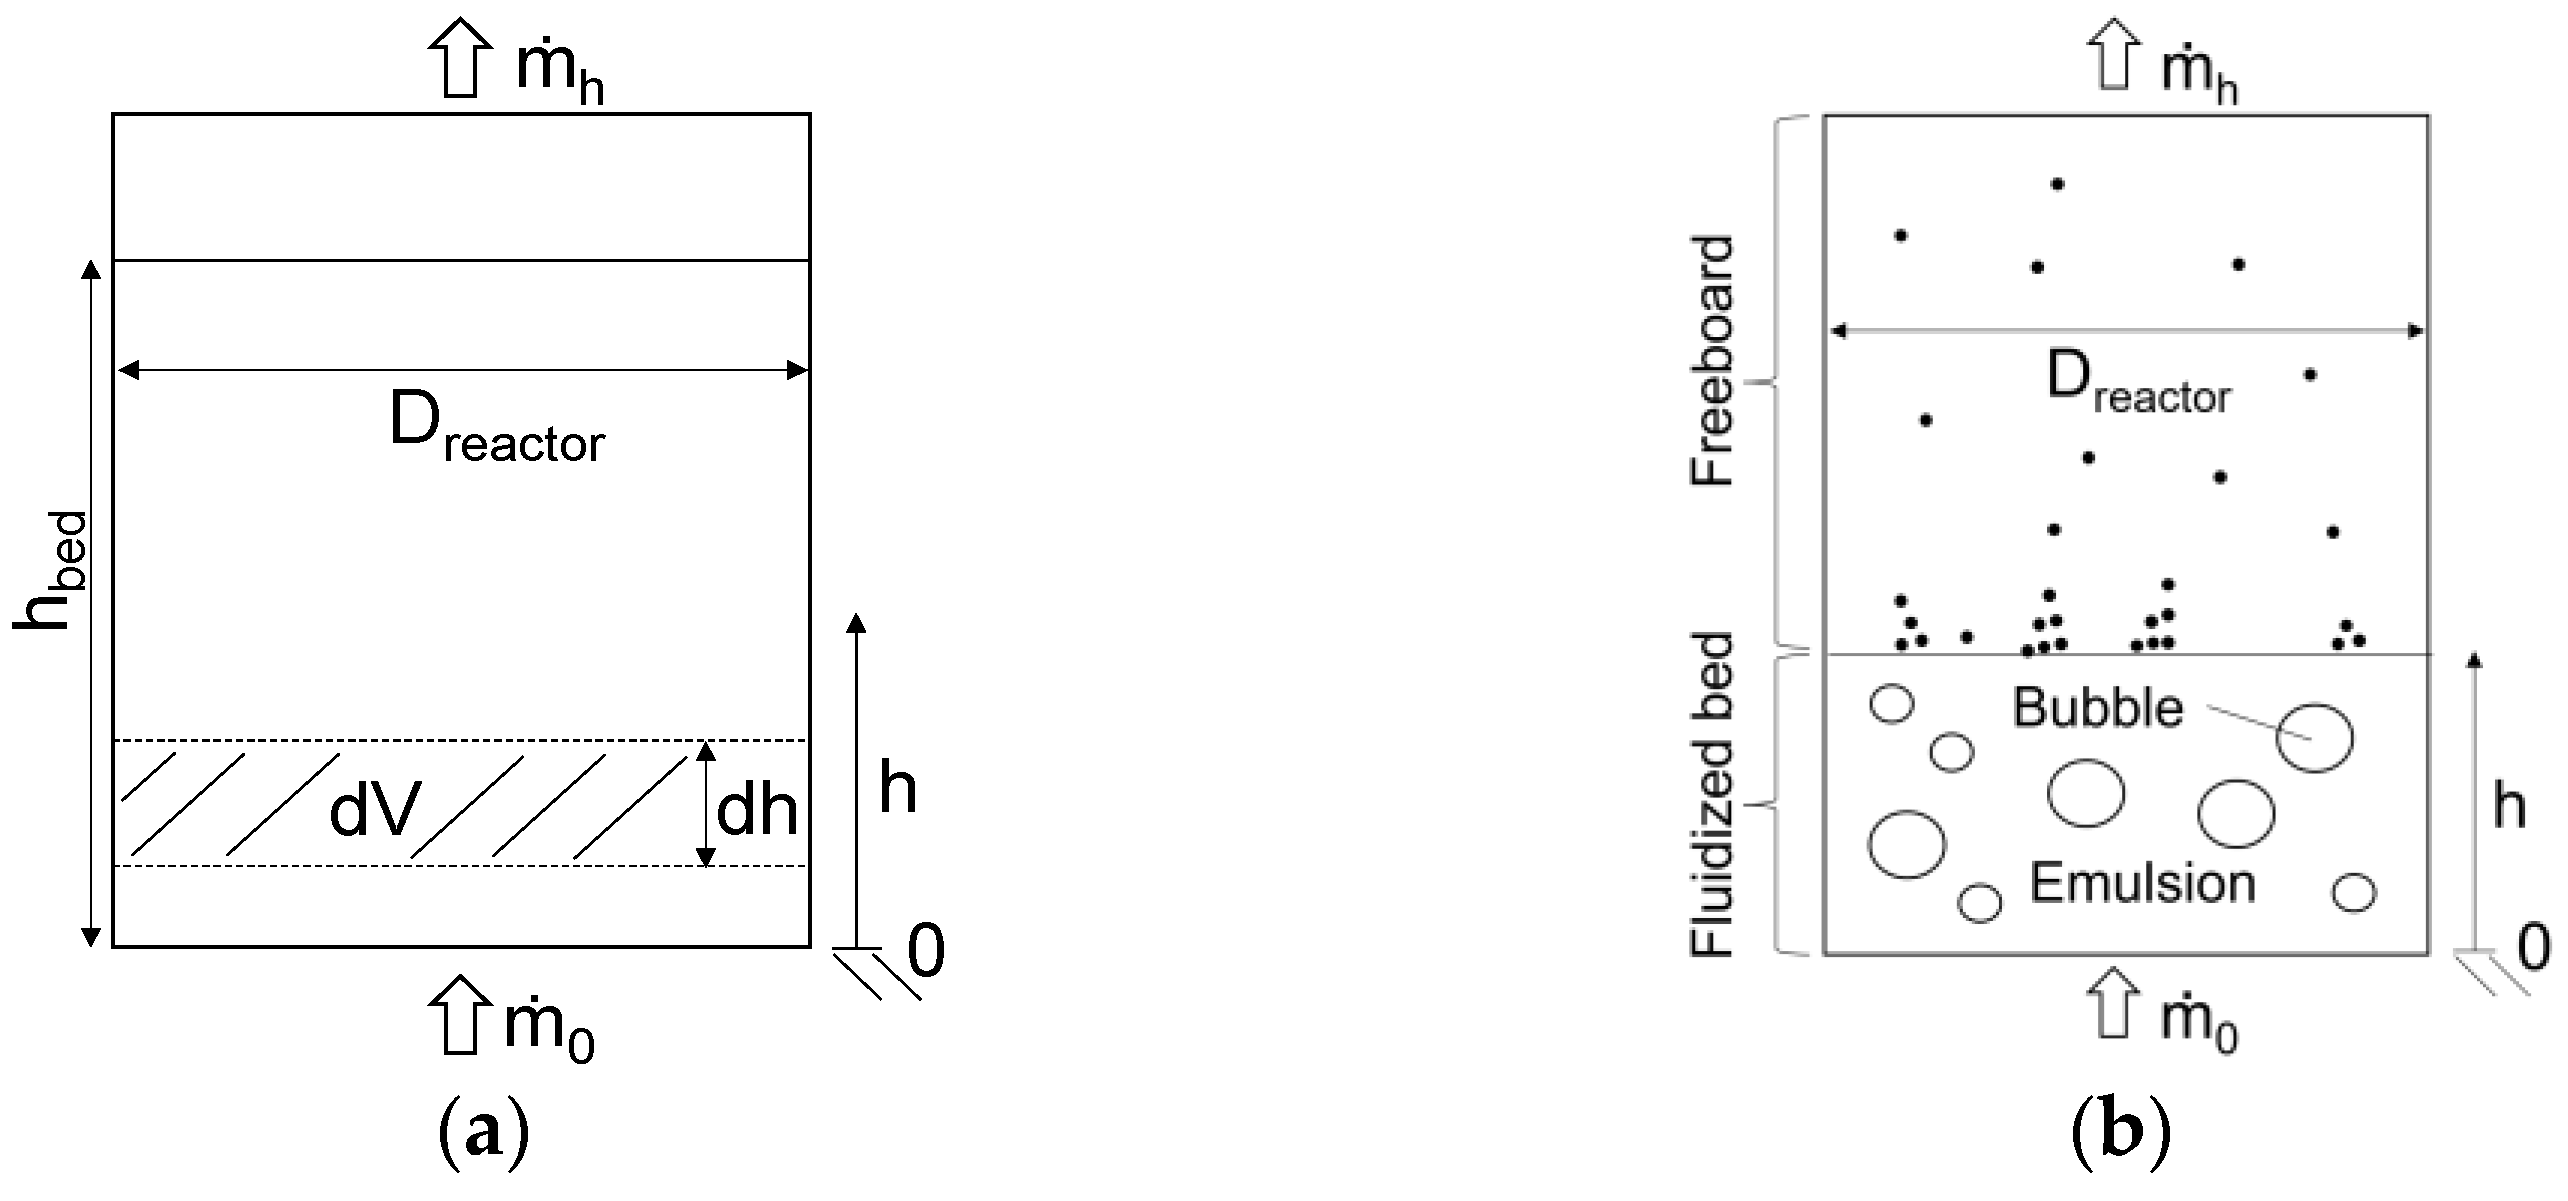
Figure 1. Reactor types of the gasification model with the height section d h , bed height h b e d , reactor diameter D r e a c t o r , volume section d V , and mass flow m ˙ : (a) fixed bed reactor; (b) fluidized bed reactor.
Chemengineering 08 00094 g001
Figure 2. Fluidized bed reactor approach [3] with the void fraction ε , velocity v , height section d h , exchange mass flow f b e , i , and mass flow m ˙ : (a) fluidized bed section; (b) freeboard section.
Chemengineering 08 00094 g002
Figure 3. Created template in DWSIM.
Chemengineering 08 00094 g003
Figure 4. Mass fraction profile for pyrolysis with an incoming biomass mass fraction of C = 0.50 , H = 0.07 , and O = 0.42 at T = 1123   K and p = 1.013   b a r : (a) biomass devolatilization into char, tar, gas, and water; (b) detailed gas composition of biomass devolatilization.
Chemengineering 08 00094 g004
Figure 5. Syngas volume fraction profile containing hydrogen, carbon monoxide, carbon dioxide, methane, and oxygen for reactions R2–R11 in the fluidized bed section at T = 1123   K , e = 0.3 , and p = 1.013   b a r .
Chemengineering 08 00094 g005
Figure 6. Syngas volume fraction profile containing hydrogen, carbon monoxide, carbon dioxide, and methane for reactions R7–R11 in the freeboard section at T = 1123   K , e = 0.3 , and p = 1.013   b a r .
Chemengineering 08 00094 g006
Figure 7. Model results for syngas composition containing hydrogen, carbon monoxide, carbon dioxide, and methane by varying oxygen and steam ratios: (a) different oxygen ratios at T = 1123   K ,   p = 1.013   b a r ,   τ = 8   s , and s = 0 ; (b) different steam ratios at T = 1123   K ,   τ = 7   s ,   e = 0.3 , and p = 1.013   b a r .
Chemengineering 08 00094 g007
Figure 8. Model results for syngas composition containing hydrogen, carbon monoxide, carbon dioxide, and methane by varying average residence times and temperatures: (a) different average residence times at T = 1123   K ,   e = 0.3 ,   s = 0 , and p = 1.013   b a r ; (b) different temperatures at τ = 8   s ,   e = 0.3 ,   s = 0 , and p = 1.013   b a r .
Chemengineering 08 00094 g008
Figure 9. Comparison between different modeled reactor types: isothermal and non-isothermal fixed bed reactor and fluidized bed reactor with a height of h = 3   m and a diameter of D = 1.5   m at T = 1123   K ,   p = 1.013   b a r ,   τ = 8   s ,   s = 0 , and e = 0.3 .
Chemengineering 08 00094 g009
Figure 10. Gas temperature profile for biomass gasification of a non-isothermal fluidized bed reactor with a height of h = 1.5   m , a diameter of D = 1.5   m , and an average residence time τ g a s = 8   s at p = 1.013   b a r .
Chemengineering 08 00094 g010
Figure 11. Comparison between the model and the literature of Manyá et al. [33], Kang et al. [34], de Andrés et al. [35], and Tepper [13]: volume fraction of methane and hydrogen; no deviation on the continuous line; deviations of s = ± 0.1 in the area of the interrupted lines.
Chemengineering 08 00094 g011
Figure 12. Comparison between the model and the literature of Manyá et al. [33], Kang et al. [34], de Andrés et al. [35], and Tepper [13]: volume fraction of carbon monoxide and carbon dioxide; no deviation on the continuous line; deviations of s = ± 0.1 in the area of the interrupted lines.
Chemengineering 08 00094 g012
Table 1. Considered reactions for the gasification model.
No.NameStoichiometry
R1Devolatilization B i o m a s s c h a r + t a r + C O 2 + C O + C H 4 + H 2 + H 2 O
R2Char combustion β C + O 2 2 β 1 C O + 2 β C O 2
β = C O C O 2 = 2511 · e 6240 T [18]
R3Partial tar oxidation C n H m + n 2 O 2 n C O + m 2 H 2
R4Hydrogen oxidation H 2 + 1 2 O 2 H 2 O
R5Methane oxidation C H 4 + 1 2 O 2 C O + 2 H 2
R6Carbon monoxide oxidation C O + 1 2 O 2 C O 2
R7Boudouard reaction C + C O 2 2 C O
R8Steam gasification C + H 2 O C O + H 2
R9Thermal tar cracking C n H m m 4 C H 4 + n m 4 C
R10Water–gas shift reaction C O + H 2 O C O 2 + H 2
R11Methanation C H 4 + 2 H 2 O C O 2 + 4 H 2
Table 2. Kinetics for the considered reactions.
No.A0EA k J m o l Reaction SchemeSource
R1-- w b i o w c h a r + w t a r + w H 2 + w C O + w C O 2 + w C H 4 + w H 2 O [19]
1.4 · 10 10 1 s 150 d w b i o d t = k · w b i o [20]
R2 1.0   m 3 m 2 · s · K · b a r 68 d X d t = k · T · a V · P O 2 · 1 X [21]
R3 5.9 · 10 2 m 3 k m o l 0.5 1 K · P a 0.3 · s 80 r = k · T · p 0.3 · C O 2 · C t a r 0.5 [22] 1
R4 2.2 · 10 9 m 3 k m o l · s 110 r = k · C H 2 · C O 2 [23,24]
R5 5.0 · 10 11 m 3 k m o l 0.5 1 s 203 r = k · C C H 4 0.7 · C O 2 0.8 [25]
R6 2.3 · 10 12 m 3 k m o l 0.75 1 s 167 r = k · C C O · C O 2 0.25 · C H 2 O 0.5 [25]
R7 4.2 · 10 7 1 b a r 0.72 · s 221 d X d t = k · P C O 2 0.72 · 1 X [26]
R8 2.6 · 10 8 1 P a 0.57 · s 237 d X d t = k · P H 2 O 0.57 · 1 X [27]
R9 4.1 · 10 4 1 s 102 d X d t = k · 1 X [28]
R10 2.8 · 10 3 m 3 k m o l · s 13 r = k · C C O · C H 2 O C C O 2 · C H 2 K e q , s h i f t [29]
K e q , s h i f t = 0.027 · e 32.89 k J m o l R T [30]
R11 3.0 · 10 5
3.0 · 10 8 m 3 k m o l · s
125 r = k · C C H 4 · C H 2 O 2 C C O 2 · C H 2 4 K e q , m e t h [31] 2
K e q , m e t h = 6.1 · 10 13 · e 262 k J m o l R T [3]
1 Smoot and Smith [22] introduced two kinetics for tar oxidation. A mix of both kinetics is used. 2 Depending on the reactor scheme and operation mode, the factor A 0 was selected in the specified range.
Table 3. Pyrolysis products for different biomass types.
Biomass Specification [kg/kg] 1Product Composition [kg/kg]
CHOCharTarH2COCO2CH4H2O
Cardoon0.430.040.440.220.420.00030.050.140.0070.16
Wheat straw0.490.050.410.210.490.00030.050.090.0070.15
Pine sawdust0.450.070.410.210.450.00030.050.060.0070.22
Coir pith0.440.050.430.220.440.00030.050.120.0070.16
1 Table excerpt from Neves et al. [19].
Table 4. Initial conditions of experimental data.
Manyá et al. [33]Kang et al. [34]De Andrés et al. [35]Tepper [13]
Reactor height [m]0.30.60.73.0
Reactor diameter [m]0.040.070.030.40
Volume stream [m3/h]0.18–0.31.1–1.4 10.20–0.26110–270
Gas velocity [m/s]0.04–0.070.08–0.10 10.06–0.090.25–0.60
Residence time [s]4–76–8 17–105–12
Biomass compositionC [kg/kg]0.550.400.280.50
H [kg/kg]0.070.060.050.07
O [kg/kg]0.280.470.620.42
Moisture [kg/kg]0.090.060.070.00
1 Own estimation, as no data were available.
Disclaimer/Publisher’s Note: The statements, opinions and data contained in all publications are solely those of the individual author(s) and contributor(s) and not of MDPI and/or the editor(s). MDPI and/or the editor(s) disclaim responsibility for any injury to people or property resulting from any ideas, methods, instructions or products referred to in the content.