
Recycling of Walnut Shell Biomass for Adsorptive Removal of Hazardous Dye Alizarin Red from Aqueous Solutions Using Magnetic Nanocomposite: Process Optimization, Kinetic, Isotherm, and Thermodynamic Investigation

 ,
, 
 and
and 
Abstract
1. Introduction
2. Materials and Methods
2.1. Chemicals and Reagents
2.2. Instrumentation
2.3. Synthesis of Walnut Shell-Activated Carbon Magnetic Nanocomposites Adsorbent
2.4. Batch Adsorption Studies
2.5. Desorption and Reusability Studies
3. Results and Discussion
3.1. Characterization of Synthesized MNC Adsorbent
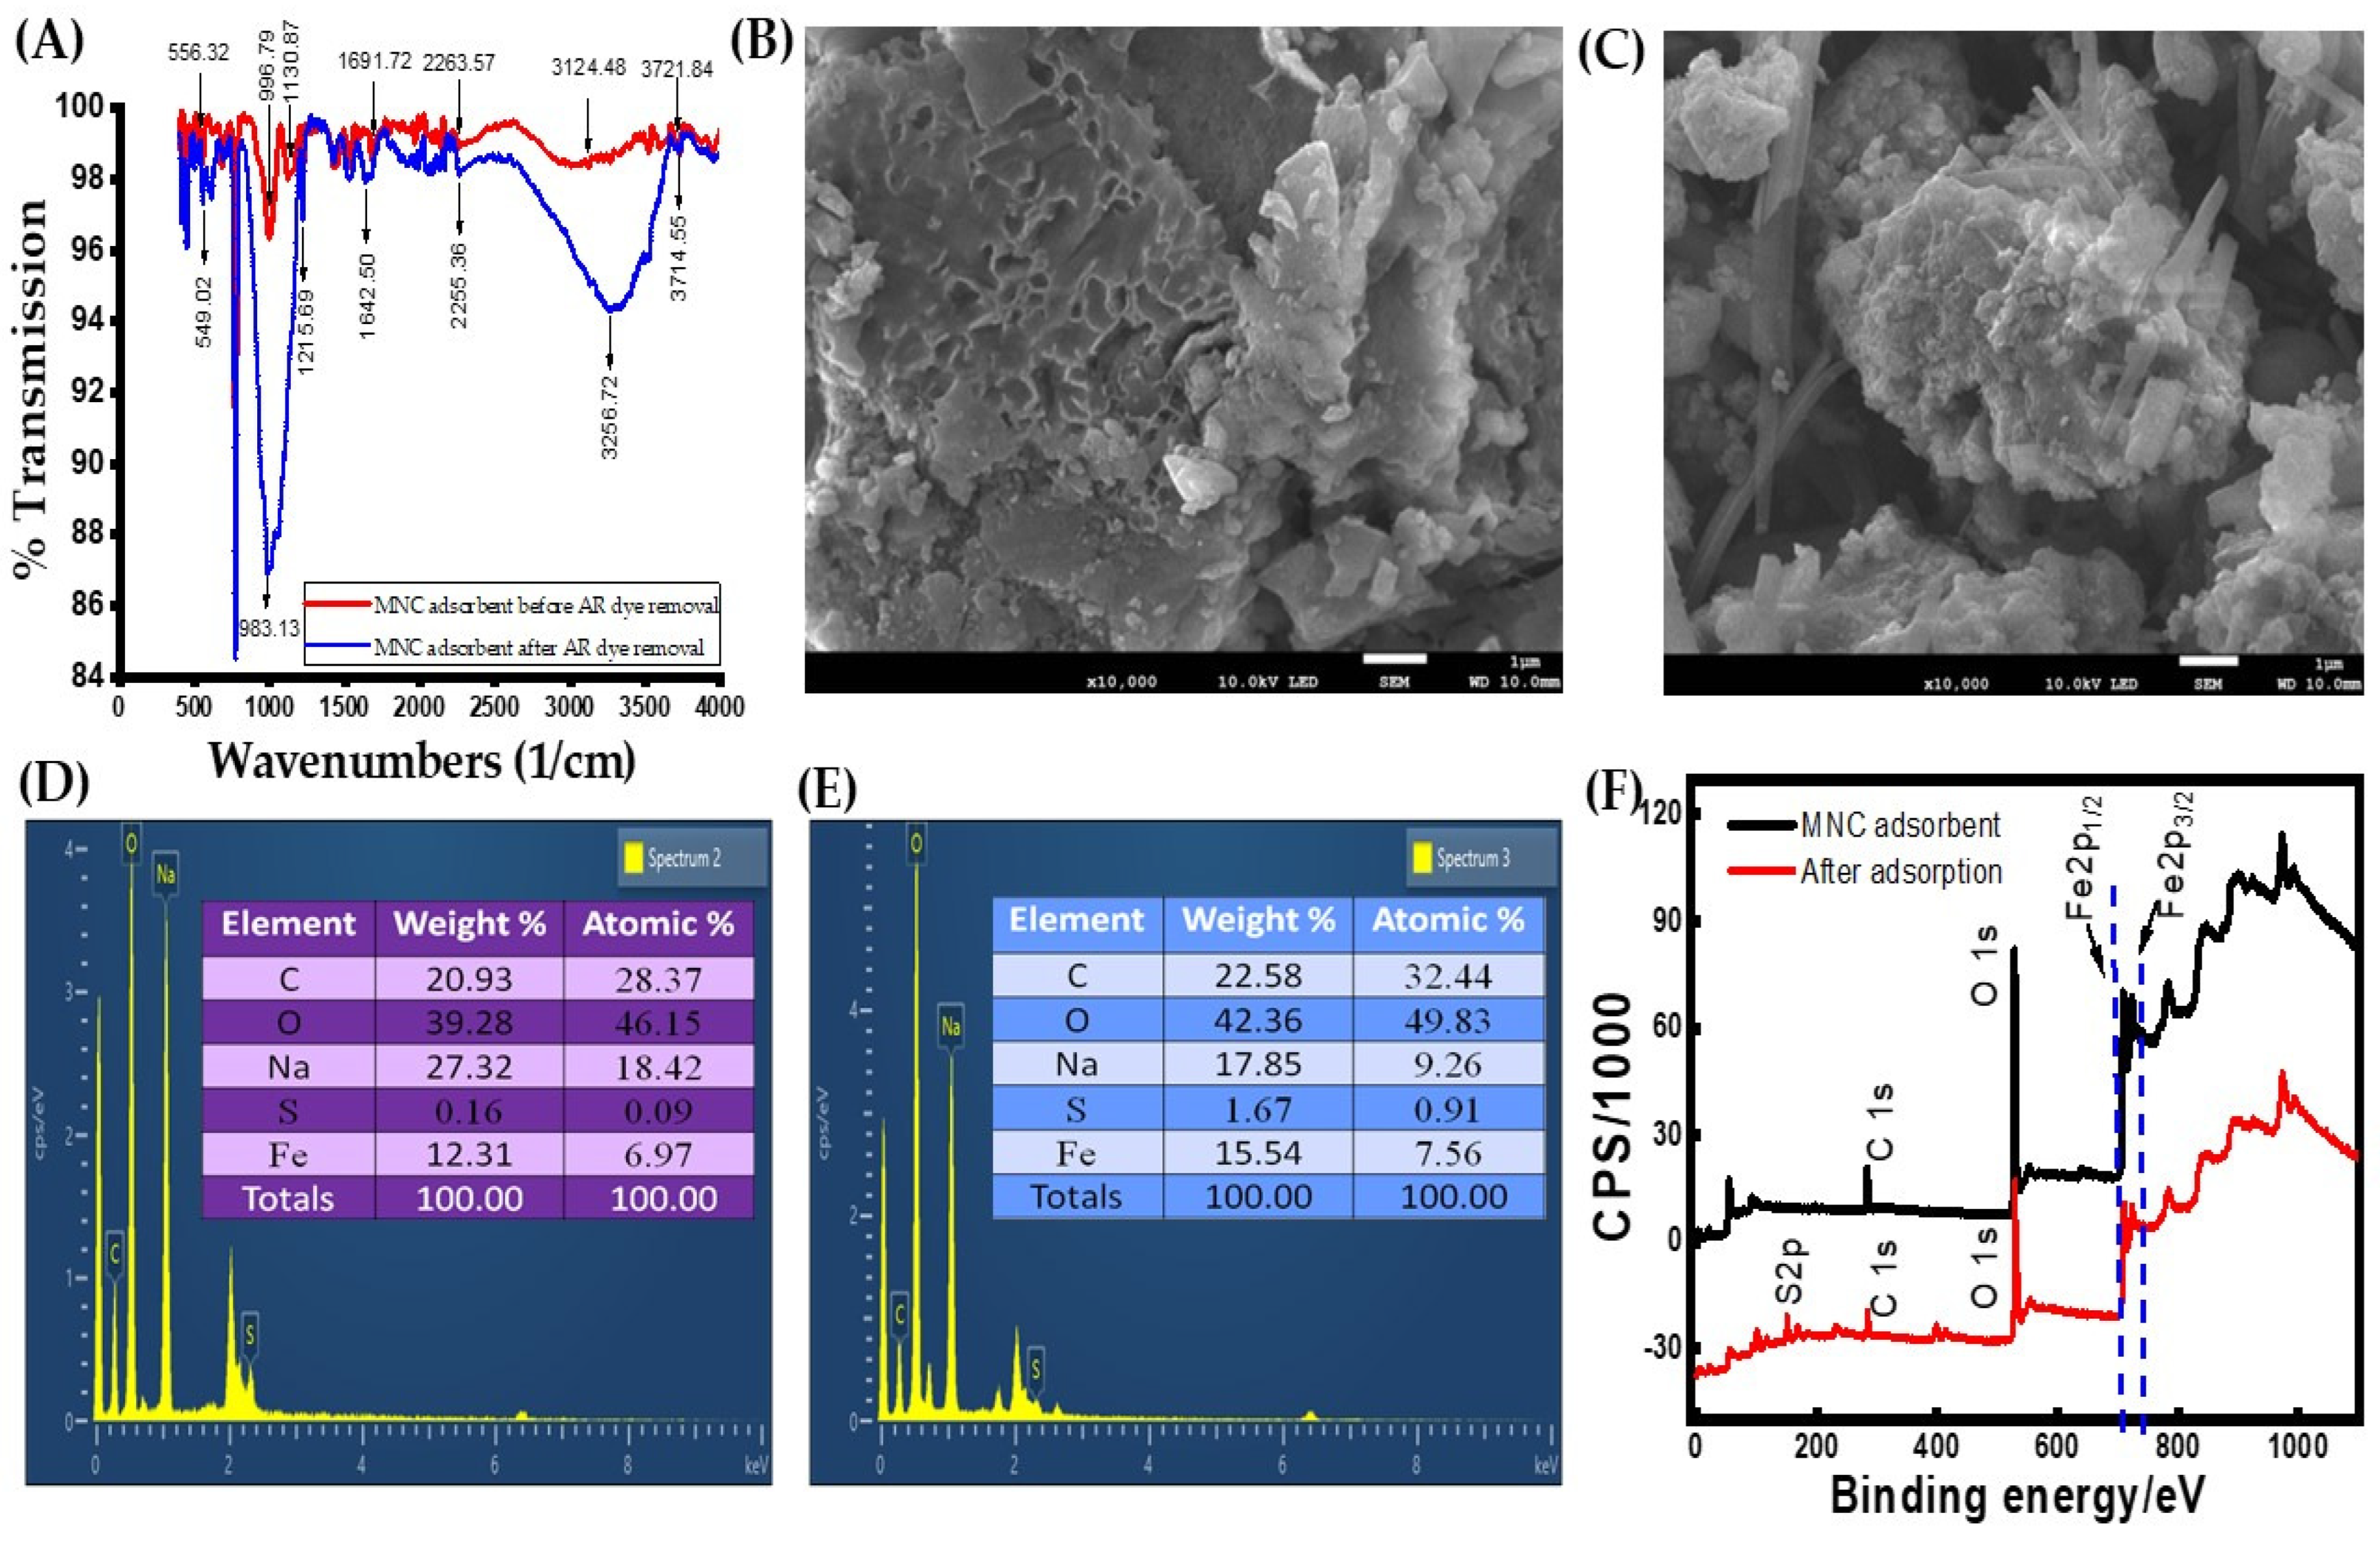
3.1.1. FT-IR Analysis
3.1.2. Morphological Analysis of MNC by FE-SEM/EDS
3.1.3. XPS Analysis
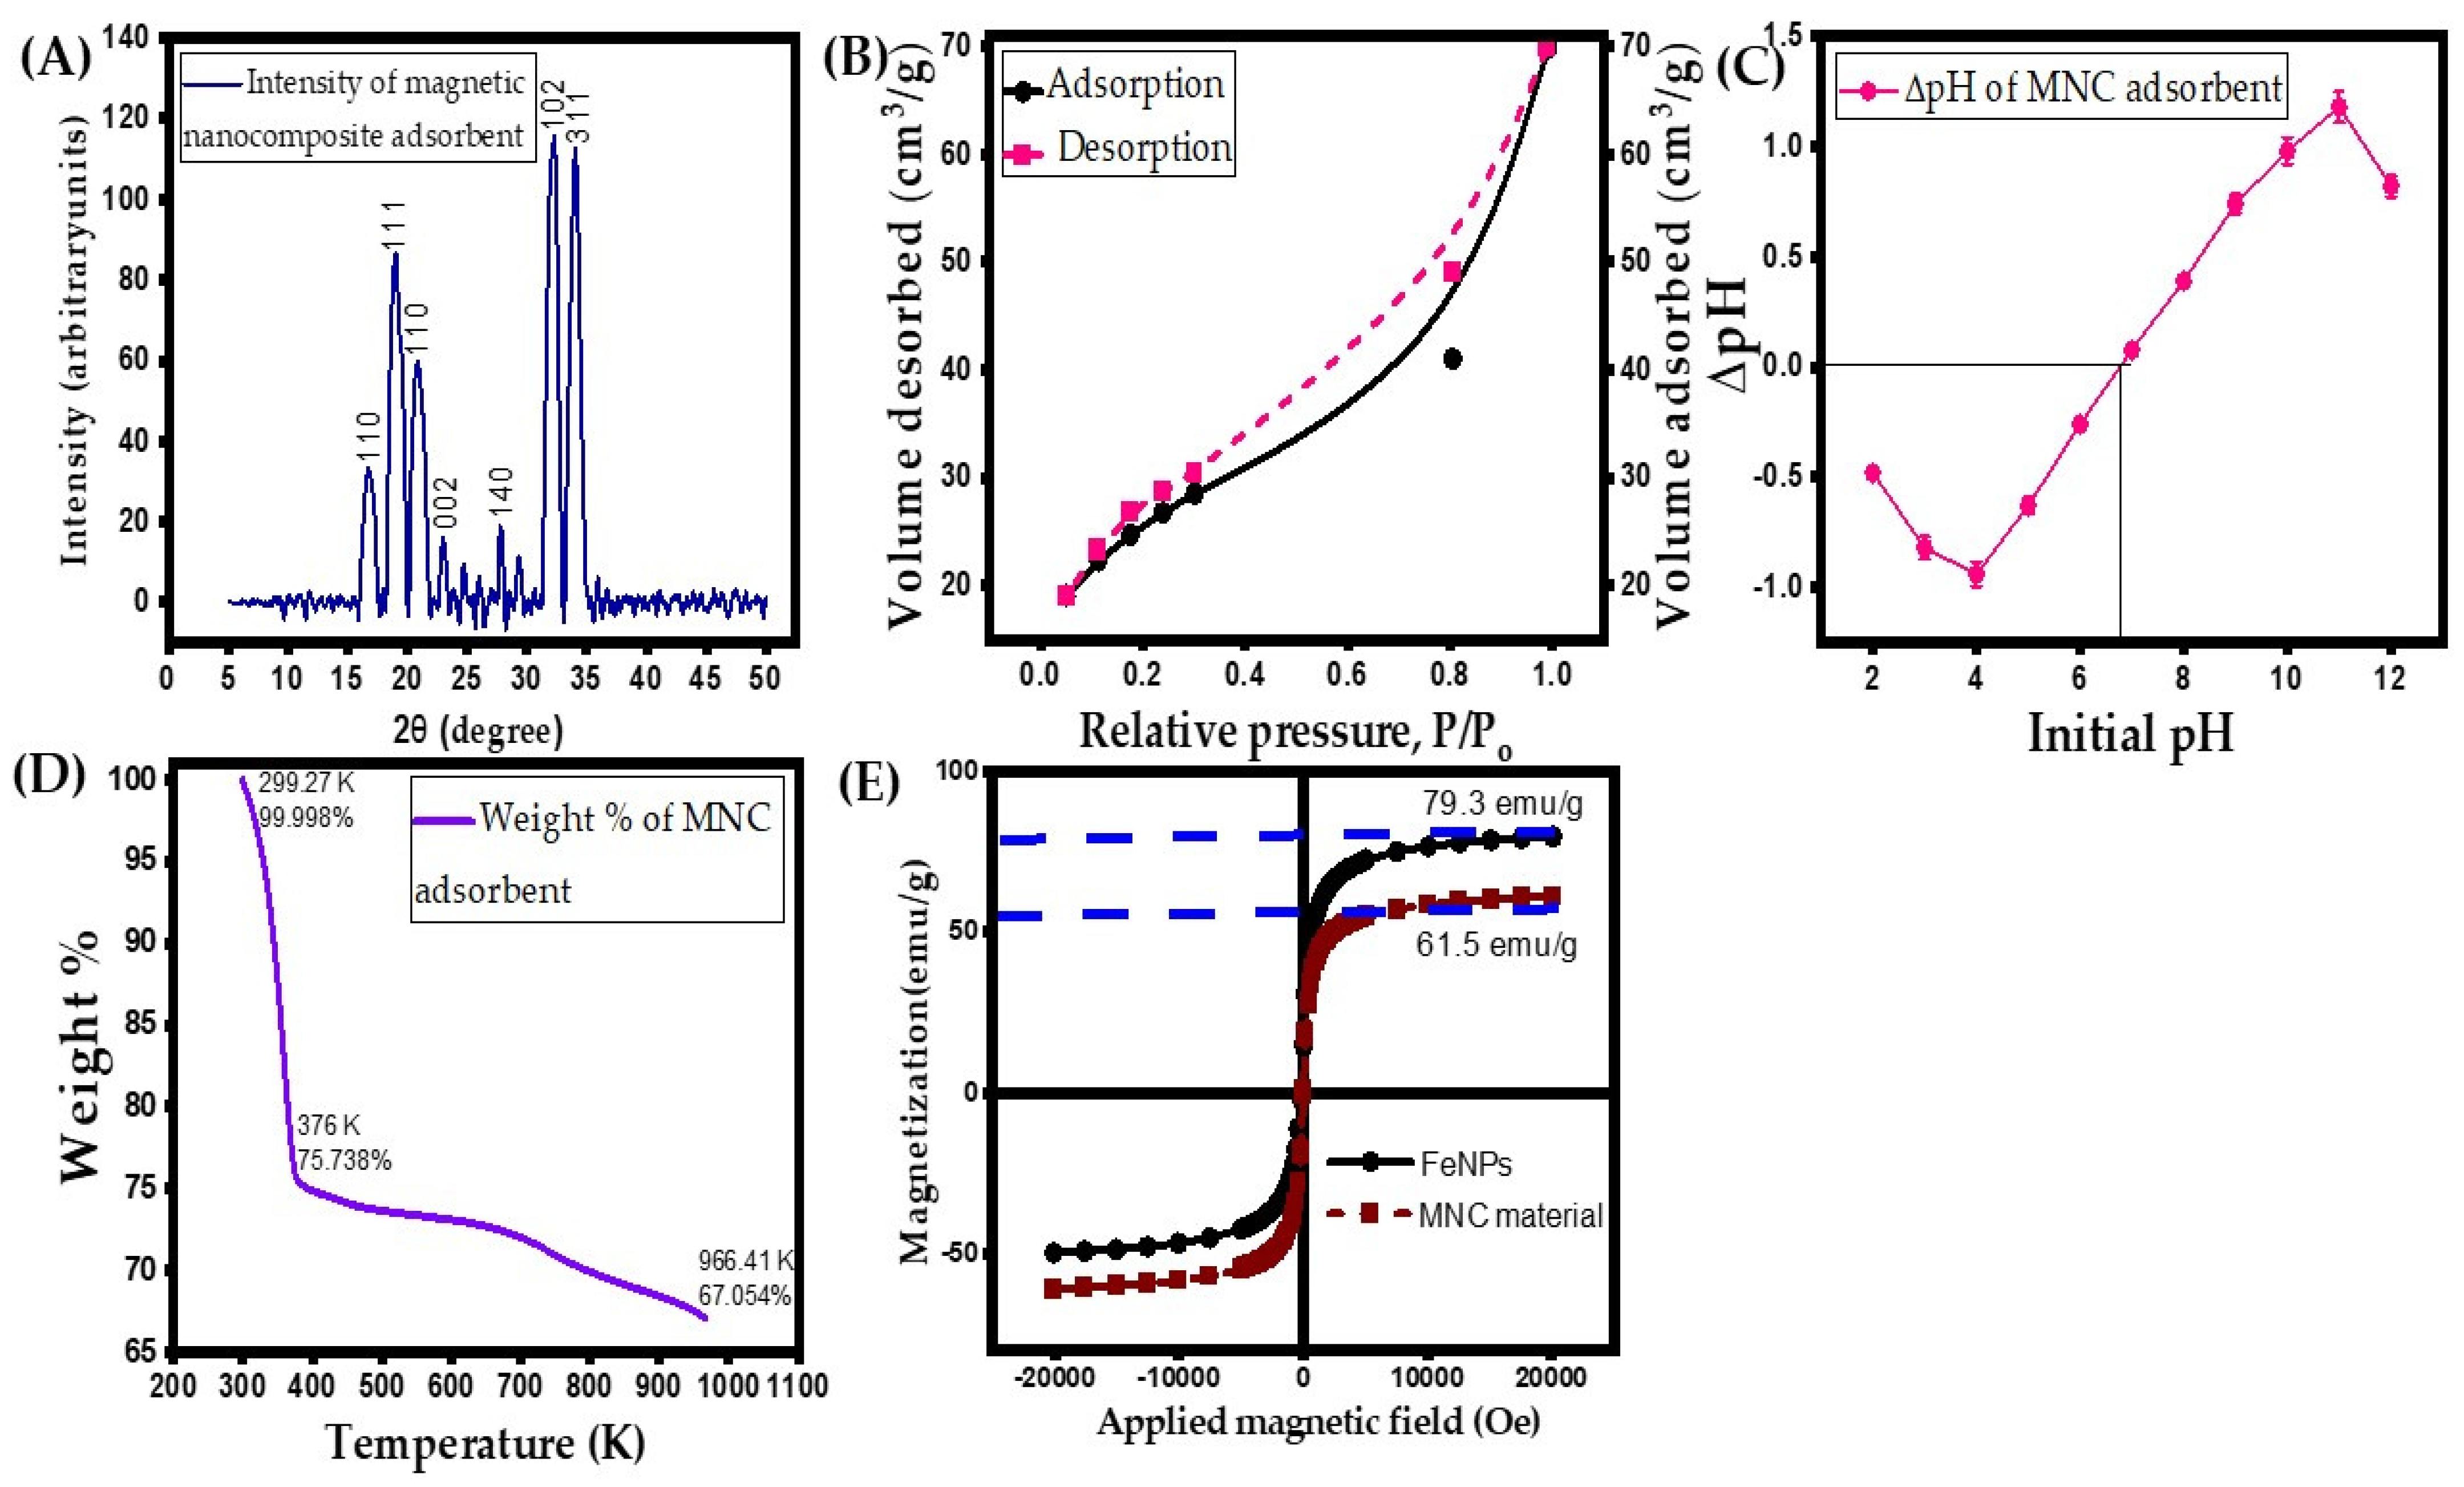
3.1.4. XRD Analysis
3.1.5. BET Surface Area, Zero-Point Charge and Particle Size Investigations
3.1.6. TG Analysis
3.1.7. VSM Analysis
3.2. Investigation of Experimental Studies Conducted in Batch Mode to Eliminate AR Dye from Wastewater Using MNC Adsorbent
3.2.1. Effect of Acidity and Alkalinity on AR Dye Solution
3.2.2. Impact of Initial Concentration of AR Dye
3.2.3. Influence of MNC Adsorbent Particle Size (Dp)
3.2.4. Effect of Dosage of MNC Adsorbent
3.2.5. Impact of Agitation Velocity
3.2.6. Effect of Ionic Strength
3.3. Designing Experiments to Optimize Process Parameters and Analyze Empirical Data
3.3.1. Fitting of the Experimental Data in the Quadratic Model
− 1.16 X32 − 1.01 X42− 0.61 X1 X2 − 0.47 X1 X3 − 0.57 X1X4 − 0.75 X2X3 − 0.94 X2X4 − 0.46 X3X4
3.3.2. Analysis of Surface of Response as Well as Contour Figures
3.4. Kinetic and Isotherm Models for Abatement of AR Dye from Simulated Wastewater
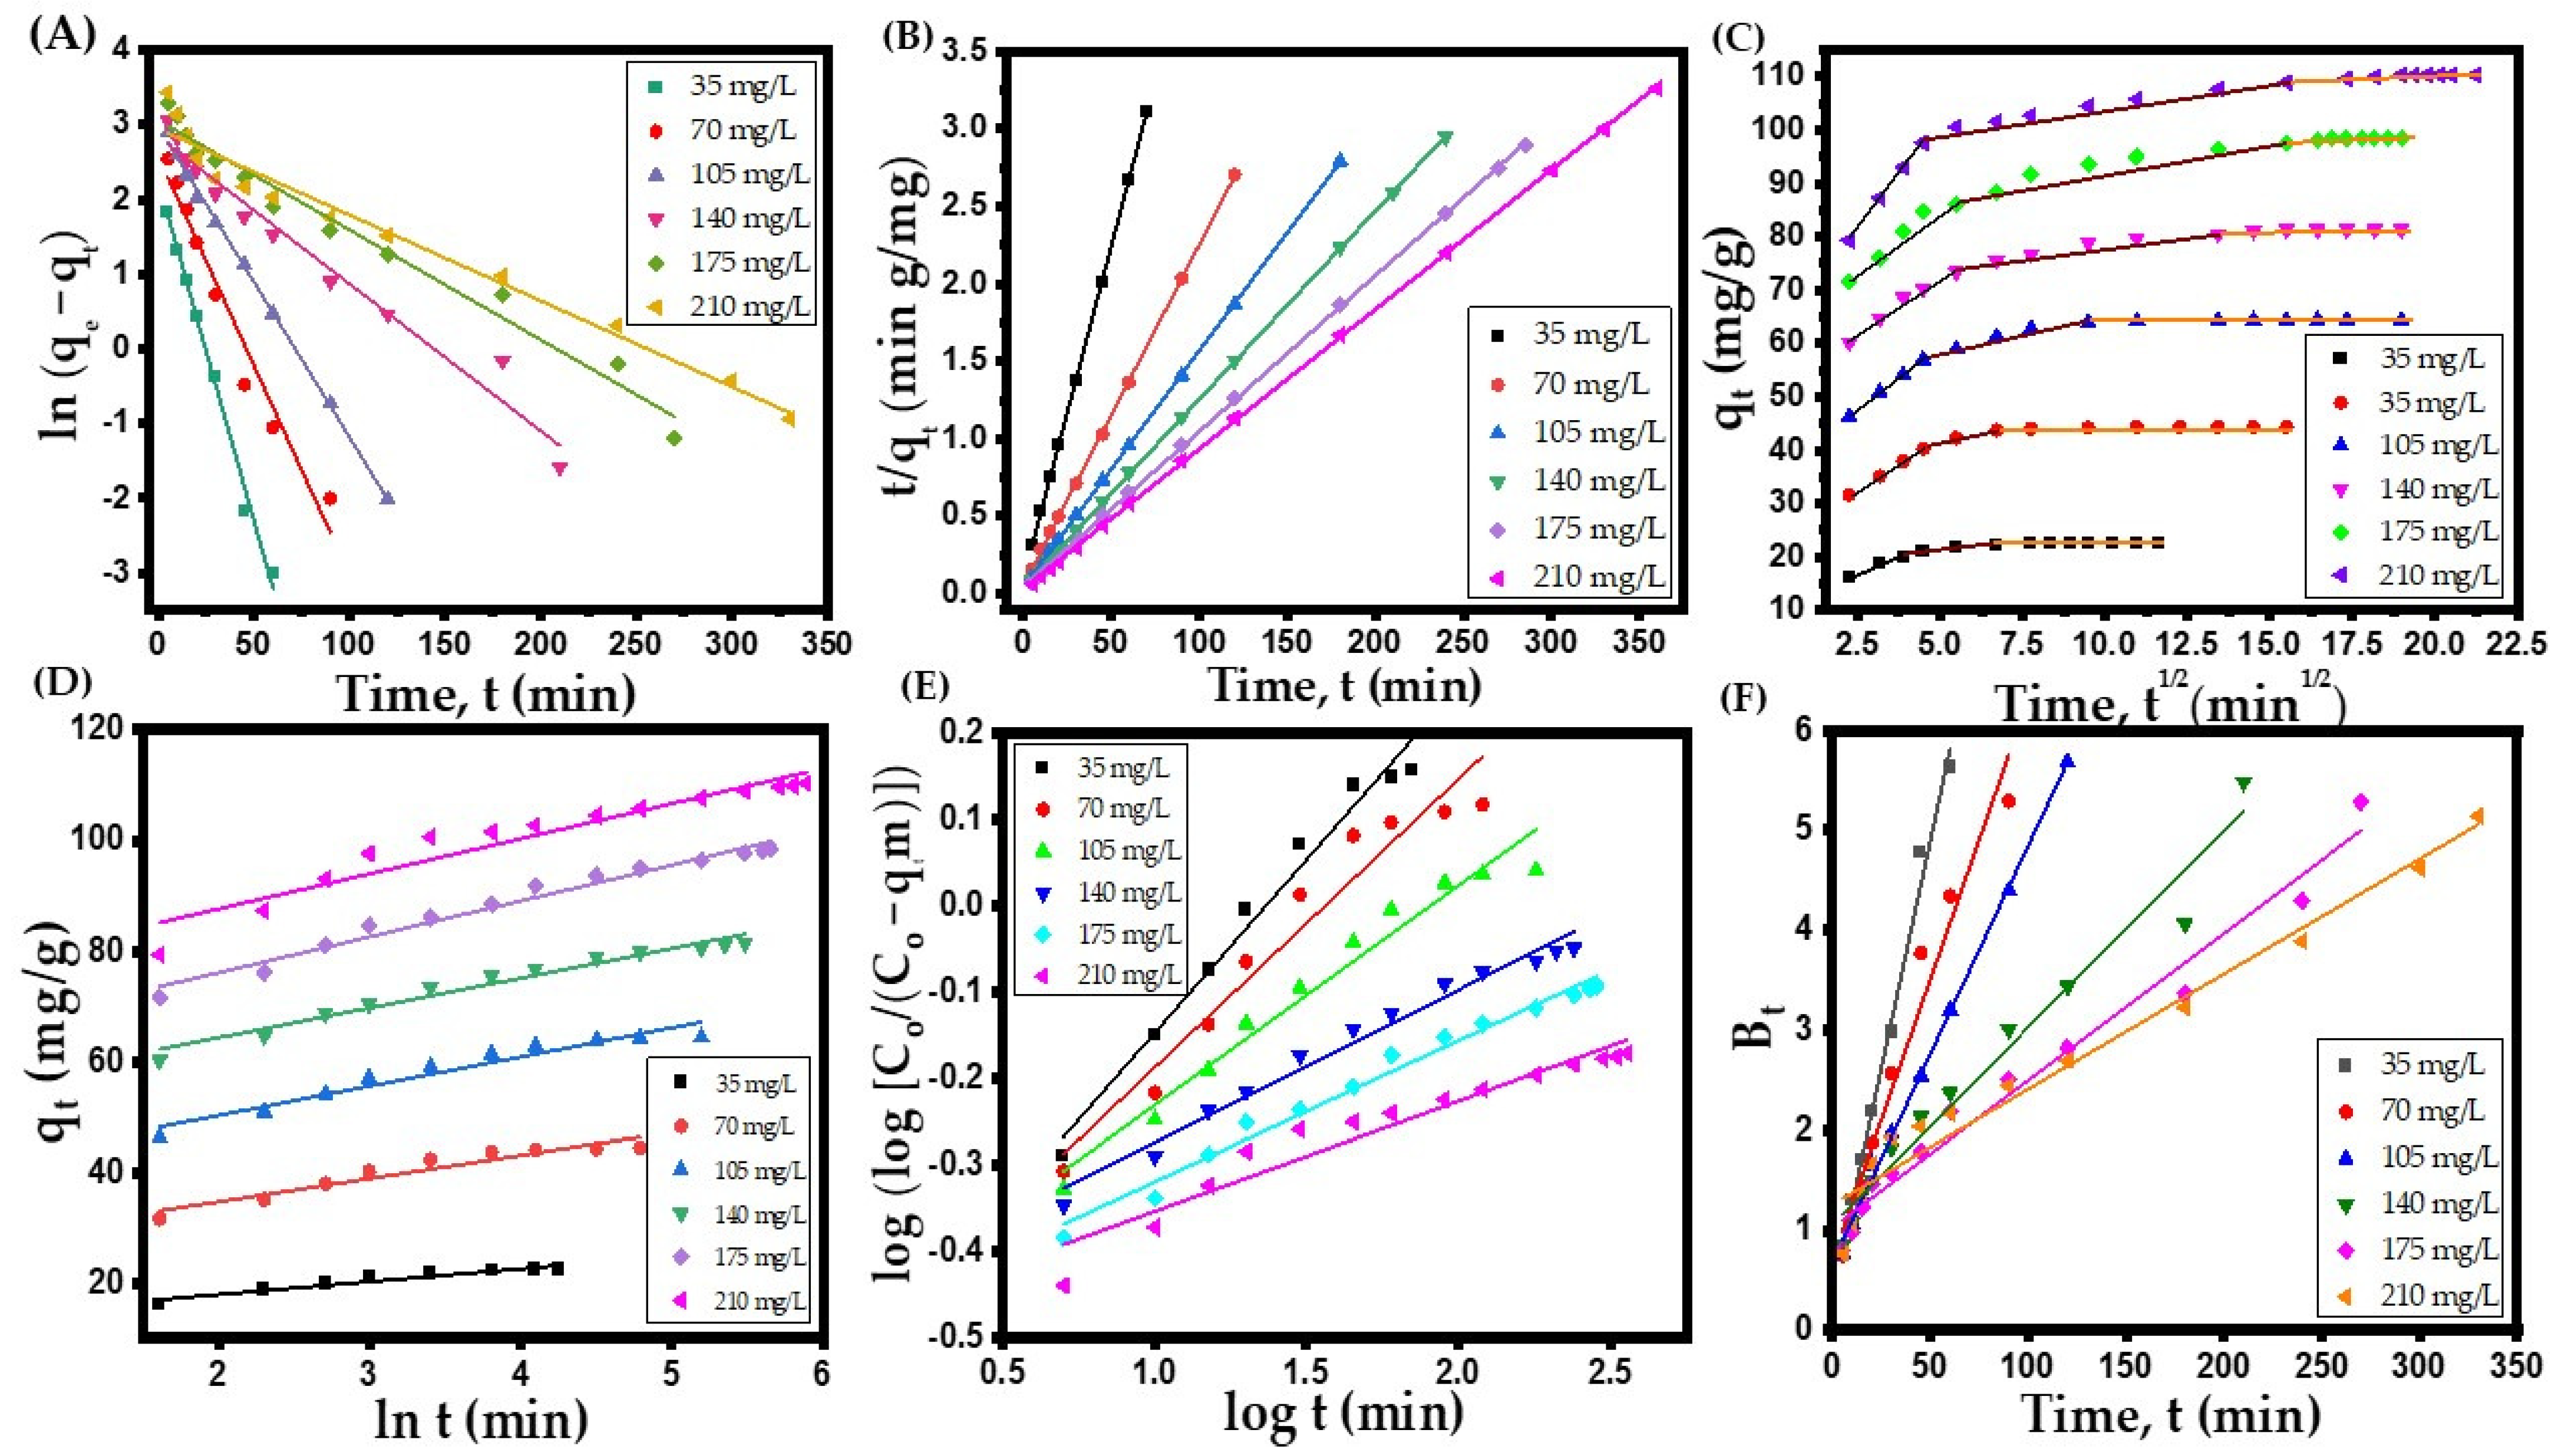
- Pseudo-first-order (PFO) kinetic model:
- Pseudo-second-order (PSO) kinetic model:
- Intra-particle diffusion (ID) model:
- Elovich model:where t is reaction time (min), K1, K2, Ki, C, and are the PFO, PSO, ID rate, film thickness, and Elovich constants expressed in (1/min), (g/(mg·min)), (mg/(g·min1/2)), (mg/g), (mg/(g·min) and (g/mg), respectively. The results of various kinetic model parameters and their regression correlation coefficients are displayed in Table 5, while the outcomes of kinetic studies are depicted in Figure 5A–D.
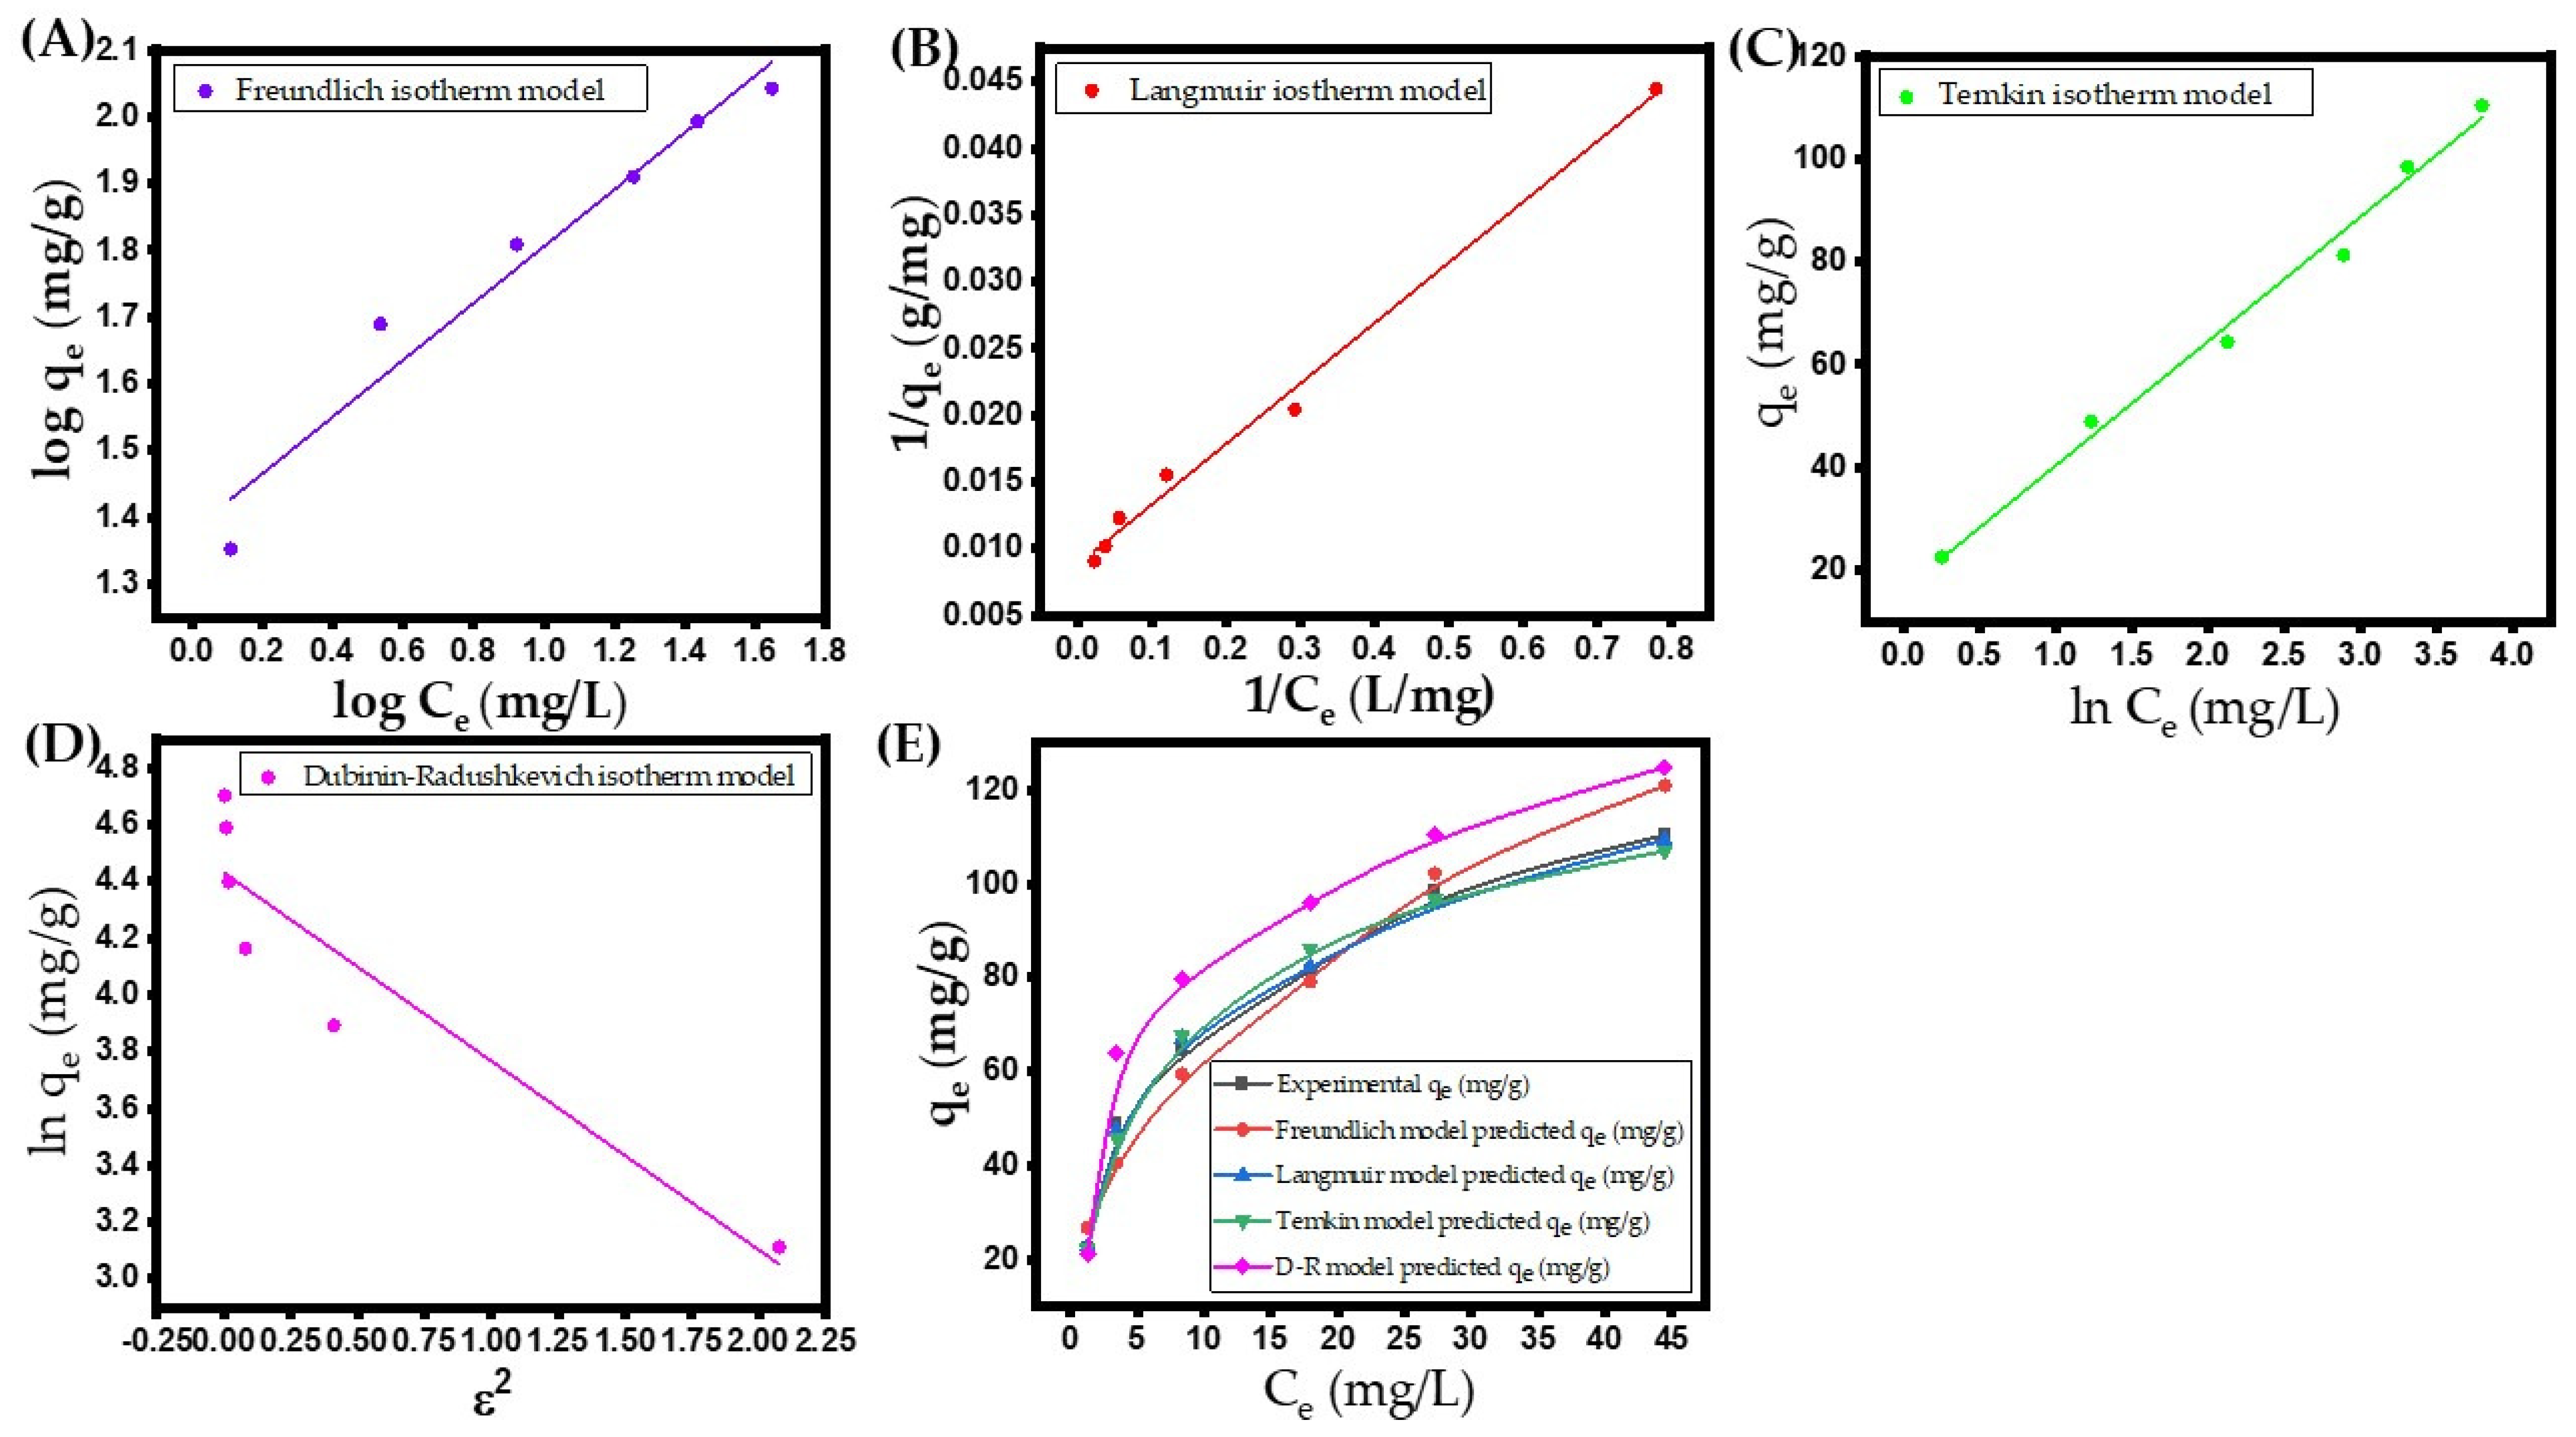
- Freundlich isotherm
- Langmuir isotherm
3.5. Probable Interactions Among MNC Material and AR Dye Adsorbate
3.6. Thermodynamic Investigation on Adsorptive Removal of AR Dye Using MNC Adsorbent
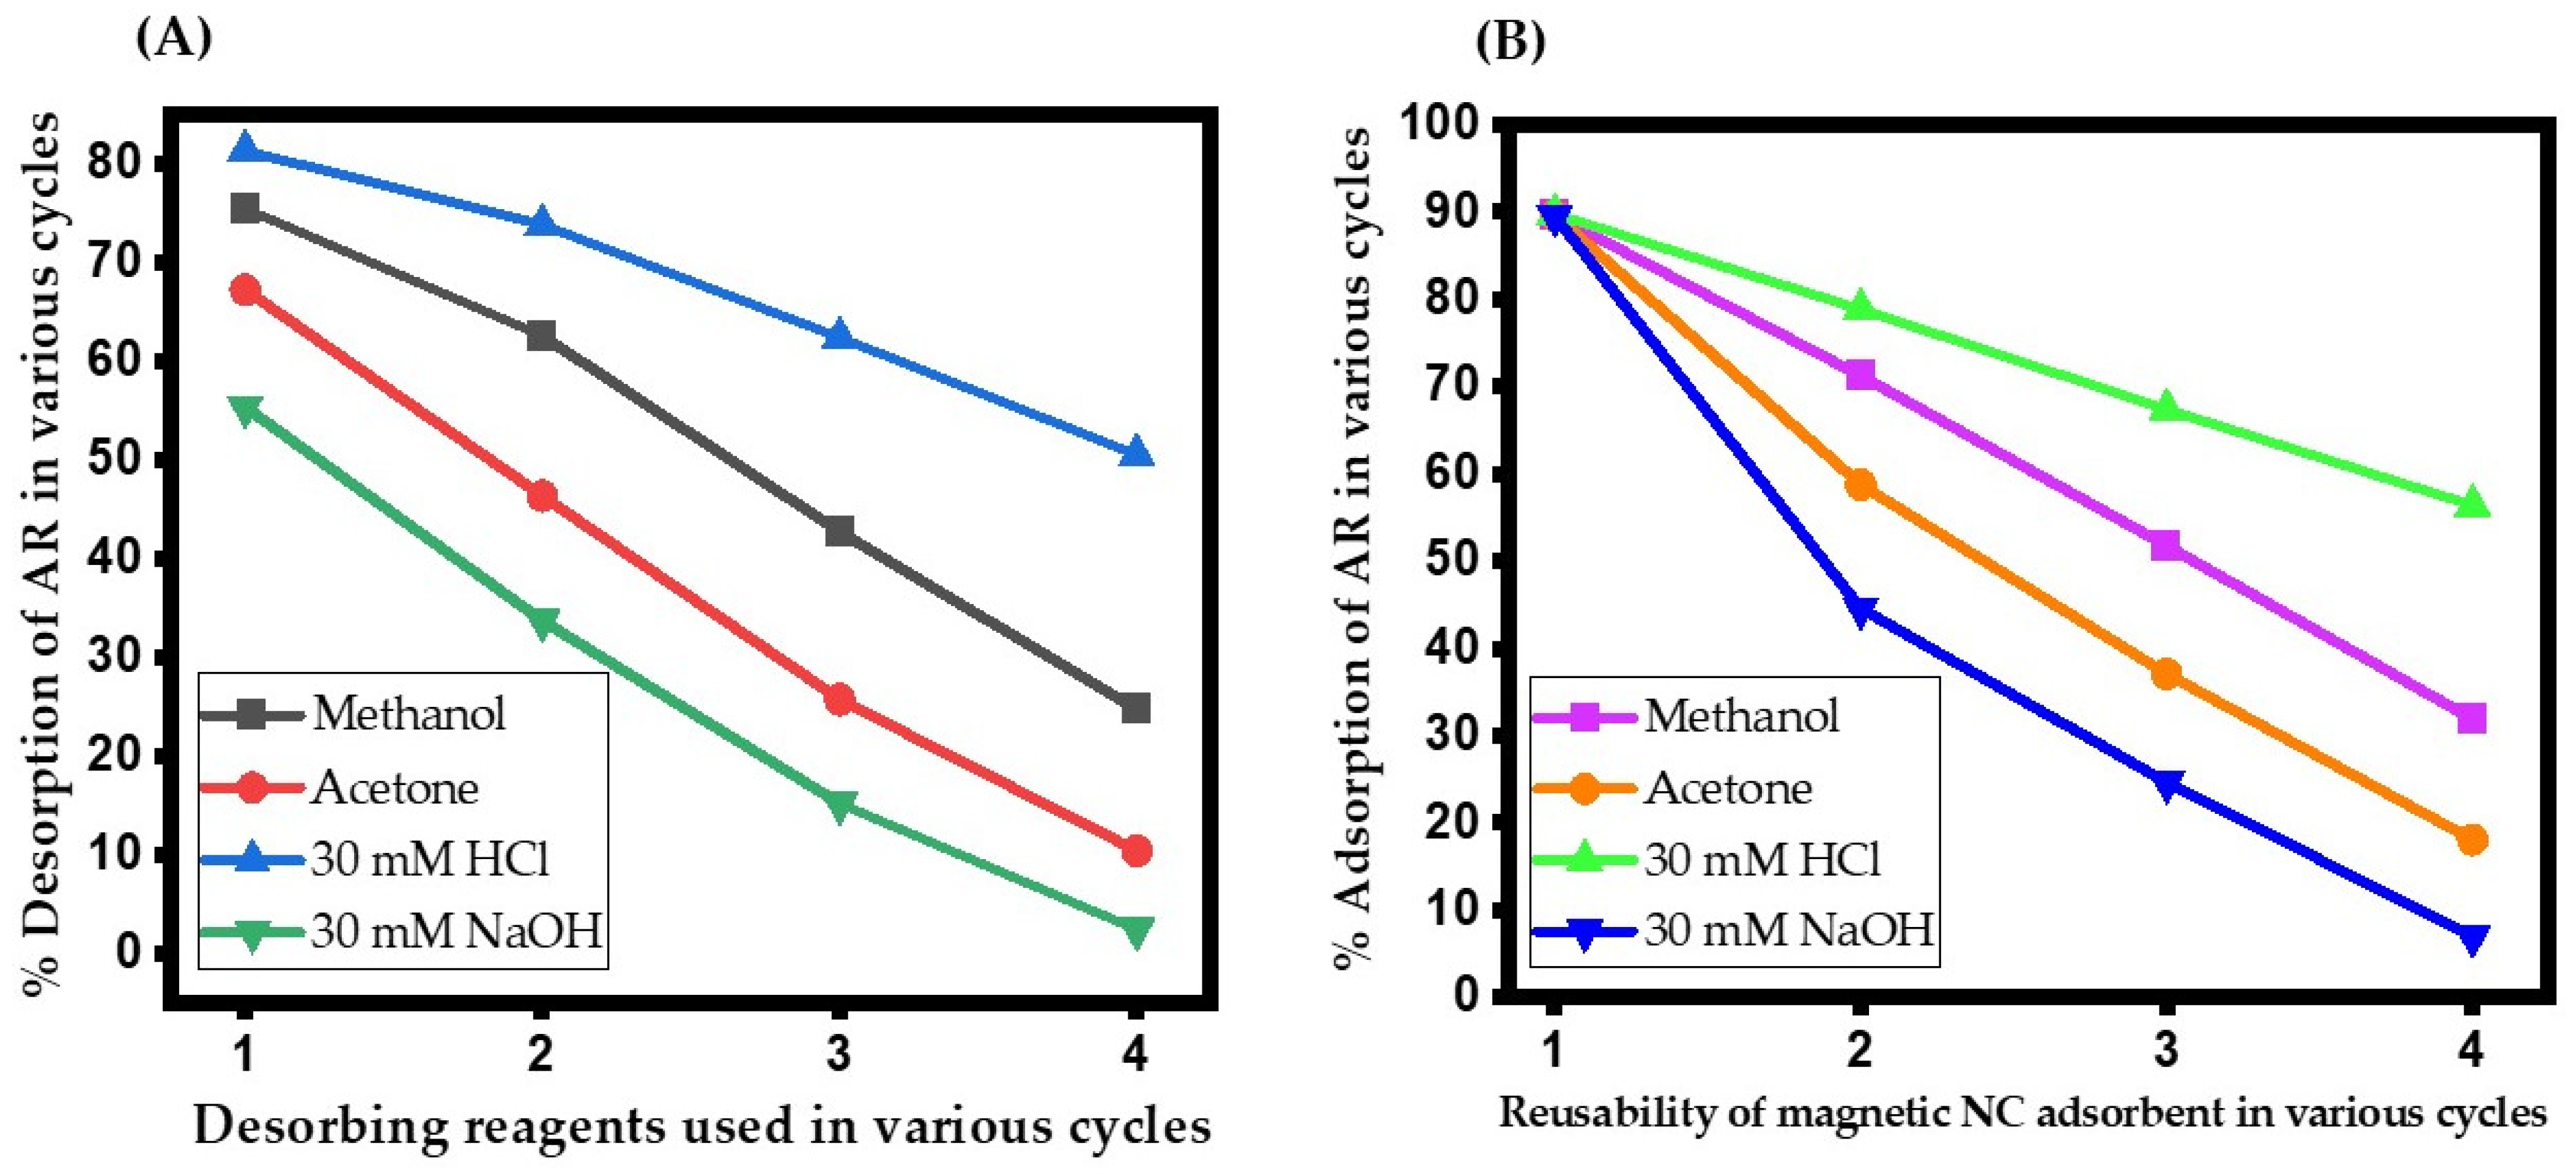
3.7. Renewal of MNC Adsorbent and Reusability
4. Conclusions
Supplementary Materials
Author Contributions
Funding
Institutional Review Board Statement
Informed Consent Statement
Data Availability Statement
Acknowledgments
Conflicts of Interest
Symbols and Abbreviations
| ANOVA | Analysis of variance |
| AR | Alizarin red S |
| BET | Brunauer–Emmett–Teller |
| bi | Regression coefficients for the linear effect |
| bii | Regression coefficients for the quadratic effect |
| bij | Regression coefficients for the interaction effect |
| bo | Constant in the regression model |
| bT | Adsorption energy (kJ/mole) |
| C | Intercept value in intra-particle diffusion model (mg/g) |
| CCD | Central composite design |
| Co | Initial AR dye concentration in solution (mg/L) |
| Ce | Equilibrium AR dye concentration in solution (mg/L) |
| Ct | AR dye concentration in solution at any time t (mg/L) |
| D | Average crystallize size (nm) |
| D-R | Dubinin-Radushkevich isotherm model |
| Dp | Magnetic nanocomposite adsorbent average particle diameter (nm) |
| E | Mean free energy of adsorption in D-R isotherm model (kJ/mole) |
| Ea | Activation energy of adsorption (kJ/mole) |
| EDS | Energy-dispersive X-ray spectroscopy |
| EF | External film diffusion |
| Fstatistics | Fisher’s ‘F’-test probability value |
| FE-SEM | Field emission scanning electron microscopy |
| FWHM | Full width at half maximum |
| h | Initial rate of adsorption (mg/(g·min)) |
| ICSD | Inorganic Crystal Structure Database |
| ID | Intra-particle diffusion |
| JCPDS | Joint Committee on Powder Diffraction Standards |
| K | Constant in Debye Scherrer’s equation |
| Kc | Adsorption equilibrium constant (L/g) |
| KDR | Dubinin-Radushkevich isotherm model constant (mole2/kJ2) |
| KF | Freundlich isotherm constant (L/g) |
| Ki | Intra-particle diffusion rate constant (mg/(g·min1/2)) |
| KL | Langmuir isotherm constant (L/mg) |
| KT | Temkin isotherm constant (L/g) |
| K1 | Pseudo-first-order rate constant (1/min) |
| K2 | Pseudo-second-order rate constant (g/(mg·min)) |
| MNC | Magnetic nanocomposite adsorbent |
| Ms | Saturation magnetization |
| n | Freundlich isotherm heterogeneity factor |
| NPs | Nanoparticles |
| NSD | Normalized standard deviation (%) |
| nv | number of variables |
| P | Probability value |
| PD | Pore diffusion |
| PFO | Pseudo-first-order |
| pHzpc | Zero-point charge of adsorbent |
| PSO | Pseudo-second-order |
| qe | Amount of dye adsorbed at equilibrium (mg/g) |
| qe, calculated | Calculated adsorption capacity at equilibrium (mg/g) |
| qe, empirical | Experimental adsorption capacity at equilibrium (mg/g) |
| Qmax | Highest surface assimilation capacity (mg/g) |
| qs | Theoretical Dubinin-Radushkevich isotherm equilibrium capacity (mg/g) |
| qt | Amount of dye accumulated on the adsorbent surface at any time t (mg/g) |
| R | Universal gas constant (8.314 J/(mole·K)) |
| R(%) | Dye removal efficiency |
| R2 | Linear regression correlation coefficient |
| RL | Langmuir isotherm separation factor |
| RSM | Response surface methodology |
| SQUID | Superconducting quantum interference device |
| TG | Thermogravimetric analysis |
| t | Adsorption reaction time (minutes) |
| T | Temperature (K) |
| V | Volume of dye solution (mL) |
| VSM | Vibrating sample magnetometer |
| W | Mass of dry magnetic nanocomposite powder adsorbent (g) |
| XPS | X-ray photoelectron spectroscopy |
| XRD | X-ray diffraction |
| xi | Coded value of a process variable Xi |
| Xj | Coded value of a process variable Xj |
| X1 | Initial pH |
| X2 | Initial adsorbate concentration (mg/L) |
| X3 | Magnetic nanocomposite adsorbent concentration (g/L) |
| X4 | Adsorbent particle size (nm) |
| Yest | Predicted adsorption efficiency (%) |
| ΔG° | Changes in Gibbs free energy (kJ/mole) |
| ΔH° | Changes in enthalpy (kJ/mole) |
| ΔS° | Changes in entropy (kJ/(mole·K)) |
| α | Elovich model constant (mg/(g·min)) |
| β | Elovich model parameter (g/mg) |
| βD-S | Full width at half maximum intensity in Debye Scherrer’s equation |
| λ | X-ray wavelength |
| θ | Diffraction angle |
| D-R isotherm model parameter | |
| Chi-square error |
References
- Singh, B.J.; Chakraborty, A.; Sehgal, R. A systematic review of industrial wastewater management: Evaluating challenges and enablers. J. Environ. Manag. 2023, 348, 119230. [Google Scholar] [CrossRef] [PubMed]
- Mus, Z.; Isik, B.; Ugraskan, V. Sequestration of hazardous alizarin Red S dye from water using mesoporous sponge-PANI composite. J. Dispers. Sci. Technol. 2024, 1–16. [Google Scholar] [CrossRef]
- Sahu, A.; Poler, J.C. Removal and degradation of dyes from textile industry wastewater: Benchmarking recent advancements, toxicity assessment and cost analysis of treatment processes. J. Environ. Chem. Eng. 2024, 12, 113754. [Google Scholar] [CrossRef]
- Hassan, S.S.M.; Kamel, A.H.; Hassan, A.A.; Amr, A.E.E.; El-Naby, H.; Elsayed, E.A. A SnO2/CeO2 Nano-composite catalyst for Alizarin dye removal from aqueous solutions. Nanomaterials 2020, 10, 254. [Google Scholar] [CrossRef]
- Bellaj, M.; Yazid, H.; Aziz, K.; Regti, A.; Haddad, M.E.; Achaby, M.E.; Abourriche, A.; Gebrati, L.; Kurniawan, T.A.; Aziz, F. Eco-friendly synthesis of clay-chitosan composite for efficient removal of Alizarin red S dye from wastewater: A comprehensive experimental and theoretical investigation. Environ. Res. 2024, 247, 118352. [Google Scholar] [CrossRef]
- Liu, X.; Wang, J. Decolorization and degradation of various dyes and dye-containing wastewater treatment by electron beam radiation technology: An overview. Chemosphere 2024, 351, 141255. [Google Scholar] [CrossRef]
- Lanjwani, M.F.; Tuzen, M.; Khuhawar, M.Y.; Saleh, T.A. Trends in photocatalytic degradation of organic dye pollutants using nanoparticles: A review. Inorg. Chem. Commun. 2024, 159, 111613. [Google Scholar] [CrossRef]
- Joseph, G.; Pai, S.D.K.R.; Varghese, A.; Pinheiro, D.; Mohan, M.K.; Chundattu, S.J. Adsorptive capacity of PANI/Bi2O3 composite through isotherm and kinetics studies on Alizarin red. J. Mol. Struct. 2024, 1308, 138095. [Google Scholar] [CrossRef]
- Kusworo, T.D.; Purwanto, P.; Jos, B.; Budiyono, B.; Astuti, D.A.P.; Inamullah, A.M.A.; Dalanta, F. Photocatalytic nanohybrid UV-light-driven PVDF/GO-NiFe@SiO2 membrane coupled with bentonite adsorption and ozonation process for a sustainable textile wastewater treatment. Process Saf. Environ. Prot. 2024, 190, 438–457. [Google Scholar] [CrossRef]
- Liu, X.; Shan, Y.; Zhang, S.; Kong, Q.; Pang, H. Application of metal-organic framework in wastewater treatment. Green Energy Environ. 2023, 8, 698–721. [Google Scholar] [CrossRef]
- Sheraz, N.; Shah, A.; Haleem, A.; Iftikhar, F.J. Comprehensive assessment of carbon-, biomaterial- and inorganic-based adsorbents for the removal of the most hazardous heavy metal ions from wastewater. RSC Adv. 2024, 14, 11284. [Google Scholar] [CrossRef] [PubMed]
- Mittal, M.; Tripathi, S.; Shin, D.K. Biopolymeric nanocomposites for wastewater remediation: An overview on recent progress and challenges. Polymers 2024, 16, 294. [Google Scholar] [CrossRef] [PubMed]
- Saglam, S.; Turk, F.N.; Arslanoglu, H. Use and applications of metal-organic frameworks (MOF) in dye adsorption: Review. J. Environ. Chem. Eng. 2023, 11, 110568. [Google Scholar] [CrossRef]
- Ullah, S.; Shah, S.S.A.; Altaf, M.; Hossain, I.; El-Sayed, M.E.; Kallel, M.; El-Bahy, Z.M.; Rehman, A.U.; Najam, T.; Nazir, M.A. Activated carbon derived from biomass for wastewater treatment: Synthesis, application and future challenges. J. Anal. Appl. Pyrolysis 2024, 179, 106480. [Google Scholar] [CrossRef]
- Hussain, E.; Shahadat, M.; Ahtesham, A.; Ibrahim, M.N. Synthesis, characterization, and applications of ambi-functional PANI/GO/MOF-Fe3O4 magnetic nanocomposite for removing industrial dye and emerging contaminant. Sep. Purif. Technol. 2024, 351, 128052. [Google Scholar] [CrossRef]
- Li, L.; Xue, S.; Zhang, Y.; Gao, Y.; Yang, J.; Zhang, X.; Zhang, W. A chemical-free magnetophoretic approach for recovering magnetic particles in microalgae removal through magnetic separation. J. Clean. Prod. 2024, 467, 143025. [Google Scholar] [CrossRef]
- Allah, M.A.A.H.; Alshamsi, H.A. Green synthesis of AC/ZnO nanocomposites for adsorptive removal of organic dyes from aqueous solution. Inorg. Chem. Commun. 2023, 157, 111415. [Google Scholar] [CrossRef]
- Foroutan, R.; Peighambardoust, S.J.; Mohammadi, R.; Peighambardoust, S.H.; Ramavandi, B. Development of new magnetic adsorbent of walnut shell ash/starch/Fe3O4 for effective copper ions removal: Treatment of groundwater samples. Chemosphere 2022, 296, 133978. [Google Scholar] [CrossRef]
- Chundawat, N.S.; Parmar, B.S.; Deuri, A.S.; Vaidya, D.; Sepehr, K.S.; Chauhan, N.P.S. Walnut shell ash as a sustainable material for compounding with Bromobutyl rubber for tire inner liner applications. Polym. Compos. 2020, 41, 5317–5330. [Google Scholar] [CrossRef]
- Asadi-Sangachini, Z.; Galangash, M.M.; Younesi, H.; Nowrouzi, M. The feasibility of cost-effective manufacturing activated carbon derived from walnut shells for large-scale CO2 capture. Environ. Sci. Pollut. Res. 2019, 26, 26542–26552. [Google Scholar] [CrossRef]
- Parimelazhagan, V.; Yashwath, P.; Pushparajan, D.A.; Carpenter, J. Rapid removal of toxic Remazol brilliant blue-R dye from aqueous solutions using Juglans nigra shell biomass activated carbon as potential adsorbent: Optimization, isotherm, kinetic, and thermodynamic investigation. Int. J. Mol. Sci. 2022, 23, 12484. [Google Scholar] [CrossRef] [PubMed]
- Al-Kadhi, N.S.; Al-Senani, G.M.; Algethami, F.K.; Shah, R.K.; Saad, F.A.; Rehman, K.U.; Khezami, L.; Abdelrahman, E.A. Facile synthesis of MgO/ZnO nanocomposite for efficient removal of Alizarin red S dye from aqueous media. Inorg. Chem. Commun. 2024, 162, 112233. [Google Scholar] [CrossRef]
- Silva, M.A.; Reche, E.B.; Amorim, M.T.P. Combining experimental data with statistical methods to evaluate hydrolyzed Reactive dye removal by α-Fe2O3 in a cellulose-based membrane. Fibers 2021, 9, 61. [Google Scholar] [CrossRef]
- Shen, Z.; Kuang, Y.; Zhou, S.; Zheng, J.; Ouyang, G. Preparation of magnetic adsorbent and its adsorption removal of pollutants: An overview. TrAC Trends Anal. Chem. 2023, 167, 117241. [Google Scholar] [CrossRef]
- Zhang, T.; Wei, J.; Cao, P.; Xu, R.; Wang, W.; Ma, C.; Guo, Y.; Chen, Y. A novel strategy for preparing high-performance, low-cost biomass charcoal for dye adsorption using aquatic agricultural waste lotus stem fibers. Ind. Crops Prod. 2024, 214, 118594. [Google Scholar] [CrossRef]
- Nille, O.S.; Patel, R.S.; Borate, B.Y.; Babar, S.S.; Kolekar, G.B.; Gore, A.H. One-step in-situ sustainable synthesis of magnetic carbon nanocomposite from corn comb (MCCC): Agricultural biomass valorisation for pollutant abatement in wastewater. Environ. Sci. Pollut. Res. 2023, 30, 38425–38442. [Google Scholar] [CrossRef]
- Zulfiqar, N.; Nadeem, R.; AI Musaimi, O. Photocatalytic degradation of antibiotics via exploitation of a magnetic nanocomposite: A green nanotechnology approach toward drug-contaminated wastewater reclamation. ACS Omega 2024, 9, 7986–8004. [Google Scholar] [CrossRef]
- Nasoudari, E.; Ameri, M.; Shams, M.; Ghavami, V.; Bonyadi, Z. The biosorption of Alizarin red S by Spirulina platensis; process modelling, optimisation, kinetic and isotherm studies. Int. J. Environ. Anal. Chem. 2023, 103, 633–647. [Google Scholar] [CrossRef]
- Algethami, J.S.; Alhamami, M.A.M.; Alqadami, A.A.; Melhi, S.; Seliem, A.F. Magnetic hydrochar grafted-chitosan for enhanced efficient adsorption of malachite green dye from aqueous solutions: Modeling, adsorption behavior, and mechanism analysis. Int. J. Biol. Macromol. 2024, 254, 127767. [Google Scholar] [CrossRef]
- Zahakifar, F.; Khanramaki, F. Continuous removal of thorium from aqueous solution using functionalized graphene oxide: Study of adsorption kinetics in batch system and fixed bed Column. Sci. Rep. 2024, 14, 14888. [Google Scholar] [CrossRef]
- Attia, N.F.; Shaltout, S.M.; Salem, I.A.; Zaki, A.B.; El-Sadek, M.H.; Salem, M.A. Sustainable and smart hybrid nanoporous adsorbent derived biomass as efficient adsorbent for cleaning of wastewater from Alizarin red dye. Biomass Convers. Biorefinery 2024, 14, 4989–5004. [Google Scholar] [CrossRef]
- Badran, I.; Khalaf, R. Adsorptive removal of Alizarin dye from wastewater using maghemite Nanoadsorbents. Sep. Sci. Technol. 2020, 55, 2433–2448. [Google Scholar] [CrossRef]
- Rodrigues, S.C.; Silva, M.C.; Torres, J.A.; Bianchi, M.L. Use of magnetic activated carbon in a solid phase extraction procedure for analysis of 2,4-dichlorophenol in water samples. Water Air Soil Pollut. 2020, 294, 231. [Google Scholar] [CrossRef]
- Faheem, M.; Iqbal, T.; Afsheen, S.; Basit, A.; Munir, R.M.; Khan, M.I.; Elgorban, A.M.; AL-Shwaiman, H.A.; Rizv, H.I. A maghemite (γ-Fe2O3) incorporated activated carbon photocatalytic nanocomposite fabricated via Co-precipitation utilized against degradation of Methyl orange. Opt. Mater. 2024, 157, 116131. [Google Scholar] [CrossRef]
- Ohale, P.E.; Chukwudi, K.; Ndive, J.N.; Michael, M.E.; Abonyi, M.N.; Chukwu, M.M.; Obi, C.C.; Onu, C.E.; Igwegbe, C.A.; Azie, C.O. Optimization of Fe2O3@BC-KC composite preparation for adsorption of Alizarin red S dye: Characterization, kinetics, equilibrium, and thermodynamic studies. Results Surf. Interfaces 2023, 13, 100157. [Google Scholar] [CrossRef]
- Bide, Y.; Torabian, Z. Carbon shell derived from bottle waste PET on α-Fe2O3/Fe3O4 heterostructure core as synergetic Fenton-like catalyst for degradation of antibiotics. Surf. Interfaces 2024, 50, 104435. [Google Scholar] [CrossRef]
- Khalatbary, M.; Sayadi, M.H.; Hajiani, M.; Nowrouzi, M. Adsorption studies on the removal of Malachite green by γ-Fe2O3/MWCNTs/Cellulose as an eco-friendly nanoadsorbent. Biomass Convers. Biorefinery 2024, 14, 2495–2513. [Google Scholar] [CrossRef]
- Sagadevan, S.; Sivasankaran, R.P.; Lett, J.A.; Fatimah, I.; Weldegebrieal, G.K.; Leonard, E.; Le, M.; Soga, T. Evaluation of photocatalytic activity and electrochemical properties of hematite nanoparticles. Symmetry 2023, 15, 1139. [Google Scholar] [CrossRef]
- Lakshmi, C.N.; Irfan, M.; Sinha, R.; Singh, N. Magnetically recoverable Ni-doped iron oxide/graphitic carbon nitride nanocomposites for the improved photocatalytic degradation of ciprofloxacin: Investigation of degradation pathways. Environ. Res. 2024, 242, 117812. [Google Scholar] [CrossRef]
- Kumar, Y.R.; Kavita, S.; Palanisamy, A.; Vasundhara, M. Structural, optical and magnetic properties of chitosan mediated a-Fe2O3 nanoparticles. Mater. Today Proc. 2023, 92, 1064–1069. [Google Scholar] [CrossRef]
- Amalanathan, M.; Aravind, M.; Ahmed, N.; Mary, M.S.M.; Velusamy, P.; Kumaresubitha, T.; Noreen, R.; Ali, S. The influence of activated carbon annealing temperature on sunlight-driven photocatalytic dye degradation and biological activity. Inorg. Chem. Commun. 2022, 146, 110149. [Google Scholar] [CrossRef]
- Geng, B.; Tao, B.; Li, X.; Wei, W. Ni2+/surfactant-assisted route to porous α-Fe2O3 nanoarchitectures. Nanoscale 2012, 4, 1671. [Google Scholar] [CrossRef] [PubMed]
- Park, C.; Jung, J.; Lee, C.W.; Cho, J. Synthesis of mesoporous α-Fe2O3 nanoparticles by non-ionic soft template and their applications to heavy oil upgrading. Sci. Rep. 2016, 6, 39136. [Google Scholar] [CrossRef]
- Mascolo, M.C.; Pei, Y.; Ring, T.A. Room temperature co-precipitation synthesis of magnetite nanoparticles in a large pH window with different bases. Materials 2013, 6, 5549–5567. [Google Scholar] [CrossRef] [PubMed]
- Alahabadi, A.; Shomoossi, N.; Riahimanesh, F.; Salari, M. Development of AC/ZnO/Fe2O3 for efficiently adsorptive removal of Tetracycline from water environment: Isotherm, kinetic and thermodynamic studies and adsorption mechanism. Biomass Convers. Biorefinery 2024, 14, 17499–17517. [Google Scholar] [CrossRef]
- Bhuyan, A.; Ahmaruzzaman, M. Recent advances in new generation nanocomposite materials for adsorption of pharmaceuticals from aqueous environment. Environ. Sci. Pollut. Res. 2023, 30, 39377–39417. [Google Scholar] [CrossRef] [PubMed]
- Yang, Z.; Luo, C.; Wang, N.; Liu, J.; Zhang, M.; Xu, J.; Zhao, Y. Fe2O3 embedded in N-doped porous carbon derived from Hemin loaded on active carbon for supercapacitors. Molecules 2024, 29, 146. [Google Scholar] [CrossRef]
- Cao, D.; Li, H.; Pan, L.; Li, J.; Wang, X.; Jing, P.; Cheng, X.; Wang, W.; Wang, J.; Liu, Q. High saturation magnetization of γ-Fe2O3 nano-particles by a facile one-step synthesis approach. Sci. Rep. 2016, 6, 32360. [Google Scholar] [CrossRef]
- Aravindhan, S.; Kumar, G.B.; Saravanan, M.; Arumugam, A. Delonix regia biomass as an eco-friendly biosorbent for effective Alizarin red S textile dye removal: Characterization, kinetics, and isotherm studies. Bioresour. Technol. Rep. 2024, 25, 101721. [Google Scholar] [CrossRef]
- Cheng, Y.; Li, A.; Shi, W.; Zhao, L. Magnetic chitosan-functionalized waste carton biochar composites for efficient adsorption of anionic and cationic dyes. Chem. Eng. J. 2024, 481, 148535. [Google Scholar] [CrossRef]
- Qian, W.; Hu, M.; Su, Y.; Shan, S.; Zhang, Z.; Hu, L.; Lin, X. Insight into mass transfer during adsorption of Geniposidic acid onto a fixed-bed column by numerical simulation considering influence of operating conditions on column adsorption performance. Sep. Purif. Technol. 2023, 319, 124021. [Google Scholar] [CrossRef]
- Vairavel, P.; Rampal, N.; Jeppu, G. Adsorption of toxic Congo red dye from aqueous solution using untreated coffee husks: Kinetics, equilibrium, thermodynamics and desorption study. Int. J. Environ. Anal. Chem. 2023, 103, 2789–2808. [Google Scholar] [CrossRef]
- He, Z.; Li, Y.; Qi, B. A new and low-cost surface-functionalized corn straw adsorbent for adsorptive removal of sodium dodecylbenzene sulfonate: Adsorbent preparation and adsorption performance. Sep. Purif. Technol. 2023, 309, 122999. [Google Scholar] [CrossRef]
- Elgarahy, A.M.; Mostafa, H.Y.; Zaki, E.G.; ElSaeed, S.M.; Elwakeel, K.Z.; Akhdhar, A.; Guibal, E. Methylene blue removal from aqueous solutions using a biochar/gellan gum hydrogel composite: Effect of agitation mode on sorption kinetics. Int. J. Biol. Macromol. 2023, 232, 123355. [Google Scholar] [CrossRef]
- Parimelazhagan, V.; Natarajan, K.; Shanbhag, S.; Madivada, S.; Kumar, H.S. Effective adsorptive removal of Coomassie violet dye from aqueous solutions using green synthesized zinc hydroxide nanoparticles prepared from Calotropis gigantea leaf extract. ChemEngineering 2023, 7, 31. [Google Scholar] [CrossRef]
- Karyab, H.; Ghasemi, M.; Ghotbinia, F.; Nazeri, N. Efficiency of chitosan nanoparticle with polyaluminum chloride in dye removal from aqueous solutions: Optimization through response surface methodology (RSM) and central composite design (CCD). Int. J. Biol. Macromol. 2023, 249, 125977. [Google Scholar] [CrossRef]
- Thanapornsin, W.; Pasee, K.; Puchongkawarin, C.; Umpuch, C. Preparation and characterization of biocomposite film made of activated carbon derived from microalgal biomass: An experimental design approach for basic yellow 1 removal. S. Afr. J. Chem. Eng. 2024, 47, 178–196. [Google Scholar] [CrossRef]
- Alanazi, Y.M.; Al-Fatesh, A.S.; Al-Mubaddel, F.S.; Ibrahim, A.A.; Fakeeha, A.H.; Abasaeed, A.E.; AL-Garadi, N.Y.A.; Osman, A.I. Response surface methodology for Ni-zeolite catalyst optimization in syngas production. ACS Omega 2024, 9, 41636–41650. [Google Scholar] [CrossRef]
- Yun, J.; Shahi, N.K.; Dockko, S. Adsorption performance and mechanism of a starch-stabilized ferromanganese binary oxide for the removal of phosphate. Chemosphere 2024, 362, 142864. [Google Scholar] [CrossRef]
- Parimelazhagan, V.; Chinta, A.; Shetty, G.G.; Maddasani, S.; Tseng, W.; Ethiraj, J.; Sundaram, G.A.; Kumar, A.S.K. Process optimization and equilibrium, thermodynamic, and kinetic modeling of toxic Congo red dye adsorption from aqueous solutions using a copper ferrite nanocomposite adsorbent. Molecules 2024, 29, 418. [Google Scholar] [CrossRef]
- Holliday, M.C.; Parsons, D.R.; Zein, S.H. Agricultural pea waste as a low-cost pollutant biosorbent for Methylene blue removal: Adsorption kinetics, isotherm and thermodynamic studies. Biomass Convers. Biorefinery 2024, 14, 6671–6685. [Google Scholar] [CrossRef]
- Mustafa, D.; Ibrahim, B.; Erten, A. Adsorptive removal of anticarcinogen pazopanib from aqueous solutions using activated carbon: Isotherm, kinetic and thermodynamic studies. Sci. Rep. 2024, 14, 17765. [Google Scholar] [CrossRef]
- Gautam, R.K.; Mudhoo, A.; Chattopadhyaya, M.C. Kinetic, equilibrium, thermodynamic studies and spectroscopic analysis of Alizarin red S removal by mustard husk. J. Environ. Chem. Eng. 2013, 1, 1283–1291. [Google Scholar] [CrossRef]
- Song, Y.; Zhang, Y.; Zhuo, L. Alizarin red removal using epichlorohydrin-modified walnut shells. Iran. J. Chem. Chem. Eng. 2024, 43, 2039–2047. [Google Scholar] [CrossRef]
- Zhou, J.; Sun, Y.; Zhou, C.; Sun, X.; Han, J. Polyaniline/carbon hybrids: Synthesis and application for Alizarin red S removal from water. Colloids Surf. A Physicochem. Eng. Asp. 2023, 676, 132204. [Google Scholar] [CrossRef]
- Zolgharnein, J.; Choghaei, Z.; Bagtash, M.; Feshki, S.; Rastgordani, M.; Zolgharnein, P. Nano-Fe3O4 and corn cover composite for removal of Alizarin red S from aqueous solution: Characterization and optimization investigations. Desalin. Water Treat. 2016, 57, 27672–27685. [Google Scholar] [CrossRef]
- Nayl, A.A.; Abd-Elhamid, A.I.; Ahmed, I.M.; Brase, S. Preparation and characterization of magnetite talc (Fe3O4@Talc) nanocomposite as an effective adsorbent for Cr(VI) and Alizarin red S dye. Materials 2022, 15, 3401. [Google Scholar] [CrossRef] [PubMed]
- Joshi, K.M.; Shrivastava, V.S. Degradation of Alizarin red-S (A textiles dye) by photocatalysis using ZnO and TiO2 as photocatalyst. Int. J. Environ. Sci. 2011, 2, 8–21. [Google Scholar]
- Albadarin, A.B.; Mangwandi, C. Mechanisms of Alizarin red S and Methylene blue biosorption onto olive stone by-product: Isotherm study in single and binary systems. J. Environ. Manag. 2015, 164, 86–93. [Google Scholar] [CrossRef]
- Samusolomon, J.; Devaprasath, P.M. Removal of Alizarin red S (dye) from aqueous media by using Cynodon dactylon as an adsorbent. J. Chem. Pharm. Res. 2011, 3, 478–490. [Google Scholar]
- Venkatesh, S.; Arutchelvan, V. Biosorption of Alizarin red dye onto immobilized biomass of Canna indica: Isotherm, kinetics, and thermodynamic studies. Desalin. Water Treat. 2020, 196, 409–421. [Google Scholar] [CrossRef]
- Nesakumari, C.S.; Priya, T.J.; Sugumar, R.W. Sorption of dyes using cucurbituril. Int. J. Appl. Chem. 2013, 5, 141–151. [Google Scholar]
- Kamarehie, B.; Jafari, A.; Ghaderpoori, M.; Karami, M.A.; Mousavi, K.; Ghaderpoury, F. Data on the Alizarin red S adsorption from aqueous solutions on PAC, treated PAC, and PAC/γ ≈ Fe2O3. Data Brief 2018, 20, 903–908. [Google Scholar] [CrossRef]
- Gollakota, A.R.K.; Munagapati, V.S.; Volli, V.; Gautam, S.; Wen, J.C.; Shu, C.M. Coal bottom ash derived zeolite (SSZ-13) for the sorption of synthetic anion Alizarin red S (ARS) dye. J. Hazard. Mater. 2021, 416, 125925. [Google Scholar] [CrossRef]
- Al-Salihi, K.J.; Alfatlawi, W.R. Synthesis and characterization of low-cost adsorbent and used for Alizarin yellow GG and Alizarin red S dyes removal from aqueous solutions. IOP Conf. Ser. Mater. Sci. Eng. 2021, 1094, 012175. [Google Scholar] [CrossRef]
- Fu, F.; Gao, Z.; Gao, L.; Li, D. Effective adsorption of anionic dye, Alizarin red S, from aqueous solutions on activated clay modified by iron oxide. Ind. Eng. Chem. Res. 2011, 50, 9712–9717. [Google Scholar] [CrossRef]
- Piri, F.; Mollahosseini, A.; Khadir, A.; Hosseini, M.M. Enhanced adsorption of dyes on microwave-assisted synthesized magnetic zeolite-hydroxyapatite nanocomposite. J. Environ. Chem. Eng. 2019, 7, 103338. [Google Scholar] [CrossRef]
- Fan, L.; Zhang, Y.; Li, X.; Luo, C.; Lu, F.; Qiu, H. Removal of Alizarin red from water environment using magnetic chitosan with Alizarin red as imprinted molecules. Colloid. Surf. B 2012, 91, 250–257. [Google Scholar] [CrossRef]
- Khapre, M.A.; Jugade, R.M. Hierarchical approach towards adsorptive removal of Alizarin red S dye using native chitosan and its successively modified versions. Water Sci. Technol. 2020, 82, 715–731. [Google Scholar] [CrossRef]
- Absalan, G.; Bananejad, A.; Ghaemi, M. Removal of Alizarin red and Purpurin from aqueous solutions using Fe3O4 magnetic nanoparticles. Anal. Bioanal. Chem. Res. 2017, 4, 65–77. [Google Scholar] [CrossRef]
- Zolgharnein, J.; Asanjrani, N.; Bagtash, M.; Azimi, G. Multi-response optimization using Taguchi design and principle component analysis for removing binary mixture of Alizarin red and Alizarin yellow from aqueous solution by nano c-alumina. Spectrochim. Acta Part A Mol. Biomol. Spectrosc. 2014, 126, 291–300. [Google Scholar] [CrossRef] [PubMed]
- Balji, G.B.; Kumar, P.S. Adsorptive removal of Alizarin red S onto sulfuric acid-modified avocado seeds: Kinetics, equilibrium, and thermodynamic studies. Adsorpt. Sci. Technol. 2022, 2022, 3137870. [Google Scholar] [CrossRef]
- Rehman, R.; Mahmud, T. Sorptive elimination of Alizarin red-S dye from water using Citrullus lanatus peels in environmentally benign way along with equilibrium data modeling. Asian J. Chem. 2013, 25, 5351–5356. [Google Scholar] [CrossRef]
- Bhomick, P.C.; Supong, A.; Baruah, M.; Pongener, C.; Gogoi, C.; Sinha, D. Alizarin red S adsorption onto biomass-based activated carbon: Optimization of adsorption process parameters using Taguchi experimental design. Int. J. Environ. Sci. Technol. 2020, 17, 1137–1148. [Google Scholar] [CrossRef]
- Wanassi, B.; Hariz, I.B.; Ghimbeu, C.M.; Vaulot, C.; Jeguirim, M. Green carbon composite-derived polymer resin and waste cotton fibers for the removal of Alizarin red S dye. Energies 2017, 10, 1321. [Google Scholar] [CrossRef]
- Fayazi, M.; Motlagh, M.G.; Taher, M.A. The adsorption of basic dye (Alizarin red S) from aqueous solution onto activated carbon/γ-Fe2O3 nanocomposite: Kinetic and equilibrium studies. Mater. Sci. Semicond. Process. 2015, 40, 35–43. [Google Scholar] [CrossRef]
- Liang, Y.; He, Y.; Zhang, Y.; Zhu, Q. Adsorption property of Alizarin red S by NiFe2O4/polyaniline magnetic composite. J. Environ. Chem. Eng. 2018, 6, 416–425. [Google Scholar] [CrossRef]
- Behera, A.K.; Shadangi, K.P.; Sarangi, P.K. Efficient removal of Rhodamine B dye using biochar as an adsorbent: Study the performance, kinetics, thermodynamics, adsorption isotherms and its reusability. Chemosphere 2024, 354, 141702. [Google Scholar] [CrossRef]
- Kumari, S.; Singh, S.; Lo, S.L.; Sharma, P.; Agarwal, S.; Garg, M.C. Machine learning and modelling approach for removing Methylene blue from aqueous solutions: Optimization, kinetics and thermodynamics studies. J. Taiwan Inst. Chem. Eng. 2025, 166, 105361. [Google Scholar] [CrossRef]
- Alsohaimi, I.H.; Alhumaimess, M.S.; Alqadami, A.A.; Alshammari, G.T.; Al-Olaimi, R.F.; Abdeltawab, A.A.; El-Sayed, M.Y.; Hassan, H.M. Adsorptive performance of aminonaphthalenesulfonic acid modified magnetic-graphene oxide for Methylene blue dye: Mechanism, isotherm and thermodynamic studies. Inorg. Chem. Commun. 2023, 147, 110261. [Google Scholar] [CrossRef]
- El-Fattah, W.A.; Guesmi, A.; Hamadi, N.B.; Houas, A.; Alotaibi, M.T.; El-Desouky, M.G.; Shahat, A. Novel composite from chitosan and a metal-organic framework for removal of Tartrazine dye from aqueous solutions; adsorption isotherm, kinetic, and optimization using Box-Benkhen design. Int. J. Biol. Macromol. 2024, 273, 133015. [Google Scholar] [CrossRef] [PubMed]
- Aliyam, T.; Noreen, S.; Bhatti, H.N.; Asghar, M. Synthesis of green polymer conductive hybrid adsorbents for recycling of textile wastewater: Batch and column studies. Biomass Convers. Biorefinery 2024, 14, 19409–19430. [Google Scholar] [CrossRef]
- Kayranli, B.; Bilen, M.; Seckin, I.Y.; Yilmaz, T.; Dinc, A.; Akkurt, F.; Simsek, H. Peanut shell biochar for Rhodamine B removal: Efficiency, desorption, and reusability. Chemosphere 2024, 364, 143056. [Google Scholar] [CrossRef] [PubMed]
- Ou, Y.; Yao, L.; Li, Y.; Bai, C.; Luque, R.; Peng, G. Magnetically separable Fe-MIL-88B_NH2 carbonaceous nanocomposites for efficient removal of sulfamethoxazole from aqueous solutions. J. Colloid Interface Sci. 2020, 570, 163–172. [Google Scholar] [CrossRef]


| pH | Co (mg/L) | MNC Dosage (g/L) | Dp (nm) | Agitation Speed (rpm) | Temperature (K) | Time (h) | % AR Dye Adsorption |
|---|---|---|---|---|---|---|---|
| 2 | 165 | 1.20 | 448.1 | 150 | 301 | 24 | 84.93 |
| 3 | 165 | 1.20 | 448.1 | 150 | 301 | 24 | 83.12 |
| 4 | 165 | 1.20 | 448.1 | 150 | 301 | 24 | 80.24 |
| 5 | 165 | 1.20 | 448.1 | 150 | 301 | 24 | 78.46 |
| 6 | 165 | 1.20 | 448.1 | 150 | 301 | 24 | 75.34 |
| 7 | 165 | 1.20 | 448.1 | 150 | 301 | 24 | 70.96 |
| 8 | 165 | 1.20 | 448.1 | 150 | 301 | 24 | 63.54 |
| 10 | 165 | 1.20 | 448.1 | 150 | 301 | 24 | 50.64 |
| 12 | 165 | 1.20 | 448.1 | 150 | 301 | 24 | 37.45 |
| 2 | 35 | 1.20 | 448.1 | 150 | 301 | 24 | 94.43 |
| 2 | 70 | 1.20 | 448.1 | 150 | 301 | 24 | 91.24 |
| 2 | 105 | 1.20 | 448.1 | 150 | 301 | 24 | 88.65 |
| 2 | 140 | 1.20 | 448.1 | 150 | 301 | 24 | 86.12 |
| 2 | 175 | 1.20 | 448.1 | 150 | 301 | 24 | 81.48 |
| 2 | 210 | 1.20 | 448.1 | 150 | 301 | 24 | 72.29 |
| 2 | 165 | 0.50 | 448.1 | 150 | 301 | 24 | 62.54 |
| 2 | 165 | 0.75 | 448.1 | 150 | 301 | 24 | 71.44 |
| 2 | 165 | 1.00 | 448.1 | 150 | 301 | 24 | 78.69 |
| 2 | 165 | 1.25 | 448.1 | 150 | 301 | 24 | 86.24 |
| 2 | 165 | 1.50 | 448.1 | 150 | 301 | 24 | 87.43 |
| 2 | 165 | 1.80 | 448.1 | 150 | 301 | 24 | 89.01 |
| 2 | 165 | 1.25 | 1084.6 | 150 | 301 | 24 | 75.36 |
| 2 | 165 | 1.25 | 786.7 | 150 | 301 | 24 | 81.52 |
| 2 | 165 | 1.25 | 448.1 | 0 | 301 | 24 | 31.19 |
| 2 | 165 | 1.25 | 448.1 | 45 | 301 | 24 | 44.36 |
| 2 | 165 | 1.25 | 448.1 | 90 | 301 | 24 | 58.72 |
| 2 | 165 | 1.25 | 448.1 | 135 | 301 | 24 | 75.64 |
| 2 | 165 | 1.25 | 448.1 | 180 | 301 | 24 | 87.63 |
| Independent Variables | Range and Level | ||||
|---|---|---|---|---|---|
| −2 | −1 | 0 | 1 | 2 | |
| Initial pH (X1) | 1.6 | 1.8 | 2.0 | 2.2 | 2.4 |
| Initial AR pollutant concentration, mg/L (X2) | 85 | 125 | 165 | 205 | 245 |
| MNC adsorbent dose, g/L (X3) | 1.0 | 1.25 | 1.5 | 1.75 | 2.0 |
| Nanoadsorbent particle diameter, nm (X4) | 260.3 | 354.2 | 448.1 | 542 | 636 |
| Run No. | X1 | X2 (mg/L) | X3 (g/L) | X4 (nm) | AR Dye Adsorption Efficiency (%) | |
|---|---|---|---|---|---|---|
| Experiment | Computed | |||||
| 1 | 2.0 | 165 | 6.0 | 448.1 | 87.45 | 87.36 |
| 2 | 1.8 | 125 | 5.0 | 542.0 | 88.72 | 88.33 |
| 3 | 2.2 | 125 | 5.0 | 542.0 | 86.68 | 86.43 |
| 4 | 1.8 | 125 | 7.0 | 542.0 | 91.24 | 92.39 |
| 5 | 1.8 | 205 | 7.0 | 354.2 | 79.98 | 81.91 |
| 6 | 2.0 | 165 | 6.0 | 448.1 | 86.94 | 87.40 |
| 7 | 2.0 | 165 | 6.0 | 448.1 | 87.36 | 87.40 |
| 8 | 2.0 | 165 | 6.0 | 448.1 | 87.75 | 87.40 |
| 9 | 2.4 | 165 | 6.0 | 448.1 | 83.47 | 82.52 |
| 10 | 2.0 | 245 | 6.0 | 448.1 | 69.10 | 67.94 |
| 11 | 2.0 | 85 | 6.0 | 448.1 | 94.04 | 93.10 |
| 12 | 2.2 | 125 | 7.0 | 354.2 | 89.66 | 91.41 |
| 13 | 1.8 | 125 | 5.0 | 354.2 | 86.18 | 87.00 |
| 14 | 2.2 | 205 | 5.0 | 354.2 | 76.43 | 76.97 |
| 15 | 2.0 | 165 | 6.0 | 260.3 | 87.54 | 85.96 |
| 16 | 1.8 | 125 | 7.0 | 354.2 | 92.38 | 92.89 |
| 17 | 1.8 | 205 | 5.0 | 354.2 | 79.55 | 79.02 |
| 18 | 2.0 | 165 | 6.0 | 448.1 | 88.12 | 87.46 |
| 19 | 2.2 | 125 | 5.0 | 354.2 | 87.94 | 87.39 |
| 20 | 2.2 | 205 | 5.0 | 542.0 | 72.34 | 72.25 |
| 21 | 2.2 | 125 | 7.0 | 542.0 | 87.67 | 88.62 |
| 22 | 2.0 | 165 | 8.0 | 448.1 | 88.72 | 85.31 |
| 23 | 2.2 | 205 | 7.0 | 354.2 | 77.18 | 77.99 |
| 24 | 2.0 | 165 | 4.0 | 448.1 | 78.92 | 80.23 |
| 25 | 1.8 | 205 | 7.0 | 542.0 | 76.68 | 77.65 |
| 26 | 1.6 | 165 | 6.0 | 448.1 | 89.48 | 88.34 |
| 27 | 2.2 | 205 | 7.0 | 542.0 | 70.58 | 71.44 |
| 28 | 2.0 | 165 | 6.0 | 636.0 | 81.26 | 80.74 |
| 29 | 1.8 | 205 | 5.0 | 542.0 | 76.65 | 76.59 |
| 30 | 2.0 | 165 | 6.0 | 448.1 | 86.89 | 87.40 |
| 31 | 2.0 | 165 | 6.0 | 448.1 | 87.28 | 87.34 |
| Experimental Parameters | Optimum Value | AR Dye Removal Efficiency (%) | |
|---|---|---|---|
| Experiment | Computed | ||
| Initial pH (X1) | 2.0 | 94.04 | 93.10 |
| Initial AR dye concentration, mg/L (X2) | 85 | ||
| MNC adsorbent dosage, g/L (X3) | 1.5 | ||
| MNC adsorbent particle size, nm (X4) | 448.1 | ||
| Kinetic Model | Model Parameters | Initial AR Dye Pollutant Concentration, Co (mg/L) | |||||
|---|---|---|---|---|---|---|---|
| 35 | 70 | 105 | 140 | 175 | 210 | ||
| AR dye uptake at equilibrium, qe, empirical (mg/g) | 22.4768 | 48.9507 | 64.4210 | 81.3736 | 98.4892 | 110.348 | |
| PFO | qe, calculated (mg/g) | 9.5048 | 18.2346 | 29.6894 | 38.3752 | 45.6481 | 54.943 |
| K1 (1/min) | 0.0909 | 0.0560 | 0.0416 | 0.0197 | 0.0148 | 0.0115 | |
| R2 | 0.9960 | 0.9812 | 0.9990 | 0.9846 | 0.9875 | 0.9832 | |
| NSD (%) | 21.8134 | 25.7978 | 23.1461 | 23.8064 | 22.6051 | 22.9536 | |
| PSO | qe, calculated (mg/g) | 23.278 | 49.216 | 65.574 | 82.237 | 99.403 | 110.987 |
| K2 (g/(mg·min)) | 0.0291 | 0.0110 | 0.0078 | 0.0061 | 0.0047 | 0.0022 | |
| h (mg/(g·min)) | 14.7112 | 26.3848 | 32.7267 | 39.8758 | 45.9248 | 53.6472 | |
| R2 | 0.9999 | 0.9999 | 0.9999 | 0.9999 | 0.9999 | 0.9999 | |
| NSD (%) | 1.3463 | 0.3733 | 0.5964 | 0.3198 | 0.2680 | 0.1608 | |
| Intra-particle diffusion | Ki (mg/(g·min1/2)) | 0.0824 | 0.1432 | 0.1917 | 0.3662 | 0.5916 | 0.6309 |
| C (mg/g)) | 21.6534 | 42.5042 | 61.3787 | 75.1872 | 88.0301 | 98.1263 | |
| R2 | 0.7228 | 0.7466 | 0.7812 | 0.9066 | 0.9764 | 0.9788 | |
| Elovich | (mg/(g·min) | 2305.207 | 3472.416 | 5534.045 | 7645.394 | 8824.728 | 9690.639 |
| (g/mg) | 0.4272 | 0.2392 | 0.1892 | 0.1546 | 0.1338 | 0.1173 | |
| R2 | 0.9588 | 0.9544 | 0.9697 | 0.9819 | 0.9867 | 0.9588 | |
| Isotherm Model | Model Parameters | Values of the Parameters | Predicted Model Expression | ||||
| Freundlich | KF (L/g) | 24.0076 | |||||
| n | 2.3474 | ||||||
| R2 | 0.9762 | ||||||
| 3.8432 | |||||||
| Langmuir | Qmax (mg/g) | 115.35 | |||||
| KL (L/mg) | 0.1909 | ||||||
| RL | 0.0243–0.1301 | ||||||
| R2 | 0.9966 | ||||||
| 0.2116 | |||||||
| Temkin | RT/bT | 24.1968 | |||||
| KT (L/g) | 1.9522 | ||||||
| R2 | 0.9902 | ||||||
| 0.7372 | |||||||
| Dubinin-Radushkevich | qs (mg/g) | 84.0086 | |||||
| KDR (mole2/kJ2) | 0.6642 | ||||||
| E (kJ/mole) | 0.8675 | ||||||
| R2 | 0.9276 | ||||||
| 14.2877 | |||||||
| Adsorbent | Highest Surface Assimilation Capacity, Qmax (mg/g) | Reference |
|---|---|---|
| Mustard husk | 0.507 | [63] |
| Unmodified walnut shell | 2.62 | [64] |
| Polyaniline/carbon hybrids | 7.61 | [65] |
| Nano-Fe3O4/corn cover composite | 10.52 | [66] |
| Fe3O4@Talc nanocomposite | 11.76 | [67] |
| ZnO/TiO2 | 12.50 | [68] |
| Olive stone | 16.01 | [69] |
| Cynodon dactylon | 16.30 | [70] |
| Spirulinaplatensis biomass | 17.15 | [28] |
| SnO2/CeO2 nano-composite | 18.50 | [4] |
| Immobilized Canna indica beads | 21.69 | [71] |
| Cucurbituril | 22.80 | [72] |
| Powdered activated carbon (PAC) | 24.50 | [73] |
| Coal bottom ash-derived zeolite | 26.79 | [74] |
| Layered double hydroxide clay | 29.41 | [75] |
| Activated clay modified by iron oxide | 32.70 | [76] |
| Hydroxyapatite | 34.20 | [77] |
| Chitosan-coated Fe3O4 nanoparticles | 40.12 | [78] |
| Chitosan | 42.48 | [79] |
| Chitosan-clay composite | 44.39 | [5] |
| Fe3O4 magnetic nanoparticles | 45.80 | [80] |
| Coal bottom ash | 49.26 | [74] |
| Nano γ-alumina | 54.40 | [81] |
| Nitric acid-treated PAC | 57.80 | [78] |
| Acid-treated avocado seed powder | 67.08 | [82] |
| Citrullus lanatus peels | 79.60 | [83] |
| Epichlorohydrin modified with walnut shells | 81.44 | [64] |
| Schima wallichii-based activated carbon | 91.69 | [84] |
| Polymer resin and waste cotton fibers | 104.00 | [85] |
| Magnetic activated carbon | 108.69 | [86] |
| NiFe2O4/PANI composite | 110.00 | [87] |
| Walnut shell caron-Fe2O3 nanocomposite | 115.35 | Present study |
| Temperature (K) | Qmax (mg/g) | Thermodynamic Parameters | ||
|---|---|---|---|---|
| ΔG (kJ/mole) | ΔH (kJ/mole) | ΔS (kJ/mole K) | ||
| 301 | 115.35 | −25.0251 | 47.9105 | 0.2198 |
| 313 | 119.64 | −27.2759 | ||
| 323 | 126.57 | −29.9045 | ||
| Co (mg/L) | Activation Energy, Ea (kJ/mole) | |||
| 35 | 46.6328 | |||
| 70 | 61.8536 | |||
| 105 | 56.9996 | |||
| 140 | 50.0526 | |||
| 175 | 56.4308 | |||
| 210 | 43.8761 | |||
Disclaimer/Publisher’s Note: The statements, opinions and data contained in all publications are solely those of the individual author(s) and contributor(s) and not of MDPI and/or the editor(s). MDPI and/or the editor(s) disclaim responsibility for any injury to people or property resulting from any ideas, methods, instructions or products referred to in the content. |
© 2025 by the authors. Licensee MDPI, Basel, Switzerland. This article is an open access article distributed under the terms and conditions of the Creative Commons Attribution (CC BY) license (https://creativecommons.org/licenses/by/4.0/).
Share and Cite
Parimelazhagan, V.; Sharma, P.; Tiwari, Y.; Santhana Krishna Kumar, A.; Ayyakannu Sundaram, G. Recycling of Walnut Shell Biomass for Adsorptive Removal of Hazardous Dye Alizarin Red from Aqueous Solutions Using Magnetic Nanocomposite: Process Optimization, Kinetic, Isotherm, and Thermodynamic Investigation. ChemEngineering 2025, 9, 40. https://doi.org/10.3390/chemengineering9020040
Parimelazhagan V, Sharma P, Tiwari Y, Santhana Krishna Kumar A, Ayyakannu Sundaram G. Recycling of Walnut Shell Biomass for Adsorptive Removal of Hazardous Dye Alizarin Red from Aqueous Solutions Using Magnetic Nanocomposite: Process Optimization, Kinetic, Isotherm, and Thermodynamic Investigation. ChemEngineering. 2025; 9(2):40. https://doi.org/10.3390/chemengineering9020040
Chicago/Turabian StyleParimelazhagan, Vairavel, Palak Sharma, Yashaswini Tiwari, Alagarsamy Santhana Krishna Kumar, and Ganeshraja Ayyakannu Sundaram. 2025. "Recycling of Walnut Shell Biomass for Adsorptive Removal of Hazardous Dye Alizarin Red from Aqueous Solutions Using Magnetic Nanocomposite: Process Optimization, Kinetic, Isotherm, and Thermodynamic Investigation" ChemEngineering 9, no. 2: 40. https://doi.org/10.3390/chemengineering9020040
APA StyleParimelazhagan, V., Sharma, P., Tiwari, Y., Santhana Krishna Kumar, A., & Ayyakannu Sundaram, G. (2025). Recycling of Walnut Shell Biomass for Adsorptive Removal of Hazardous Dye Alizarin Red from Aqueous Solutions Using Magnetic Nanocomposite: Process Optimization, Kinetic, Isotherm, and Thermodynamic Investigation. ChemEngineering, 9(2), 40. https://doi.org/10.3390/chemengineering9020040