Article

What Is the Impact of Leaky Sewers on Groundwater Contamination in Urban Semi-Confined Aquifers? A Test Study Related to Fecal Matter and Personal Care Products (PCPs)

Department of Chemistry, Life Sciences and Environmental Sustainability, University of Parma, Parco Area delle Scienze 157/A, 43124 Parma, Italy
*
Author to whom correspondence should be addressed.
Hydrology 2023, 10(1), 3; https://doi.org/10.3390/hydrology10010003
Submission received: 15 November 2022 / Revised: 12 December 2022 / Accepted: 21 December 2022 / Published: 23 December 2022
(This article belongs to the Special Issue Urban Hydrogeology: Qualitative and Quantitative Research)

Abstract

:
Urban areas exercise numerous and strong pressures on water bodies, implying that different external anthropogenic factors also stress groundwater. Sewerage networks play an important role, being the place of wastewater flow. When sewerage deterioration conditions occur, aquifers can be contaminated by contaminants contained within wastewater. The study aims to verify the impact of sewerage leaks in urban semi-confined aquifers through a multidisciplinary approach. Geological, hydrogeological, hydrochemical, microbiological, and biomolecular investigations are carried out in a test site close to a sewer pipe, from February to October 2022. Microbiological analyses are carried out on a monthly basis, contextually to hydraulic head measurements in purpose-drilled piezometers. The presence of sandy intercalations and the prevalence of silt within the outcropping (about 10 m thick) aquitard makes the aquifer vulnerable to percolation from leaky sewers, therefore causing persistent microbial contamination in groundwater. The presence of fecal indicators (including pathogenic genera), corrosive and human-associated bacteria markers, is detected. The magnitude of microbiological impact varies over time, depending on hydrogeological factors such as dilution, hydrodynamic dispersion, and variation of the groundwater flow pathway at the site scale. As for personal care products, only Disodium EDTA is detected in wastewater, while in groundwater the concentrations of all the analyzed substances are lower than the instrumental detection limit.

1. Introduction

Over the years, anthropic pressure has heavily impacted the aquatic environment and resources: land-use modifications, environmental planning, and the development of industry and agriculture are just a few examples of polluting human activities. In particular, in highly populated areas, growing urbanization implies an increase in water demand, changes in water uses, and degradation of water quality [1] since human activity also causes the release of anthropogenic contaminants into water bodies. [2,3,4,5]. Because of these strong and numerous pressures, urban areas have the potential to pollute groundwater bodies in many ways, and in Italy, national and regional legislations are contemplating the necessity to improve plans for the management and remediation of the most industrialized urban areas damaged by groundwater contamination [6]. Groundwater and surface water can be contaminated by pollutants such as hydrocarbons, nitrates, phosphorus, chlorinated solvents, heavy metals, fecal bacteria, emerging contaminants, and many others. In particular, unconfined aquifers, where only the lower limit is an impermeable layer while the upper limit is characterized by high permeability, are more vulnerable to anthropogenic pollution than confined aquifers. In fact, pollutants can more easily cross the permeable rock and contaminate groundwater [7].
In this regard, it is essential to underline sewer networks’ role in making confined or semi-confined aquifers vulnerable. Sewer networks are deemed among the most important urban infrastructure systems, as they play an essential role in protecting the urban water environment, providing public health and safety, preventing the transmission of waterborne infection, and reducing the risk of urban floods [8,9,10]. When sewerage is subject to wear and tear through exfiltration from a leaky sewerage system, groundwater may be contaminated by wastewater [11,12]. In addition to the pipes’ ages, deterioration is the other main reason for the leaks in sewerage networks. Several causes lead to pipeline structural weakening: (i) wastewater chemical characteristics, (ii) sewerage’s construction features (e.g. pipe material, installation depth, method, and size), and (iii) geological events, such as landslides and/or seismic events [13,14,15,16,17,18,19,20,21]. The vulnerability triggered within a confined or semi-confined aquifer occurs when sewer pipes are constructed at depths greater than the low permeability horizon. With the occurrence of sewer leaks, the effluents can cross the rock easily, being within a horizon with no negligible permeability.
In particular, PPCPs (pharmaceuticals and personal care products) are a unique group of emerging environmental contaminants deemed to be the markers of wastewater presence in the urban groundwater system because of their human-related use [18,22,23,24,25]. This is because PPCPs generally are poured into wastewater by excretion from a citizen’s body and washed off with tap and sink water [26]. Moreover, in sewage treatment plants, PPCPs can still be detected in the effluents since conventional treatment processes cannot remove the PPCPs from wastewater altogether [27]. For this reason, wastewater plant effluents are also inferred as a source of PPCPs, since an important fraction of them may be released into the aquatic environment through the effluents [28] and reach the aquifer through interaction with surface water courses. PPCPs have been detected in groundwater, showing that the PPCP contaminants and the following ecological risks in groundwater and surface water may be of major concern [29], generating potential risks for public health and environmental safety. Although concentrations of PPCPs in the environment are low, continuous exposure to these compounds is a critical concern with unknown long-term impacts [27].
To sum up, urban areas exercise numerous and strong pressures on water bodies, implying that different external anthropogenic factors also stress groundwater. However, there are limited data and studies on monitoring indicators of contamination from sewerage leaks.
This type of monitoring can be carried out through chemical and microbiological analysis of groundwaters. In particular, as mentioned above, the class of PPCP contaminants is considered an indicator of leaky sewers because of their domestic consumption. In addition to this, microbiological groundwater pollution is closely connected with the presence of a leaky sewerage system. Wastewaters are characterized by high bacterial loads with possible pathogens and viral agents. The microbiological water quality is then examined through the microbial groups’ identification of more straightforward determination: the indicators of fecal contamination. These microorganisms (e.g., fecal coliforms and intestinal streptococci), usually present in human feces and warm-blooded animals, are closely related to the degree of pollution from urban wastewater and their presence in groundwater. The migration of bacterial cells through natural clayey media or other low-permeability rocks has been studied mainly at the laboratory scale through column tests [30,31,32,33] and subordinately at the site scale [34,35]. In particular, Rizzo et al. (2020) showed that the porosity of clay minerals could vary from micropores (<0.002 µm diameter) to mesopores (0.002–0.05 µm diameter). Aggregation of clay particles forms pores >0.1 µm (macropores). The coexistence of micro-, meso-, and macropores leads to a nonuniform path within the clayey medium, and the migration of bacterial cells could be selectively concentrated in certain sediment volumes. Consequently, it is essential to study such phenomena at the site scale.
The main goal of this work is to present the first results of a multidisciplinary and holistic research designed through different disciplines necessary to analyze the possible impact of leaky sewers on groundwater quality in urban semi-confined aquifers, from a phenomenological point of view. Geological and hydrogeological investigations and chemical and microbiological (culture-based and biomolecular) analyses were carried out. Since chlorinated solvents and microplastics have already been detected in the Parma aquifer [36,37], testifying to the anthropic pressure exerted on groundwater, this study area was selected as a test site.

2. Materials and Methods
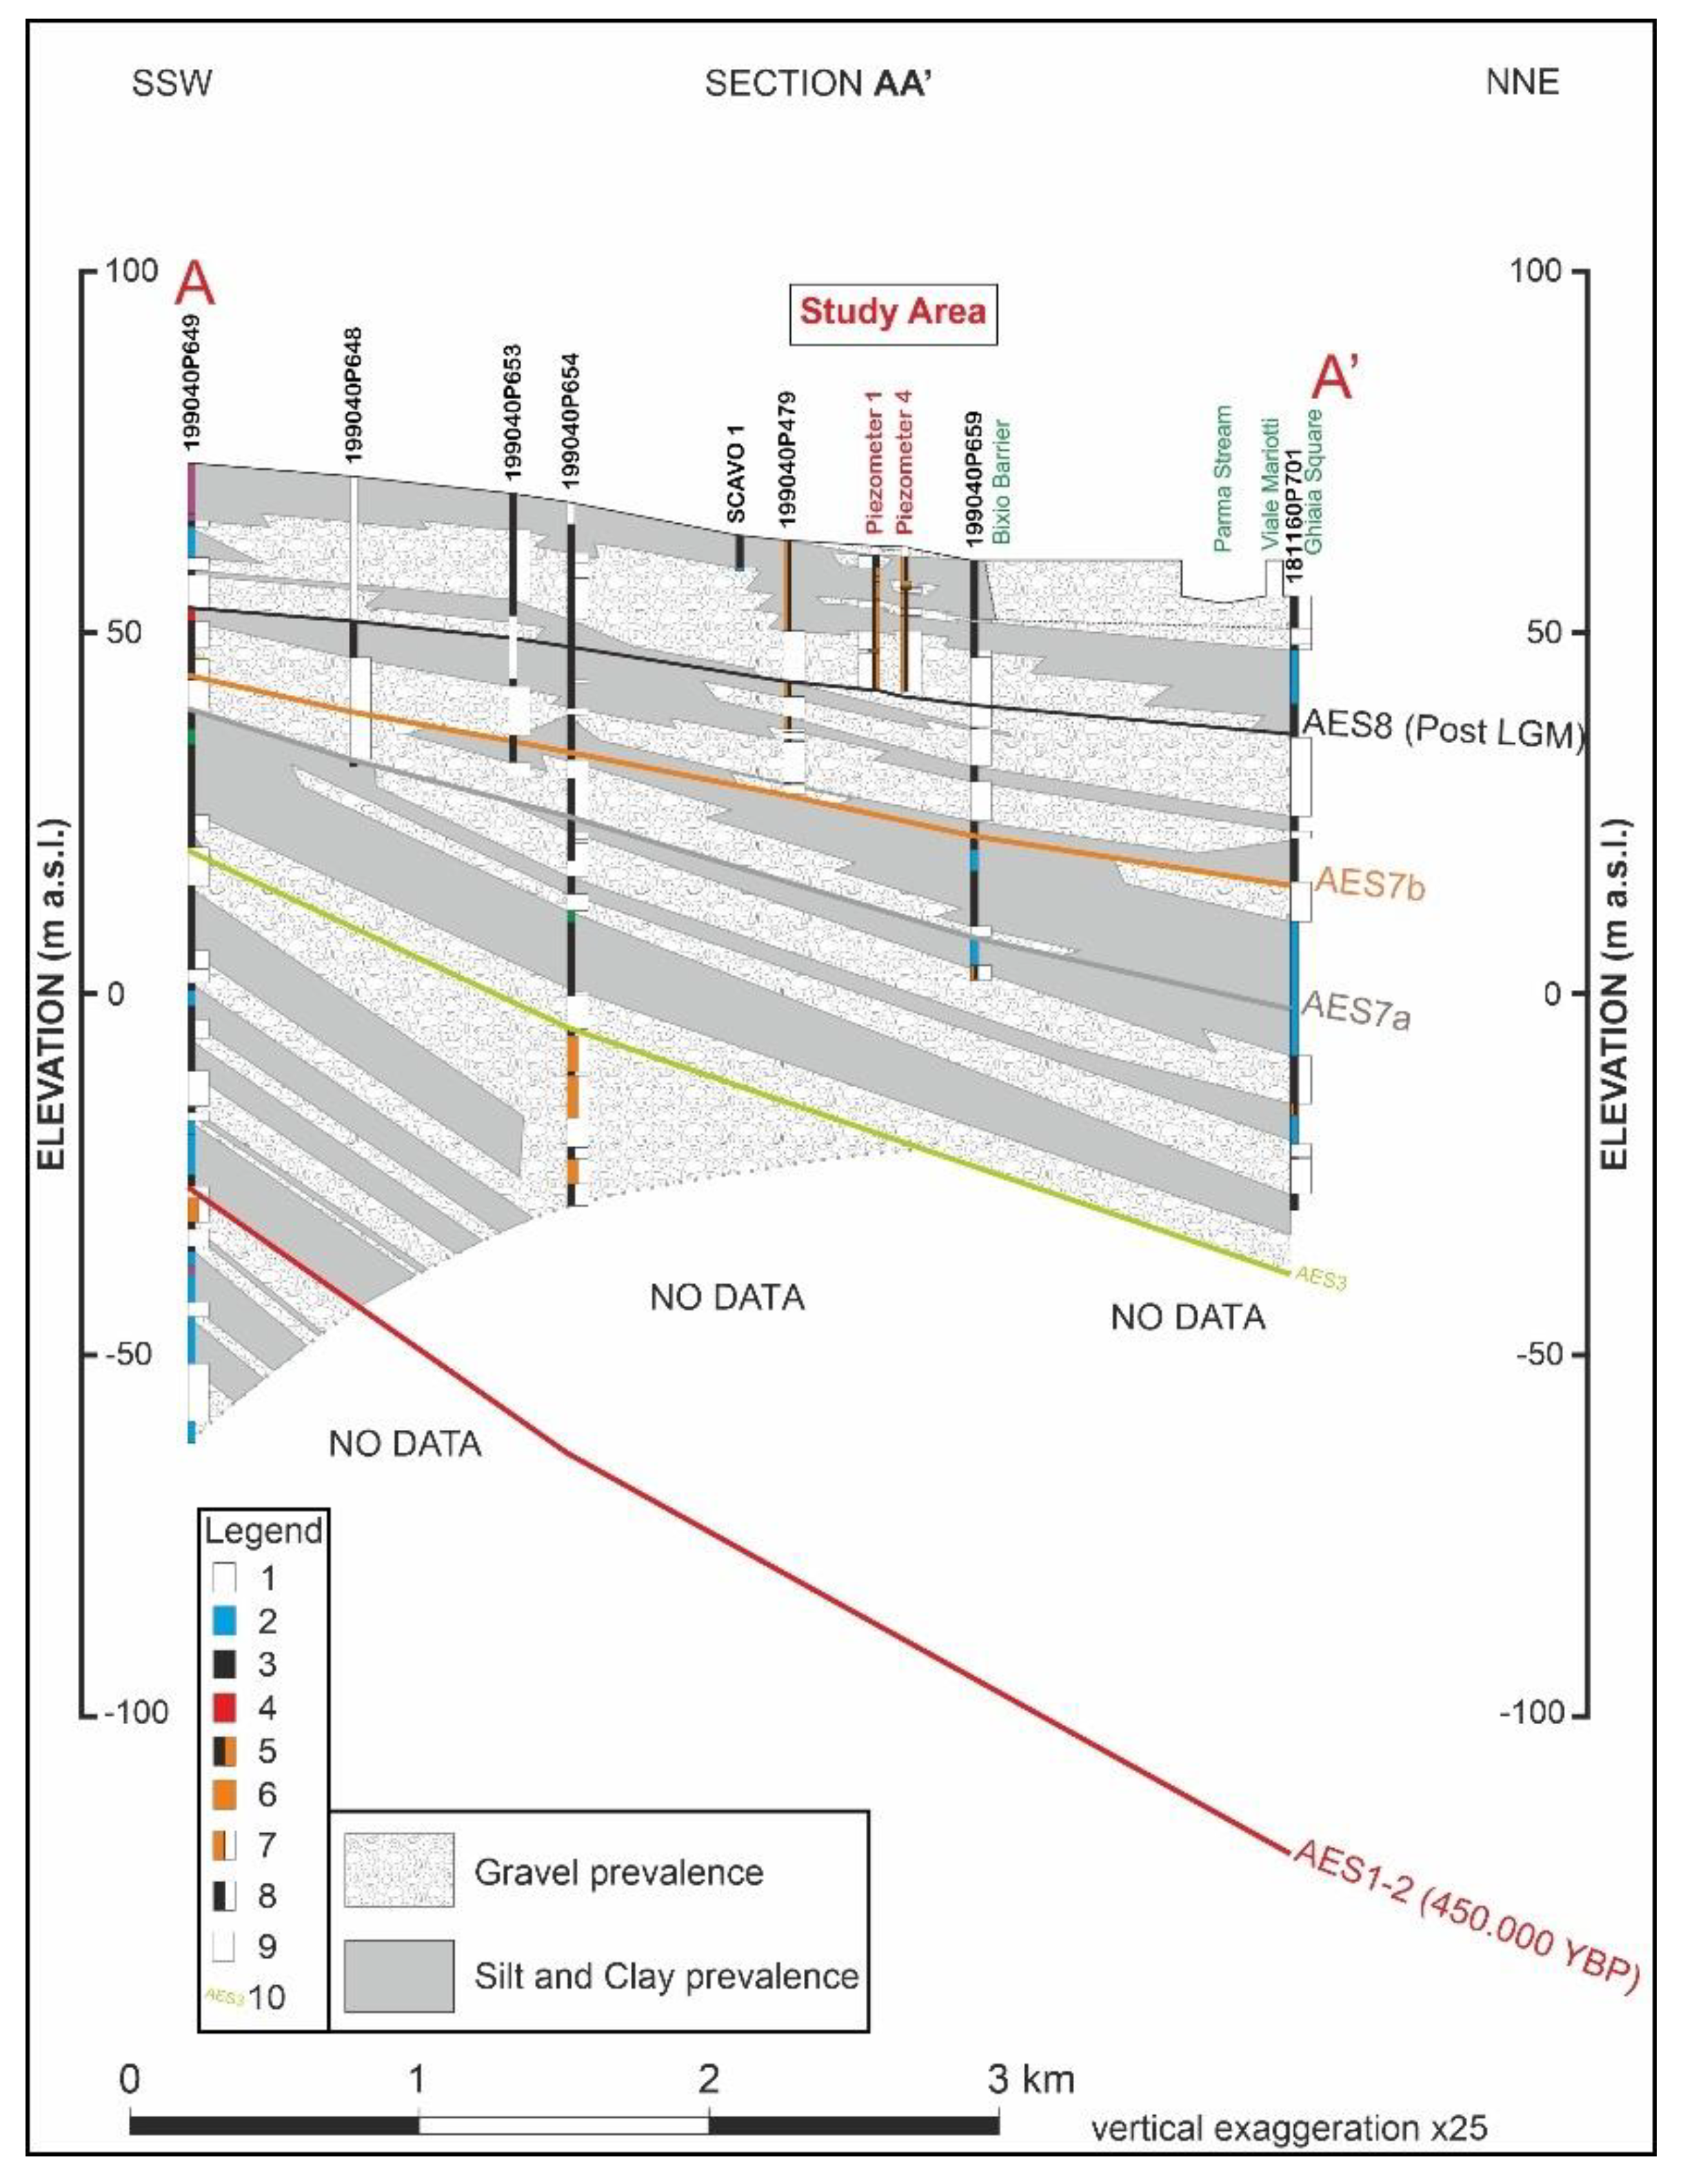
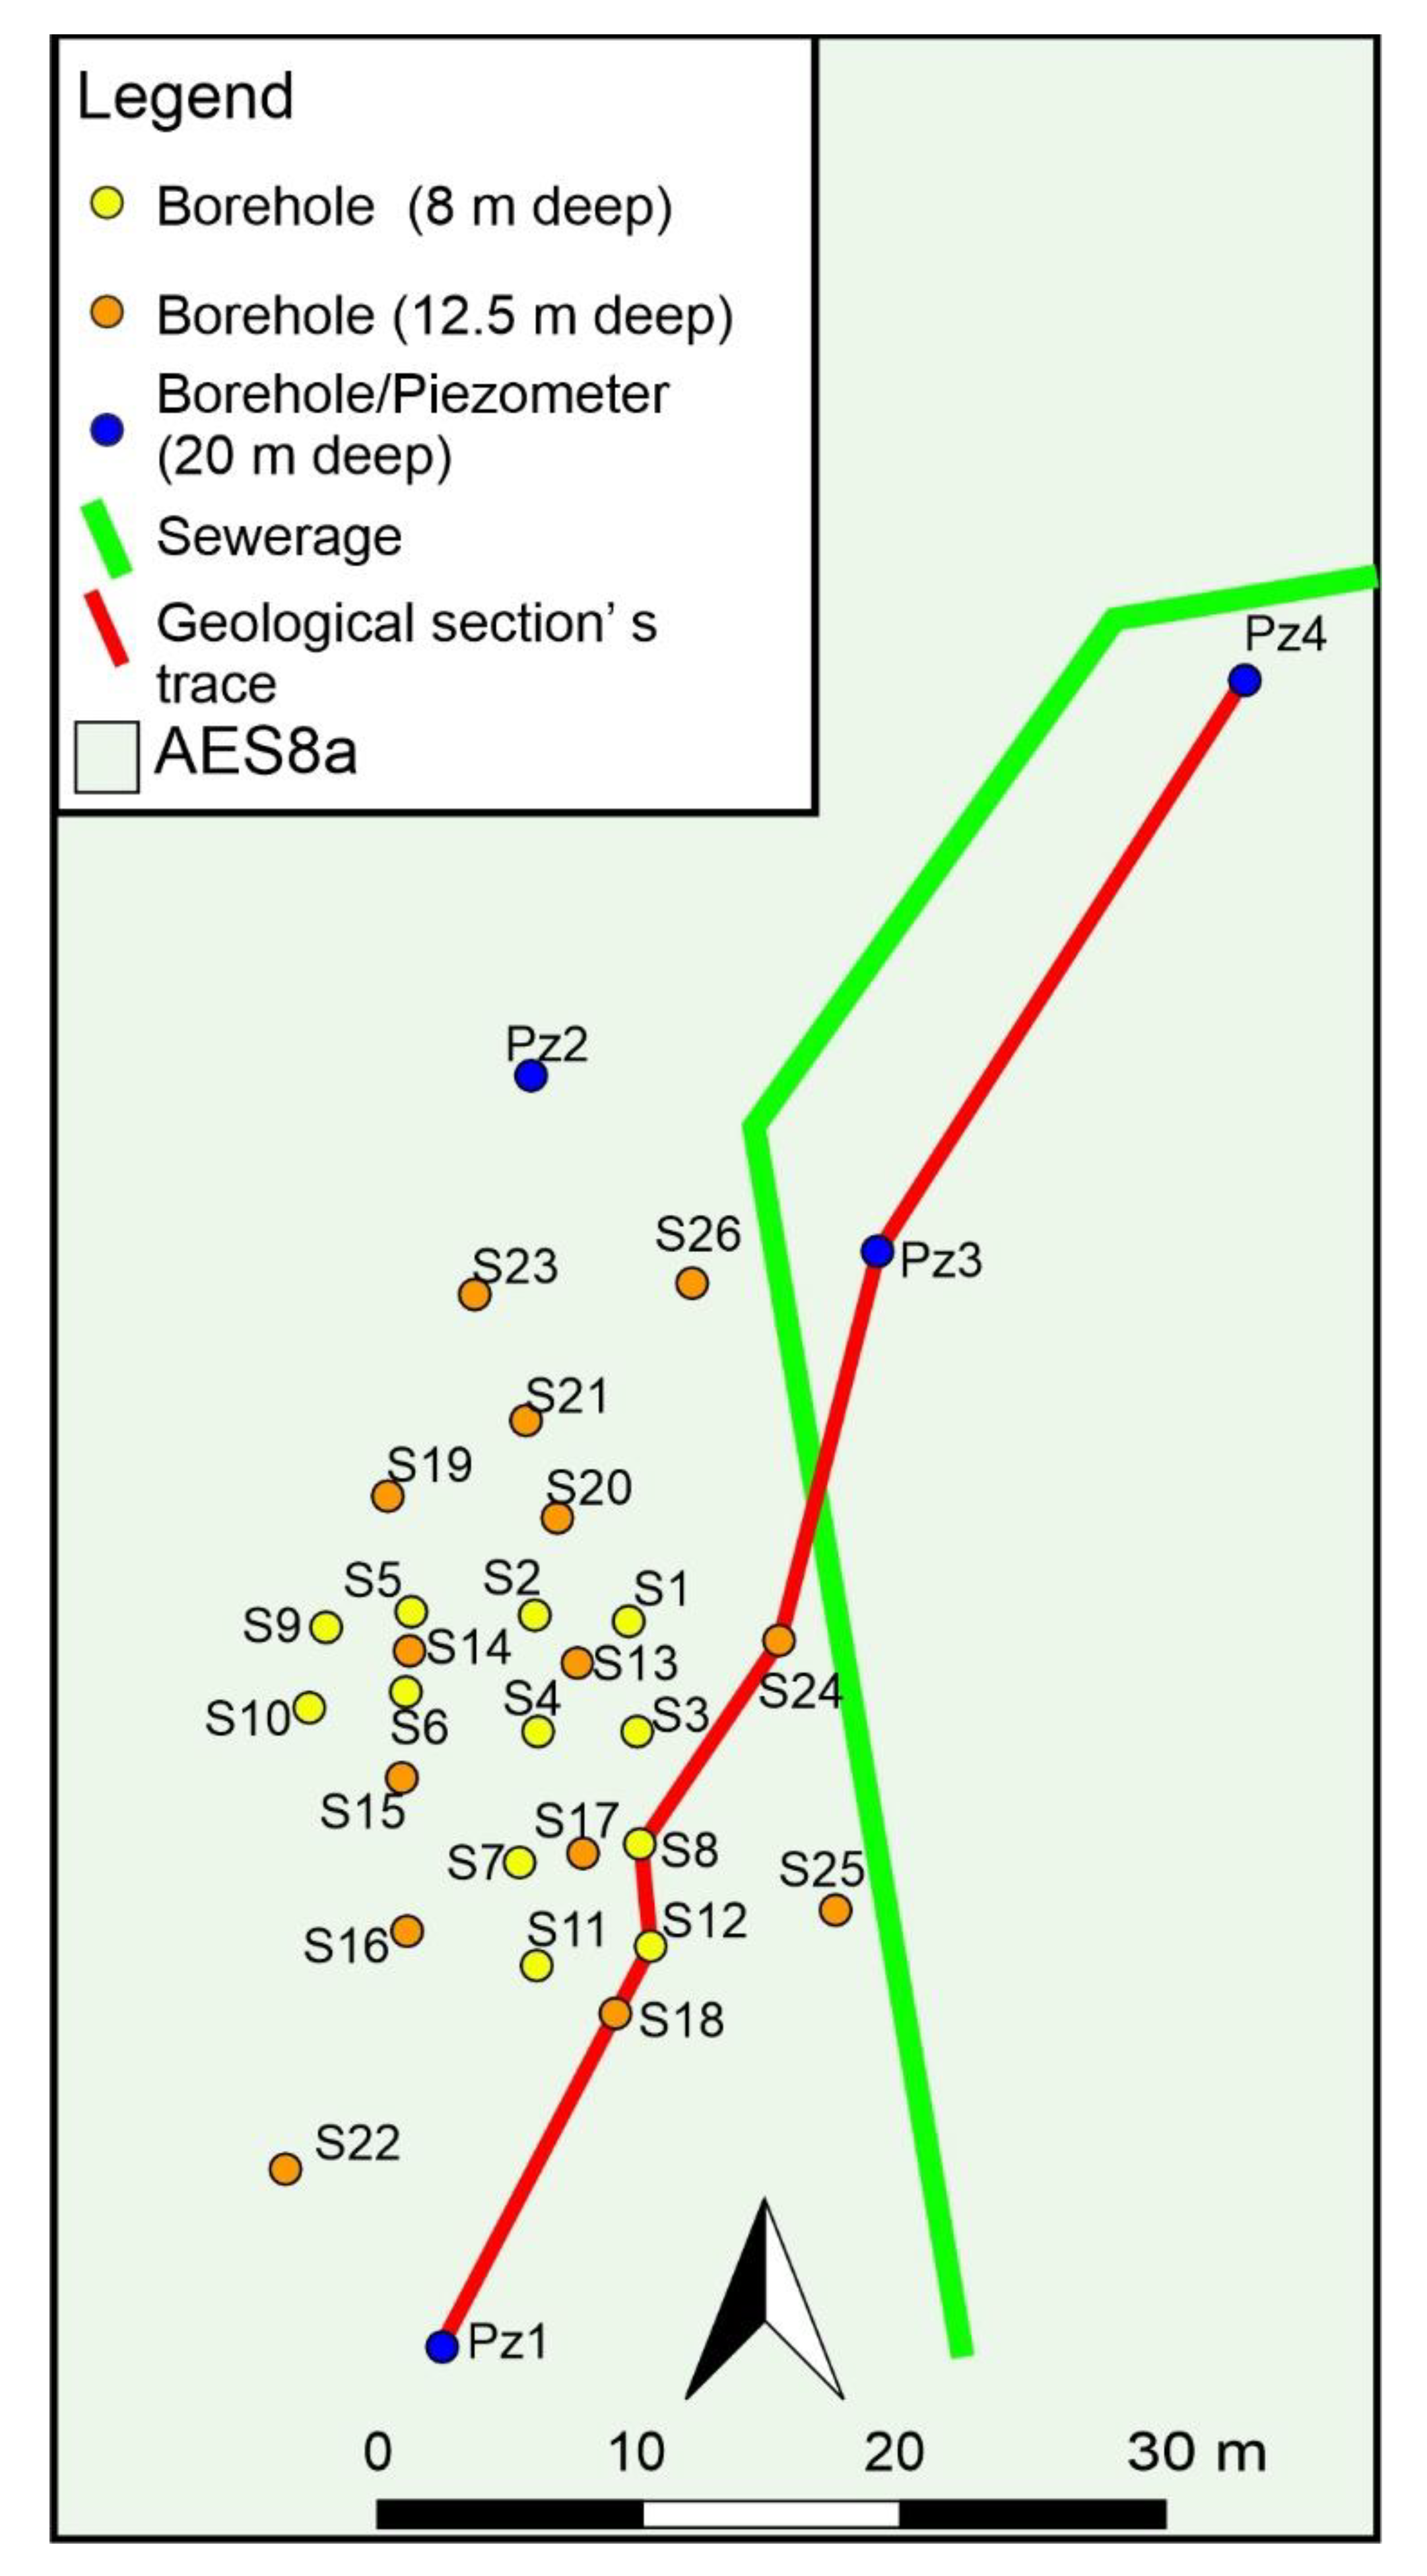
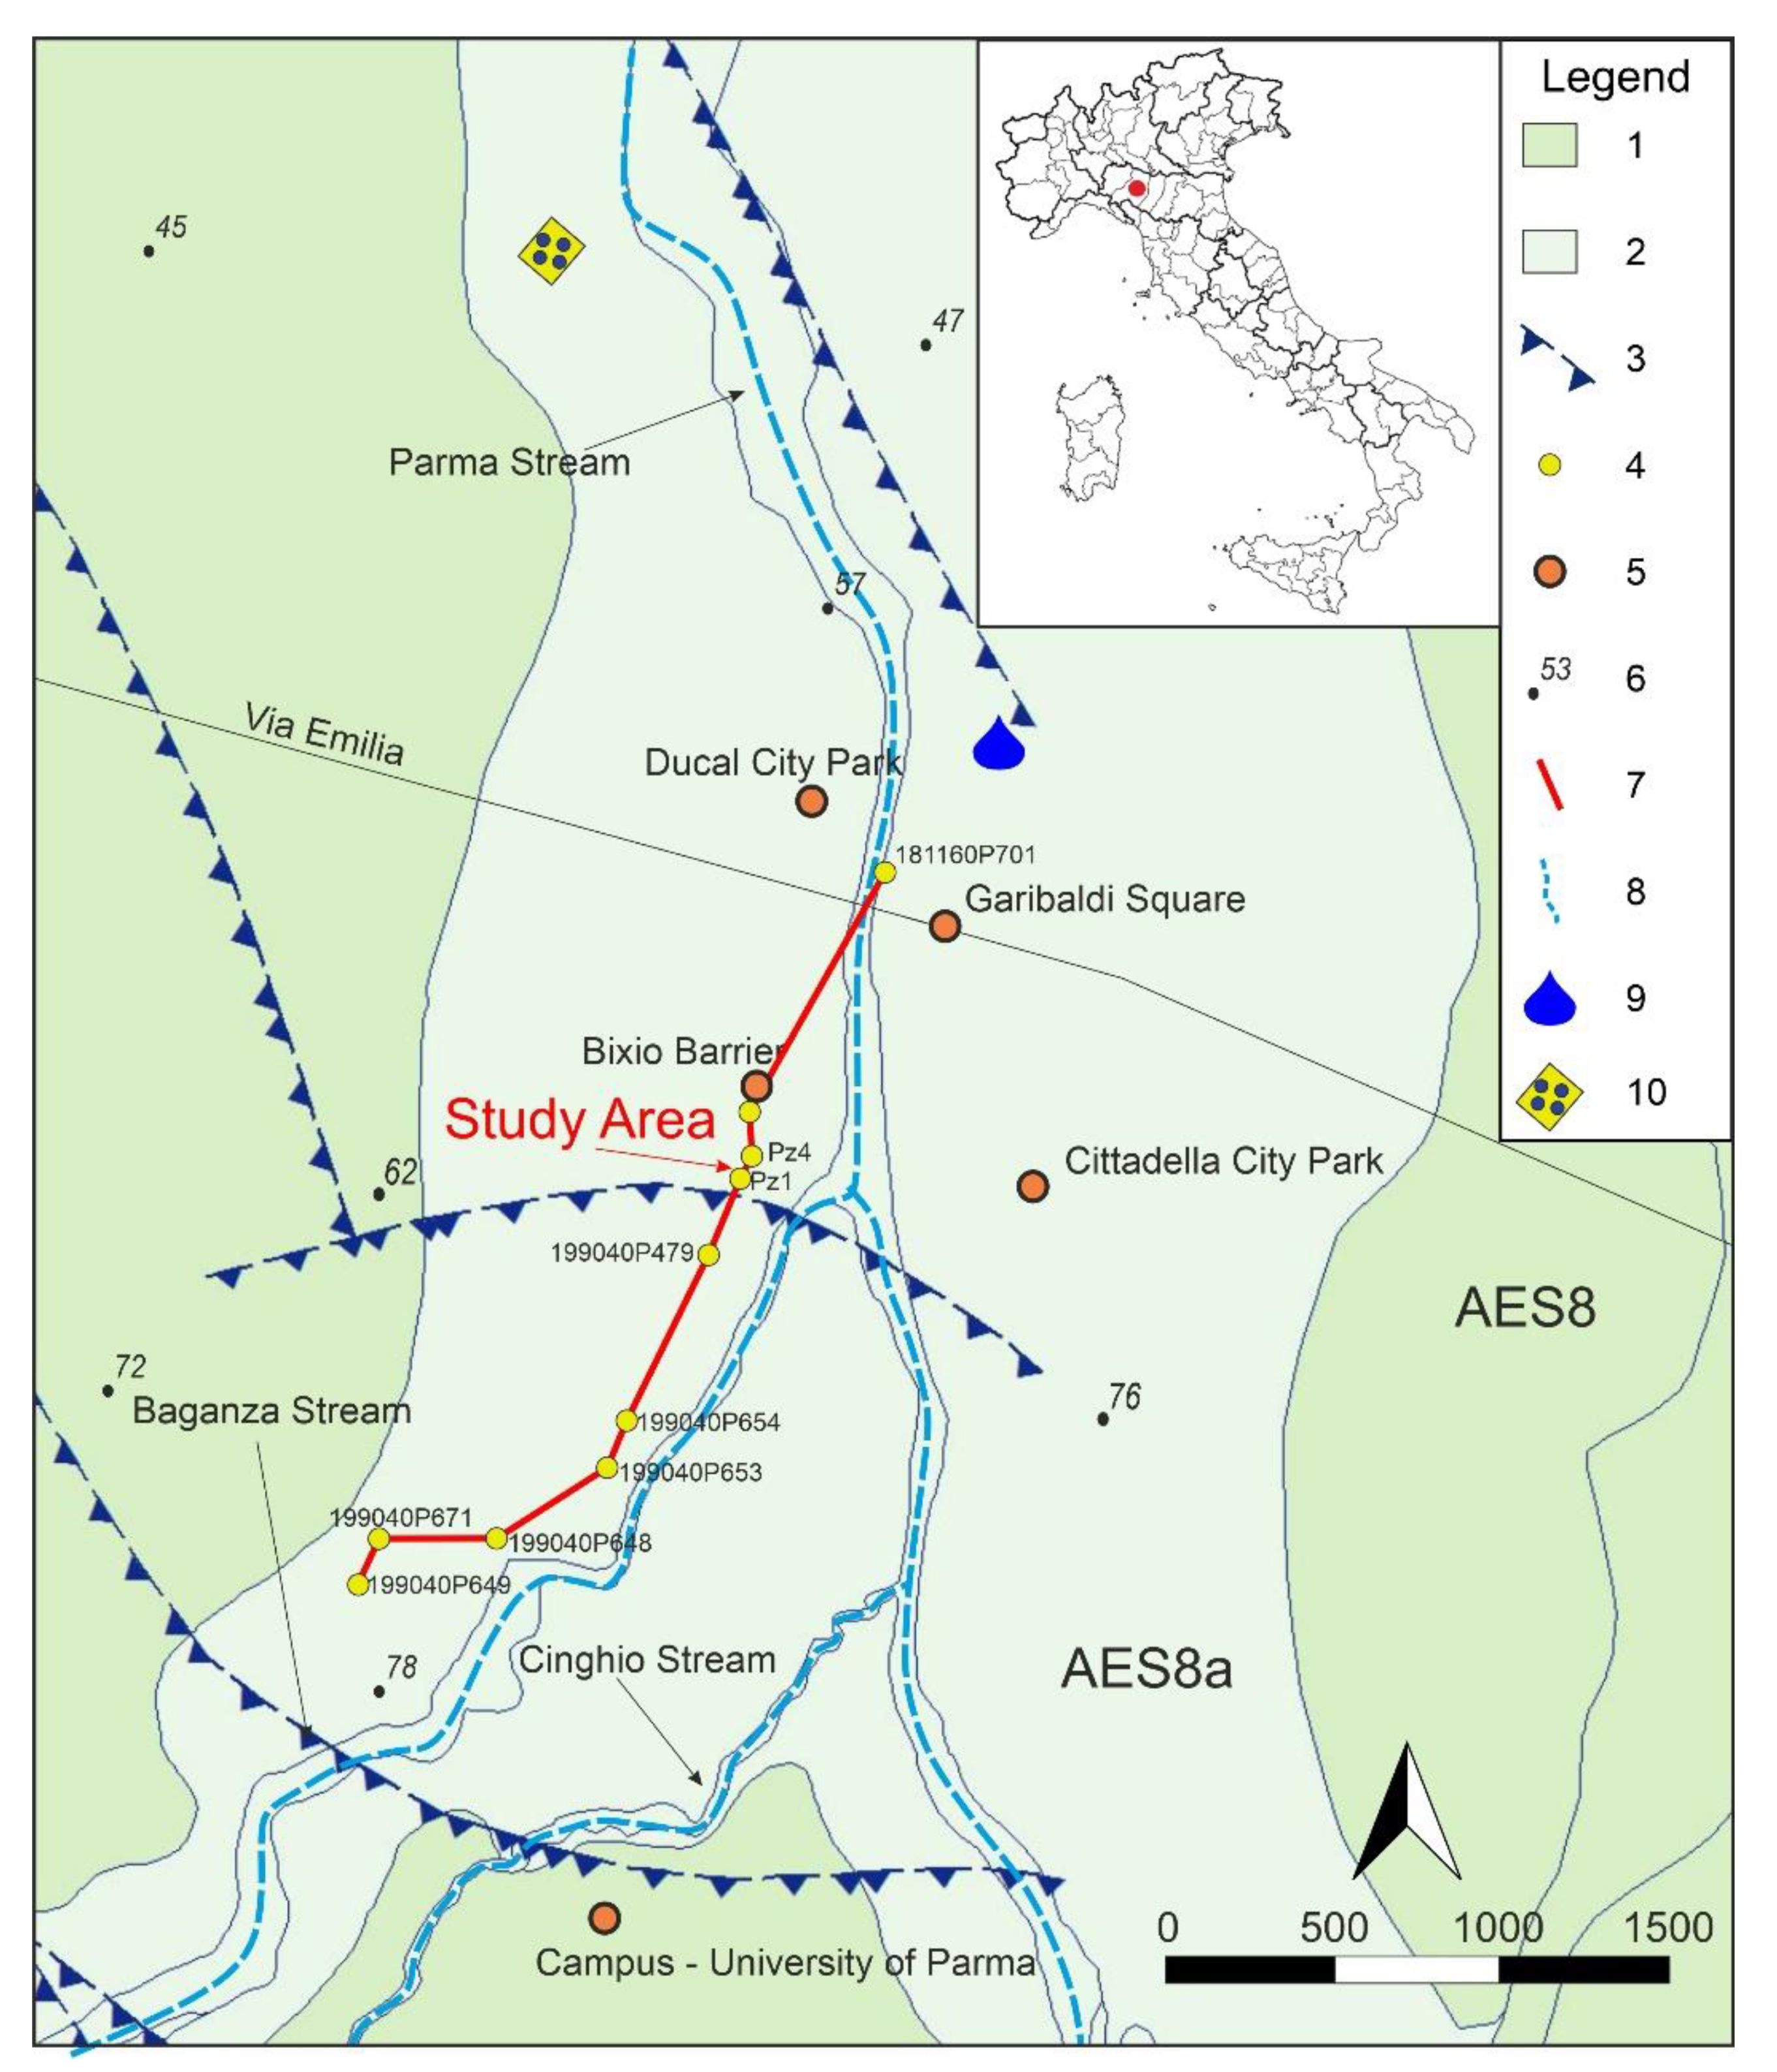
2.1. Study Area

The site was selected because of the different types of urban anthropic pressures it is subjected to. Parma is the second town by population in the Emilia Romagna region (northern Italy), representing a critical anthropogenic contamination source for surface waters and groundwater from leaks in the urban sewerage system. The area also has multiple large industrial districts, and intensive agriculture is also performed on this site. All these factors are intrinsically bound to the water body’s pollution.
From a geological point of view, this research was carried out in the alluvial Parma aquifer (Po Plain), where the groundwater flows from southwest to northeast at a basin scale [36]. The map (Figure 1) and section (Figure 2), the latest based on the interpretation of stratigraphic profiles derived from published databases by the Istituto Superiore per la Protezione e la Ricerca Ambientale (ISPRA) and Regione Emilia-Romagna, are in agreement with existing stratigraphic models [38] and reveal a sequence of geological units (or synthems) characterized by basal unconformities caused by the tectonic action of buried Apennine thrust fronts. Sedimentation in the study area derives from the alluvial dynamics of the Apennine streams that filled the Po basin during the Quaternary [39,40,41,42]. Overall, the system is made up of an alternation of fine-grained (clays and silts) and coarse-grained bodies (gravels and sands), generated by climatic cycles and shifting riverbeds that lead to a multilayered aquifer system at a basin scale. This study involves only the shallowest aquifer (a few tens of meters thick) of the whole system, characterized by post-LGM (last glacial maximum) sedimentation.

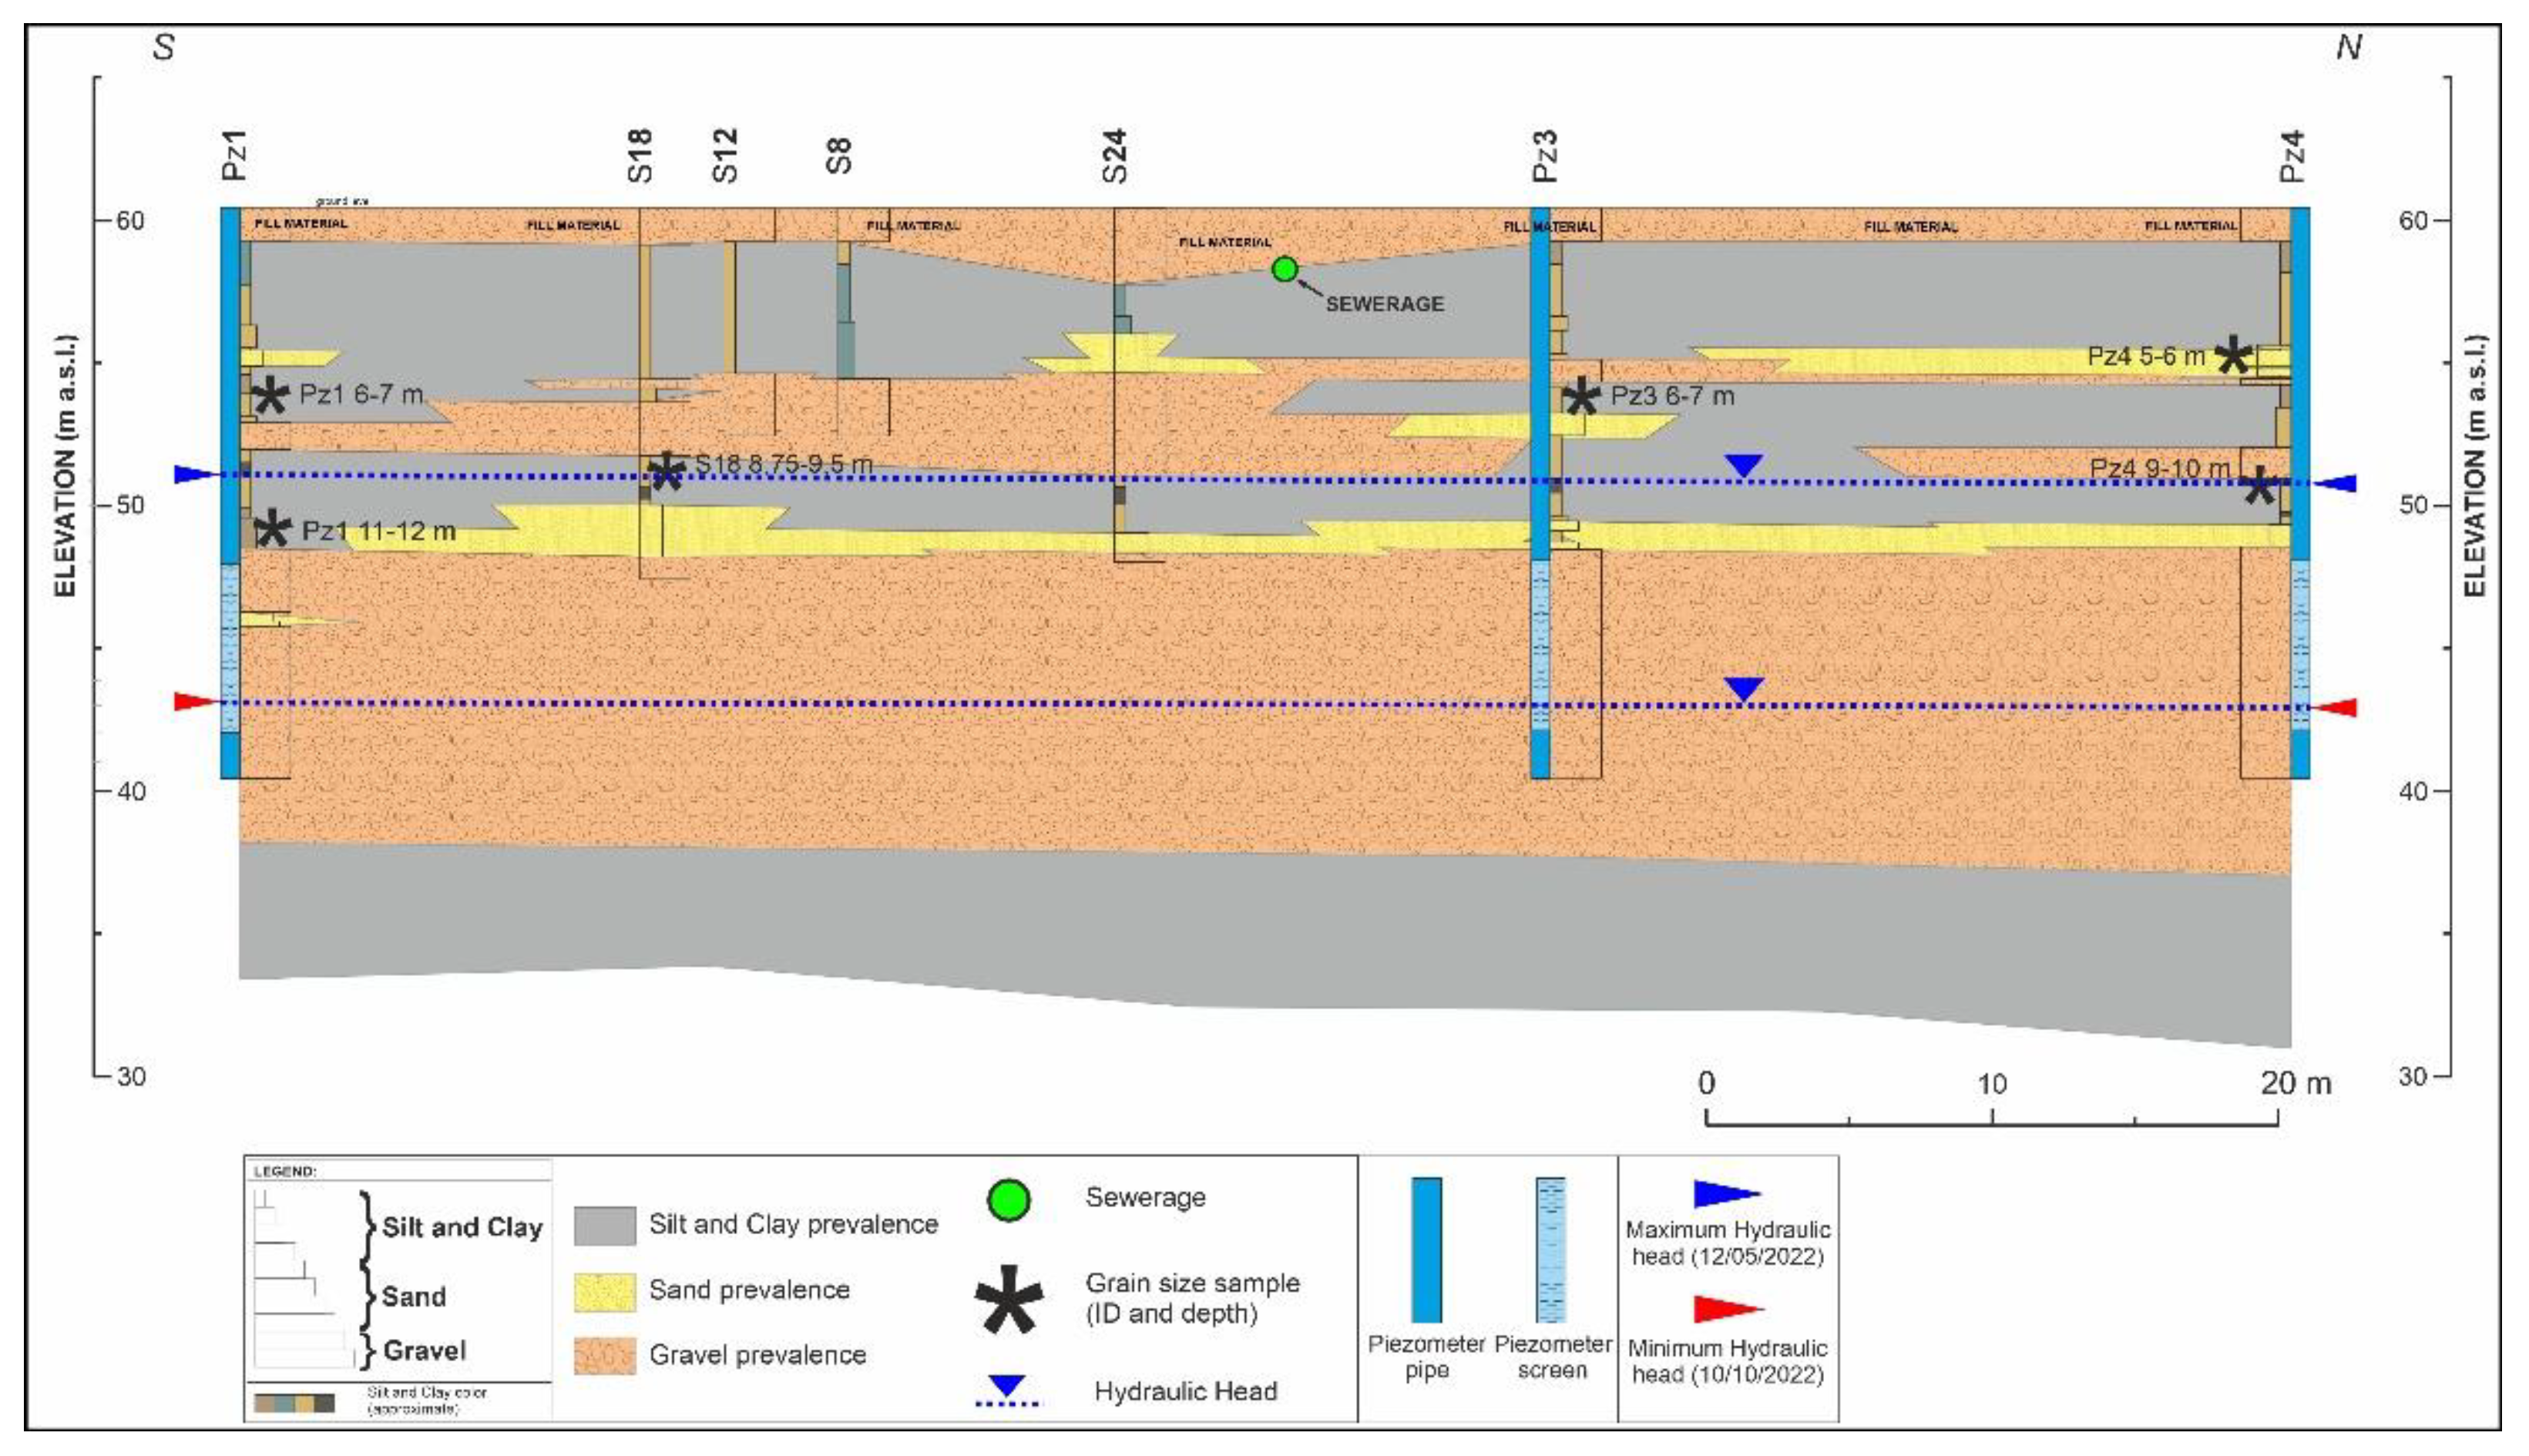
Geological and Hydrogeological Investigations

Geological investigations were carried out to (i) reconstruct in detail the geological features of both the unsaturated and the saturated media within the shallowest aquifer that directly interacts with the underground sewer systems and to (ii) quantitatively detect, at the site scale, the grain size of fine-grained layers to define the integrity [43] of the unsaturated aquitard to fecal bacteria and PCPs migration.
Geological characterization of the study area involved 30 continuous core borings (Figure 3) with a drilling diameter of 4 inches and depths varying between 8 and 20 meters below the ground surface. Extracted core samples have been stored in dedicated cataloging boxes, and an accurate lithological description was made for each drill hole. These on-site descriptions were taken during drilling and included grain size and chromatic variety recognition. Subsequently, the rock samples were studied by particle size analysis in the laboratory.
A total of six samples collected from core plugs were dedicated to grain size analysis. Small amounts of granular material were carefully extracted with a precision chisel from the middle portion of the plugs to avoid alteration along the side walls. All samples were dried in an oven at the controlled temperature of 35 °C for two days to remove most of the moisture and to ease disaggregation. Sample masses collected from the core plugs varied from 0.15 to 0.32 g. Prior to the analysis, samples were disaggregated in tap water via mechanical stirring for two minutes; then, disaggregated materials were left resting for 30 minutes. Grain size analyses were carried out with a Mastersizer 3000 (Malvern Panalytical®) laser diffraction granulometer. The laser granulometer calculates the grain size distribution of particles having an equivalent diameter ranging from 10 nm to 3500 µm. The instrument was equipped with a Hydro EV liquid dispersion unit, suitable for analyzing previously disaggregated low cohesion samples. Following previous work [44], a specific standard operating procedure was developed to analyze all samples efficiently and to minimize the alteration during the analysis. To allow the disaggregation of the fine-grained, clayey-silt samples, a preliminary phase of ultrasonication was needed before the analysis. Analyses were replicated with 25 successive runs for each sample, and the grain size distribution was defined by an average particle diameter, modal value, and span (sorting degree) with associated standard deviation. Data regarding sand, silt, and clay fractions were obtained after the conversion to the Udden–Wentworth standard grain size classes. Details of the analytical parameters adopted during grain size analysis and information regarding the standard operating procedure are provided in the Supplementary Materials (SM.pdf).
Four of the boreholes (Pz1 to Pz4 in Figure 3) were equipped with 20 m deep piezometers screened from 12.60 to 18.90 m below ground. Hydraulic head measurements were carried out in all piezometers with a water level meter from March to October 2022, monthly. The daily rainfall data to be compared to hydraulic head fluctuations were acquired by the Regional Agency for Prevention, Environment, and Energy of Emilia-Romagna (Arpae). The rainfall monitoring station is located in Parma (Figure 1).
Contextually, physico-chemical parameters such as temperature, pH, electrical conductivity (EC), redox potential, and total dissolved solids (TDS) were measured in situ with the multiparameter HANNA probe (mod. HI9828, HANNA Instruments, Villafranca Padovana, Italy).

2.2. Water Sampling and Analyses

Water-sampling activities related to chemical–physical parameters and piezometric monitoring were carried out monthly (from February 2022 to October 2022) on the four piezometers drilled within the test site (Pz1, Pz2, Pz3 and Pz4). In parallel to these sampling activities, microbiological monitoring of fecal indicators was carried out monthly in Pz3, which is the piezometer drilled closest to the sewer system, within the test site (Figure 3). In the same piezometer (Pz3), chemical (PCPs) and biomolecular (bacterial community) analyses were also carried out only once, in June 2022, and the same analyses were also performed in the incoming wastewater of the sewage treatment plant (Parma Ovest).

2.3. Chemical Analyses

Three substances commonly used in cosmetics were selected for the chemical analyses: (i) 2-phenoxyethanol, which is a bactericidal agent widely used in cosmetics as a preservative, (ii) dimethicone, which is the most widely used silicone in cosmetics and is not subject to European regulations, (iii) disodium EDTA, which is a chelating agent: it reacts and forms complexes with metal ions that can affect the stability and/or appearance of cosmetic products; the Organization for Economic Cooperation and Development (OECD) classifies disodium EDTA as a remarkably persistent and not biodegradable substance in the environment.
Three groundwater samples were collected in Pz3 to analyze the content of 2-phenoxyethanol (CAS number: 122-99-6), dimethicone, and disodium EDTA (CAS number: 139-33-3); 50 milliliter (mL), 1 liter (1L), and 250 milliliter (mL) ambered glass bottles were used for 2-phenoxyethanol, dimethicone, and disodium EDTA analyses, respectively. In addition, three samples were collected at the entrance of the "Parma Ovest" wastewater treatment plant to verify if wastewater, which flows into the pipes close to Pz3, was characterized by the presence of these three contaminants.
All samples were stored in a refrigerated box and transported to the laboratory. The analyses were performed at Analytice s.a.r.l. (société à responsabilité limitée), a laboratory with ISO 17025 accreditation recognized by the French Accreditation Committee (ILAC full members). In particular, GC/MS was performed to analyze 2-phenoxyethanol. The samples were analyzed according to an accredited in-house method. After the addition of potassium carbonate, the samples were extracted with ethanol. The extracts were then injected into gas chromatography (column RTX-WAX) coupled to a mass spectrometer detector (GC-MS). GC/MS after derivatization was also used to quantify disodium EDTA. Samples were analyzed versus EDTA, and values were then calculated into disodium EDTA. The samples were analyzed according to EN ISO 16588. The samples were derivatized with isopropanol/acetylchlorid and extracted with hexane. The extracts were then injected into gas chromatography (column DB-XLB) coupled to a mass spectrometer detector (GC-MS). Dimethicone was analyzed according to an in-house method. First, the samples were extracted with hexane. Next, the extracts were injected into high-pressure liquid chromatography coupled to a refractive index detector (HPLC-RI). Samples were determined as PDMS (CAS 63148-62-9) and calculated as polydimethylsiloxane with a viscosity of 1000 mPa.s with HPLC/RI after hexane extraction.

2.4. Next-Generation Sequencing (NGS) for Bacterial Community Analyses

NGS (next-generation sequencing) analyses were carried out to verify whether (i) the bacterial community in groundwater is characterized by pathogenic bacteria and/or human-associated bacteria markers and/or bacteria potentially capable of degrading PCPs (or xenobiotics in general) and (ii) the bacterial community in wastewaters is characterized by microorganisms potentially capable of enhancing the corrosion of pipelines. More generally, microbial community characterization in heterogeneous and complex hydrogeological systems will be used as an effective natural tracer to refine knowledge about (i) hydrodynamic and hydrochemical processes, as well as (ii) recharge and/or contaminant origin [35,45,46,47].
The bacterial community characterization was carried out in Pz3 groundwater and in wastewater samples collected at the entrance of the “Parma Ovest” treatment plant (IN sample). Both ground- and wastewater samples (2 L) were collected in sterile bottles. All samples were stored in a refrigerated box and transported to the laboratory. The samples were filtered through sterile mixed esters of cellulose filters (S-PakTM Membrane Filters, 47 mm diameter, 0.22 µm pore size, Millipore Corporation, Billerica, MA, USA) within 24 h of collection. Bacterial DNA extraction from filters and soils was performed using the commercial kit FastDNA SPIN Kit for soil (MP Biomedicals, LLC, Solon, OH, USA) and FastPrep®Instrument (MP Biomedicals, LLC, Solon, OH, USA). After the extraction, DNA integrity and quantity were evaluated by electrophoresis in 0.8% agarose gel containing 1µg/mL of Gel-RedTM (Biotium, Inc., Fremont, CA, USA). The bacterial community profiles in the samples were generated by next-generation sequencing (NGS) technologies at the Genprobio Srl Laboratory. Partial 16S rRNA gene sequences were obtained from the extracted DNA by polymerase chain reaction (PCR) using the primer pair Probio_Uni and Probio_Rev, targeting the V3 region of the bacterial 16S rRNA gene [48]. Amplifications were carried out using a Veriti Thermal Cycler (Applied Biosystems, Foster City, CA, USA), and PCR products were purified by the magnetic purification step involving Agencourt AMPure XP DNA purification beads (Beckman Coulter Genomics GmbH, Bernried, Germany) to remove primer dimers. Amplicon checks were carried out as previously described [47]. Sequencing was performed using an Illumina MiSeq sequencer (Illumina, Hayward, CA, USA) with MiSeq Reagent Kit v3 chemicals. The fastq files were processed using a custom script based on the QIIME software suite [49]. Paired-end read pairs were assembled to reconstruct the complete Probio_Uni/Probio_Rev amplicons. Quality control retained sequences with a length between 140 and 400 bp and a mean sequence quality score >20, while sequences with homopolymers >7 bp and mismatched primers were omitted. To calculate downstream diversity measures, operational taxonomic units (OTUs) were defined at 100% sequence homology using DADA2 [50]; OTUs not encompassing at least two sequences of the same sample were removed. All reads were classified to the lowest possible taxonomic rank using QIIME2 [49,51] and a reference dataset from the SILVA database v132 [52]. The biodiversity of the samples (alpha diversity) was calculated with the Shannon index. Similarities between samples (beta diversity) were calculated by weighted uniFrac. The range of similarities is calculated between values 0 and 1. Principal coordinate analysis (PCoA) representations of beta diversity were performed using QIIME2. In the PCoA, each dot represents a sample distributed in tridimensional space according to its bacterial composition.

2.5. Microbiological Investigations (Fecal Indicators)

For microbiological analyses (fecal indicators), groundwater samples (1 L) were collected in sterile bottles. All samples were stored in a refrigerated box and transported to the laboratory. Filtration processes were carried out within 2 h after collection. Indicators of microbial contamination were determined in groundwater samples using classic methods of water filtration (1000 mL) on sterile membrane filters (GN-6 Metricel, pore size 0.45 μm, Pall), with incubation on: (1) m-FC Agar for 24 h at 44 °C, for fecal coliforms and (2) Slanetz–Bartley agar for 48 h at 37 °C for intestinal enterococci.

3. Results

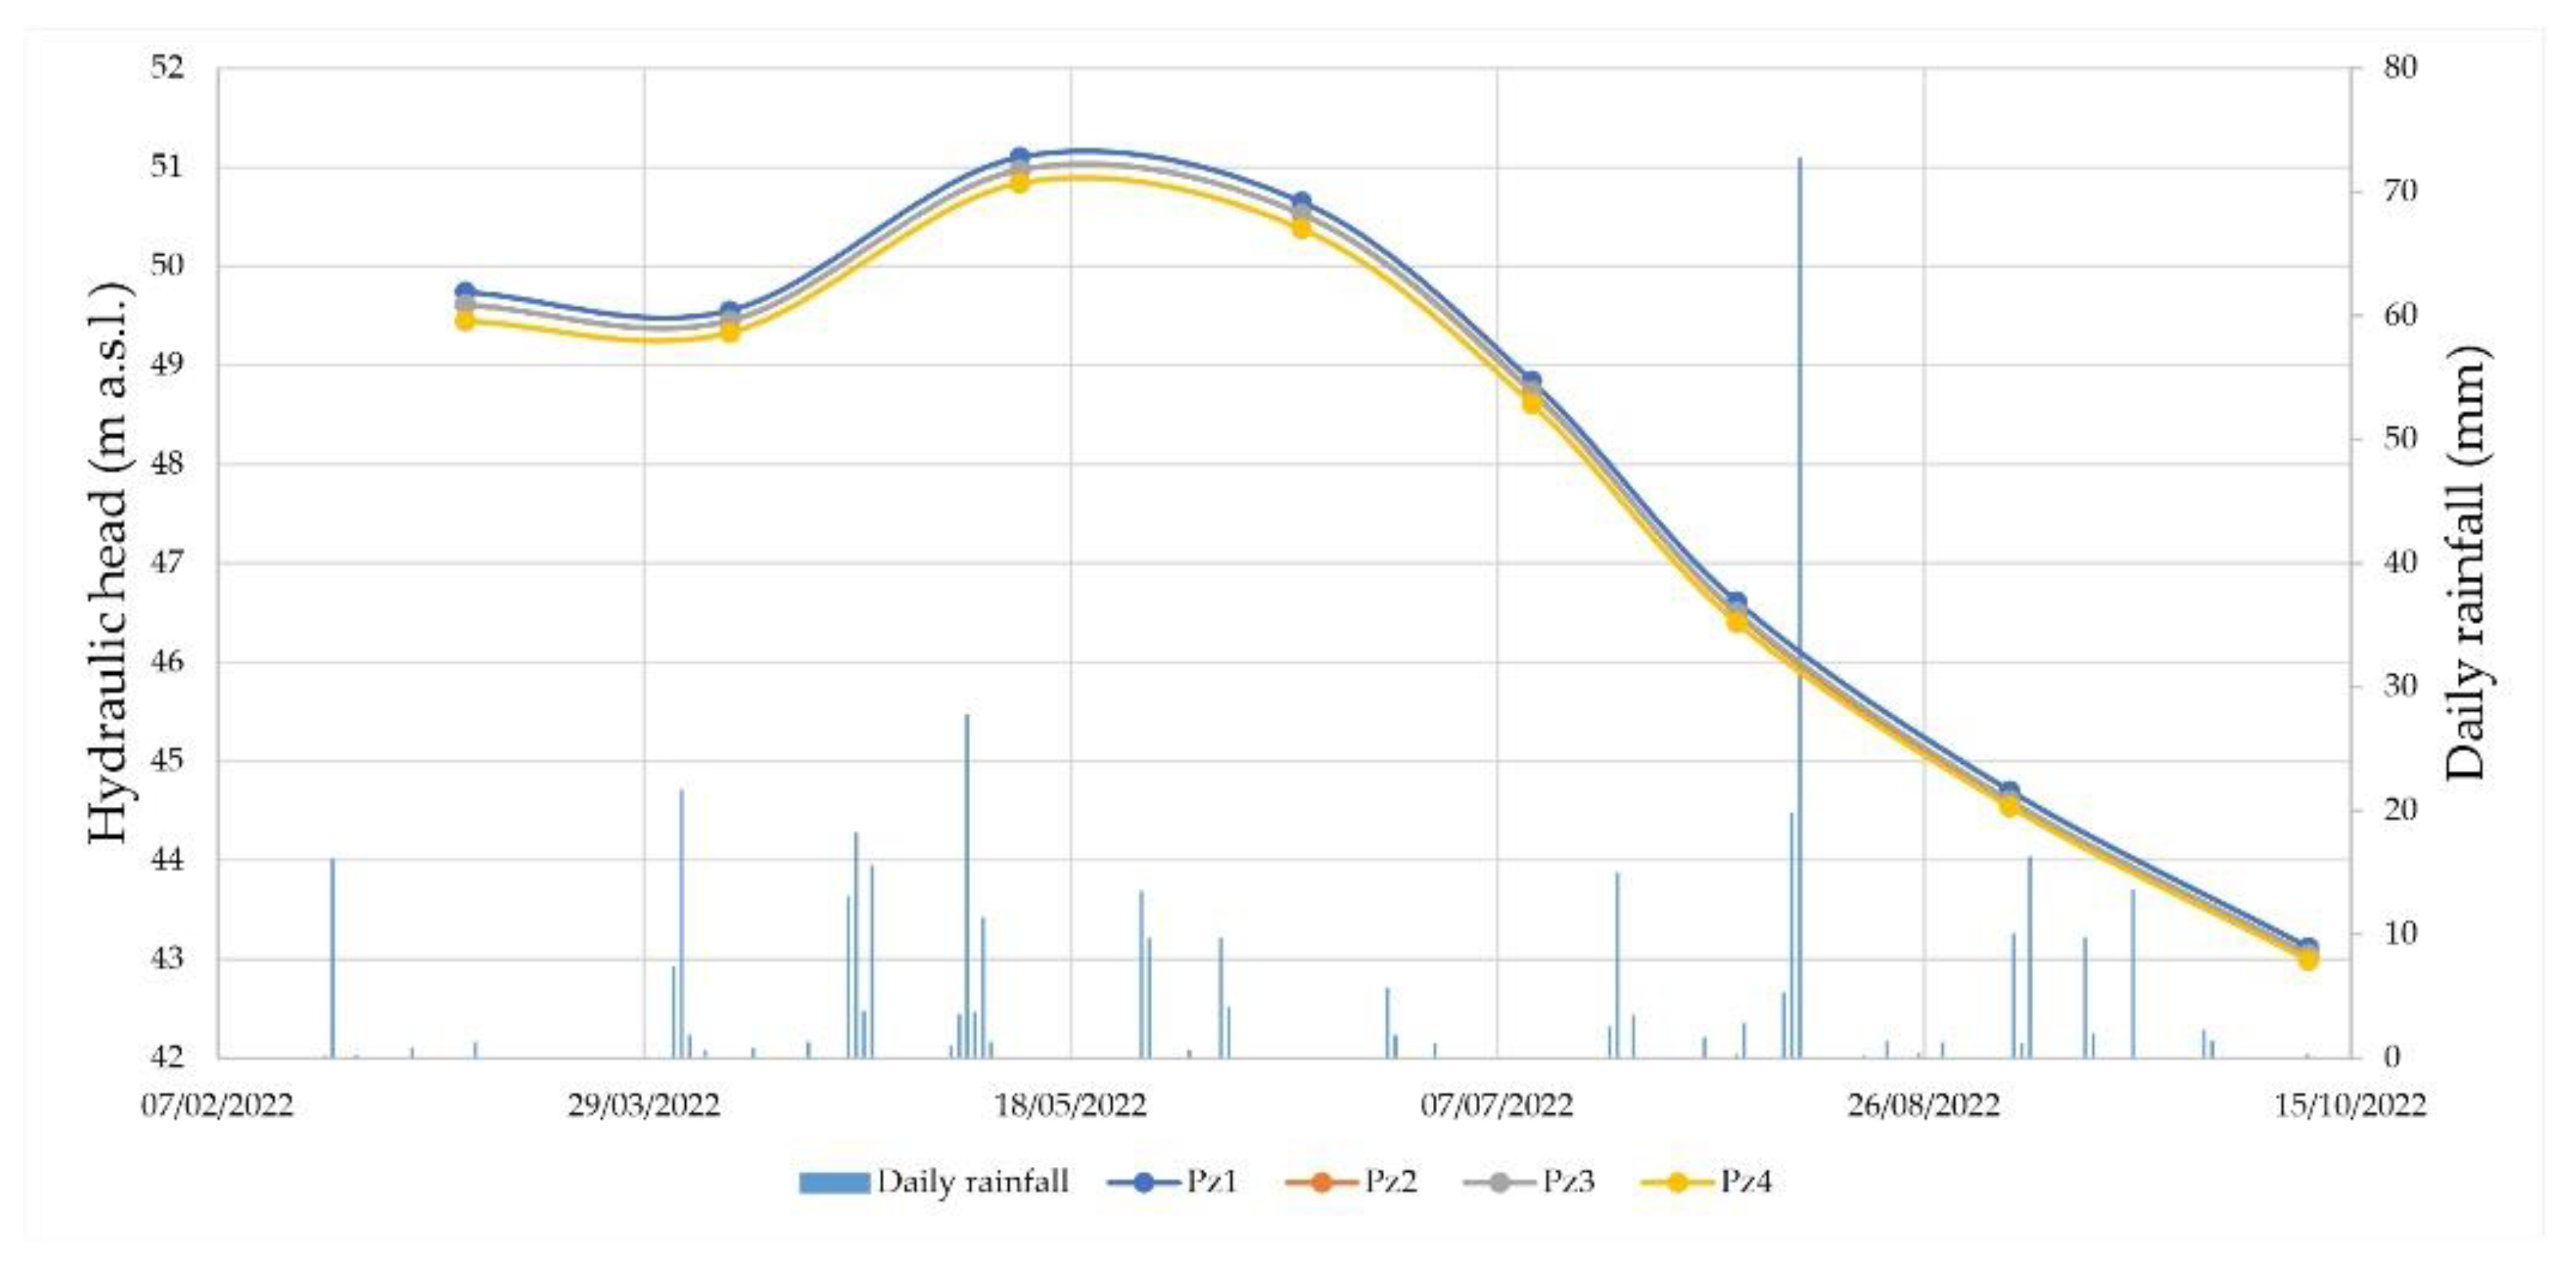
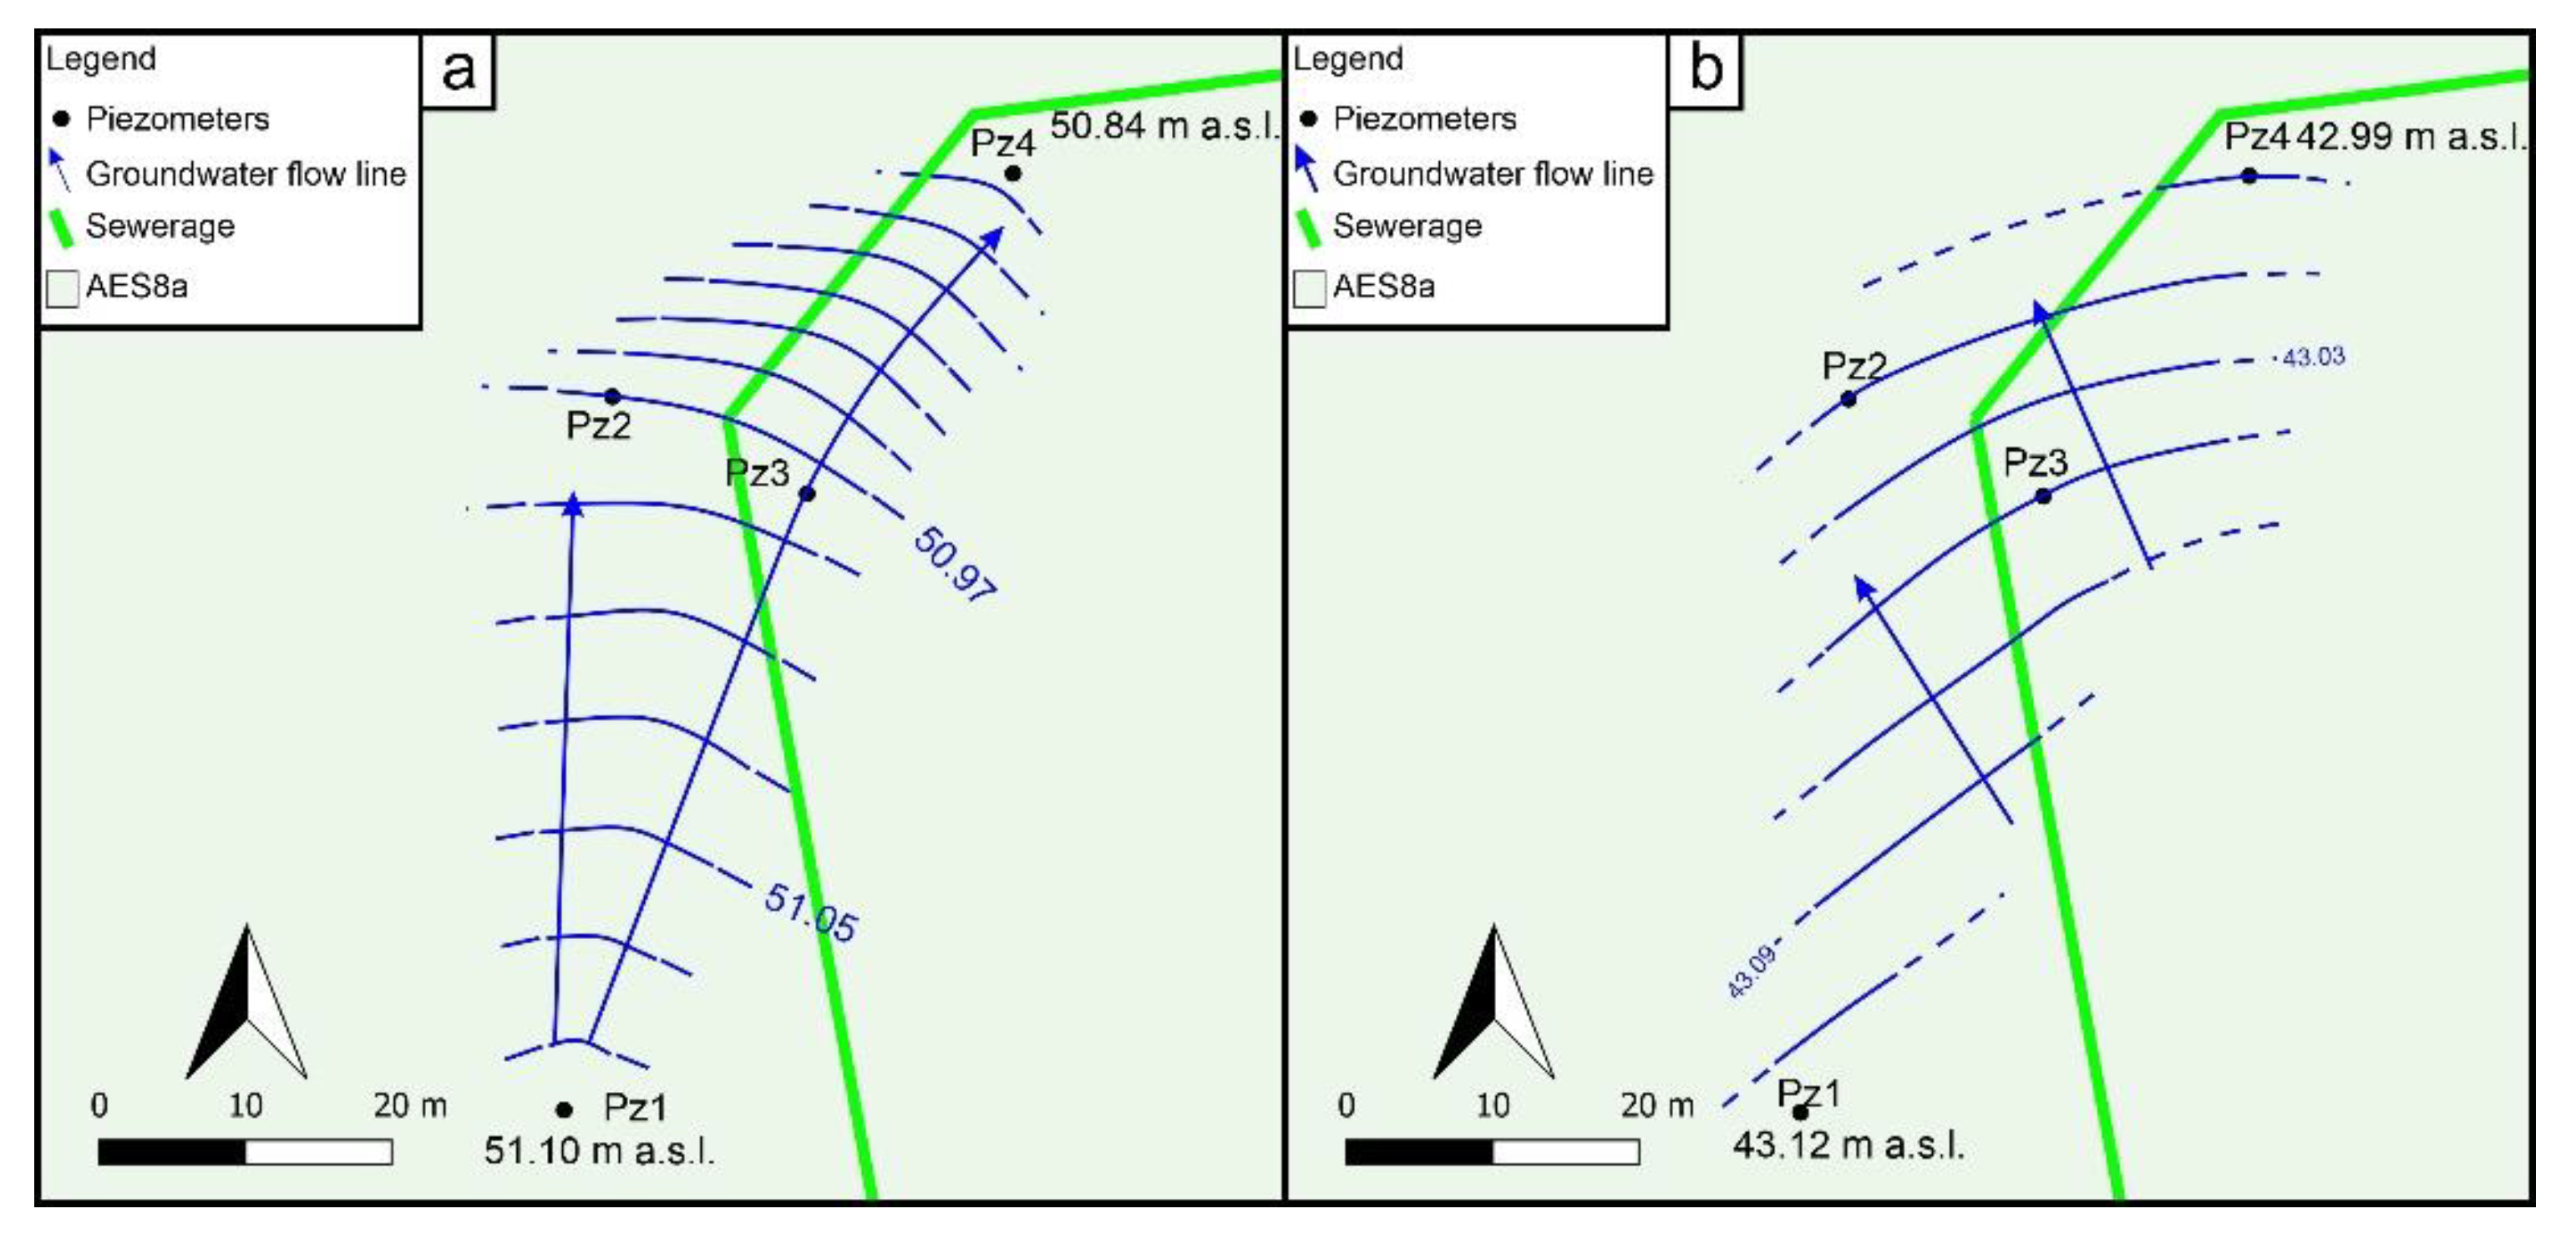
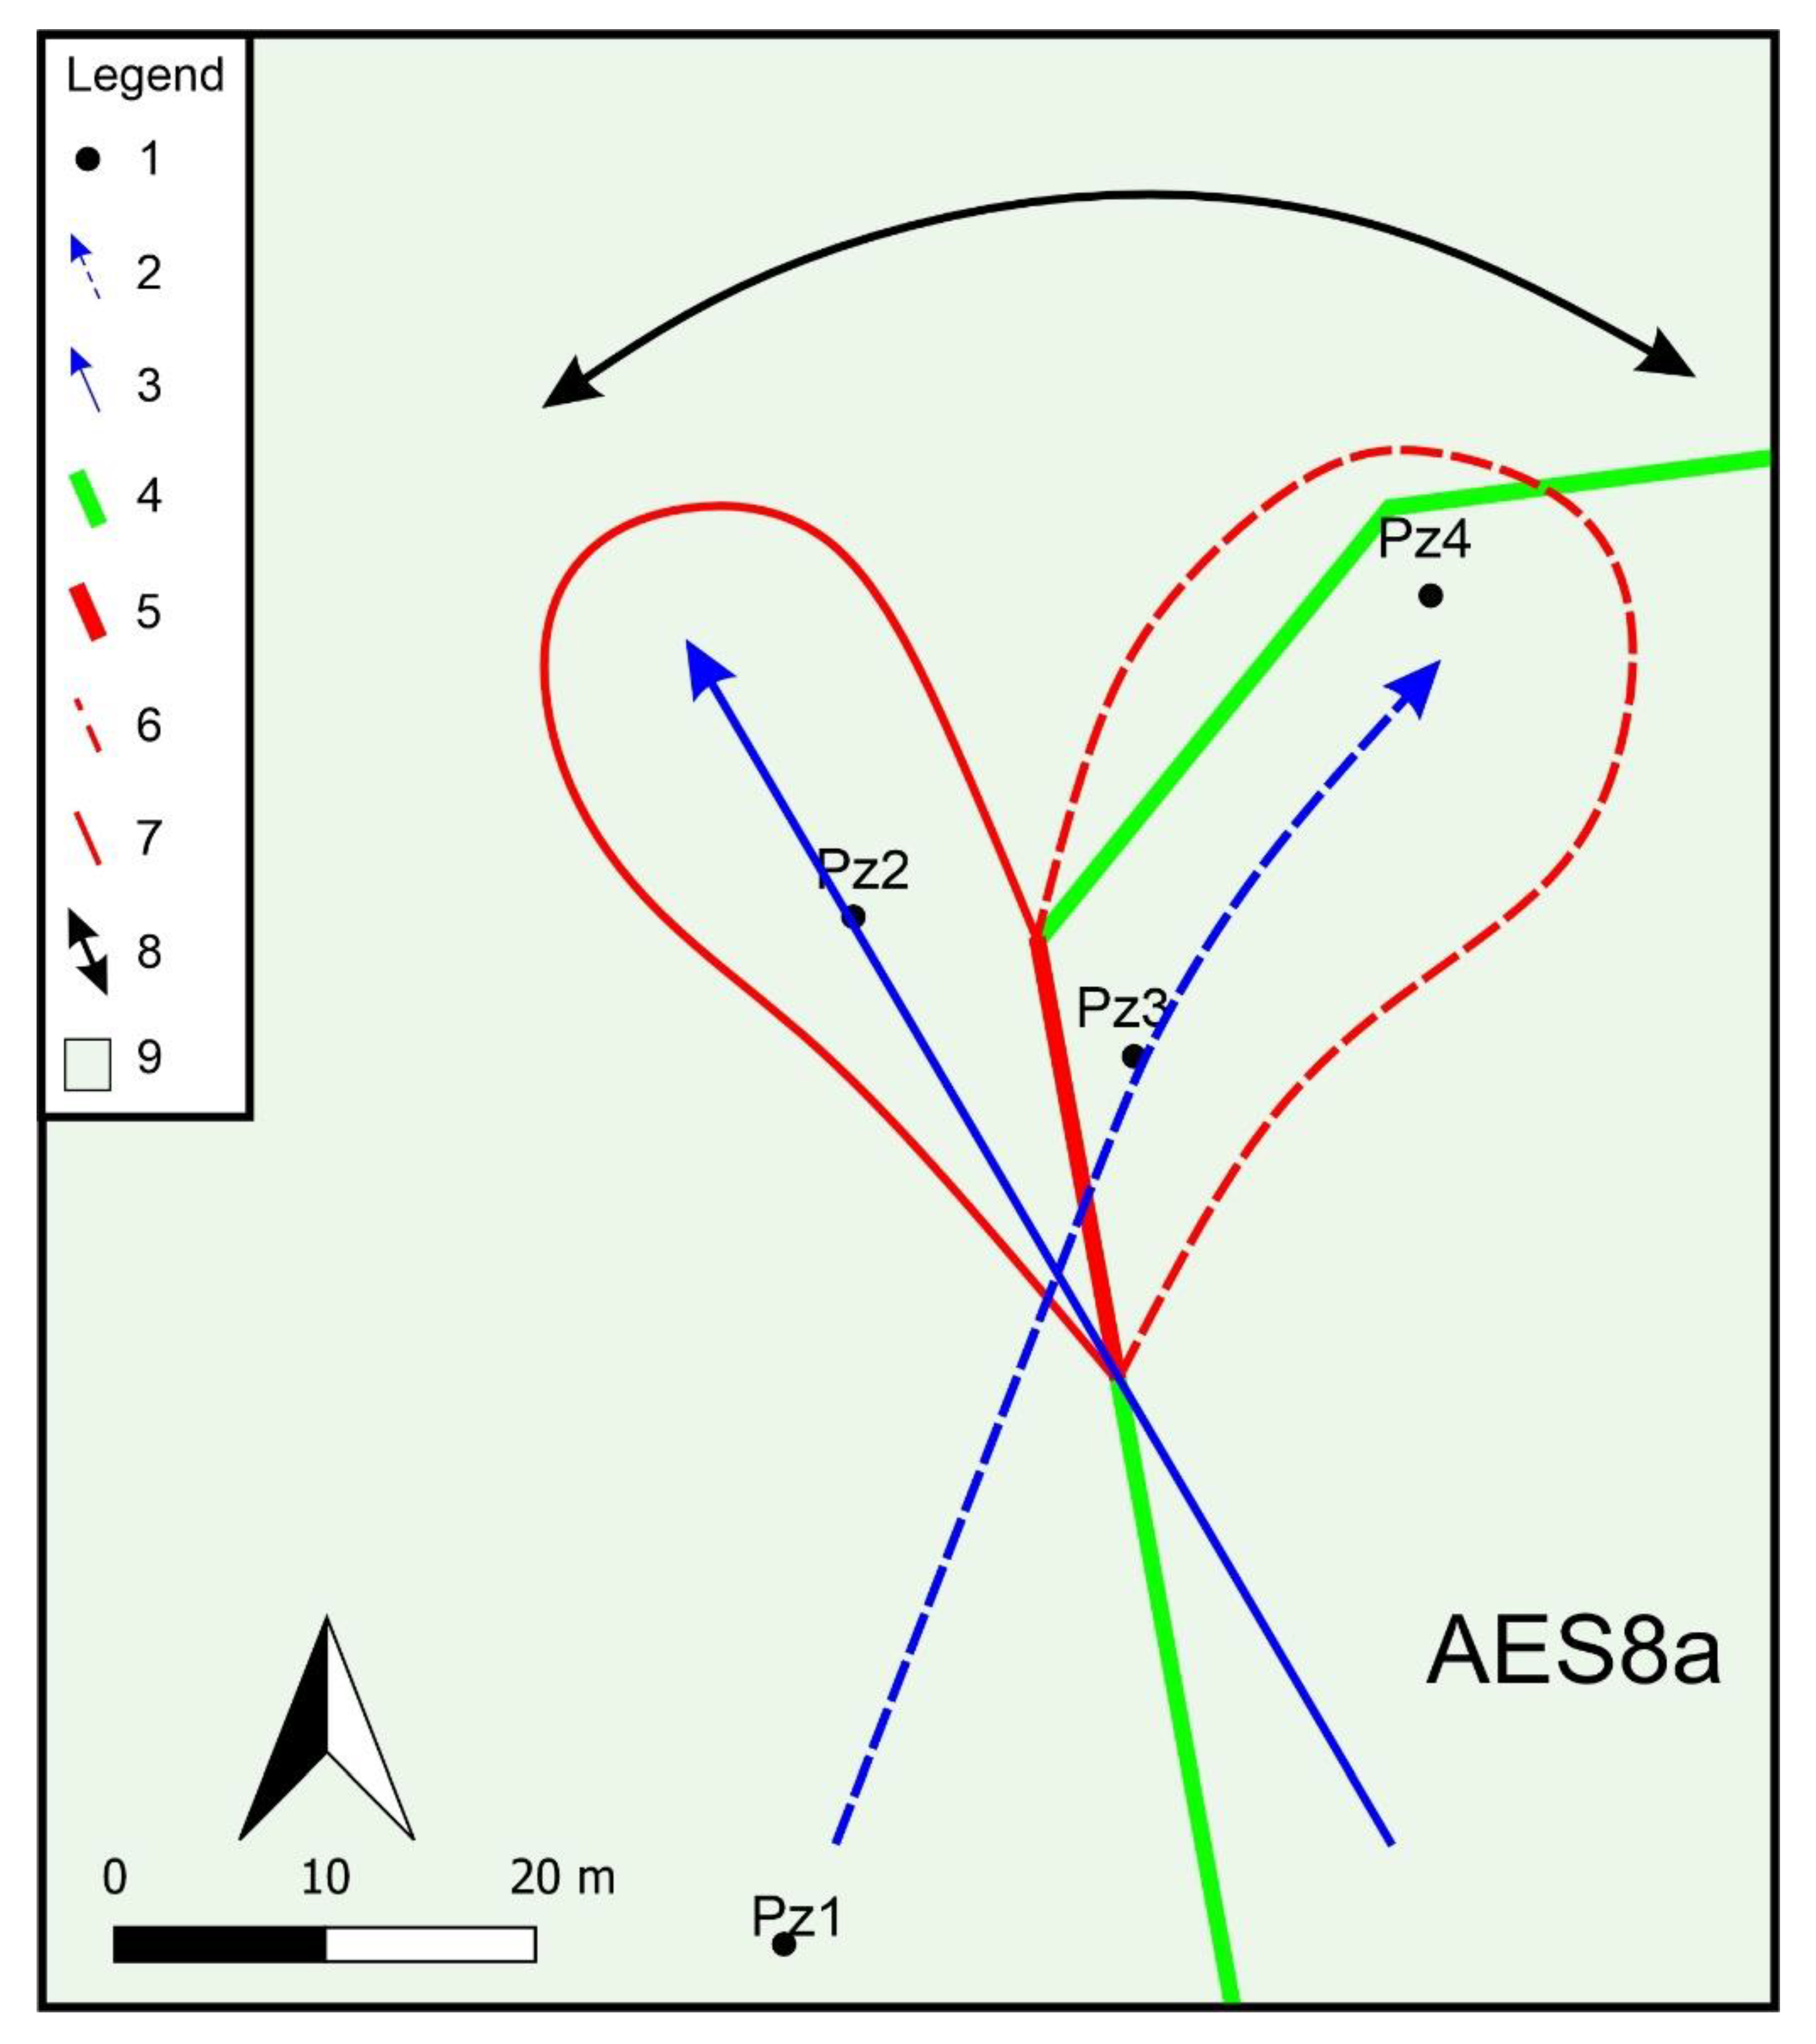
3.1. Geological, Hydrogeological, and Hydrochemical Investigations

The shallowest part of the sedimentary succession shows alternating coarse-grained layers, composed of gravel and sand, and fine-grained layers, such as silts and clays (Figure 4). In addition, a cover of anthropogenic fill material consisting of gravel and bricks was found over the entire area approximately 1 meter below ground. Below the fill material, the geological setting at site scale can be summarized as follows: (i) a first layer composed of silt and clay with thickness varying from 5 to 7 meters, (ii) a second layer composed of gravel and sand varying in thickness from 1 to 5 meters and characterized by a separation into two distinct elements proceeding northward in the proximity of Pz3, (iii) a third layer composed of silt and clay with thickness varying from 2 to 3 meters, and (iv) a fourth layer of gravel and sand (the shallowest alluvial aquifer at the test site).
Fine strata can be interpreted as the stratigraphic record of periods (or areas) of low-energy depositional systems, and for this reason, evidence of paleosols has been found diffusely in all investigations. In contrast, coarser erosive levels may be associated with periods of higher river energy or paleochannel areas.
Laser particle analysis conducted on six selected samples, collected at different depths, allowed to constrain the grain size distribution of the two silt-dominated layers characterizing the study area. The coarse-grained gravel bodies in the middle and at the bottom of the stratigraphic interval were not considered for grain size analysis because of the instrumental upper limit of 3.5 mm of the laser granulometer. Altogether, the average grain size varies from 16.2 to 62.4 µm, with the modal peak shifting from 7.2 to 78.6 µm (Table 1). Silt is the dominant fraction of all the analyzed samples, with a volume percentage spanning from 56.6 to 71%, with the sand percentage falling between 7.2 and 37.3% and clay in the 5.9–21.7% range. Samples collected along Pz1 and Pz3 boreholes display a significantly lower sandy and higher clayish fractions than Pz4 and S18. The shape of the granulometric distribution is highly asymmetric (left-skewed) for all samples but is particularly pronounced in samples characterized by relatively high sand contents (Pz4 and S18).
Conversely, clayey silt samples show less asymmetric distributions with platykurtic shape (Pz1 and Pz3). The span (sorting degree) is higher in samples showing a higher clay fraction (wider grain size distributions), while it is lower in sandy silts (narrower and more leptokurtic grain size distributions) (Table 1). Figure 5 shows the comparison of the average grain size distribution curves. More details regarding the grain size distribution curves are provided in the Supplementary Materials (SM.pdf; Figure S1).
During the observation period, the hydraulic head varied from 43 to 51 m a.s.l. (Figure 6). The recession period started in June, with negligible variations in the head during the precipitations observed in summer and autumn. The only effect of rainfall on groundwater recharge during the recession was observed from September to October 2022, when a slight recharge caused the decrease in head to slow down (as testified by analyzing the recession phase in a classic semi-logarithmic plot). Differently, precipitations in winter caused the hydraulic head to rise, therefore suggesting a significant and relatively rapid recharge, in agreement with previous findings obtained a few kilometers upgradient regarding the test site [36].
Significant modifications clearly characterize the groundwater flow net in the shallowest aquifer over time at the test site scale, therefore suggesting significant variations in terms of groundwater flow directions (and contaminant dispersion) at the site scale during the hydrologic year (see examples in Figure 7).
The groundwater EC in Pz3 varied significantly over the research period, from 363 to 764 µS/cm. This variation can be due to different factors. Overall, the highest EC values were measured in high flow, with a general decrease during the recession (Figure 8). However, a sporadic increase in EC was observed at the beginning of the recession period (June 2022) and at the end of the same phase (October 2022). At the end of the recession period, the increase in EC can be correlated to the slight recharge documented through the analysis of the hydraulic head hydrograph, therefore confirming an overall direct relationship between groundwater EC and head. This relationship is not surprising in a semi-confined aquifer system, where the effective local infiltration of rainfall is expected to be negligible and very slow, and the head rise is mainly due to recharge in the upgradient and unconfined alluvial aquifer. Therefore, contrary to observations made in unconfined aquifers [53,54,55,56], this recharge cannot generate temporary or relatively prolonged haloclines within the local groundwater, usually characterized by the lowest EC values into the shallowest saturated zone. In confined and semi-confined aquifers, the recharge (and the resulting hydraulic head rise) can cause the mobilization of higher-EC groundwaters flowing in those portions of the heterogeneous systems where (i) higher mean residence time, and/or (ii) higher water-rock interactions, and/or (iii) higher mineral dissolution can be observed. At the site scale, a possible additional factor influencing the variations over time in terms of groundwater EC at the observation point (Pz3) is the variation of the groundwater flow net mentioned above. This factor could be linked, at the study site, to surface–groundwater interactions [37] because the variations in terms of stream heads and groundwater flow directions can modify the local impact of stream recharge on groundwater, as well as in terms of physico-chemical features.
The groundwater temperature in Pz3 groundwater varied between 13.7 °C and 16.1 °C. Overall, the groundwater temperature variation over the observation period seems to be correlated to the groundwater EC (Figure 9), suggesting that similar factors mainly influence both parameters. The groundwater temperature at the test site is not significantly influenced by the atmospheric one. In the atmosphere, the highest temperature was recorded during summer, from late July to early August 2022, while the highest groundwater temperature was measured at the end of the recharge (May 2022).
Dissolved oxygen in groundwater is around 60%, pH ranged from 6.9 to 7.8, and redox potential between −84 and 330 mV, with the highest values detected during recharge and the negative one, detected only in October 2022, in late recession.
As for PCPs, only disodium EDTA was detected in wastewater, while in groundwater, the concentrations of all the analyzed substances were lower than the instrumental detection limit (Table 2).

3.2. Microbiological and Biomolecular Investigations

The isolation and counting of fecal coliforms and enterococci made it possible to ascertain that continuous and constant leaks from the local sewers compromised the microbial quality of groundwater. The monthly monitoring results show that Pz3 groundwater is always characterized by fecal contamination (Table S1), even though intestinal enterococci were an indicator more reliable than fecal coliforms, in agreement with findings in other hydrogeological settings [57,58,59]. As a matter of fact, the concentration of fecal indicators in Pz3 groundwater ranged from 0 to 303 colony-forming units (CFU)/L of fecal coliforms and from 10 to 98 CFU/L of intestinal enterococci.
Concerning the results of biomolecular investigations, all the 16S rRNA gene sequences obtained within this study have been deposited in the National Center for Biotechnology Information (NCBI) Sequence Read Archive under the accession number PRJNA897727.
Proteobacteria, Actinobacteria, and Bacteroidetes represented the three major phyla in the groundwater sample (Pz3), accounting for, on average, 64%, 16%, and 12%, respectively (Figure S2). Differently, in wastewaters, a dominance of Epsilonbacteraeota, Proteobacteria, and Firmicutes was observed, accounting for 37%, 3%, and 13%, respectively (Figure S2).
The analysis of bacterial community composition at the family level (Figure S3) revealed a predominance of Burkholderiaceae (20%), Sphingomonadaceae (18%), Microbacteriaceae (4%), Solimonadaceae (4%), and Spirosomaceae (4%) in Pz3 groundwater, while in wastewaters, high percentages of Arcobacteraceae (37%), Pseudomonadaceae (11%), Burkholderiaceae (8%), Moraxellaceae (4%), and Aeromonadaceae (3%) were detected.
When analyzing the groundwater microbial communities at the genus level (Figure S4), it emerged that Novosphingobium reached the highest percentage in the Pz3 groundwater (14%). Among the most abundant genus, Limnohabitans (5%) Sphingomonas (4%), and Massilia (3%) were also detected. Overall, NGS results showed that the bacterial community consists of genera belonging to aerobic, facultatively anaerobic, chemo-organotrophic, and oxidase bacteria [60,61,62,63]. The genus Novosphingobium accommodates Gram-negative, aerobic, nonsporulating, chemoorganotrophic, and rod-shaped bacteria that are metabolically versatile [60,64] and are found in a wide range of ecological habitats, such as agricultural soil [65], pesticide-contaminated soil [66,67], plant surfaces [68], and aquatic environments [69]. In addition, different species of Novosphingobium appear to have the potential to degrade different xenobiotics and recalcitrant compounds, such as, for example, polycyclic aromatic hydrocarbons [70,71,72,73] and sulfanilic acid, widely used in PPCPs [74]. Sphingomonas are opportunistic pathogens that take advantage of underlying conditions and diseases for humans and can generate infections, including bacteremia/septicemia [75].
On the other hand, wastewaters were characterized by a bacterial community characterized by Gram-negative, aerobic, facultatively anaerobic ubiquitous, and pathogen genus [76,77,78,79], where the main genera are Arcobacter (37%), Pseudomonas (11%), Bacteroides (3%), and Acinetobacter (3%). Arcobacter has emerged as an important food-borne zoonotic pathogen, causing sometimes severe infections in humans and animals [80]. At the same time, associated with human infections are also the Acinetobacter (3%), Streptococcus (2%), and Comamonas (2%) genera [81,82,83]. In addition to this, the Streptomyces genus has also been detected in wastewaters (2%), known for having steel’s corrosive capacities [84].

4. Discussion

Sewer pipeline ruptures are a severe risk to groundwater quality. When sewerage deterioration conditions occur, aquifers can be contaminated by contaminants contained within sewer water. The exposure to the risk of wastewater contamination in the study area is also increased by the presence of bacteria with corrosive capacities that were detected in wastewaters. Previous studies show how much biological corrosion of sewers and sewage treatment plants constitutes a severe problem, resulting in the loss of billions of dollars a year [85].
In this specific case, detailed granulometric analyses made it possible to understand that the outcropping aquitard consists of clayey/sandy silts. Therefore, this is characterized by a not-negligible permeability that makes the aquifer vulnerable to percolations from damaged pipelines. As a result, mechanical filtration is not entirely effective, and microbial contamination (including pathogens) of groundwater can also occur.
The microbiological quality of water is generally assessed by monitoring fecal indicator bacteria (e.g., intestinal enterococci and coliforms). However, it must be noted that many alternative parameters exist [86]. It has been proposed that the members of the Bacteroides genus hold promise as alternative indicators of fecal pollution [87] owing to several advantages, including short survival rates outside the hosts, exclusivity to the gut of warm-blooded animals, and constituents of a larger portion of fecal bacteria compared with fecal coliforms or enterococci [88]. In this regard, both Bacteroidetes bacterium OLB11 and Faecalibacterium were detected in Pz3. Members of Faecalibacterium are commensal bacteria, ubiquitous in the gastrointestinal tracts of animals and humans [89].
Although at low concentrations, the presence of these bacteria further demonstrates the negative impact of sewers’ loss on groundwater microbial quality (and human health).
The results obtained at the study site further confirmed that intestinal enterococci are better indicators than fecal coliforms to detect microbial contamination of groundwater. As a matter of fact, in groundwater, intestinal enterococci generally persist for more extended periods, rarely multiply, and are more resistant to different environmental stresses [46]. Furthermore, enterococci were always detected during the monthly monitoring, with a narrower range of contamination than coliforms. In particular, Figure 10 shows the variation of microbial contamination indicators (C.F.U./L) over time as a function of the variation of the hydraulic head (m a.s.l.) in Pz3.
Both fecal indicators show a similar trend. Observing intestinal enterococci, a progressive increase in concentrations was found following the progressive lowering of the hydraulic head during the recession period. This overall inverse relationship suggests a significant reduction in the dilution in groundwater. In fact, during the depletion period, the saturated medium is progressively and significantly thinned (Figure 4); consequently, the contaminants turn out to be more concentrated than in high flow.
However, when analyzing the same graph in a shorter timescale, short-term variations in fecal indicators are observed (on a monthly basis, from July to September 2022). This variation is probably due to the variations in terms of groundwater pathway and to the effect of these variations on contaminant dispersion within the saturated medium. As conceptually described in Figure 11, where a segment of the sewer was hypothesized to be damaged (segment in red), the modification of the groundwater flow direction over time can cause the contamination plume to oscillate between two end positions (full and dashed red plumes in Figure 11), therefore emphasizing the transverse mechanical dispersion and the impact of the same sewer segment on Pz3.
As for PCPs, to the authors’ knowledge, it is the first time that 2-phenoxyethanol, disodium EDTA, and dimethicone have been analyzed in groundwater. These first results testify that groundwater is not affected by cosmetic pollution, although the presence of disodium-EDTA has been detected in wastewaters, and at the same time, the impact of sewerage leaks has been ascertained from the microbiological point of view. Therefore, it is possible to deduce that cosmetics have not been detected in the aquifer because of hydrodynamic dispersion, as illustrated above for fecal indicators and/or biodegradation.
Concerning microbial communities with biodegradative capacity against substances used for PCP production, data in the literature do not provide detailed indications. However, the biomolecular analyses in this study showed the presence of bacteria able to degrade xenobiotics and recalcitrant compounds in groundwater and wastewater. It would be interesting to check whether these microorganisms, having recalcitrant-substance degrading capabilities, may also be able to degrade recalcitrant chemicals contained in cosmetics, such as disodium EDTA.
Merkova et al. (2016) proved that the biodegradation of CAPB (cocamidopropyl betaine), an amphiphilic surfactant commonly used in various personal care products, is ensured by two Gram-negative bacteria of the widespread genera Pseudomonas and Rhizobium [90]. The present study is one of the few ones to date that has investigated the presence of bacteria potentially capable of biodegrading this class of substances. Both the Pseudomonas and Rhizobium genera were detected in both waste- and groundwater samples, accounting for about 6% and 1%, respectively.
Moreover, the presence of oxidizing bacteria detected in groundwater and wastewater facilitates the triggering of Fenton reactions, one of the most commonly used advanced oxidation processes (AOPs) [91], which was efficient at eliminating illicit drugs and pharmaceuticals from wastewaters [92]. Nevertheless, as discussed before, during the hydrological year, positive and negative redox potential alternation occurs in groundwater. Therefore, some biodegradative processes can temporarily inhibit, and the natural attenuation of PCPs could be discontinuously allowed.
Through OECD guidelines, EDTA is considered persistent and nonbiodegradable. The OECD Guidelines for the Testing of Chemicals are a unique tool for assessing the potential effects of chemicals on human health and the environment. Accepted internationally as standard methods for safety testing, the guidelines are used by industry, academic, and government professionals involved in the testing and assessment of chemicals (industrial chemicals, pesticides, personal care products, etc.). However, OECD tests are conducted on a deductive basis and not through laboratory tests that simulate specific hydrogeological settings. Therefore, it would be appropriate to verify whether and how much these compounds are biodegradable through purpose-designed degradation tests. This would make it possible to verify if EDTA is somehow biodegradable or recalcitrant in groundwater environments. If, as reported by the OECD tests, EDTA turns out to be persistent even from simulations test, then it could be inferred that the lack of EDTA detection in groundwater is the result of the only hydrodynamic dispersion processes that make the concentrations of the substance lower than the instrumental detection limits now available.

5. Conclusions

The multidisciplinary approach used in this study allowed the demonstration that leaky sewers can cause significant microbial pollution of groundwater in semi-confined aquifer systems, whose semi-confining aquitards are mainly made of silts and characterized by granulometric and hydraulic layered heterogeneity. At the same time, this study pointed out that (i) the impact of leaky sewers on groundwater microbial quality may vary over time, depending on both the hydraulic regime and the changing groundwater pathway, and (ii) intestinal enterococci are indicators more reliable than fecal coliforms to detect microbial contamination in such hydrogeological and urban settings.
As for PCPs, no negative impacts were observed on groundwater at the test site, despite the presence of detectable EDTA in wastewater. However, at this stage, there is not enough information to adequately discriminate among the possible causes (e.g., hydrodinamic dispersion, biodegradation, too high instrumental detection limits, etc.) of these results. At the same time, the same results allow the designing of effective supplementary investigations for the near future.
On a wider and methodological perspective, this research demonstrates that (i) multidisciplinary approaches are the most effective way to study the possible impacts of leaky sewers in semi-confined urban aquifers, and (ii) a prolonged monitoring of both hydraulic heads and qualitative groundwater features is fundamental to correctly analyze the causes and the possible variations over time of contamination phenomena induced by leaky sewers.

Supplementary Materials

The following supporting information can be downloaded at https://www.mdpi.com/article/10.3390/hydrology10010003/s1: Test: SM.pdf; Figures: Figure S1 Grain size distributions with an average curve in black and variability range in light gray. Grain size distribution curves for PZ1 6–7 m (A), PZ1 11–12 m (B), PZ3 6–7 m (C), PZ 5–6 m (D), PZ4 9–10 m (E) and S18 8.75–9.5 m (F). Φ, equivalent mean diameter; m, modal value of the grain size distribution; S, span (sorting) of grain size distribution; n, number of measurements; Figure S2 Phylum level microbial community composition in samples collected from groundwater and wastewater; Figure S3 Family level microbial community composition in samples collected from groundwater and wastewater; Figure S4 Genus level microbial community composition in samples collected from groundwater and wastewater. Table: Table S1 Monthly monitoring of fecal contamination indicators. Reference [93] is cited in the supplementary materials.

Author Contributions

Conceptualization, P.R. and F.C.; methodology, L.D., P.R., F.B. and F.C.; software, L.D., P.R., R.P. and M.P.; validation, L.D.; formal analysis, L.D., P.R., R.P. and M.P.; investigation L.D., P.R., R.P., A.S., A.M. and M.P.; resources, F.C.; data curation, L.D., P.R., R.P. and M.P.; writing—original draft preparation, L.D., P.R., R.P. and M.P.; writing—review and editing, L.D., P.R. and F.C.; visualization, L.D., P.R., R.P. and M.P.; supervision, P.R., F.B. and F.C.; project administration, F.C.; funding acquisition, F.C. All authors have read and agreed to the published version of the manuscript.

Funding

This research received no external funding.

Data Availability Statement

The data presented in this study are all the available data; biomolecular data (fastq format) are available at the following link: https://www.ncbi.nlm.nih.gov/bioproject/PRJNA897727/ (accessed on 14 November 2022).

Acknowledgments

This work has benefited from the equipment and framework of the COMP-HUB Initiative, funded by the “Departments of Excellence” program of the Italian Ministry for Education, University, and Research (MIUR, 2018–2022). We knowledge Paolo Rezoagli, Eugenia Monegatti, Raimondo Brizzi Albertelli, Simone Bacchieri, and S.M.T.P. S.p.A. for their support in carrying out the field activities and for access to the study area. We are grateful to the reviewers for their constructive comments and valuable suggestions.

Conflicts of Interest

There are no conflicts of interest related to this paper.

References

  1. Echart, J.; Ghebremichael, K.; Khatri, K.; Mutikanga, H.; Sempewo, J.; Tsegaye, S.; Vairavamoorthy, K. The Future of Water in African Cities: Why Waste Water? Integrated Urban Water Management, Background Report; World Bank: Washington, DC, USA, 2012. [Google Scholar]
  2. Archundia, D.; Duwig, C.; Spadini, L.; Uzu, G.; Guédron, S.; Morel, M.C.; Cortez, R.; Ramos Ramos, O.; Chincheros, J.; Martins, J.M.F. How uncontrolled urban expansion increases the contamination of the Titicaca Lake Basin (El Alto, La Paz, Bolivia). Water Air Soil Pollut. 2017, 228, 44. [Google Scholar] [CrossRef]
  3. Hayzoun, H.; Garnier, C.; Durrieu, G.; Lenoble, V.; Le Poupon, C.; Angeletti, B.; Ouammou, A.; Mounier, S. Organic carbon, and major and trace element dynamic and fate in a large river subjected to poorly-regulated urban and industrial pressures (Sebou River, Morocco). Sci. Total Environ. 2015, 502, 296–308. [Google Scholar] [CrossRef] [PubMed]
  4. Mottes, C.; Lesueur-Jannoyer, M.; Charlier, J.-B.; Carles, C.; Guéné, M.; Le Bail, M.; Malézieux, E. Hydrological and pesticide transfer modeling in a tropical volcanic watershed with the WATPPASS model. J. Hydrol. 2015, 529, 909–927. [Google Scholar] [CrossRef]
  5. Schaider, L.A.; Ackerman, J.M.; Rudel, R.A. Septic systems as sources of organic wastewater compounds in domestic drinking water wells in a shallow sand and gravel aquifer. Sci. Total Environ. 2016, 547, 470–481. [Google Scholar] [CrossRef] [PubMed] [Green Version]
  6. Colombo, L.; Gzyl, G.; Mazzon, P.; Łabaj, P.; Frączek, R.; Alberti, L. Stochastic Particle Tracking Application in Different Urban Areas in Central Europe: The Milano (IT) and Jaworzno (PL) Case Study to Secure the Drinking Water Resources. Sustainability 2021, 13, 10291. [Google Scholar] [CrossRef]
  7. Mester, T.; Szabó, G.; Balla, D. Assessment of shallow groundwater purification processes after the construction of a municipal sewerage network. Water 2021, 13, 1946. [Google Scholar] [CrossRef]
  8. Vollertsen, J.; Nielsen, L.; Blicher, T.D.; Hvitved-Jacobsen, T.; Nielsen, A.H. A sewer process model as planning and management tool-hydrogen sulfide simulation at catchment scale. Water Sci. Technol. 2011, 64, 348–354. [Google Scholar] [CrossRef]
  9. Barone, L.; Pilotti, M.; Valerio, G.; Balistrocchi, M.; Milanesi, L.; Chapra, S.C.; Nizzoli, D. Analysis of the residual nutrient load from a combined sewer system in a watershed of a deep Italian lake. J. Hydrol. 2019, 571, 202–213. [Google Scholar] [CrossRef]
  10. Pikaar, I.; Sharma, K.R.; Hu, S.; Gernjak, W.; Keller, J.; Yuan, Z. Reducing sewer corrosion through integrated urban water management. Science 2014, 345, 812–814. [Google Scholar] [CrossRef]
  11. Selvakumar, A.; Field, R.; Burgess, E.; Amick, R. Exfiltration in Sanitary Sewer Systems in the US. Urban Water J. 2010, 1, 227–234. [Google Scholar] [CrossRef]
  12. Karpf, C.; Krebs, P. Modelling of Groundwater Infiltration into Sewer Systems. Urban Water J. 2013, 10, 221–229. [Google Scholar] [CrossRef]
  13. Davies, J.P.; Clarke, B.A.; Whiter, J.T.; Cunningham, R.J. Factors Influencing the Structural Deterioration and Collapse of Rigid Sewer Pipes. Urban Water 2001, 3, 73–89. [Google Scholar] [CrossRef]
  14. Ellis, J.B.; Revitt, D.M.; Lister, P.; Willgress, C.; Buckley, A. Experimental Studies of Sewer Exfiltration. Water Sci. Technol. 2003, 47, 61–67. [Google Scholar] [CrossRef]
  15. Gokhale, S.; Graham, J.A. A New Development in Locating Leaks in Sanitary Sewers. Tunn. Undergr. Space Technol. 2004, 19, 85–96. [Google Scholar] [CrossRef]
  16. Wakida, F.T.; Lerner, D.N. Non-agricultural Sources of Groundwater Nitrate: A Review and Case Study. Water Res. 2005, 39, 3–16. [Google Scholar] [CrossRef]
  17. Ana, E.; Bauwens, W.; Pessemier, M.; Thoeye, C.; Smolders, S.; Boonen, I.; de Gueldre, G. An Investigation of the Factors Influencing Sewer Structural Deterioration. Urban Water J. 2009, 6, 303–312. [Google Scholar] [CrossRef]
  18. López-Serna, R.; Jurado, A.; Vázquez-Suñé, E.; Carrera, J.; Petrović, M.; Barceló, D. Occurrence of 95 Pharmaceuticals and Transformation Products in Urban Groundwaters Underlying the Metropolis of Barcelona, Spain. Environ. Pollut. 2013, 174, 305–315. [Google Scholar] [CrossRef]
  19. Lee, D.G.; Roehrdanz, P.R.; Feraud, M.; Ervin, J.; Anumol, T.; Jia, A.; Park, M.; Tamez, C.; Morelius, E.W.; Gardea-Torresdey, J.L.; et al. Wastewater Compounds in Urban Shallow Groundwater Wells Correspond to Exfiltration Probabilities of Nearby Sewers. Water Res. 2015, 85, 467–475. [Google Scholar] [CrossRef] [Green Version]
  20. Roehrdanz, P.R.; Feraud, M.; Lee, D.G.; Means, J.C.; Snyder, S.A.; Holden, P.A. Spatial Models of Sewer Pipe Leakage Predict the Occurrence of Wastewater Indicators in Shallow Urban Groundwater. Environ. Sci. Technol. 2017, 51, 1213–1223. [Google Scholar] [CrossRef]
  21. Laakso, T.; Kokkonen, T.; Mellin, I.; Vahala, R. Sewer Condition Prediction and Analysis of Explanatory Factors. Water 2018, 10, 1239. [Google Scholar] [CrossRef]
  22. Jurado, A.; Mastroianni, N.; Vázquez-Suñé, E.; Carrera, J.; Tubau, I.; Pujades, E.; Postigo, C.; de Aida, M.L.; Barcelo, D. Drugs of Abuse in Urban Groundwater. A Case Study: Barcelona. Sci. Total Environ. 2012, 424, 280–288. [Google Scholar] [CrossRef] [PubMed]
  23. Sui, Q.; Cao, X.; Lu, S.; Zhao, W.; Qiu, Z.; Yu, G. Occurrence, Sources and Fate of Pharmaceuticals and Personal Care Products in the Groundwater: A Review. Emerg. Contam. 2015, 1, 14–24. [Google Scholar] [CrossRef] [Green Version]
  24. Alfiya, Y.; Dubowski, Y.; Friedler, E. Diurnal Patterns of Micropollutants Concentrations in Domestic Greywater. Urban Water J. 2018, 15, 399–406. [Google Scholar] [CrossRef]
  25. Rasheed, T.; Bilal, M.; Nabeel, F.; Adeel, M.; Iqbal, H.M. Environmentally-related Contaminants of High Concern: Potential Sources and Analytical Modalities for Detection, Quantification, and Treatment. Environ. Int. 2019, 122, 52–66. [Google Scholar] [CrossRef] [PubMed]
  26. Rusiniak, P.; Kmiecik, E.; Wątor, K.; Duda, R.; Bugno, R. Pharmaceuticals and personal care products in the urban groundwater–preliminary monitoring (case study: Kraków, Southern Poland). Urban Water J. 2021, 14, 364–374. [Google Scholar] [CrossRef]
  27. Wang, J.; Wang, S. Removal of pharmaceuticals and personal care products (PPCPs) from wastewater: A review. J. Environ. Manag. 2016, 182, 620–640. [Google Scholar] [CrossRef]
  28. Molins-Delgado, D.; Díaz-Cruz, M.S.; Barceló, D. Introduction: Personal Care Products in the Aquatic Environment. In Personal Care Products in the Aquatic Environment, The Handbook of Environmental Chemistry 36; Díaz-Cruz, M.S., Barceló, D., Eds.; Series Editors: Damià Barceló, Andrey G. Kostianoy; Springer International Publishing: Berlin/Heidelberg, Germany, 2015; ISBN 978-3-319-18808-9. ISSN 1867-979X. [Google Scholar]
  29. Xianzhi, P.; Weihui, O.; Chunwei, W.; Zhifang, W.; Qiuxin, H.; Jiabin, J.; Jianhua, T. Occurrence and ecological potential of pharmaceuticals and personal care products in groundwater and reservoirs in the vicinity of municipal landfills in China. Sci. Total Environ. 2014, 490, 889–898. [Google Scholar] [CrossRef]
  30. Mosaddeghi, M.R.; Mahboubi, A.A.; Zandsalimi, S.; Unc, A. Influence of organic waste type and soil structure on the bacterial filtration rates in unsaturated intact soil columns. J. Environ. Manag. 2009, 90, 730–739. [Google Scholar] [CrossRef]
  31. Naclerio, G.; Fardella, G.; Marzullo, G.; Celico, F. Filtration of Bacillus subtilis and Bacillus cereus spores in a pyroclastic topsoil, carbonate Apennines, southern Italy. Colloids Surf. B Biointerfaces 2009, 70, 25–28. [Google Scholar] [CrossRef]
  32. Safadoust, A.; Mahboubi, A.A.; Mosaddeghi, M.R.; Gharabaghi, B.; Voroney, P.; Unc, A.; Khodakaramian, G. Significance of physical weathering of two-texturally dierent soils for the saturated transport of Escherichia coli and bromide. J. Environ. Manag. 2012, 107, 147–158. [Google Scholar] [CrossRef]
  33. Moradi, A.; Mosaddeghi, M.R.; Chavoshi, E.; Safadoust, A.; Soleimani, M. Effect of Crude Oil-Induced Water Repellency on Transport of Escherichia coli and Bromide Through Repacked and Physically-Weathered Soil Columns. Environ. Pollut. 2019, 255, 113230. [Google Scholar] [CrossRef]
  34. Bucci, A.; Petrella, E.; Naclerio, G.; Gambatese, S.; Celico, F. Bacterial migration through low-permeability fault zones in compartmentalised aquifer systems: A case study in Southern Italy. Int. J. Speleol. 2014, 43, 273–281. [Google Scholar] [CrossRef] [Green Version]
  35. Rizzo, P.; Petrella, E.; Bucci, A.; Salvioli-Mariani, E.; Chelli, A.; Sanangelantoni, A.M.; Raimondo, M.; Quagliarini, A.; Celico, F. Studying Hydraulic Interconnections in Low-Permeability Media by Using Bacterial Communities as Natural Tracers. Water 2020, 12, 1795. [Google Scholar] [CrossRef]
  36. Zanini, A.; Petrella, E.; Sanangelantoni, A.M.; Angelo, L.; Ventosi, B.; Viani, L.; Rizzo, P.; Remelli, S.; Bartoli, M.; Bolpagni, R.; et al. Groundwater characterization from an ecological and human perspective: An interdisciplinary approach in the Functional Urban Area of Parma. Italy Rendiconti Lincei. Sci. Fis. Nat. 2019, 30, 93–108. [Google Scholar] [CrossRef]
  37. Severini, E.; Ducci, L.; Sutti, A.; Robottom, S.; Sutti, S.; Celico, F. River–Groundwater Interaction and Recharge Effects on Microplastics Contamination of Groundwater in Confined Alluvial Aquifers. Water 2022, 14, 1913. [Google Scholar] [CrossRef]
  38. Di Dio, G.; Martini, A.; Lasagna, S.; Zanzucchi, G. Illustrative Notes of the Geological Map of Italy at 1:50,000 scale Sheet 199 Parma Sud. Geological, Seismic, and Soil Service of the Emilia-Romagna Region, APAT-Geological Service of Italy; S.EL.CA: Florence, Italy, 2005. [Google Scholar]
  39. Ricci Lucchi, F.; Colalongo, M.L.; Cremonini, G.; Gasperi, G.; Iaccarino, S.; Papani, G.; Raffi, S.; Rio, D. Evoluzione Sedimentaria e Paleogeografia Nel Margine Appenninico. In Guida alla Geologia del Margine Appenninico Padano; Cremonini, G., Ricci Lucchi, F., Eds.; Guida Geol. Reg. S.G.I.: Bologna, Italy, 1982; pp. 17–46. [Google Scholar]
  40. Di Dio, G.; Lasagna, S.; Preti, D.; Sagne, M. Carta geologica dei depositi quaternari della provincia di Parma. Il Quat. 1997, 10, 443–450. [Google Scholar]
  41. Di Dio, G. Applicazione di Concetti e Metodi della Stratigrafia Fisica alla Ricerca di Risorse Idriche nel Sottosuolo della Pianura Emiliano-Romagnola. Serie 3a; Giornale di Geologia: Bologna, Italy, 1998; Volume 60, pp. 35–39. [Google Scholar]
  42. Regione Emilia-Romagna & ENI-AGIP. Riserve Idriche Sotterranee della Regione Emilia-Romagna; Di Dio, G., Ed.; S.EL.CA.: Firenze, Italy, 1998. [Google Scholar]
  43. Cherry, J.; Parker, B.; Bradbury, K.; Eaton, T.; Gotkowitz, M.; Hart, D.; Borchardt, M.A. Contaminant Transport through Aquitards: A State of the Science Review; International Water Association: London, UK, 2006; pp. 16–26. ISBN 1583214984. [Google Scholar]
  44. Storti, F.; Balsamo, F. Particle size distributions by laser diffraction: Sensitivity of granular matter strength to analytical operating procedures. Solid Earth 2010, 1, 25–48. [Google Scholar] [CrossRef] [Green Version]
  45. Bucci, A.; Naclerio, G.; Allocca, V.; Celico, P.; Celico, F. Potential use of microbial community investigations to analyse hydrothermal systems behaviour: The case of Ischia Island, Southern Italy. Hydrol. Process. 2011, 25, 1866–1873. [Google Scholar] [CrossRef]
  46. Bucci, A.; Petrella, E.; Naclerio, G.; Allocca, V.; Celico, F. Microorganisms as contaminants and natural tracers: A 10-year research in some carbonate aquifers (southern Italy). Environ. Earth Sci. 2015, 74, 173–184. [Google Scholar] [CrossRef]
  47. Bucci, A.; Petrella, E.; Celico, F.; Naclerio, G. Use of molecular approaches in hydrogeological studies: The case of carbonate aquifers in southern Italy. Hydrogeol. J. 2017, 25, 1017–1031. [Google Scholar] [CrossRef]
  48. Milani, C.; Hevia, A.; Foroni, E.; Duranti, S.; Turroni, F.; Lugli, G.A.; Margolles, A. Assessing the fecal microbiota: An optimized ion torrent 16S rRNA gene-based analysis protocol. PLoS ONE 2013, 8, e68739. [Google Scholar] [CrossRef] [PubMed]
  49. Caporaso, J.G.; Kuczynski, J.; Stombaugh, J.; Bittinger, K.; Bushman, F.D.; Costello, E.K.; Huttley, G.A. QIIME allows analysis of high-throughput community sequencing data. Nat. Methods 2010, 7, 335–336. [Google Scholar] [CrossRef] [PubMed] [Green Version]
  50. Callahan, B.J.; McMurdie, P.J.; Rosen, M.J.; Han, A.W.; Johnson, A.J.; Holmes, S.P. DADA2: High-resolution sample inference from Illumina amplicon data. Nat. Methods 2016, 13, 581–583. [Google Scholar] [CrossRef] [PubMed] [Green Version]
  51. Bokulich, N.A.; Kaehler, B.D.; Rideout, J.R.; Dillon, M.; Bolyen, E.; Knight, R.; Caporaso, J.G. Optimizing taxonomic classification of marker-gene amplicon sequences with QIIME 2’s q2-feature-classifier plugin. Microbiome 2018, 6, 90. [Google Scholar] [CrossRef]
  52. Quast, C.; Pruesse, E.; Yilmaz, P.; Gerken, J.; Schweer, T.; Yarza, P.; Glöckner, F.O. The SILVA ribosomal RNA gene database project: Improved data processing and web-based tools. Nucleic Acids Res. 2012, 41, D590–D596. [Google Scholar] [CrossRef]
  53. Petrella, E.; Naclerio, G.; Falasca, A.; Bucci, A.; Capuano, P.; de Felice, V.; Celico, F. Non-permanent shallow halocline in a fractured carbonate aquifer, southern Italy. J. Hydrol. 2009, 373, 267–272. [Google Scholar] [CrossRef]
  54. Petrella, E.; Celico, F. Mixing of water in a carbonate aquifer, southern Italy, analysed through stable isotope investigations. Int. J. Speleol. 2013, 42, 25–33. [Google Scholar] [CrossRef] [Green Version]
  55. Hernàndez-Diaz, R.; Petrella, E.; Bucci, A.; Naclerio, G.; Feo, A.; Sferra, G.; Celico, F. Integrating hydrogeological and microbiological data and modelling to characterize the hydraulic features and behaviour of coastal carbonate aquifers: A case in western Cuba. Water 2019, 11, 1989. [Google Scholar] [CrossRef] [Green Version]
  56. Chelli, A.; Francese, R.; Petrella, E.; Carri, A.; Quagliarini, A.; Segalini, A.; Celico, F. A multi-parameter field monitoring system to investigate the dynamics of large earth slides–earth flows in the Northern Apennines, Italy. Eng. Geol. 2020, 275, 105780. [Google Scholar] [CrossRef]
  57. Allocca, V.; Celico, F.; Petrella, E.; Marzullo, G.; Naclerio, G. The role of land use and environmental factors on microbial pollution of mountainous limestone aquifers. Environ. Geol. 2008, 55, 277–283. [Google Scholar] [CrossRef]
  58. Celico, F.; Capuano, P.; de Felice, V.; Naclerio, G. Hypersaline groundwater genesis assessment through a multidisciplinary approach: The case of Pozzo del Sale spring (southern Italy). Hydrogeol. J. 2008, 16, 1441–1451. [Google Scholar] [CrossRef]
  59. Bucci, A.; Allocca, V.; Naclerio, G.; Capobianco, G.; Divino, F.; Fiorillo, F.; Celico, F. Winter survival of microbial contaminants in soil: An in situ verification. J. Environ. Sci. 2015, 27, 131–138. [Google Scholar] [CrossRef]
  60. Takeuchi, M.; Hamana, K.; Hiraishi, A. Proposal of the genus Sphingomonas sensu stricto and three new genera, Sphingobium, Novosphingobium and Sphingopyxis, on the basis of phylogenetic and chemotaxonomic analyses. Int. J. Syst. Evol. Microbiol. 2001, 51, 1405–1417. [Google Scholar] [CrossRef]
  61. Hahn, M.W.; Kasalický, V.; Jezbera, J.; Brandt, U.; Jezberova, J.; Šimek, K. Limnohabitans curvus gen. nov. sp. nov. a planktonic bacterium isolated from a freshwater lake. Int. J. Syst. Evol. Microbiol. 2010, 60, 1358–1365. [Google Scholar] [CrossRef]
  62. White, D.C.; Sutton, S.D.; Ringelberg, D.B. The genus Sphingomonas: Physiology and ecology. Curr. Opin. Biotechnol. 1996, 7, 301–306. [Google Scholar] [CrossRef]
  63. La Scola, B.; Birtles, R.J.; Mallet, M.N.; Raoult, D. Massilia timonae gen. nov. sp. nov. isolated from blood of an immunocompromised patient with cerebellar lesions. J. Clin. Microbiol. 1998, 36, 2847–2852. [Google Scholar] [CrossRef] [Green Version]
  64. Kumar, R.; Verma, H.; Haider, S.; Bajaj, A.; Sood, U.; Ponnusamy, K.; Nagar, S.; Shakarad, M.N.; Negi, R.K.; Singh, Y.; et al. Comparative genomic analysis reveals habitat-specific genes and regulatory hubs within the genus Novosphingobium. MSystems 2017, 2, e00020-17. [Google Scholar] [CrossRef] [Green Version]
  65. Nguyen, T.P.O.; Mot, R.D.; Speingael, D. Draft genome sequence of the carbofuran-mineralizing Novosphingobium sp. strain KN65.2. Genome Announc. 2015, 3, e00764-15. [Google Scholar] [CrossRef] [Green Version]
  66. Saxena, A.; Anand, S.; Dua, A.; Sangwan, N.; Khan, F.; Lal, R. Novosphingobium lindaniclasticum sp. nov. a hexachlorocyclohexane (HCH)- degrading bacterium isolated from an HCH dumpsite. Int. J. Syst. Evol. Microbiol. 2013, 63, 2160–2167. [Google Scholar] [CrossRef] [Green Version]
  67. Pearce, S.L.; Oakeshott, J.G.; Pandey, G. Insights into ongoing evolution of the hexachlorocyclohexane catabolic pathway from comparative genomics of ten Sphingomonadaceae strains. G3 Genes Genomes Genet. 2015, 5, 1081–1094. [Google Scholar] [CrossRef] [Green Version]
  68. Ohta, Y.; Nishi, S.; Hasegawa, R.; Hatada, Y. Combination of six enzymes of a marine Novosphingobium converts the stereoisomers of -O-4 lignin model dimers into the respective monomers. Sci. Rep. 2015, 5, 15105. [Google Scholar] [CrossRef] [PubMed]
  69. D’Argenio, V.; Petrillo, M.; Cantiello, P.; Naso, B.; Cozzuto, L.; Notomista, E.; Paolella, G.; Di Donato, A.; Salvatore, F. De novo sequencing and assembly of the whole genome of Novosphingobium sp. strain PP1Y. J. Bacteriol. 2011, 193, 384. [Google Scholar] [CrossRef] [Green Version]
  70. Liu, Z.P.; Wang, B.J.; Liu, Y.H.; Liu, S.J. Novosphingobium taihuense sp. nov. a novel aromatic-compound-degrading bacterium isolated from Taihu Lake, China. Int. J. Syst. Evol. Microbiol. 2005, 55, 1229–1232. [Google Scholar] [CrossRef] [PubMed]
  71. Tiirola, M.A.; Busse, H.J.; Kämpfer, P.; Männistö, M.K. Novosphingobium lentum sp. nov. a psychrotolerant bacterium from a polychlorophenol bioremediation process. Int. J. Syst. Evol. Microbiol. 2005, 55, 583–588. [Google Scholar] [CrossRef] [PubMed]
  72. Sohn, J.H.; Kwon, K.K.; Kang, J.-H.; Jung, H.-B.; Kim, S.-J. Novosphingobium pentaromativorans sp. nov. a high-molecular-mass polycyclic aromatic hydrocarbon-degrading bacterium isolated from estuarine sediment. Int. J. Syst. Evol. Microbiol. 2004, 54, 1483–1487. [Google Scholar] [CrossRef] [Green Version]
  73. Lal, R.; Dogra, C.; Malhotra, S.; Sharma, P.; Pal, R. Diversity, distribution and divergence of lin genes in hexachlorocyclohexane-degrading sphingomonads. Trends Biotechnol. 2006, 24, 121–130. [Google Scholar] [CrossRef]
  74. Hegedüs, B.; Kós, P.B.; Bende, G.; Bounedjoum, N.; Maróti, G.; Laczi, K.; Rákhely, G. Starvation-and xenobiotic-related transcriptomic responses of the sulfanilic acid-degrading bacterium, Novosphingobium resinovorum SA1. Appl. Microbiol. Biotechnol. 2018, 102, 305–318. [Google Scholar] [CrossRef]
  75. Ryan, M.P.; Adley, C.C. Sphingomonas paucimobilis: A persistent Gram-negative nosocomial infectious organism. J. Hosp. Infect. 2010, 75, 153–157. [Google Scholar] [CrossRef]
  76. Collado, L.; Figueras, M.J. Taxonomy, epidemiology, and clinical relevance of the genus Arcobacter. Clin. Microbiol. Rev. 2011, 24, 174–192. [Google Scholar] [CrossRef] [Green Version]
  77. Iizuka, H.; Komagata, K. An attempt at grouping of the genus Pseudomonas. J. Gen. Appl. Microbiol. 1963, 9, 73–82. [Google Scholar] [CrossRef] [Green Version]
  78. Shah, H.N.; Collins, D.M. Prevotella, a new genus to include Bacteroides melaninogenicus and related species formerly classified in the genus Bacteroides. Int. J. Syst. Evol. Microbiol. 1990, 40, 205–208. [Google Scholar] [CrossRef]
  79. Bouvet, P.J.; Grimont, P.A. Taxonomy of the genus Acinetobacter with the recognition of Acinetobacter baumannii sp. nov. Acinetobacter haemolyticus sp. nov. Acinetobacter johnsonii sp. nov. and Acinetobacter junii sp. nov. and emended descriptions of Acinetobacter calcoaceticus and Acinetobacter lwoffii. Int. J. Syst. Evol. Microbiol. 1986, 36, 228–240. [Google Scholar] [CrossRef] [Green Version]
  80. Ramees, T.P.; Dhama, K.; Karthik, K.; Rathore, R.S.; Kumar, A.; Saminathan, M.; Tiwari, R.; Malik, Y.S.; Singh, R.K. Arcobacter: An emerging food-borne zoonotic pathogen, its public health concerns and advances in diagnosis and control-A comprehensive review. Vet Q 2017, 37, 136–161. [Google Scholar] [CrossRef] [Green Version]
  81. Wong, D.; Nielsen, T.B.; Bonomo, R.A.; Pantapalangkoor, P.; Luna, B.; Spellberg, B. Clinical and Pathophysiological Overview of Acinetobacter Infections: A Century of Challenges. Clin. Microbiol. Rev. 2017, 30, 409–447. [Google Scholar] [CrossRef] [Green Version]
  82. Walker, M.J.; Barnett, T.C.; McArthur, J.D.; Cole, J.N.; Gillen, C.M.; Henningham, A.; Sriprakash, K.S.; Sanderson-Smith, M.L.; Nizet, V. Disease manifestations and pathogenic mechanisms of Group A Streptococcus. Clin. Microbiol. Rev. 2014, 27, 264–301. [Google Scholar] [CrossRef] [Green Version]
  83. Ryan, M.P.; Sevjahova, L.; Gorman, R.; White, S. The Emergence of the Genus Comamonas as Important Opportunistic Pathogens. Pathogens 2022, 11, 1032. [Google Scholar] [CrossRef]
  84. Songmei, L.; Yuanyuan, Z.; Juan, D.; Jianhua, L.; Mei, Y. Influence of streptomyces on the Corrosion Behavior of Steel A3 in Thiobacillus ferrooxidans Media. Acta Chim. Sin. 2010, 68, 67–74. [Google Scholar]
  85. Stanaszek-Tomal, E.; Fiertak, M. Biological corrosion in the sewage system and the sewage treatment plant. Procedia Eng. 2016, 161, 116–120. [Google Scholar] [CrossRef] [Green Version]
  86. Hagedorn, C.; Harwood, V.J.; Blanch, A. Microbial Source Tracking: Methods, Applications, and Case Studies; 2011th ed.; Springer: Berlin/Heidelberg, Germany; New York, NY, USA, 2011; ISBN 1489991301. [Google Scholar]
  87. Kreader, C.A. Design and evaluation of Bacteroides DNA probes for the specific detection of human fecal pollution. Appl. Environ. Microbiol. 1995, 61, 1171–1179. [Google Scholar] [CrossRef] [Green Version]
  88. Sghir, A.; Gramet, G.; Suau, A.; Rochet, V.; Pochart, P.; Dore, J. Quantification of bacterial groups within human faecal flora by oligoneocletide probe hybridization. Appl. Environ. Microbiol. 2000, 66, 2263–2266. [Google Scholar] [CrossRef] [Green Version]
  89. Benevides, L.; Burman, S.; Martin, R.; Robert, V.; Thomas, M.; Miquel, S.; Soares, S. New insights into the diversity of the genus Faecalibacterium. Front. Microbiol. 2017, 8, 1790. [Google Scholar] [CrossRef] [PubMed]
  90. Merkova, M.; Zalesak, M.; Ringlova, E.; Julinova, M.; Ruzicka, J. Degradation of the surfactant Cocamidopropyl betaine by two bacterial strains isolated from activated sludge. Int. Biodeterior. Biodegrad. 2018, 127, 236–240. [Google Scholar] [CrossRef]
  91. Prousek, J. Fenton chemistry in biology and medicine. PureAppl. Chem. 2007, 79, 2325–2338. [Google Scholar] [CrossRef]
  92. Mackul’ak, T.; Mosný, M.; Grabic, R.; Golovko, O.; Koba, O.; Birošová, L. Fenton-like reaction: A possible way to efficiently remove illicit drugs and pharmaceuticals from wastewater. Environ. Toxicol. Pharmacol. 2015, 39, 483–488. [Google Scholar] [CrossRef]
  93. Blott, S.J.; Pye, K. Particle size distribution analysis of sand-sized particles by laser diffraction: An experimental investigation of instrument sensitivity and the effects of particle shape. Sedimentology 2006, 53, 671–685. [Google Scholar] [CrossRef]
Figure 1. Geological map and section at basin scale; (1) AES8: Emiliano-Romagnolo superiore synthem – Ravenna subsynthem; (2) AES8a: Emiliano-Romagnolo superiore synthem – Modena subsynthem; (3) main thrust.; (4) borehole; (5) toponym; (6) quoted point; (7) geological section’s trace; (8) stream; (9) meteorological station; (10) wastewaters treatment plant “Parma Ovest”.
Hydrology 10 00003 g001
Figure 2. Geological section at basin scale (the trace is shown in Figure 1): (1) fill material, (2) grey/light blue clay and silt; (3) yellow/brown clay and silt; (4) red clay and silt; (5) silt; (6) sand; (7) gravel and sand; (8) gravel and clay/silt; (9) gravel; (10) Code of Geological Unit [sensu 37]: AES1: Emiliano-Romagnolo superiore synthem – Monterlinzana subsynthem; AES2: Emiliano-Romagnolo superiore synthem – Maiatico subsynthem; AES7a: Emiliano-Romagnolo superiore synthem – Villa Verucchio subsynthem – Niviano unit; AES7b: Emiliano-Romagnolo superiore synthem – Villa Verucchio subsynthem – Vignola unit; AES8: Emiliano-Romagnolo superiore synthem – Ravenna subsynthem.
Hydrology 10 00003 g002
Figure 3. Location of boreholes and piezometers drilled at the test site (the red segment is related to Figure 4).
Hydrology 10 00003 g003
Figure 4. Geological section at site scale (the trace is shown in Figure 3).
Hydrology 10 00003 g004
Figure 5. Comparison of the six average grain-size distribution curves.
Hydrology 10 00003 g005
Figure 6. Hydraulic head fluctuations vs. daily rainfall (dates are given in day/month/year).
Hydrology 10 00003 g006
Figure 7. (a) Groundwater flow net in May 2022; (b) groundwater flow net in October 2022.
Hydrology 10 00003 g007
Figure 8. Hydraulic head fluctuations vs. groundwater EC in Pz3 (dates are given in day/month/year).
Hydrology 10 00003 g008
Figure 9. Groundwater EC vs. groundwater temperature in Pz3 (dates are given in day/month/year).
Hydrology 10 00003 g009
Figure 10. Indicators of fecal contamination (C.F.U./L) in the function of the hydraulic head variation in Pz3 (dates are given in day/month/year).
Hydrology 10 00003 g010
Figure 11. Conceptual oscillation of a contamination plume over time that is due to variation in the groundwater flow direction: (1) piezometer; (2) groundwater flow direction in May 2022; (3) groundwater flow direction in October 2022; (4) sewerage; (5) conceptual leaks; (6) conceptual plume theoretically linked to the groundwater flow direction in May 2022; (7) conceptual plume theoretically linked to the groundwater flow direction in October 2022; (8) variation of groundwater flow direction over time; (9) outcropping geological unit (AES8a).
Hydrology 10 00003 g011
Table 1. Summary of laser diffraction grain size analysis (± values refer to standard deviation).
Sample NameMean Diameter (µm)Mode (µm)SpanClay (%)Silt (%)Sand (%)
PZ1 6–7 m31.99 ± 1.9728.32 ± 14.035.44 ± 0.1618.0964.917.01
PZ1 11–12 m20.81 ± 0.798.62 ± 0.044.73 ± 0.121.771.047.26
PZ3 6–7 m16.18 ± 0.617.18 ± 0.024.82 ± 0.1328.167.084.82
PZ4 5–6 m57.06 ± 2.0575.2 ± 4.152.69 ± 0.055.9756.6737.36
PZ4 9–10 m48.68 ± 2.7457.51 ± 5.553.97 ± 0.0710.4660.6928.85
S18 8.75–9.5 m62.43 ± 3.9178.62 ± 5.222.83 ± 0.035.9854.3239.7
Table 2. Results of PCP analyses.
SampleParameter
(CAS)
TechniqueAnalytical
Method
Detection LimitResultsUnit
IN
wastewater
2-Phenoxyethanol (122-99-6)GC-MSIn-house0.2<0.2mg/L
Disodium EDTA
(139-33-3)
GC-MSISO 16588153μg/L
PDMS calculated as polydimethylsiloxane with a
viscosity of 1000 mPa.s (63148-62-9)
HPLC-RIIn-house100<100mg/L
Pz3
groundwater
2-Phenoxyethanol (122-99-6)GC-MSIn-house0.2<0.2mg/L
Disodium EDTA
(139-33-3)
GC-MSISO 165881<1μg/L
PDMS calculated as polydimethylsiloxane with a
viscosity of 1000 mPa.s (63148-62-9)
HPLC-RIIn-house100<100mg/L
Disclaimer/Publisher’s Note: The statements, opinions and data contained in all publications are solely those of the individual author(s) and contributor(s) and not of MDPI and/or the editor(s). MDPI and/or the editor(s) disclaim responsibility for any injury to people or property resulting from any ideas, methods, instructions or products referred to in the content.

