Article

Analyzing Spatial Trends of Precipitation Using Gridded Data in the Fez-Meknes Region, Morocco

1
Laboratoire Territoire Patrimoine et Histoire, FLSH Dhar El-Mehraz, Department of Geography, Sidi Mohamed Ben Abdellah University, Fez 30050, Morocco
2
National Research Council, Institute for Agricultural and Forest Systems in Mediterranean (CNR-ISAFOM), 87036 Rende, Italy
3
Department of Geography, FLSH Sais, Sidi Mohamed Ben Abdellah University, Fez 30050, Morocco
4
Department of Civil Engineering, The City College of New York, New York, NY 10031, USA
5
Department of Earth and Environmental Sciences, The City University of New York Graduate Center, New York, NY 10016, USA
*
Author to whom correspondence should be addressed.
Hydrology 2023, 10(2), 37; https://doi.org/10.3390/hydrology10020037
Submission received: 29 December 2022 / Revised: 23 January 2023 / Accepted: 24 January 2023 / Published: 27 January 2023
(This article belongs to the Section Hydrology–Climate Interactions)

Abstract

:
The aim of this paper was to present a precipitation trend analysis using gridded data at annual, seasonal and monthly time scales over the Fez-Meknes region (northern Morocco) for the period 1961–2019. Our results showed a general decreasing trend at an annual scale, especially over the mountain and the wetter parts of the region, which was statistically significant in 72% of the grid points, ranging down to −30 mm per decade. A general upward trend during autumn, but still non-significant in 95% of the grid points, was detected, while during winter, significant negative trends were observed in the southwest (−10 to −20 mm per decade) and northeast areas (more than −20 mm per decade) of the region. Spring rainfall significantly decreased in 86% of the grid points, with values of this trend ranging between 0 and −5 mm per decade in the upper Moulouya and −5 to −10 mm per decade over the rest of the region (except the northwest). At a monthly time scale, significant negative trends were recorded during December, February, March and April, primarily over the northeast Middle Atlas and the northwest tip of the region, while a significant upward trend was observed during the month of August, especially in the Middle Atlas. These results could help decision makers understand rainfall variability within the region and work out proper plans while taking into account the effects of climate change.

1. Introduction

Knowing precipitation trend using time series observation is the key to reliably determining the behavior of future observations. Indeed, precipitation is an important part of the hydrological cycle and its progressive alteration over time, due to on-going climate change, is taken into account by water resource managers and hydrologists. In fact, global climate change is influencing the distribution of precipitation, modifying the availability of water with increases in dry period length and increases in flood frequency [1]. Moreover, precipitation is one of the most important parameters capable of influencing, negatively or positively, the agricultural productivity of a region [2,3]. In other words, precipitation trend investigation allows for a better understanding of its future behavior, which is useful for developing greater control of floods and more efficient food production and, above all, improving the capacity of communities to face up to extreme weather events, and at the same time, their alarming consequences on political and social levels.
In this context, Morocco, located in Mediterranean northwest Africa (the Maghreb), is considered a very fragile country against the effects of the climate change [4]. In the past, a French colonialist administrator [5] in Morocco said that the state’s governance, its system and its stability depend on the fall of rain. This means that one dry year may cause political unrest and migration movements that complicate the narrow political calculations of colonialism at that time, and of successive Moroccan governments today. The Mediterranean basin is considered a hot spot for climate change [6]. The heating and drying effects of global warming predicted by various studies and climate simulation models are disastrous and seriously threaten environmental systems, agriculture activities and even drinking water supply [7,8,9,10]. The desertification resulting from the encroachment of the largest desert in the world towards the north is clear [11,12,13], and the recurrence of drought and intense heat waves is worrying as they overcome North Africa, to reach Europe and cause great losses [14,15,16,17]. The trend of rainfall in the Mediterranean domain has been studied by Caloiero et al. [18] using gridded datasets from the Global Precipitation Climatology Centre (GPCC) Reanalysis Version 6. At an annual time scale, the results show a clear negative trend over the Middle East, Greece, central and northern Italy, northern Morocco and southern Spain. Seasonal rainfall shows a net decrease over the Levant, southern Turkey and Albania, while spring rainfall exhibits a negative trend over northern Morocco, southern Spain and central Portugal. As one example of a study over a smaller region, Caloiero et al. [19] investigated rainfall trends using gridded data over the Calabria region in southern Italy; the results show a decreasing trend at an annual scale and during the winter and autumn seasons, which is in keeping with the findings of Longobardi and Villani [20]. Nouaceur and Murărescu [21] state that rainfall within the Maghreb region is not decreasing, but huge variation and a return to normal conditions is observed after 2008, which agrees with the conclusions of Benabdelouahab et al. [22]. However, Hadri et al. [23] show a descending trend in the Standardised Precipitation Index (SPI) series, with a good correlation with remote sensing data on the Normalized Difference Vegetation Index (NDVI). An explanation of this disagreement could be differences in the studied period. A decline in rainfall was reported in Spain and southern Portugal [24,25].
Studying climate change variability demands huge amounts of data covering long time spans. However, in developing countries, the climate station network is very weak, very large regions are not covered by meteorological stations, and the low quality of the data gathered leaves conclusions uncertain. Satellite observation, reanalysis and gridded datasets are the main solutions adopted. Various gridded datasets have been created and analyzed by many institutions and researchers [26,27,28,29,30]. All those gridded datasets are based on some combination of rain gauge data, satellite-derived data and reanalysis data. Appraisal of some datasets was carried out by Sun et al. [31] who found a high degree of variability between datasets in annual and seasonal precipitation estimates, particularly in mountain areas, as well as in North Africa. In Sri Lanka, an investigation conducted by Perera et al. [32] in three hydrological basins using satellite-derived products against 15 years of observed rainfall data showed that PERSIANN-CCS was the weakest in terms of performance and TRMM-3B42 RT had the best trend prediction performance. Hu et al. [33] investigated the performance of (GPCC) V7, (CRU) TS 3.22, and Willmott and Matsuura (WM) rainfall data over Central Asia and showed that all three gridded datasets underestimated the observed precipitation at annual and monthly scales, especially in mountainous areas. Similar conclusion for mountainous areas are obtained by Henn et al. [34] in the western United States, showing that the highest absolute differences between datasets occur in high-elevation areas. Indeed, the difficulties in the interpolation of climatic variables, especially rainfall, in mountainous areas have long been discussed [35]. Gridded precipitation from 23 datasets was evaluated by Satgé et al. [36]. The best overall performance was obtained for MSWEP v.2.2 and CHIRPS v.2 for daily and monthly time-step, and the authors show the importance of gridded datasets as helpful sources for risk forecast studies. According to Yao et al. [37], satellite-merged precipitation datasets performed better than gauge-based and reanalysis datasets. Those datasets are very important for climate simulation models, hydrological applications, and obtaining information about different climate characteristics over large- or small-scale areas not covered by weather measurement stations.
The purpose of this paper is to present the results of a trend analysis performed at annual, seasonal and monthly time scales by applying two non-parametric tests to a gridded rainfall dataset built for the Fez-Meknes region in northern Morocco from homogenized station data.

2. Study Area and Data
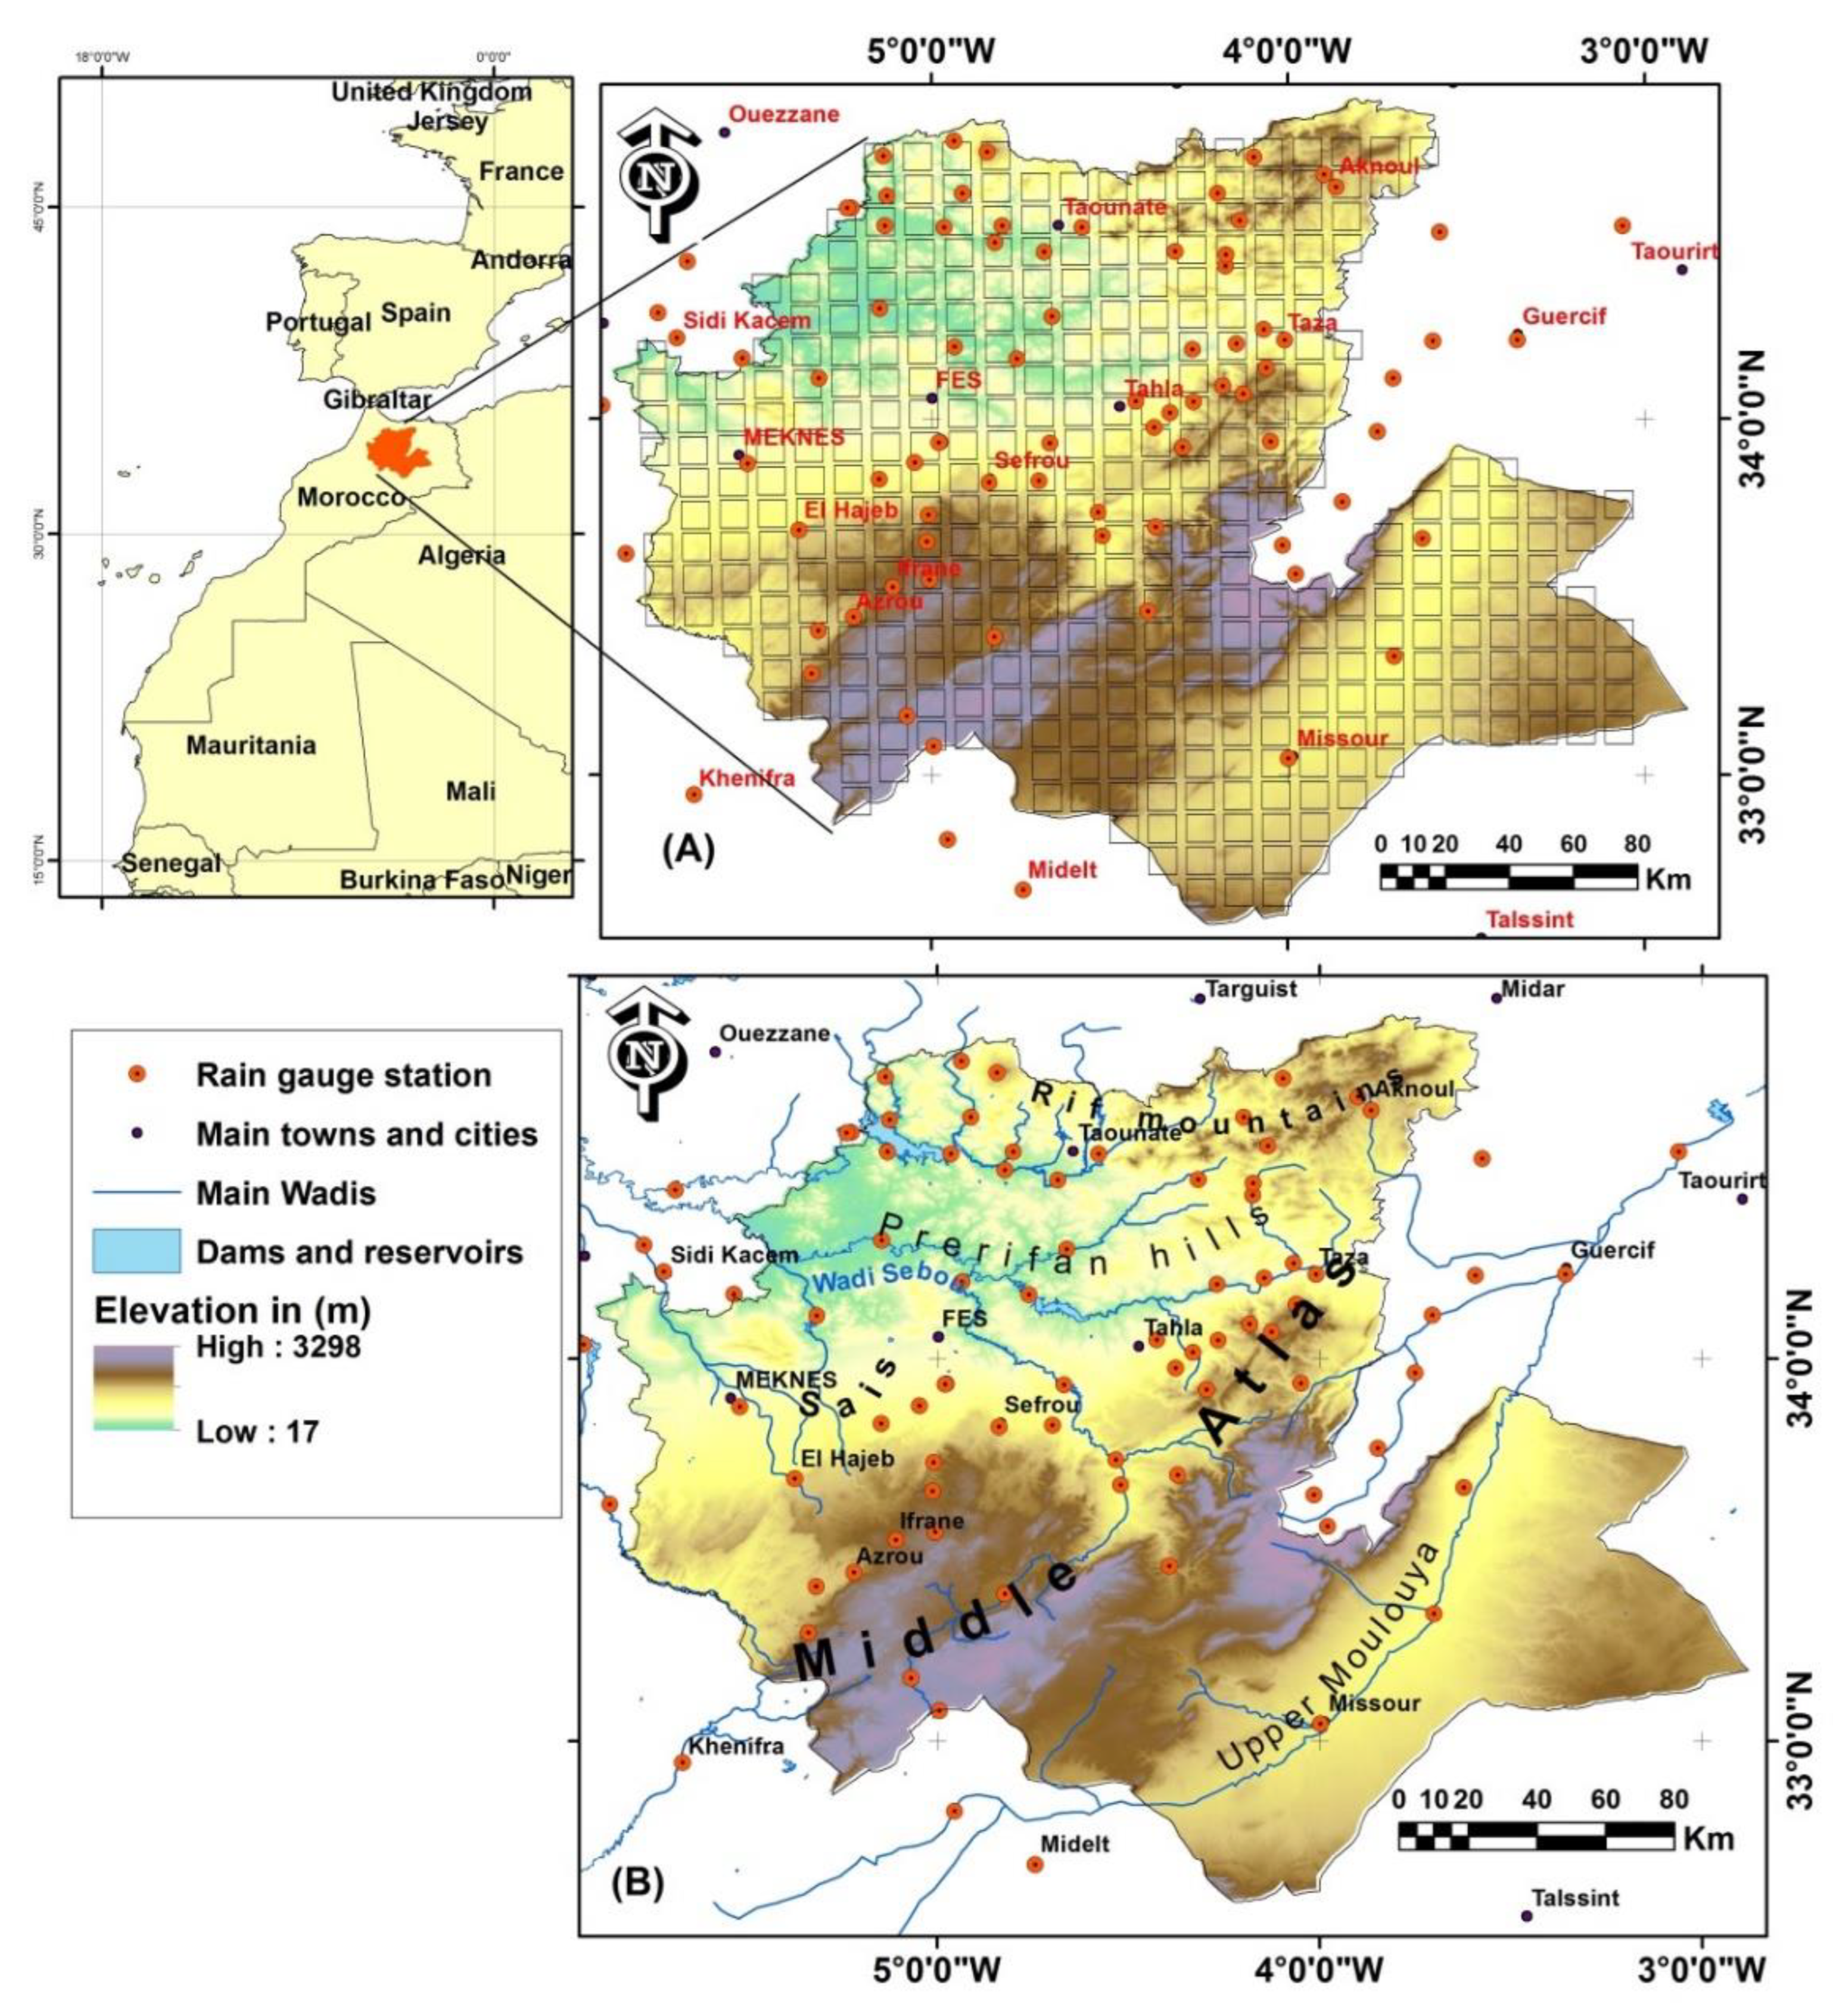
2.1. Study Area

The Fez-Meknes region (Figure 1) is one of the 15 regions that make up the Kingdom of Morocco according the territorial division of 2015. Located in the northern part of the country, it lies between latitudes 32°58′ N and 34°91′ N and between longitudes 2°8′ W and 5°9′ W. Its surface is 40,075 km2.
The Fez-Meknes region is home to 4.4 million inhabitants or 12.5% of the Moroccan population [38], and it holds 7.7% of the national GDP. It has 15% of the national usable agricultural land in Morocco, and the region’s contribution to national cereal production remains significant (around 21% during 2011–2212) [39]. The region is dominated by lowlands less than 500 m above sea level to the northwest and southeast, and by the Sais plateau and Prerifan hills (600 to 700 m) in the center and the northeast, while the north is occupied by the Rif mountains. The central area is dominated by the Middle Atlas mountain range, which culminates at more than 3300 m at Jebel Bounacer and the massif of Bouyblane (Figure 1). The hydrological network consists of two main watersheds. The Sebou Basin on the west side of the region drains the wettest zone of the region; it is the most important watershed within the country and has a total average yield of six billion cubic meters of water per year, and dams and reservoirs are built on many of its tributaries. The Moulouya basin in the southeast is an arid-to-subarid region; the stream starts outside of region and crosses it at the upper Moulouya.
According to the Köppen–Geiger climate classification [40], the climate of the Fez-Meknes region is Csa (temperate with dry and hot summers) over the most important west side of the region (Figure 2). An arid and cold steppe type (Bsk) is found over the highlands, which are temperate (Csb) with dry and warm summers, and Dsb (cold with dry and warm summers) is found over the highest parts of the Middle Atlas Mountain range. The climate of the upper Moulouya region is Bwk, with an arid, desert and cold climate with less rainfall and steppe vegetation.
The mean annual rainfall ranges from 423 mm in Fez and 508 mm in Meknes up to 741 mm in Bab Ounder. The wettest conditions are on the mountain peaks of the Atlas and the Rif (988 mm in Ifrane, and 1555 mm in Jbel Oudka). The southeast is arid-to-semi-arid, particularly in the upper Moulouya, with 137 mm at Outat El Haj and 161 mm at Missour.

2.2. Data Source and Quality

To build the gridded dataset, monthly rainfall data from 83 rain gauges (from 1961 to 2019) were used. Figure 1A presents the spatial distribution of the gauges and the grid points used in this work. The main providers of this data were public special agencies of the main hydrological basin within the region: the Agence du Bassin Hydraulique de Sebou (ABHS), the Agence du Bassin Hydraulique de la Moulouya (ABHM), and the Agence du Bassin Hydraulique de l’Oum Er-Rbia (ABHOER). All these agencies were established to manage water resources in the river basins in Morocco in all aspects. They collect data, supervise dams, reservoirs and irrigation installations, and issue licenses for drilling wells. They monitor everything related to water in their watersheds. Before performing any analysis, data before 1961 were also checked, showing predominantly wet conditions with the exception of some dry years. In any case, before 1961, data are very scarce within the region and have a very low coverage rate, and thus, for these reasons, 1961 was chosen as the starting year for this study.
After collecting the data, quality control was performed on the database to check for missing data and possible inhomogeneities in the series. A homogenization process and gap-filling of the rainfall time series were carried out using the specialized package Climatol under the R environment [41,42]. This tool was specially designed for climatic data homogenization, and is based on the RMA method (Reduced Major Axis), a kind of orthogonal regression that is an alternative to ordinary least squares (OLS) for fitting bivariate relations. This package uses a standard normal homogeneity test (SNHT) both on overlapping windows and on the entire rainfall series to detect inhomogeneities. The advantageous qualities and the performance of the Climatol results were evaluated in various studies [43,44,45,46]. More details on the homogenization operation for the rain gauge data in this region were published by Kessabi et al. [47].

3. Methods

3.1. Inverse-Distance-Weighted Interpolation

Our gridded dataset was composed of 389 monthly rainfall series or grid points covering the regional territory; its resolution is 10km. The gridded dataset was obtained through an operation of interpolation using the Inverse-Distance-Weighted (IDW) technique. The IDW technique is a deterministic way to interpolate data which does not need any other covariate data to improve the quality of the interpolation. Many studies used this technique, such as that of Giarno et al. [48], which found that the IDW in Sulawesi was more stable in correlation than kriging, both in the rainy season and the dry season. The comparison between the IDW and kriging methods made by Dirks et al. [49] to interpolate rainfall data led them to recommend the use of the IDW method for spatially dense networks of rain gauges. In fact, in dense and well-distributed rain gauge networks, although geostatistical interpolators outperformed the IDW, the rainfall spatial distribution gave fairly satisfactory results [50].
This technique assumes that each measured point’s influence and weight decrease along with the distance of the rain gauge and unsampled points. The closer an observation is to the point of the estimate, the higher its influence that is expressed through a weight (w), given by:
w i x = 1 d x , x i p
where x is the point at which rainfall is unknown, xi is one of the points at which rainfall is available, d is the distance between the two points, and p is an exponent that allows different forms to the weighting function to be given.
The higher p is, the less importance is given to more remote observations. For this research, a p value equal to 2 is used, in line with several works [50,51,52].

3.2. Trend Test Analysis

To check the rainfall trends in the era of climate change, the widely recognized non-parametric Mann–Kendall test and the Theil–Sen slope estimator were employed. The Mann–Kendall test is one of the most common non-parametric tests used by researchers around the globe to characterize trends and their significance within hydrometeorological time series, as proposed by [53,54]. Compared to the least-squares linear regression approach, it is robust to outliers and extreme values, including those that might arise from sporadic undetected observation and recording errors.
The Mann–Kendall test is well-known in the literature; as an example, the use and computation of this test has been well described by Achite et al. [55].
If a trend is present in a time series, then the true slope (change per unit time) can be estimated using the simple non-parametric procedure developed in [56]. The slope estimates of the n(n−1)/2 unique pairs of data are first computed as follows:
Q i , j = X j X i j i           for     i , j = 1 , 2   , n
where Xj and Xi are data values at times j and i (j > i), respectively. The median of these N = n(n−1)/2 values of Q is Sen’s estimator of the slope.
After sorting the Q values, if N is even, then Sen’s estimator is calculated as:
Q m e d = 1 2 Q N 2 + Q N + 2 2
If N is odd, then Sen’s estimator is computed as:
Q m e d = Q N + 1 2
Sen’s estimator Qmed provides the rate of change and enables determination of the total change in any variable during the analysis period. Sen’s slopes over the 58-year (1961–2019) study period are expressed here in mm/10 years.
Then, Sen’s slope values of the grid points were classified into six classes and presented as colors reflecting the volume of precipitation change in mm per decade, where the marker size at the grid point indicates the trend significance as given by the Mann–Kendall test.

4. Results

The most important results of the trend tests and their statistical significance (95% confidence level) are summarized in Figure 3 at annual, seasonal and monthly time scales. At an annual scale, a general negative trend over the whole regional territory is noted. This trend is statistically significant in 72% of the grid points and negative, but not significant, over the remaining 28% (Figure 3).
The amount of decrease reaches its maximum in the mountain zone of northeast Middle Atlas in the southwest of Taza and around Ifrane and Azrou, but also in the north of Taza in the Rif Mountains and Prerifan hills, with values ranging between −20 mm and −30 mm per decade. The northwest of the region and the Moulouya basin show negative but non-significant trends (Figure 4). Considering the results of the seasonal rainfall trend analysis, the decreasing rainfall explains most of the annual trend in the wet season, especially winter and spring, given the marginal amount of summer precipitation.
During autumn, an upward trend over 98% of the grid points, but non-significant for about 95% of the cells, was recorded (Figure 3). Only 3% expressed a statistically significant upward trend, and those cells are located mainly around the central valley of the upper Moulouya (Figure 5).
The upward trend of autumnal precipitation is explained by the positive trend of the September and October months (Figure 5). Most of the grid points expressed an upward non-significant trend during September (97%) and October (96%). For each of those months, 3% of the cells expressed an upward significant trend located mainly in the northwest of the region. The magnitude of this trend is still quite marginal, at around +5 mm per decade. However, the month of November shows the beginning of a negative trend, still non-significant, that concerns mainly the Middle Atlas Mountain range, the Sais plateau and the northeastern tip of the region (Figure 5).
The negative trend started in November and continued during the winter season, in which 46% of the grid points recorded a downward significant trend, while the remaining 54% of the grid cells showed a negative but non-significant trend (Figure 3). The declining rainfall in winter reached values of −10 mm to −20 mm per decade over large areas of the Prerifan hills between Taza and Taounat in the northeast, and across the Middle Atlas Mountain zone between upper Moulouya and the western parts of the region (Figure 6).
The negative trend during December and February explains most of the winter rainfall decrease. This negative trend becomes more pronounced with values of more than −10 mm/10 years, especially over Rif and Middle Atlas. In December, 99% of the grid points express a downward non-significant trend, while a few points (four grid points or 1%) show a significant negative trend over eastern Prérif and around the Middle Atlas mountain range (Figure 6). In February the decrease becomes clearer and statistically significant across the Middle Atlas and the area stretching between Taza and Taounat, with values of −5 mm and −10 mm per decade (Figure 6). The percentage of grid points showing this significant negative trend is 17% of the total, and that showing a non-significant negative trend is 83% (Figure 3). Conversely, the month of January has an upward non-significant trend over 20% of the cells, largely over the Sais plateau and Middle Atlas northwestern peripheries, against 80% showing a non-significant negative trend over the rest of the region (Figure 6).
In the study area, the spring season is the second wettest season after winter. The rainfall trend is negative and statistically significant in 86% of the grid points, while the remaining 14% are also negative, but non-significant at an alpha threshold of 0.05 (Figure 3). The volume of this decline reaches to −10 mm/10 years in the upper Moulouya and the northwestern quarter of the region. While the remaining grid points display an important decrease ranging between −10 and −20 mm/10 years, even more volumes are recorded around the Tazzeka and Bab Boudir Mountains in the southwest of Taza. The explanation for this decline in spring rainfall is mainly related to the downward trend of rainfall during March and April, with 69% and 43% of the total grid points exhibiting a negative and significant trend at a 95% confidence level, respectively (Figure 3 and Figure 7). The percentage of non-significant negative trends throughout the months of the spring season is 31% for March, 57% for April and 91% for May. At a monthly scale, the amount and spatial extent of the negative trend during March ranges between −5 and −10 mm/10 years over the Sais plateau and Middle Atlas Mountains, while for the upper Moulouya, we recorded a downward trend of −5 mm/10 years. The northern area shows a negative but non-significant trend (Figure 7).
During April, the rainfall trend is statistically significant over the southern half of the region, with values ranging from −5 to −10 mm per decade over the Middle Atlas range, while on the upper Moulouya, the decline ranges between 0 and −5 mm/10 years. The northern half of the region exhibits similar values of decrease, but without reaching the significance level of 95%. The month of May displays a negative but non-significant trend over 91% of the grid points, while 8% are statistically significant. This behavior includes some points extending in the middle of the region from west to east between the mountains of Zerhoun and Sefrou and those south of Taza, with values ranging from 0 to −5 mm per decade, while in the west, values reach −10 mm per decade in the areas south of Taza (Figure 7). In a few grid points (1%) located around the upper Moulouya arid region, we recorded an upward non-significant trend.
Summer rainfall is very marginal within the region’s precipitation regime; on average, it represents less than 4% of the annual total, as is expected in the Mediterranean climate domain of the Maghreb, but this share can reach 17% in mountain areas. The summer rainfall trend is negative and statistically significant over 56% of the grid points, and is mainly concentrated in the northern and southeastern areas; the negative but non-significant trend covers 37% of the grid points positioned in the upper Moulouya Basin (Figure 3 and Figure 8).
The upward trend concerns 8% of the total grid points, located mostly around the height of the southern belt of Middle Atlas. At a monthly scale, a negative and significant trend during June, concerning 99% of the grid points, was noted. Conversely, July displayed an upward trend over the southern half against downward trends over the other northern half. The upward non-significant ones represent 54% of the grid points, ranging between 0 and +5 mm/10 years, and concern mainly the southern Middle Atlas and the Moulouya basin. The negative trends are statistically significant for 6% of the grid points, marking a corridor of the lowlands between Taza and Sidi Kacem, as shown in Figure 8. The trends in July rainfall generally range between 0 and −5 mm/10 years. The upward trend revealed during July was confirmed in August, with a significant upward trend, which represents 18% of the grid points, while 58% of the grid points show a non-significant increasing trend (Figure 3). Most of the positive trends are located over the mountain area over the southwest of the region and around the central valley of Moulouya (Figure 8). In only 1% of the cells did we record a negative and significant trend, and the remaining negative ones cover around 23% of the 389 points. It is noteworthy that during July and August, the dry regions of Moulouya and the southern heights of the Middle Atlas range become wet compared with the northwest of the region, notwithstanding that summer rainfall remains very marginal in the context of the Mediterranean climate of North Africa, as mentioned above.

5. Discussion

In this paper, the results of a trend analysis performed over a gridded dataset built in a region of Morocco, based on rainfall time series from 83 rain gauges ranging from 1961 to 2019, are presented. The annual rainfall shows negative and significant trends over the majority of the grid points, which is consistent with the findings of Caloiero et al. [18] at least for the annual time scale. Similar findings are also seen in works by Knippertz et al. [57], Singla et al. [58] and Ouatiki et al. [59]. The study of Driouech [60] about rainfall in Morocco showed a negative trend after the shift that happened at the end of the 1970s. Similar results have been found on Madeira Island, located off the coast of Morocco [61]. In mainland Portugal, also close to Morocco, Portela et al. [25] studied rainfall series of 106 years in the southern region of the country and drew the same conclusions. Our findings at the annual scale are thus similar to different studies within Morocco and its vicinity. At a seasonal scale, the upward trend revealed for the autumn season is consistent with the results obtained in western Algeria [62,63]. Conversely, different results were obtained by Caloiero et al. [18] for the autumn and summer seasons, while similar tendencies were detected during winter and spring. A recent investigation showed an upward trend within temperature indices against a downward trend for rainfall indices, which is in perfect agreement with our results on rainfall trends [64]. This trend behavior seems to be correlated with changes in intra-annual precipitation distribution, which, in turn, is dependent, to some extent, on teleconnection patterns, especially on the North Atlantic Oscillation. In fact, North Africa rainfall is influenced by the NAO and other teleconnection patterns, such as the El Niño Southern Oscillation (ENSO), Mediterranean Oscillation (MO), and Western Mediterranean Oscillation (WeMO) [65]. In particular, as regards the NAO, according to several previous works, this teleconnection governs most of the rainfall of the wet season within the country [57,66,67]. Kelley et al. [68] evidenced a marked negative phase of this teleconnection pattern between 1940 and 1980, corresponding to a period with more rainfall and wet conditions in Morocco. On the contrary, more recently, a very positive phase of NAO after 1980 was observed, and thus, drought conditions dominated the country.
Few studies have been conducted in Morocco using gridded data. The study of Caloiero et al. [18] concerns the whole Mediterranean basin and Europe, and its main characteristics are discussed above. Gridded and gauged data were used by Zamrane et al. [69] over three main basins (Sebou, Moulouya and Tansift), which cover the whole territory of the Fez-Meknes region, but they used few rain gauges (just six stations that fall within or close to our studied territory) so they would give a less reliable and complete picture of spatial variability. The authors identified frequencies of variability at 1 year and 8–16 years, and identified three main break points during 1970, 1980 and 2000. These points of change mark a decline in rainfall within the three basins, which is in agreement with our findings. A new monthly gridded rainfall dataset for Africa covering the 60-year period of 1940–1999 was created by Dieulin et al. [70]. The results of this study, computed on the observed and gridded data, detected a break in the rainfall regime around 1979/1980, which agrees with the findings of many others studies on Moroccan precipitation trends and variability [58]. Given the features used to estimate rainfall within the CHELSA dataset algorithms [71], the investigations conducted on it show that it exaggerates the amount of rainfall in some dry areas [72]. Conversely, the TerraClimate dataset [29] underestimated the rainfall volumes within the Fez-Meknes based on checks against data gauged from five stations inside the region [73].
Regardless of the various observations and criticisms that may be directed against reanalysis- and satellite-based datasets, these data remain essential for climate and hydrological modeling, and even for obtaining data close to the truth over large areas that are not covered by weather stations. However, collecting the maximum quantity of measurement data from ground monitoring stations before starting to build these datasets will greatly help improve their spatial accuracy and the quality of their final outputs. According to Arias and Barriga [74] the performance of these datasets must be validated locally by observed station data, and the observation-based gridded dataset developed in this work allows us to do so.

6. Conclusions

This paper attempts to resolve two dilemmas in Morocco. The first is the problem of data that are not available on large scales. The second is the study of rainfall trends (the most important climate variable in the region) in one of the most important regions of Morocco, with 4.3 million inhabitants and important agricultural and water resources, mainly located in the most important watershed of the country, i.e., the famous Sebou basin. With this aim, first data from 83 rainfall time series stretching between 1961 and 2019 covering this region and its vicinity were used to build a gridded dataset. Interpolations from these rain gauges into 389 grid points were implemented through the IDW technique. Then, a trend analysis was performed using the Mann–Kendall test and the Theil–Sen slope estimator.
As a result, the following main outcomes can be deducted:
  • The rainfall trend analysis showed a significant decline at an annual scale in most areas of the region, which is statistically significant at the majority of the grid points, with values ranging between −10 and −20 mm per decade;
  • At a seasonal scale, the upward trend revealed during autumn remains weak (around +10 mm per decade) and unable to compensate for the huge decline in winter and spring rainfall (−10 to −20 mm/10 years) within the wet mountains of study area;
  • In autumn, only 3% of the cells, located mainly around the central valley of the upper Moulouya, expressed a statistically significant upward trend;
  • Declining rainfall in winter was detected over large areas of the Prerifan hills between Taza and Taounat in the northeast, and across the Middle Atlas Mountains zone between the upper Moulouya and western parts of the region;
  • Spring rainfall decline was mainly identified in the upper Moulouya and the northwestern quarter of the region;
  • The summer rainfall trend was negative and mainly concentrated in the northern and southeastern areas;
  • The creation of this gridded dataset is a first for a Moroccan region and will improve the monitoring of drought and rainfall variability inside the region and generally across Morocco.

Author Contributions

Conceptualization, R.K.; methodology, R.K. and M.H.; software, R.K. and G.P.; formal analysis, R.K, G.P. and T.C.; validation: N.Y.K. and T.C.; investigation, R.K, G.P. and T.C.; data curation, R.K. and R.A.; writing—original draft preparation, R.K., N.Y.K. and T.C.; writing—review and editing, R.K., N.Y.K. and T.C.; visualization, R.K. and T.C.; supervision, N.Y.K. and M.H. All authors have read and agreed to the published version of the manuscript.

Funding

This research received no external funding.

Institutional Review Board Statement

Not applicable.

Informed Consent Statement

Not applicable.

Data Availability Statement

The data presented in this study are available on request from the corresponding authors.

Acknowledgments

We would like to thank the ABHS staff for providing the data.

Conflicts of Interest

The authors declare no conflict of interest.

References

  1. Pal, A.B.; Khare, D.; Mishra, P.K.; Singh, L. Trend Analysis of Rainfall, Temperature and Runoff Data: A Case Study of Rangoon Watershed in Nepal. Int. J. Students’ Res. Technol. Manag. 2017, 5, 21–38. [Google Scholar] [CrossRef] [Green Version]
  2. Modarres, R.; de Paulo Rodrigues da Silva, V. Rainfall Trends in Arid and Semi-Arid Regions of Iran. J. Arid Environ. 2007, 70, 344–355. [Google Scholar] [CrossRef]
  3. Malhi, G.S.; Kaur, M.; Kaushik, P. Impact of Climate Change on Agriculture and Its Mitigation Strategies: A Review. Sustainability 2021, 13, 1318. [Google Scholar] [CrossRef]
  4. Schilling, J.; Freier, K.P.; Hertig, E.; Scheffran, J. Climate Change, Vulnerability and Adaptation in North Africa with Focus on Morocco. Agric. Ecosyst. Environ. 2012, 156, 12–26. [Google Scholar] [CrossRef]
  5. Béglé, J. Gouverner, c’est Pleuvoir! 2016. Available online: https://www.lepoint.fr/politique/gouverner-c-est-pleuvoir-31-05-2016-2043231_20.php (accessed on 20 October 2022).
  6. Tuel, A.; Eltahir, E.A.B. Why Is the Mediterranean a Climate Change Hot Spot? J. Clim. 2020, 33, 5829–5843. [Google Scholar] [CrossRef]
  7. Seif-Ennasr, M.; Zaaboul, R.; Hirich, A.; Caroletti, G.N.; Bouchaou, L.; El Morjani, Z.E.A.; Beraaouz, E.H.; McDonnell, R.A.; Choukr-Allah, R. Climate Change and Adaptive Water Management Measures in Chtouka Aït Baha Region (Morocco). Sci. Total Environ. 2016, 573, 862–875. [Google Scholar] [CrossRef]
  8. Bouras, E.; Jarlan, L.; Khabba, S.; Er-Raki, S.; Dezetter, A.; Sghir, F.; Tramblay, Y. Assessing the Impact of Global Climate Changes on Irrigated Wheat Yields and Water Requirements in a Semi-Arid Environment of Morocco. Sci. Rep. 2019, 9, 19142. [Google Scholar] [CrossRef] [Green Version]
  9. Hssaisoune, M.; Bouchaou, L.; Sifeddine, A.; Bouimetarhan, I.; Chehbouni, A. Moroccan Groundwater Resources and Evolution with Global Climate Changes. Geosciences 2020, 10, 2. [Google Scholar] [CrossRef] [Green Version]
  10. Tomaszkiewicz, M.A. Future Seasonal Drought Conditions over the CORDEX-MENA/Arab Domain. Atmosphere 2021, 12, 856. [Google Scholar] [CrossRef]
  11. Puigdefábregas, J.; Mendizabal, T. Perspectives on Desertification: Western Mediterranean. J. Arid Environ. 1998, 39, 209–224. [Google Scholar] [CrossRef]
  12. Hammouzaki, Y. Desertification and Its Control in Morocco. In Combating Desertification in Asia, Africa and the Middle East: Proven Practices; Heshmati, G.A., Squires, V.R., Eds.; Springer: Dordrecht, The Netherlands, 2013; pp. 91–111. [Google Scholar]
  13. Karmaoui, A.; El Jaafari, S.; Chaachouay, H.; Hajji, L. The Socio-Ecological System of the Pre-Sahara Zone of Morocco: A Conceptual Framework to Analyse the Impact of Drought and Desertification. GeoJournal 2022, 87, 4961–4974. [Google Scholar] [CrossRef]
  14. Lionello, P.; Abrantes, F.; Gacic, M.; Planton, S.; Trigo, R.; Ulbrich, U. The Climate of the Mediterranean Region: Research Progress and Climate Change Impacts. Reg. Environ. Chang. 2014, 14, 1679–1684. [Google Scholar] [CrossRef]
  15. Zittis, G.; Hadjinicolaou, P.; Fnais, M.; Lelieveld, J. Projected Changes in Heat Wave Characteristics in the Eastern Mediterranean and the Middle East. Reg. Environ. Chang. 2016, 16, 1863–1876. [Google Scholar] [CrossRef]
  16. Díaz-Poso, A.; Lorenzo, N.; Royé, D. Spatio-Temporal Evolution of Heat Waves Severity and Expansion across the Iberian Peninsula and Balearic Islands. Environ. Res. 2022, 217, 114864. [Google Scholar] [CrossRef] [PubMed]
  17. Lhotka, O.; Kyselý, J. The 2021 European Heat Wave in the Context of Past Major Heat Waves. Earth Sp. Sci. 2022, 9, e2022EA002567. [Google Scholar] [CrossRef]
  18. Caloiero, T.; Caloiero, P.; Frustaci, F. Long-Term Precipitation Trend Analysis in Europe and in the Mediterranean Basin. Water Environ. J. 2018, 32, 433–445. [Google Scholar] [CrossRef]
  19. Caloiero, T.; Coscarelli, R.; Pellicone, G. Trend Analysis of Rainfall Using Gridded Data over a Region of Southern Italy. Water 2021, 13, 2271. [Google Scholar] [CrossRef]
  20. Longobardi, A.; Villani, P. Trend Analysis of Annual and Seasonal Rainfall Time Series in the Mediterranean Area. Int. J. Climatol. 2010, 30, 1538–1546. [Google Scholar] [CrossRef]
  21. Nouaceur, Z.; Murărescu, O. Rainfall Variability and Trend Analysis of Annual Rainfall in North Africa. Int. J. Atmos. Sci. 2016, 2016, 1–12. [Google Scholar] [CrossRef]
  22. Benabdelouahab, T.; Gadouali, F.; Boudhar, A.; Lebrini, Y.; Hadria, R.; Salhi, A. Analysis and Trends of Rainfall Amounts and Extreme Events in the Western Mediterranean Region. Theor. Appl. Climatol. 2020, 141, 309–320. [Google Scholar] [CrossRef]
  23. Hadri, A.; Saidi, M.E.M.; Boudhar, A. Multiscale Drought Monitoring and Comparison Using Remote Sensing in a Mediterranean Arid Region: A Case Study from West-Central Morocco. Arab. J. Geosci. 2021, 14, 118. [Google Scholar] [CrossRef]
  24. Valdes-Abellan, J.; Pardo, M.A.; Tenza-Abril, A.J. Observed Precipitation Trend Changes in the Western Mediterranean Region. Int. J. Climatol. 2017, 37, 1285–1296. [Google Scholar] [CrossRef] [Green Version]
  25. Portela, M.M.; Espinosa, L.A.; Studart, T.; Zelenakova, M. Rainfall Trends in Southern Portugal at Different Time Scales. In INCREaSE 2019; Monteiro, J., João Silva, A., Mortal, A., Aníbal, J., da Silva, M., Oliveira, M., Sousa, N., Eds.; Springer International Publishing: Cham, Switzerland, 2020; pp. 3–19. [Google Scholar]
  26. Zhu, X.; Zhang, M.; Wang, S.; Qiang, F.; Zeng, T.; Ren, Z.; Dong, L. Comparison of Monthly Precipitation Derived from High-Resolution Gridded Datasets in Arid Xinjiang, Central Asia. Quat. Int. 2015, 358, 160–170. [Google Scholar] [CrossRef]
  27. Shi, H.; Li, T.; Wei, J. Evaluation of the Gridded CRU TS Precipitation Dataset with the Point Raingauge Records over the Three-River Headwaters Region. J. Hydrol. 2017, 548, 322–332. [Google Scholar] [CrossRef] [Green Version]
  28. Faiz, M.A.; Liu, D.; Fu, Q.; Sun, Q.; Li, M.; Baig, F.; Li, T.; Cui, S. How Accurate Are the Performances of Gridded Precipitation Data Products over Northeast China? Atmos. Res. 2018, 211, 12–20. [Google Scholar] [CrossRef]
  29. Abatzoglou, J.T.; Dobrowski, S.Z.; Parks, S.A.; Hegewisch, K.C. TerraClimate, a High-Resolution Global Dataset of Monthly Climate and Climatic Water Balance from 1958-2015. Sci. Data 2018, 5, 1–12. [Google Scholar] [CrossRef] [Green Version]
  30. Singh, H.; Reza Najafi, M. Evaluation of Gridded Climate Datasets over Canada Using Univariate and Bivariate Approaches: Implications for Hydrological Modelling. J. Hydrol. 2020, 584, 124673. [Google Scholar] [CrossRef]
  31. Sun, Q.; Miao, C.; Duan, Q.; Ashouri, H.; Sorooshian, S.; Hsu, K.L. A Review of Global Precipitation Data Sets: Data Sources, Estimation, and Intercomparisons. Rev. Geophys. 2018, 56, 79–107. [Google Scholar] [CrossRef] [Green Version]
  32. Perera, H.; Senaratne, N.; Gunathilake, M.B.; Mutill, N.; Rathnayake, U. Appraisal of Satellite Rainfall Products for Malwathu, Deduru, and Kalu River Basins, Sri Lanka. Climate 2022, 10, 156. [Google Scholar] [CrossRef]
  33. Hu, Z.; Zhou, Q.; Chen, X.; Li, J.; Li, Q.; Chen, D.; Liu, W.; Yin, G. Evaluation of Three Global Gridded Precipitation Data Sets in Central Asia Based on Rain Gauge Observations. Int. J. Climatol. 2018, 38, 3475–3493. [Google Scholar] [CrossRef]
  34. Henn, B.; Newman, A.J.; Livneh, B.; Daly, C.; Lundquist, J.D. An Assessment of Differences in Gridded Precipitation Datasets in Complex Terrain. J. Hydrol. 2018, 556, 1205–1219. [Google Scholar] [CrossRef]
  35. Goovaerts, P. Geostatistical Approaches for Incorporating Elevation into the Spatial Interpolation of Rainfall. J. Hydrol. 2000, 228, 113–129. [Google Scholar] [CrossRef]
  36. Satgé, F.; Defrance, D.; Sultan, B.; Bonnet, M.-P.; Seyler, F.; Rouché, N.; Pierron, F.; Paturel, J.-E. Evaluation of 23 Gridded Precipitation Datasets across West Africa. J. Hydrol. 2020, 581, 124412. [Google Scholar] [CrossRef] [Green Version]
  37. Yao, J.; Chen, Y.; Yu, X.; Zhao, Y.; Guan, X.; Yang, L. Evaluation of Multiple Gridded Precipitation Datasets for the Arid Region of Northwestern China. Atmos. Res. 2020, 236, 104818. [Google Scholar] [CrossRef]
  38. HCP. Recensement Général de La Populatiion et de l’Habitat. Monographie Générale, Région de Fès-Meknès; HCP: Rabat, Morocco, 2014; p. 171. [Google Scholar]
  39. DGCL. Monographie Générale, Région de Fès-Meknès; DGCL: Rabat, Morocco, 2015; p. 62.
  40. Beck, H.E.; Zimmermann, N.E.; McVicar, T.R.; Vergopolan, N.; Berg, A.; Wood, E.F. Present and Future Köppen-Geiger Climate Classification Maps at 1-Km Resolution. Sci. Data 2018, 5, 1–12. [Google Scholar] [CrossRef] [Green Version]
  41. Guijarro, J.A. Daily Series Homogenization and Gridding with Climatol v.3. In Proceedings of the Ninth Seminar for Homogenization and Quality Control in Climatological Databases and Fourth Conference on Spatial Interpolation Techniques in Climatology and Meteorology, Budapest, Hungary, 3–7 April 2017; WMO: Geneva, Switzerland, 2017; pp. 175–180. [Google Scholar]
  42. Guijarro, J.A. Homogenization of Climatological Series with Climatol Version 3.1.1.; R Package: Vienna, Austria, 2018; p. 20. [Google Scholar]
  43. Coll, J.; Domonkos, P.; Guijarro, J.; Curley, M.; Rustemeier, E.; Aguilar, E.; Walsh, S.; Sweeney, J. Application of Homogenization Methods for Ireland’s Monthly Precipitation Records: Comparison of Break Detection Results. Int. J. Climatol. 2020, 40, 6169–6188. [Google Scholar] [CrossRef]
  44. Skrynyk, O.; Aguilar, E.; Guijarro, J.; Randriamarolaza, L.Y.A.; Bubin, S. Uncertainty Evaluation of Climatol’s Adjustment Algorithm Applied to Daily Air Temperature Time Series. Int. J. Climatol. 2021, 41, E2395–E2419. [Google Scholar] [CrossRef]
  45. Dewan, A.; Shahid, S.; Bhuian, M.H.; Hossain, S.M.J.; Nashwan, M.S.; Chung, E.-S.; Hassan, Q.K.; Asaduzzaman, M. Developing a High-Resolution Gridded Rainfall Product for Bangladesh during 1901–2018. Sci. Data 2022, 9, 471. [Google Scholar] [CrossRef]
  46. Kuya, E.K.; Gjelten, H.M.; Tveito, O.E. Homogenization of Norwegian Monthly Precipitation Series for the Period 1961--2018. Adv. Sci. Res. 2022, 19, 73–80. [Google Scholar] [CrossRef]
  47. Kessabi, R.; Hanchane, M.; Guijarro, J.A.; Krakauer, N.Y.; Addou, R.; Sadiki, A.; Belmahi, M. Homogenization and Trends Analysis of Monthly Precipitation Series in the Fez-Meknes Region, Morocco. Climate 2022, 10, 64. [Google Scholar] [CrossRef]
  48. Giarno; Didiharyono, D.; Fisu, A.A.; Mattingaragau, A. Influence Rainy and Dry Season to Daily Rainfall Interpolation in Complex Terrain of Sulawesi. IOP Conf. Ser. Earth Environ. Sci. 2020, 469, 12003. [Google Scholar] [CrossRef]
  49. Dirks, K.N.; Hay, J.E.; Stow, C.D.; Harris, D. High-Resolution Studies of Rainfall on Norfolk Island: Part II: Interpolation of Rainfall Data. J. Hydrol. 1998, 208, 187–193. [Google Scholar] [CrossRef]
  50. Pellicone, G.; Caloiero, T.; Modica, G.; Guagliardi, I. Application of Several Spatial Interpolation Techniques to Monthly Rainfall Data in the Calabria Region (Southern Italy). Int. J. Climatol. 2018, 38, 3651–3666. [Google Scholar] [CrossRef]
  51. Caloiero, T.; Pellicone, G.; Modica, G.; Guagliardi, I. Comparative Analysis of Different Spatial Interpolation Methods Applied to Monthly Rainfall as Support for Landscape Management. Appl. Sci. 2021, 11, 9566. [Google Scholar] [CrossRef]
  52. Yang, R.; Xing, B. A Comparison of the Performance of Different Interpolation Methods in Replicating Rainfall Magnitudes under Different Climatic Conditions in Chongqing Province (China). Atmosphere 2021, 12, 1318. [Google Scholar] [CrossRef]
  53. Mann, H.B. Nonparametric Tests Against Trend. Econometrica 1945, 13, 245–259. [Google Scholar] [CrossRef]
  54. Kendall, M.G.; Stuart, A. The Advanced Theory of Statistics; Macmillan: New York, NY, USA, 1977. [Google Scholar]
  55. Achite, M.; Wałęga, A.; Toubal, A.K.; Mansour, H.; Krakauer, N. Spatiotemporal Characteristics and Trends of Meteorological Droughts in the Wadi Mina Basin, Northwest Algeria. Water 2021, 13, 3103. [Google Scholar] [CrossRef]
  56. Sen, P.K. Estimates of the Regression Coefficient Based on Kendall ’ s Tau. J. Am. Stat. Assoc. 1968, 63, 1379–1389. [Google Scholar] [CrossRef]
  57. Knippertz, P.; Christoph, M.; Speth, P. Long-Term Precipitation Variability in Morocco and the Link to the Large-Scale Circulation in Recent and Future Climates. Meteorol. Atmos. Phys. 2003, 83, 67–88. [Google Scholar] [CrossRef]
  58. Singla, S.; Mahé, G.; Dieulin, C.; Driouech, F.; Milano, M.; El Guelai, F.Z.; Ardoin-Bardin, S. Evolution Des Relations Pluie-Débit Sur Des Bassins Versants Du Maroc. IAHS-AISH Publ. 2010, 340, 679–687. [Google Scholar]
  59. Ouatiki, H.; Boudhar, A.; Ouhinou, A.; Arioua, A.; Hssaisoune, M.; Bouamri, H.; Benabdelouahab, T. Trend Analysis of Rainfall and Drought over the Oum Er-Rbia River Basin in Morocco during 1970–2010. Arab. J. Geosci. 2019, 12, 128. [Google Scholar] [CrossRef]
  60. Driouech, F. Distribution Des Précipitations Hivernales Sur Le Maroc Dans Le Cadre d’un Changement Climatique: Descente d’échelle et Incertitudes; L’université de Toulouse: Toulouse, France, 2010; pp. 1–164. [Google Scholar]
  61. Espinosa, L.A.; Portela, M.M. Rainfall Trends over a Small Island Teleconnected to the North Atlantic Oscillation—The Case of Madeira Island, Portugal. Water Resour. Manag. 2020, 34, 4449–4467. [Google Scholar] [CrossRef]
  62. Bouklikha, A.; Habi, M.; Elouissi, A.; Benzater, B.; Hamoudi, S. The Innovative Trend Analysis Applied to Annual and Seasonal Rainfall in the Tafna Watershed (Algeria). Rev. Bras. Meteorol. 2020, 35, 631–647. [Google Scholar] [CrossRef]
  63. Benzater, B.; Elouissi, A.; Dabanli, I.; Harkat, S.; Hamimed, A. New Approach to Detect Trends in Extreme Rain Categories by the ITA Method in Northwest Algeria. Hydrol. Sci. J. 2021, 66, 2298–2311. [Google Scholar] [CrossRef]
  64. Driouech, F.; Stafi, H.; Khouakhi, A.; Moutia, S.; Badi, W.; ElRhaz, K.; Chehbouni, A. Recent Observed Country-Wide Climate Trends in Morocco. Int. J. Climatol. 2021, 41, E855–E874. [Google Scholar] [CrossRef]
  65. Achite, M.; Caloiero, T.; Toubal, A.K. Rainfall and Runoff Trend Analysis in the Wadi Mina Basin (Northern Algeria) Using Non-Parametric Tests and the ITA Method. Sustainability 2022, 14, 9892. [Google Scholar] [CrossRef]
  66. Knippertz, P. A Simple Identification Scheme for Upper-Level Troughs and Its Application to Winter Precipitation Variability in Northwest Africa. J. Clim. 2004, 17, 1411–1418. [Google Scholar] [CrossRef]
  67. Hakam, O.; Baali, A.; Ait Brahim, Y.; El Kamel, T.; Azennoud, K. Regional and Global Teleconnections Patterns Governing Rainfall in the Western Mediterranean: Case of the Lower Sebou Basin, North-West Morocco. Model. Earth Syst. Environ. 2022, 8, 5107–5128. [Google Scholar] [CrossRef]
  68. Kelley, C.; Ting, M.; Seager, R.; Kushnir, Y. Mediterranean precipitation climatology, seasonal cycle, and trend as simulated by CMIP5. Geophys. Res. Lett. 2012, 39, L21703. [Google Scholar] [CrossRef]
  69. Zamrane, Z.; Mahé, G.; Laftouhi, N.E. Wavelet Analysis of Rainfall and Runoff Multidecadal Time Series on Large River Basins in Western North Africa. Water 2021, 13, 3243. [Google Scholar] [CrossRef]
  70. Dieulin, C.; Mahé, G.; Paturel, J.-E.; Ejjiyar, S.; Tramblay, Y.; Rouché, N.; EL Mansouri, B. A New 60-Year 1940/1999 Monthly-Gridded Rainfall Data Set for Africa. Water 2019, 11, 387. [Google Scholar] [CrossRef]
  71. Karger, D.N.; Conrad, O.; Böhner, J.; Kawohl, T.; Kreft, H.; Soria-Auza, R.W.; Zimmermann, N.E.; Linder, H.P.; Kessler, M. Climatologies at High Resolution for the Earth’s Land Surface Areas. Sci. Data 2017, 4, 170122. [Google Scholar] [CrossRef] [PubMed] [Green Version]
  72. Kessabi, R.; Hanchane, M. Spatialisation Des Types De Bioclimats Au Niveau De La Région De Fès-Meknès (Maroc) à Travers Les Données CHELSA Et Projections Futures; Actes du XXXIV ème Colloque International de l’AIC: Mohammadia, Morocco, 2021; pp. 276–281. [Google Scholar]
  73. Kessabi, R.; Hanchane, M.; Belmahi, M. Estimation Des Indices de La Sècheresse Climatique Selon Les Données TerraClimate et Celles Des Stations de Mesures (Cas de Cinq Stations de La Région de Fès-Meknès). In Changement Climatique, Potentialités Territoriales et Justice Environnementale; Hanchane, M., El Khazzan, B., Eds.; Université sidi Mohamed Ben Abdellahh: Fez, Morocco, 2021; pp. 163–181. [Google Scholar]
  74. Arias, E.C.; Barriga, J.C. Performance of High-Resolution Precipitation Datasets CHIRPS and TerraClimate in a Colombian High Andean Basin. Geocarto Int. 2022, 1–21. [Google Scholar] [CrossRef]
Figure 1. (A) Situation map of the Fez-Meknes region, rain gauges and visualization of the grid with a spatial resolution of 10 km; (B) the same map with more physiographic features.
Hydrology 10 00037 g001
Figure 2. (A) Annual rainfall mean interpolated to the grid points, and (B) Köppen–Geiger climate classification based on the data from [40].
Hydrology 10 00037 g002
Figure 3. Percentages of grid points presenting positive or negative and significant or non-significant trends at yearly, seasonal and monthly time scales.
Hydrology 10 00037 g003
Figure 4. Theil–Sen estimator and MK test at annual time scale. Squares’ dimensions indicate the significance level of the trend: large squares: p < 0.05, small squares otherwise.
Hydrology 10 00037 g004
Figure 5. Theil–Sen Slope and MK test for autumn season and its constituent months. Squares’ dimensions indicate the significance level of the trend: large squares: p < 0.05, small squares otherwise.
Hydrology 10 00037 g005
Figure 6. Theil–Sen Slope for winter season and its constituent months in mm per decade. Squares’ dimensions indicate the significance level of the trend: large squares: p < 0.05, small squares otherwise.
Hydrology 10 00037 g006
Figure 7. Theil–Sen estimator and MK test for spring season and its constituent months expressed in mm per decade. Squares’ dimensions indicate the 95% significance level of the trend: large squares: p < 0.05, small squares otherwise.
Hydrology 10 00037 g007
Figure 8. Theil–Sen estimator for summer season with months expressed in mm per decade. Squares’ dimensions indicate the significance level of the trend: large squares: p < 0.05, small squares otherwise.
Hydrology 10 00037 g008
Disclaimer/Publisher’s Note: The statements, opinions and data contained in all publications are solely those of the individual author(s) and contributor(s) and not of MDPI and/or the editor(s). MDPI and/or the editor(s) disclaim responsibility for any injury to people or property resulting from any ideas, methods, instructions or products referred to in the content.

