Article

Water Cycles and Geothermal Processes in a Volcanic Crater Lake

1
Arctic Research Center, Hokkaido University, Sapporo 001-0021, Japan
2
Center for Northeast Asian Studies, Tohoku University, Sendai 980-8576, Japan
3
Volcanology Research Department, Meteorological Research Institute, JMA, Sendai 983-0842, Japan
4
Hokkaido Research Organization, Sapporo 060-0819, Japan
5
Faculty of Policy Studies, Nanzan University, Nagoya 466-8673, Japan
*
Author to whom correspondence should be addressed.
Hydrology 2023, 10(3), 54; https://doi.org/10.3390/hydrology10030054
Submission received: 30 January 2023 / Revised: 15 February 2023 / Accepted: 18 February 2023 / Published: 22 February 2023

Abstract

:
Exploring how the hydrological and thermal conditions of a volcanic lake change in response to volcanic activity is important to identify the signs of a volcanic eruption. A water cycle system and a geothermal process in a crater lake, Okama, in the active Zao Volcano, Japan, were explored by estimating the hydrological and chemical budgets of the lake, and analyzing the time series of lake water temperature, respectively. In 2021, the lake level consistently increased by snowmelt plus rainfall in May–June, and then stayed nearly constant in the rainfall season of July–September. The hydrological budget estimated during the increasing lake level indicated that the net groundwater inflow is at any time positive. This suggests that the groundwater inflow to the lake is controlled by the water percolation into volcanic debris from the melting of snow that remained in the catchment. Solving the simultaneous equation from the hydrological and chemical budgets evaluated the groundwater inflow, Gin, at 0.012–0.040 m3/s, and the groundwater outflow, Gout, at 0.012–0.027 m3/s in May–September 2021. By adding the 2020 values of Gin and Gout evaluated at the relatively high lake level, it was found that Gin and Gout exhibit highly negative and positive correlations (R2 = 0.661 and 0.848; p < 0.01) with the lake level, respectively. In the completely ice-covered season of 15 December 2021–28 February 2022, the lake water temperature increased between the bottom and 15 m above the bottom at the deepest point, which reflects the geothermal heat input at the bottom. The heat storage change during the increasing water temperature was evaluated at a range of −0.4–5.5 W/m2 as the 10-day moving average heat flux. By accumulating the daily heat storage change for the calculated period, the water temperature averaged over the heated layer increased from 1.08 to 1.56 °C. The small temperature increase reflects a stagnant state of volcanic activity in the Zao Volcano. The present study could be useful to investigate how an active volcano responds to water percolation and geothermal heat.

1. Introduction

When a volcano erupts, the eruption type is greatly affected by the ascent path of magma. This is because the amount of magma-contacted groundwater spatially changes, depending on the pathway of magma. In general, a volcano is permeable, and thus the infiltration and percolation of rainwater or snowmelt water easily occur at any time; though, in some cases, part of the water could be stored in the specified permeable layer producing groundwater flow [1]. For example, the eruption of Usu Volcano, Japan, in August 1977 occurred on the summit area as a magmatic eruption and ejected a large amount of pyroclastic materials [2]. Such a non-phreatomagmatic eruption suggests that the amount of stored groundwater was relatively small for the large magma supply. In fact, Usu Volcano has no upper groundwater storage because of the high permeability of almost the whole volcano. For this reason, hydrothermal reservoirs exist only below the base of Usu Volcano, which is the source of Lake Toya’s hot spring water. The hydrothermal reservoirs are based on the storage of the deeply percolated water contacted with the magmatic heat [3]. The 2000 Usu eruption occurred on the flank in March–April [4]. The phreatomagmatic eruption was then dominant, because the eruption center was close to Lake Toya in the north, and thus was probably rich in groundwater [5]. Thus, if a volcano has a crater or caldera lake on the top or side of the mountain, irrespective of the high or low volcanic activity, the hydrological, chemical, and thermal budgets of the lake are directly connected to the spatial distribution and movement of groundwater or hydrothermal reservoirs [6]. By estimating the geothermal heat fluxes and acquiring their temporal variations in a hydrothermal pond, Okuno-yu, and a neighboring caldera lake, Lake Kuttara, Japan, Chikita et al. [6] revealed that there exists a geothermal linkage between the pond and the lake by the connected deeper hydrothermal reservoirs.
Jasim et al. [1] emphasized the necessity of detailed monitoring for hydrothermal and hydrological behaviors in active volcanoes by reviewing the dynamic relations between the groundwater flow system and volcanic activity. From this viewpoint, Chikita et al. [7] estimated the hydrological and chemical budgets of Okama Crater Lake in the active Zao Volcano, Japan, and pointed out that, as a feature of the groundwater cycle in the lake, the groundwater outflow is larger than the groundwater inflow. Then, the lake level consistently decreased in the periods of rainfalls at less than ca. 30 mm/day. Hence, the lake level was judged to continuously decrease in the completely ice-covered period, because of neither rainwater supply nor evaporation at the water surface. Meanwhile, the small geothermal heat input at 2.5–2.9 W/m2 was observed in the completely ice-covered season of Okama, reflecting the relatively stagnant state in the activity of the Zao Volcano.
Geothermal heat flux has been observed in lakes hydrologically connected to active volcanos (e.g., Lake Taupo [8] and Lake Rotomahana [9] in New Zealand, and the Crater Lake of Copahue Volcano in Chile-Argentina [10]). By using the bathymetry and geochemical data in the volcanic Lake Linau, Indonesia, Brehme et al. [11] identified drilling sites most suitable for the development of geothermal heat. However, there are few studies on long-term variations in geothermal heat flux in lakes, observed as an indicator for current and future levels of volcanic activity.
At present, Okama Crater Lake remains relatively stagnant in volcanic activity but exhibits a high acidity of pH = 3.1–3.3 in the rainfall season and an increasing water temperature of the nearly whole layer in the completely ice-covered season [7]. This suggests that there exists a supply of volcanic materials such as sulfur compounds and geothermal heat input from the underground in the catchment. Hence, it is important to explore how a water cycle system in the lake is related to the material supply and the geothermal input as hydrogeological features of an active volcano. In this study, by adding the 2009–2010 data from Chikita et al. [7] to the new data for 2021–2022, the water cycle system and geothermal process in the lake are clarified. Here, hydrological and chemical budgets are estimated by using the 2021 data, and a temporal variation of the geothermal heat flux is acquired by using the 2021–2022 data.

2. Study Area

The Zao Volcano has maintained high volcanic activity for about a million years. In 1230, a crater moved to its present Okama location and stored water as a crater lake in 1625–1694 (Figure 1) [12]. In 1918, the lake water boiled, and in August 1923, presented a white color due to floating amorphous sulfur from H2S or SO2 gas spewing in the lake [13]. The activity level of the Zao Volcano increased from 2013 to 2019 but returned to the normal level in 2020 [14].
The Okama water surface is at an altitude of ca. 1550 m above sea level (asl) with a maximum depth of ca. 25 m and a lake area of 8.208 × 10⁴ m2 (Figure 1b). The drainage area including the lake water area is 6.312 × 10⁵ m2 (Figure 1a). The headwater region of the Nigori River is adjacent to the Okama drainage basin, and on a valley side at 81 m downstream of site N, spring water is seen (Figure 1a). The spring water is regarded to be water leaking from the Okama [15].
The Okama receives the inflow of three streams, the Goshiki Stream and two other, smaller streams. The Goshiki Stream is perennial, but the other streams are ephemeral, where water flows only in rainy periods or in the snowmelt season (Figure 1b). After rainfall in May and September 2021, spring water flow occurred from the outcropping silty layer near site S, and flowed into the lake at site S [7]. In 2021, the lake was iron-rich with a pH of 3.1–3.3 and a maximum depth of 23.4 m. In 2020–2021, the lake level changed annually with a range of ca. 5 m as shown in this study. Hence, it is important to explore the relationship between the lake level (or lake volume) and the scale of groundwater inflow and outflow.

3. Methods

3.1. Hydrological Budget Estimate for Okama

In order to explore the relationship between the lake level and the scale of the groundwater cycle in the Okama, the groundwater inflow and outflow were evaluated by estimating the hydrological and chemical budgets of the lake. In this case, groundwater simulation by GMS, MODFLOW, etc. is difficult, because the lake catchment is too small, topographically accompanied by the steep slopes of the crater, and the underground structure is very complicated with a massive outcrop (the silt layer near the site S) (Figure 1a). According to the method of Chikita et al. [7], the hydrological budget equation for a closed Okama with no outflowing river is given in the following:
ΔV/Δt = (P − E)A0 + Rin + Gin − Gout
where V is the water volume (m3), A0 is the water surface area (m2), P is the precipitation (m/s) to the lake surface, E is the evaporation (m/s) at the lake surface, Rin is the river inflow (m3/s), Gin and Gout are the groundwater inflow and outflow (m3/s), respectively, and t is time. The left side of Equation (1) indicates the water volume change per budget period Δt. The evaporation E was calculated by using the following bulk transfer method:
  Q E = λ ρ a β p · a E u z · e z e 0
E = Q E / λ ρ w
where QE is the heat flux (W/m2) by evaporation, λ is the latent heat (J/kg) for evaporation, β is the ratio of water vapor density to dry air density (=0.622), aE is the dimensionless bulk transfer coefficient for latent heat, uz is the wind speed (m/s) at z (m) above the lake surface, p is air pressure (Pa) at z, ez is the vapor pressure (Pa) at z, and e0 is the saturated vapor pressure (Pa) at lake surface temperature Ts (K), and ρa and ρw are the air and water densities (kg/m3), respectively. Here, the height z in Equation (2) was given at 4.0 m as the heights of the wind speed sensor, the air temperature and relative humidity logger, and the air pressure logger above the lake water surface. The dimensionless bulk transfer coefficient, aE, for latent heat was given at a constant value of 0.0013 for z = 4.0 m [16]. Under conditions of no rainfall, Equation (1) yields:
G = Gin − Gout = ΔV/Δt + EA0 − Rin
Here, the net groundwater inflow G is provided by the calculation of water volume change and total evaporation EA0 over the lake surface with surface water area A0 changed following the lake level (Figure 1b) and the measurement of river inflow. The evaporation E was calculated by applying the hydrometeorological data at site M to Equations (2) and (3).

3.2. Chemical Budget Estimate for Okama

The chemical budget equation for the closed lake is as follows:
Δ(CLV)/Δt = CRinRin + CPPA0 + CGinGin − CLGout − S
where CL is the ionic concentration (g/L) averaged over the lake volume, CRin, CP, and CGin are the ionic concentrations (g/L) of inflowing rivers, precipitation, and inflowing groundwater, respectively, and S is the net depositional flux (kg/s) related to the chemical reaction of the ion. The volume-averaged ionic concentration, CL, of the lake is given as that of groundwater outflow, since it is unknown at which depth or in which area the lake water leaks out as groundwater.
The magnitude of S is inferred by considering the lake water chemistry based on the ionic analysis or by setting a sediment trap at the bottom of the lake. If the S value is positive, the deposit could be identified by chemical and mineralogical analyses for trapped sediment at the bottom of the lake. If a non-rainfall period is adopted as a budget period, the second term on the right side of Equation (5) is zero. Here, as an ion specifying the ionic concentration in Equation (5), the ion not influenced by the chemical reaction was selected.

3.3. Evaluation of Groundwater Inflow and Outflow for Okama

The simultaneous equations for Equations (4) and (5) from the hydrological budget equation lead to:
Gout = (CGin G − B)/(CL − CGin)
Gin = Gout + G
where B = Δ(CLV)/Δt − CRinRin + S. The B values are given by incorporating the chemistry of the stream and lake waters into the hydrological terms.
The G values obtained by Equation (4) can be verified by the increasing or decreasing rate of the lake level observed in the non-rainfall periods since EA0 and Rin in Equation (4) are then given. However, the verification of the Gout and Gin values obtained by Equations (6) and (7) is difficult, since the groundwater pathways on or around the lake basin are unknown. Here, the validity of the Gout and Gin values is judged by exploring the relations between the lake volume and the Gin or Gout values. The parameters in Equations (1)–(3) and (5) are listed in Table A1 in Appendix A.

3.4. Field Observations

In order to identify a temporal change in the water volume of the Okama on the left side of Equation (1), the lake level was measured hourly in the form of water depth measurements from the two pressure loggers (type HOBO U20, Onset Computer Corp., Bourne, MA, USA) at site L (for water pressure) and site M (for air pressure) (Figure 1a), and then the lake volume was calculated by using the bathymetric map in Figure 1b [7]. The pressure logger at site L was fixed throughout the year.
In order to calculate the first term on the right side of Equation (1) and the evaporation E in Equation (3), a weather station (URL https://www.onsetcomp.com/products/kits/u30-nrc-sys-c/ (accessed on 14 January 2023)) was set at site M to record solar radiation, air pressure, air temperature, relative humidity, wind velocity, and rainfall at 1 h intervals. Before the snowfall, which started around early October, the weather station at site M was removed, because the snow accumulation becomes more than 1 m deep in winter.
At the same time, at the Daikokuten observation hut (altitude, 1446 m asl), 1.55 km southeast of site MD, air temperature, relative humidity, and air pressure were measured hourly throughout the year [7]. Thereby, air temperature and air pressure at the Okama after the removal of the weather station at site M were inferred by using the high correlation between site M and the observation hut for the hourly air temperature (R2 = 0.879, p < 0.01) and hourly air pressure (R2 = 0.967, p < 0.01), observed in September 2021. The September data were adopted as representative data in the cooling season of the mountainous region.
In order to evaluate lake levels year to year, three benchmarks were set near site M, and the leveling among the three benchmarks and the lake surface was carried out in every field survey of the Okama in 2020–2022. By comparing the results of the leveling with the water depth at site L, the data of hourly lake level were acquired in a period of 31 July 2020–31 May 2022, including two completely ice-covered seasons of December 2020–April 2021 and December 2021–April 2022. Then, the water depth at site L on 17 May 2022 was adopted as the lowest lake level.
The discharge of the three inflowing streams (Figure 1b) was measured on non-rainfall days to evaluate river inflow Rin in Equation (1). The stream water was also manually sampled to analyze the inorganic chemistry, related to CRin in Equation (5). EC25 (electric conductivity at 25 °C) and the pH of streaming water were then measured by a thermo-couple thermometer (Type TX1001, YOKOGAWA, Co. Ltd., Musashino, Japan) and a portable pH & EC meter (Type D-74, HORIBA, Co. Ltd., Kyoto, Japan).
For comparison, Nigori River water and the surface flow water springing from the silty layer were sampled at site N and site S, respectively (Figure 1a), of which the pH and EC25 were similarly measured and the chemistry was analyzed. The volcanic silty layer outcropping near site S and the bottom sediment at site MD were sampled for grain size analysis and mineralogical identification. The bottom sediment was sampled from onboard a boat by an Ekman–Burge grab sampler [7]. The thickness of the sampled sediment was ca. 10 cm.
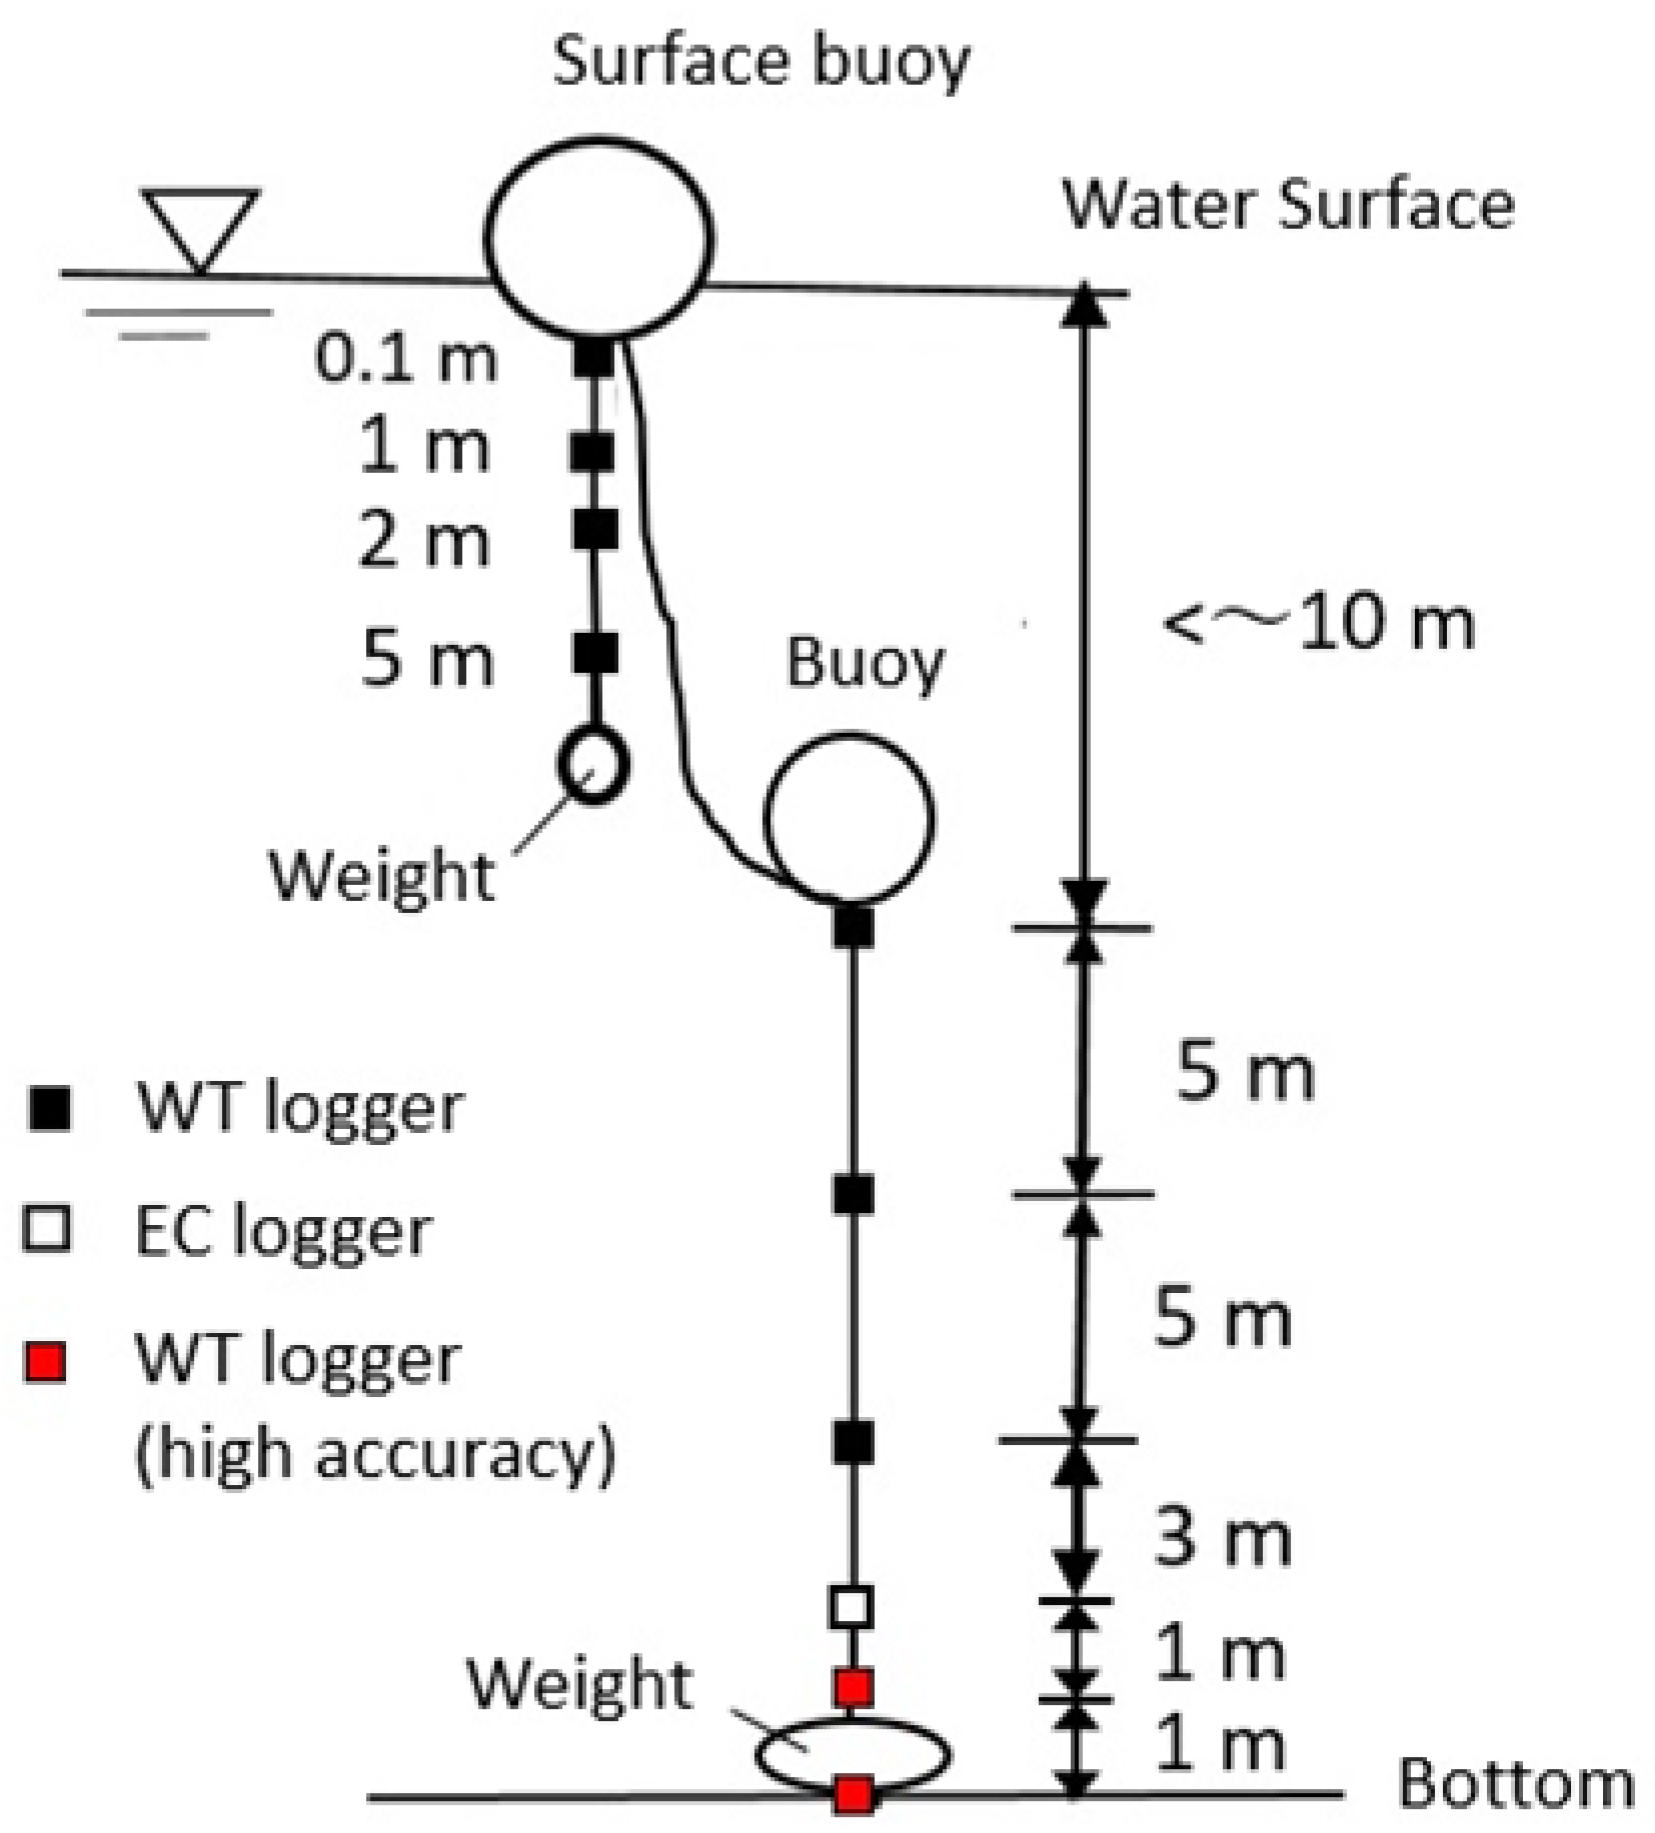
In order to evaluate the geothermal heat flux in the Okama, the water temperature was measured every hour at ten depths of site MD by using a mooring system of temperature loggers (type TidBit v2 with accuracy, ±0.2 °C, Onset Computer Corp., Bourne, MA, USA; URL https://www.onsetcomp.com/products/data-loggers/utbi-001/ (accessed on 14 January 2023) and type DEFI2-T with an accuracy of ±0.01 °C, JFE-Advantech, Co., Ltd., Nishinomiya, Japan; URL https://www.jfe-advantech.co.jp/eng/products/ocean-defi2.html (accessed on 14 January 2023)) (Figure 1a and Figure 2) [7]. Here, the two DEFI2-T loggers of high accuracy were fixed at the bottom and 1m above the bottom (Figure 2). An electric conductivity (EC) logger for freshwater (type HOBO U24-001 with accuracies of ±0.5 mS/m and ±0.1 °C for electric conductivity and temperature, respectively, Onset Computer Inc.) was also set at 2 m above the lake bottom. Thereby, a temporal change of lake water chemistry related to the left side of Equation (5) was acquired.
Considering the low lake level in winter, the relatively long distance between the surface buoy and the underwater buoy was taken in the summer of 2021 when the mooring was reset (Figure 2). This is because, in the snowfall season from early October, the surface buoy gradually approaches the lower buoy with decreasing lake level, and thus, if the lake level became lower than the underwater buoy, it is difficult to hold the heights above the bottom for the loggers below the lower buoy [7].
Meanwhile, by lowering a profiler from a boat (type ASTD102 with accuracies of ±0.1 mS/m for EC, ±0.01 °C for water temperature, ±0.4 mg/L for dissolved oxygen (DO), ±1 %FS for chlorophyll, and ±0.3 FTU for water turbidity, JFE-Advantech, Co., Ltd., Nishinomiya, Japan; URL https://www.jfe-advantech.co.jp/products/ocean-rinko.html (accessed on 14 January 2023)), water temperature, EC25, DO, chlorophyll, and water turbidity were vertically measured at 0.1 m depth intervals on six days of 18 May, 5 July, 5 August, 28 September, and 29 September of 2021, and 17 May 2022. The water temperature and EC from the loggers were calibrated by those from the profiler with relatively high accuracies.
Lake water at site MD was sampled from a boat by a Van–Dorn sampler (URL: https://www.kc-denmark.dk/products/water-sampler/van-dorn-water-sampler.aspx (accessed on 29 January 2023)). The water temperature, EC25, and pH of lake water were then measured by a thermo-couple thermometer (Type TX1001, YOKOGAWA, Co. Ltd., Musashino, Japan), a compact EC meter (Type LAQUAtwin EC-11, HORIBA, Co. Ltd., Kyoto, Japan), and a compact pH meter (Type LAQUAtwin pH-11B, HORIBA, Co. Ltd. (URL https://www.horiba.com/en_en/water-quality/pocket-meters/ (accessed on 29 January 2023)).

3.5. Laboratory Experiments

Concentrations of major ions (K+, Na+, Mg2+, Ca2+, Cl, SO42−) for the sampled water were measured by the ion chromatography (type Dionex ICS-1600 (cation) and ICS-2100 (anion), Thermo Fisher Scientific Inc., Tokyo, Japan: URL https://www.thermofisher.com/ (accessed on 29 January 2023)). For the samples at a pH of 4.4 or less, the sulfuric acid titration for the bicarbonate ion (HCO3) concentration was omitted because of almost zero HCO3 concentration.
Grain size analysis and mineralogical identification were performed for the outcropping silty layer near site S and the bottom sediment at site MD. The grain size distribution was obtained by sieving for grains of 44 μm or more and using the gravitational settling method with a centrifuge for grains of less than 44 μm [17,18]. The mineralogy of the silty layer was identified by the X-ray diffraction method after the sample from the silty layer was dried and ground in a mortar [19].

4. Results

4.1. Water Chemistry

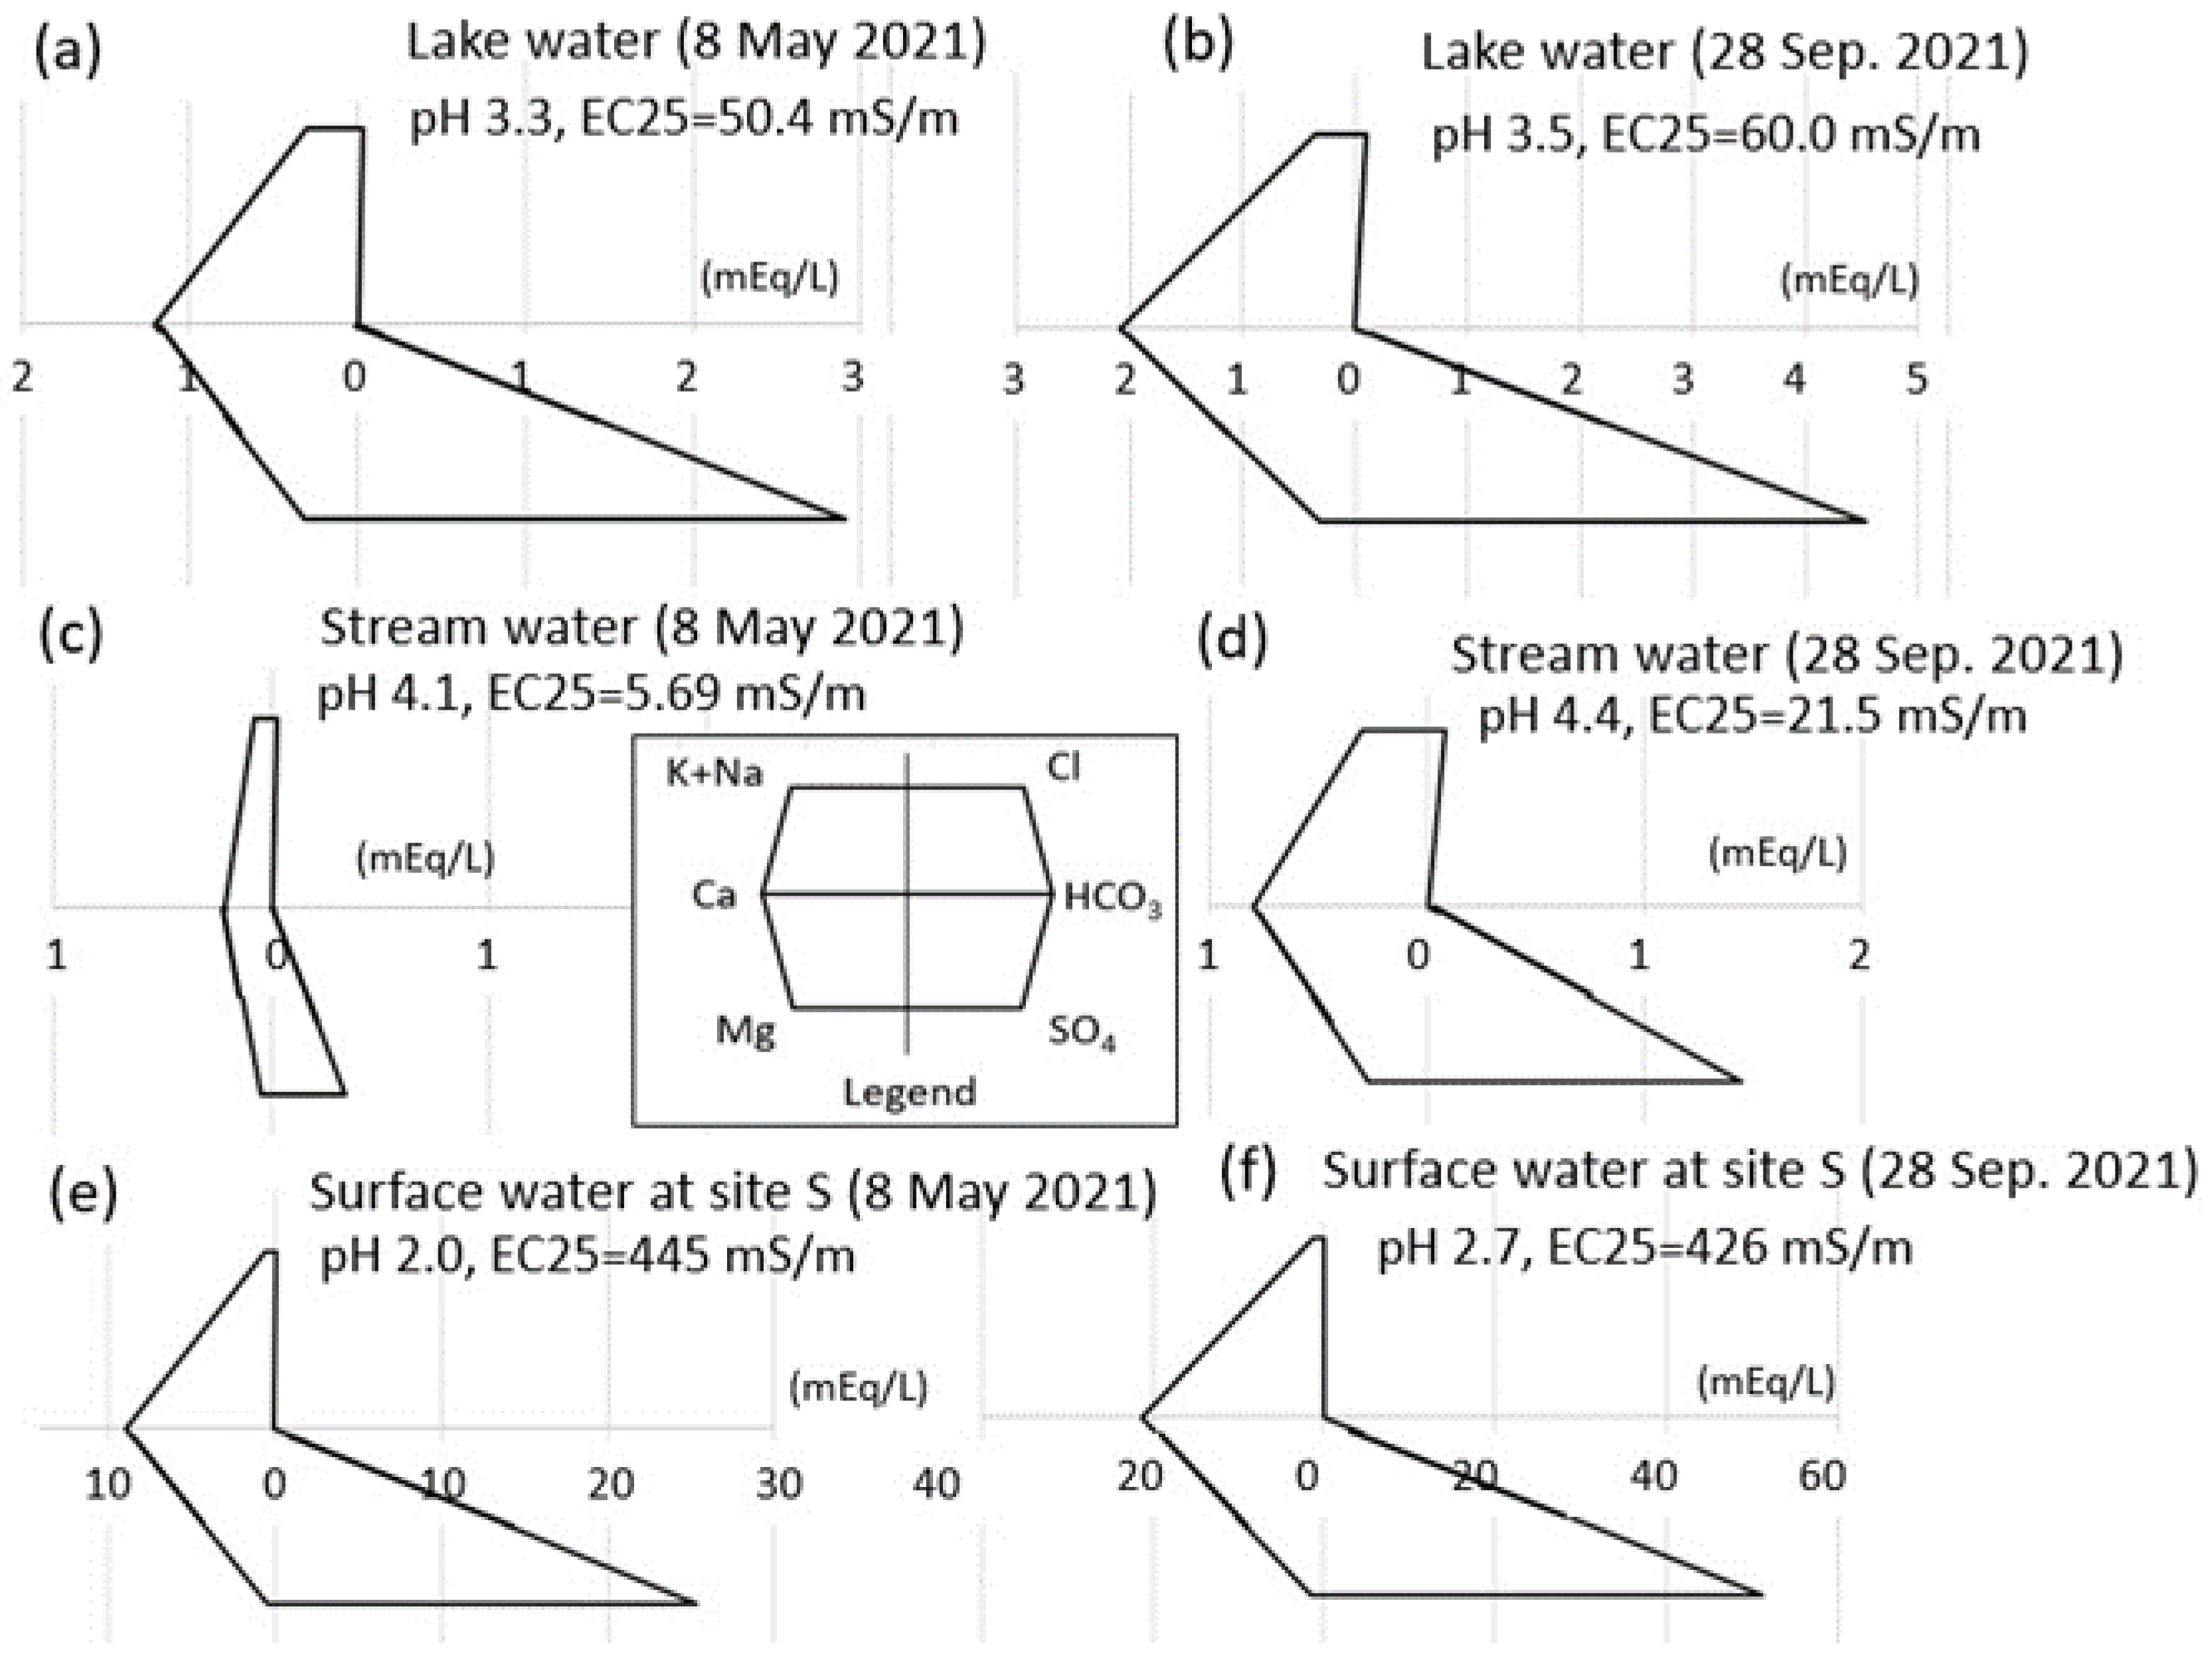
Figure 3 shows stiff diagrams of Na+, K+, Ca2+, Mg2+, Cl, HCO3 and SO42− concentrations (mEq/L), and pH and EC25 (mS/m) values for lake water, stream water, and surface water at site S. These water samples were taken on non-rainfall days of (a), (c), and (e) 8 May 2021, and (b), (d), and (f) 28 September 2021. The concentration values (mEq/L) in Figure 3 are listed in Table A2 in Appendix B.
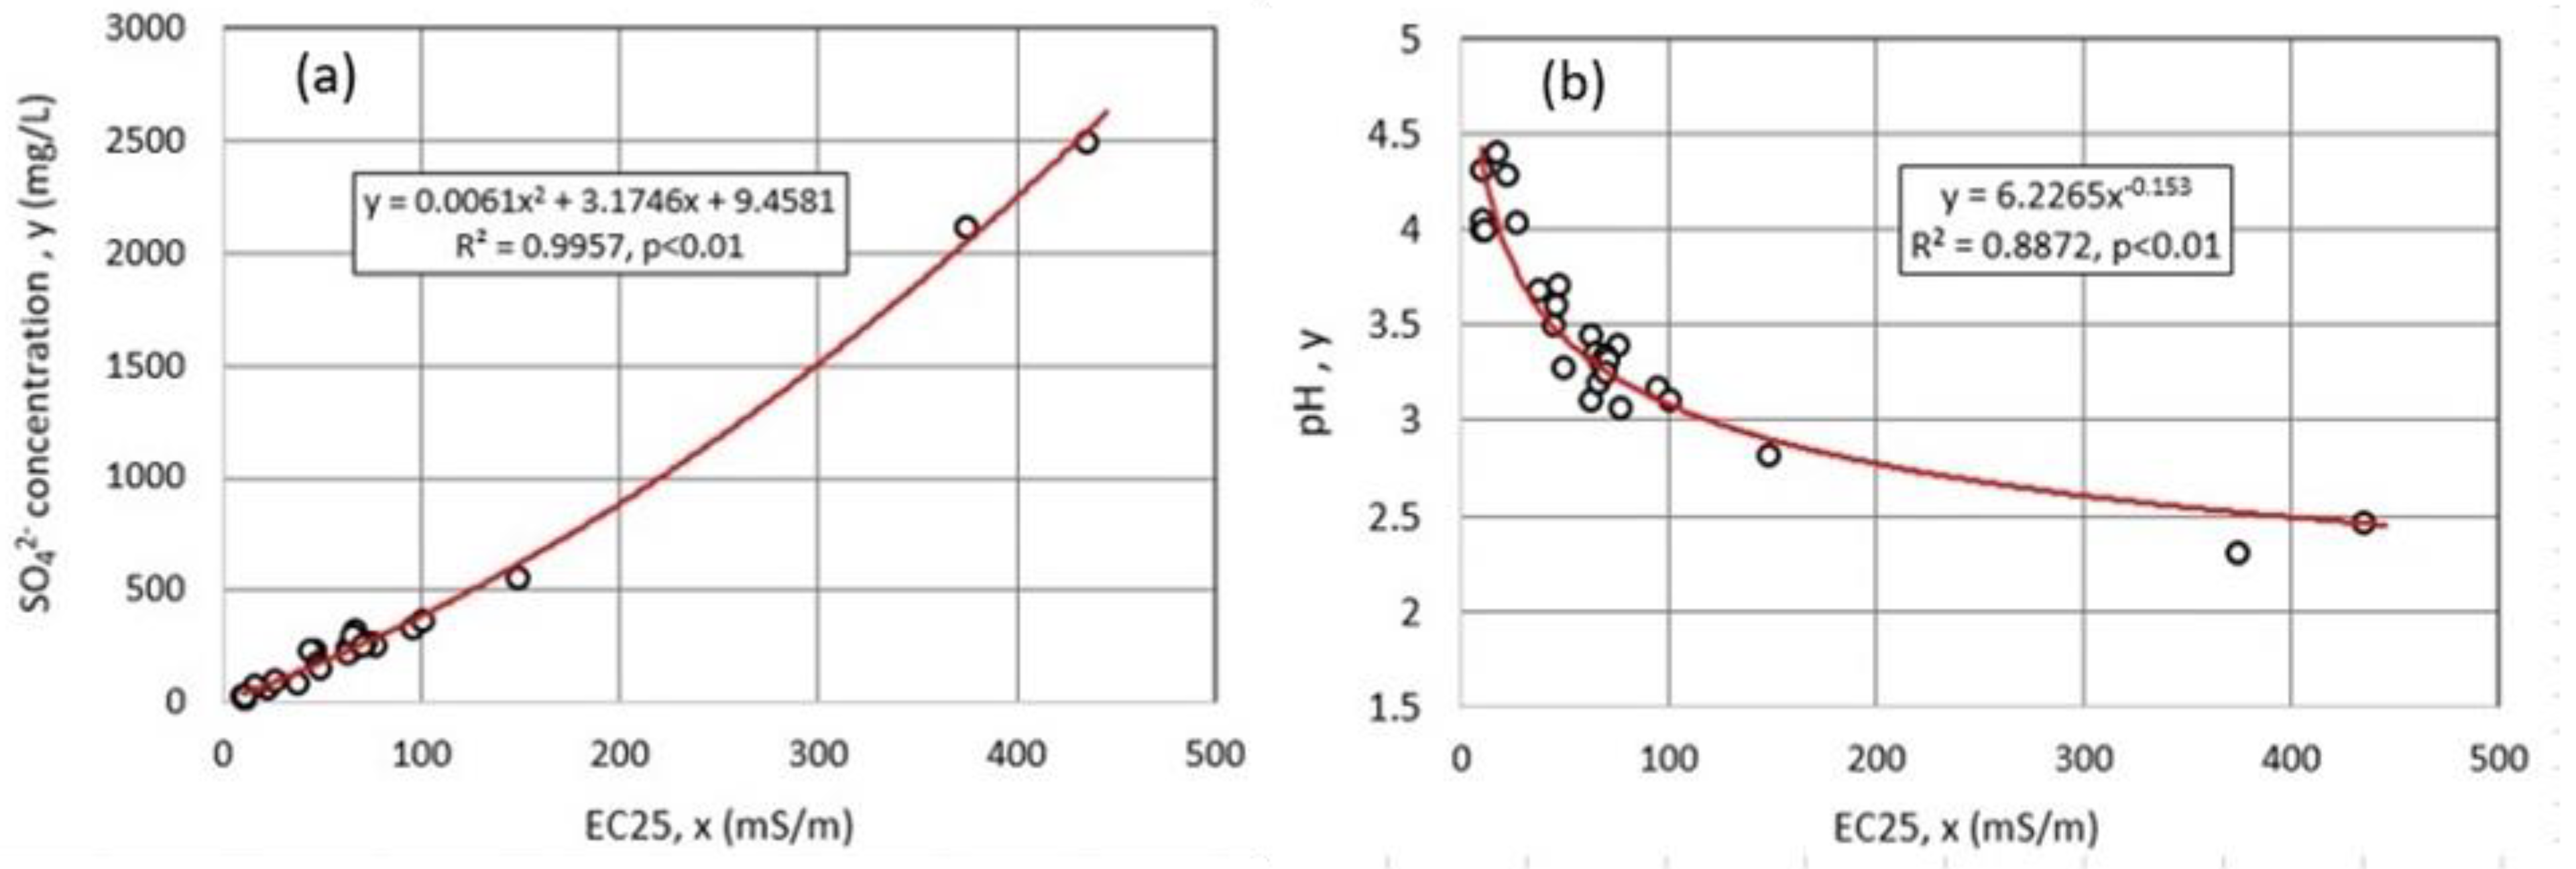
The waters commonly exhibit very high Ca2+ and SO42− concentrations with high acidity of pH = 3.2–4.4, though the Goshiki stream water (Figure 3c,d) into the Okama has relatively low acidity (pH = 4.1 and 4.4, respectively) with a small error (2.0% and 5.3%, respectively) in the ionic balance. Here, the error in the ionic balance is defined by 100·(total cations-total anions)/(total cations + total anions) in mEq/L [20]. The EC25 values consistently increased and the pH values significantly decreased as the Ca2+ and/or SO42− concentration increased (Figure 4) [7]. The sampling day of 8 May 2021 is in the snowmelt season with snow covering part of the catchment. The high acidity and low EC25 for the 8 May water sources (Figure 3a,c), compared with the pH and EC25 of September 2021 water sources, were likely produced by the underground percolation of snowmelt water with relatively high acidity (probably, pH of less than 5) and low EC25 [21].
The spring water from the volcanic silty layer near site S (Figure 1) exhibits relatively high acidity and EC as whitish turbid water (Figure 3e,f). Both the acidity and EC25 of the surface water stayed high in May and September. This suggests that the silty layer produced the highly acid and EC25 water. The high acidity is reflected by the large error (43.8% and 36.0% for the May and Sep. samples, respectively) in the ionic balance, indicating the large amount of SO42− compared with Ca2+. The relatively large error in the ionic balance was also seen at 23.4% and 25.1%, respectively, for the Okama water (Figure 3a,b). Meanwhile, as the other cations, Al3+ and Fe2+, were significantly rich, which made the ionic balance error small at ca. 7%, the two metal ions were quantified only for a few water samples. The chemistry of the lake water is affected by water inflow accompanied by the high SO42− solution. Meanwhile, the Nigori River water at site N (Figure 1a) sampled on 28 September 2021 was similarly SO42− rich, indicating a pH of 3.1 and EC25 of 148 mS/m. Thus, in or around the Okama catchment, a chemical mechanism to produce more sulfate solution probably exists, in addition to the solution of the CaSO4 compounds such as gypsum or hemihydrate gypsum in the underground or on the silty layers outcropping near site S [22].
Figure 4 shows the relationships between EC25 and (a) SO42− concentration or (b) pH for the sampled lake, stream, and spring waters. By including the chemistry of the surface flow water at site S, the measuring range was extended, compared with the relation by Chikita et al. [7]. By using the regression curves with the high correlations of R2 = 0.996 and 0.887. the EC25 values of the EC logger or the profiler were converted to SO42− concentration and pH.

4.2. Mineralogy and Grain Size of the Silty Layer

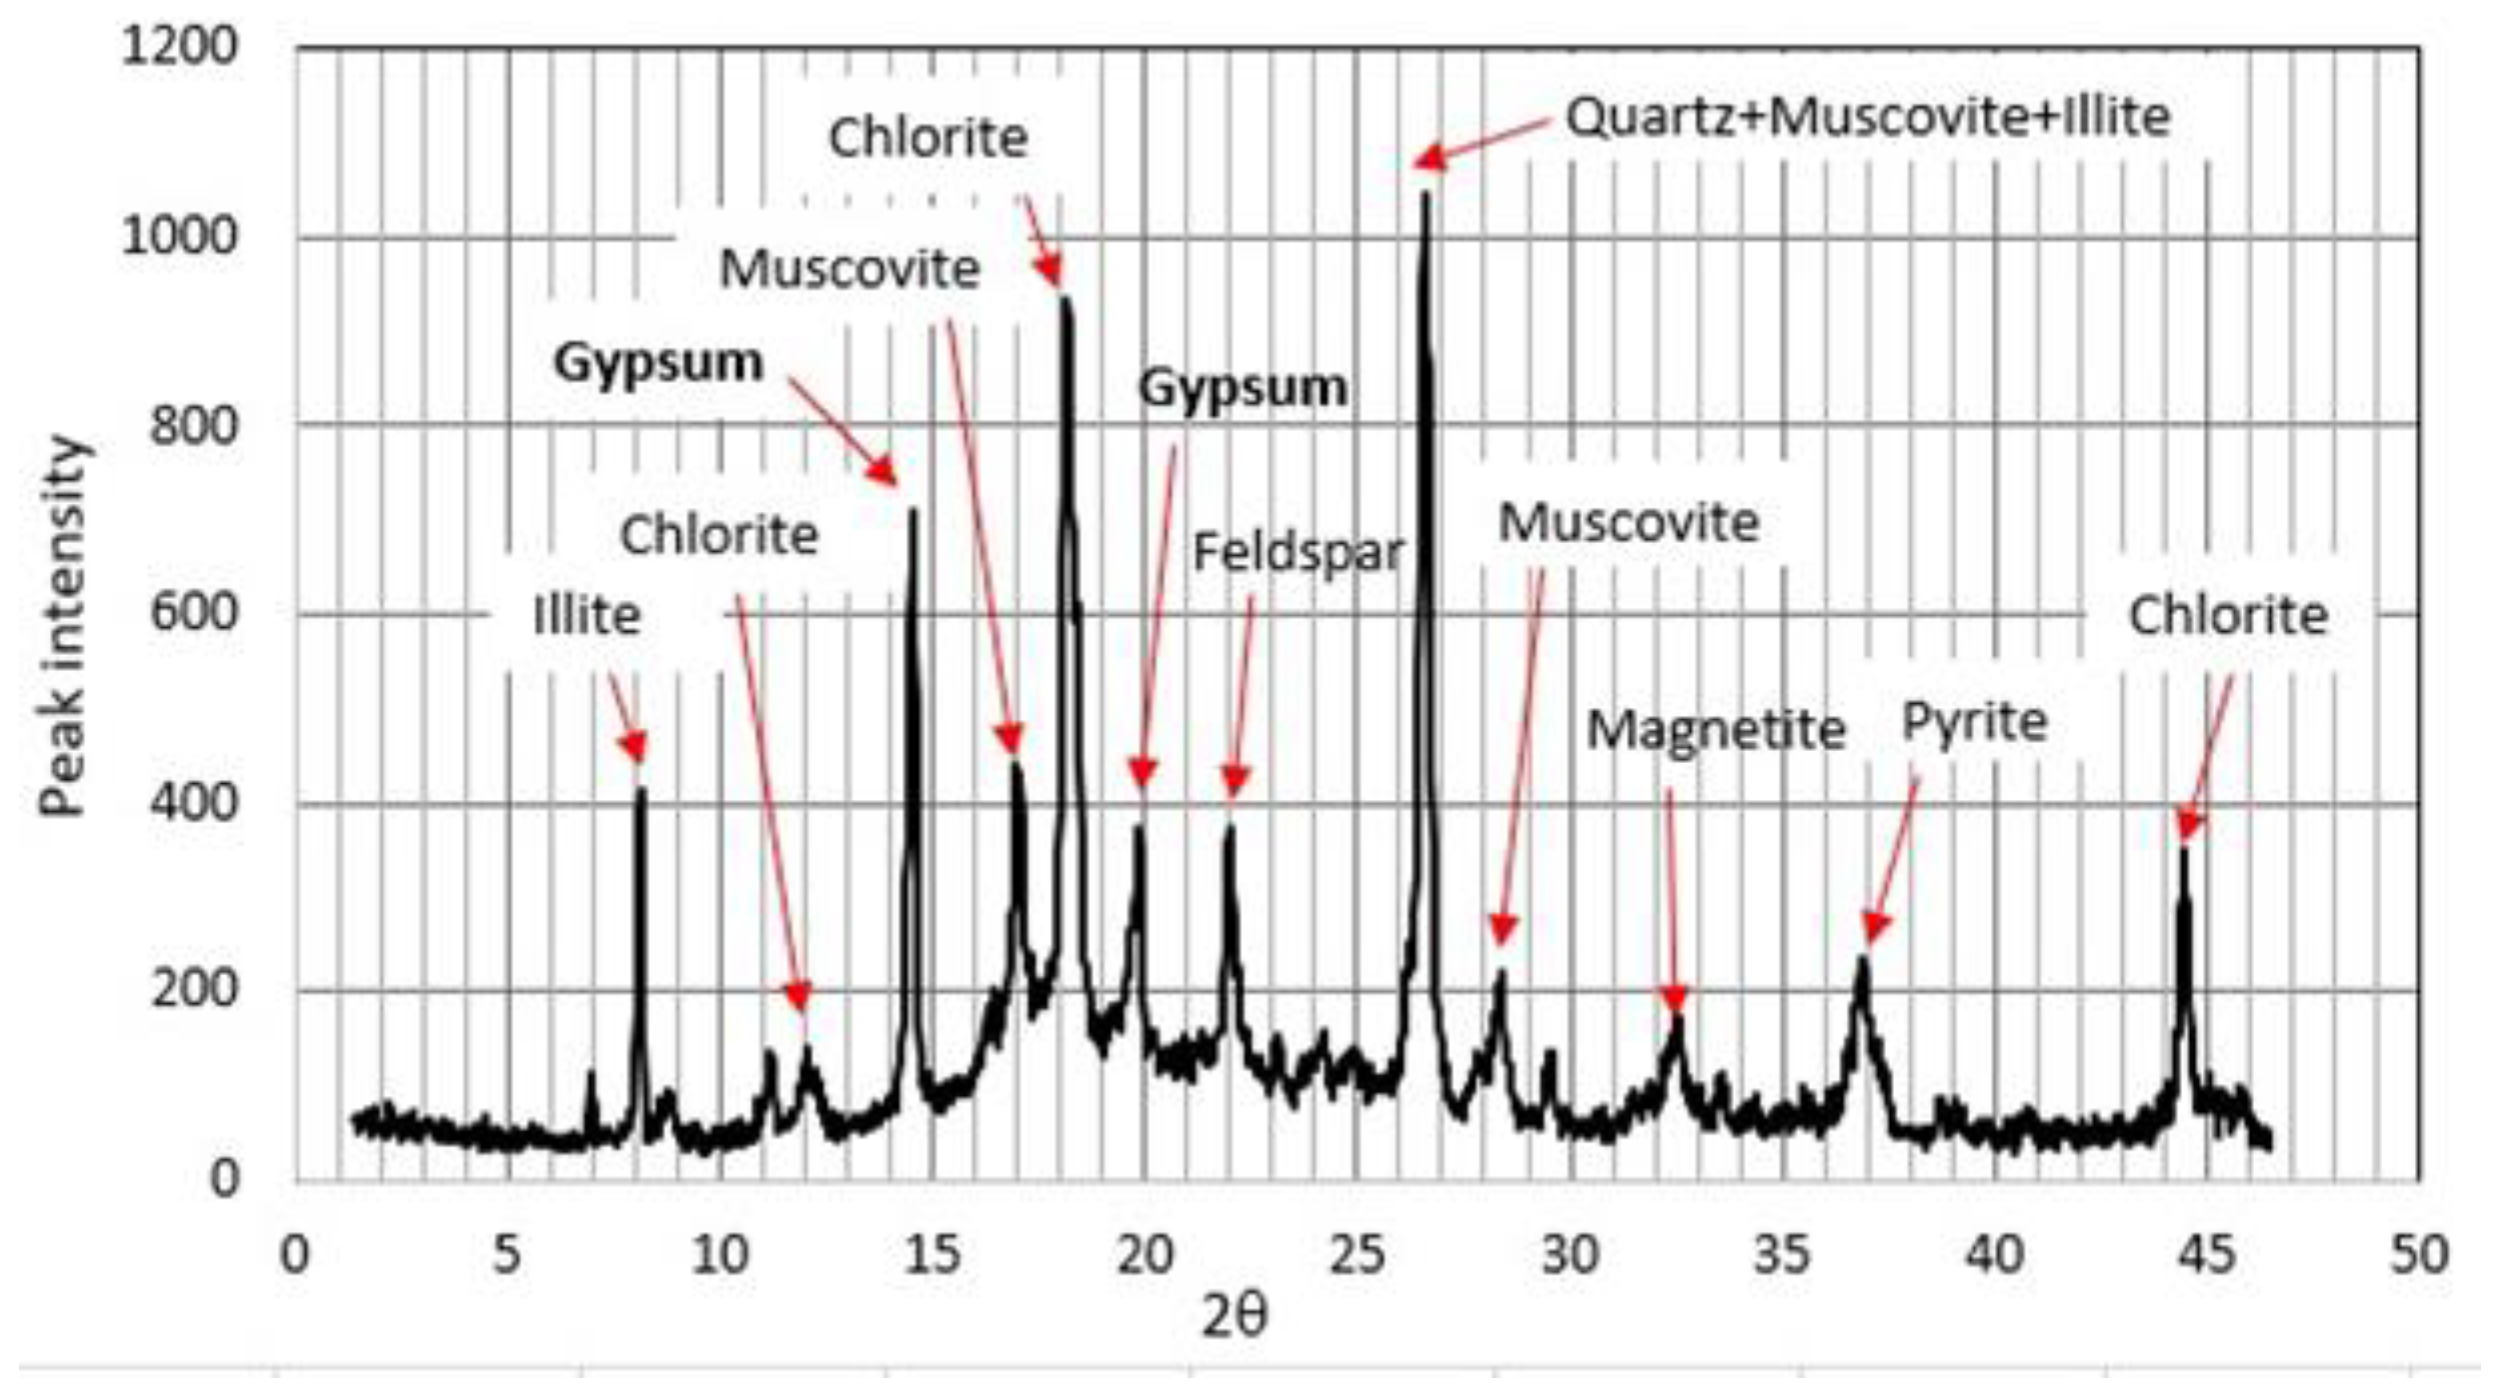
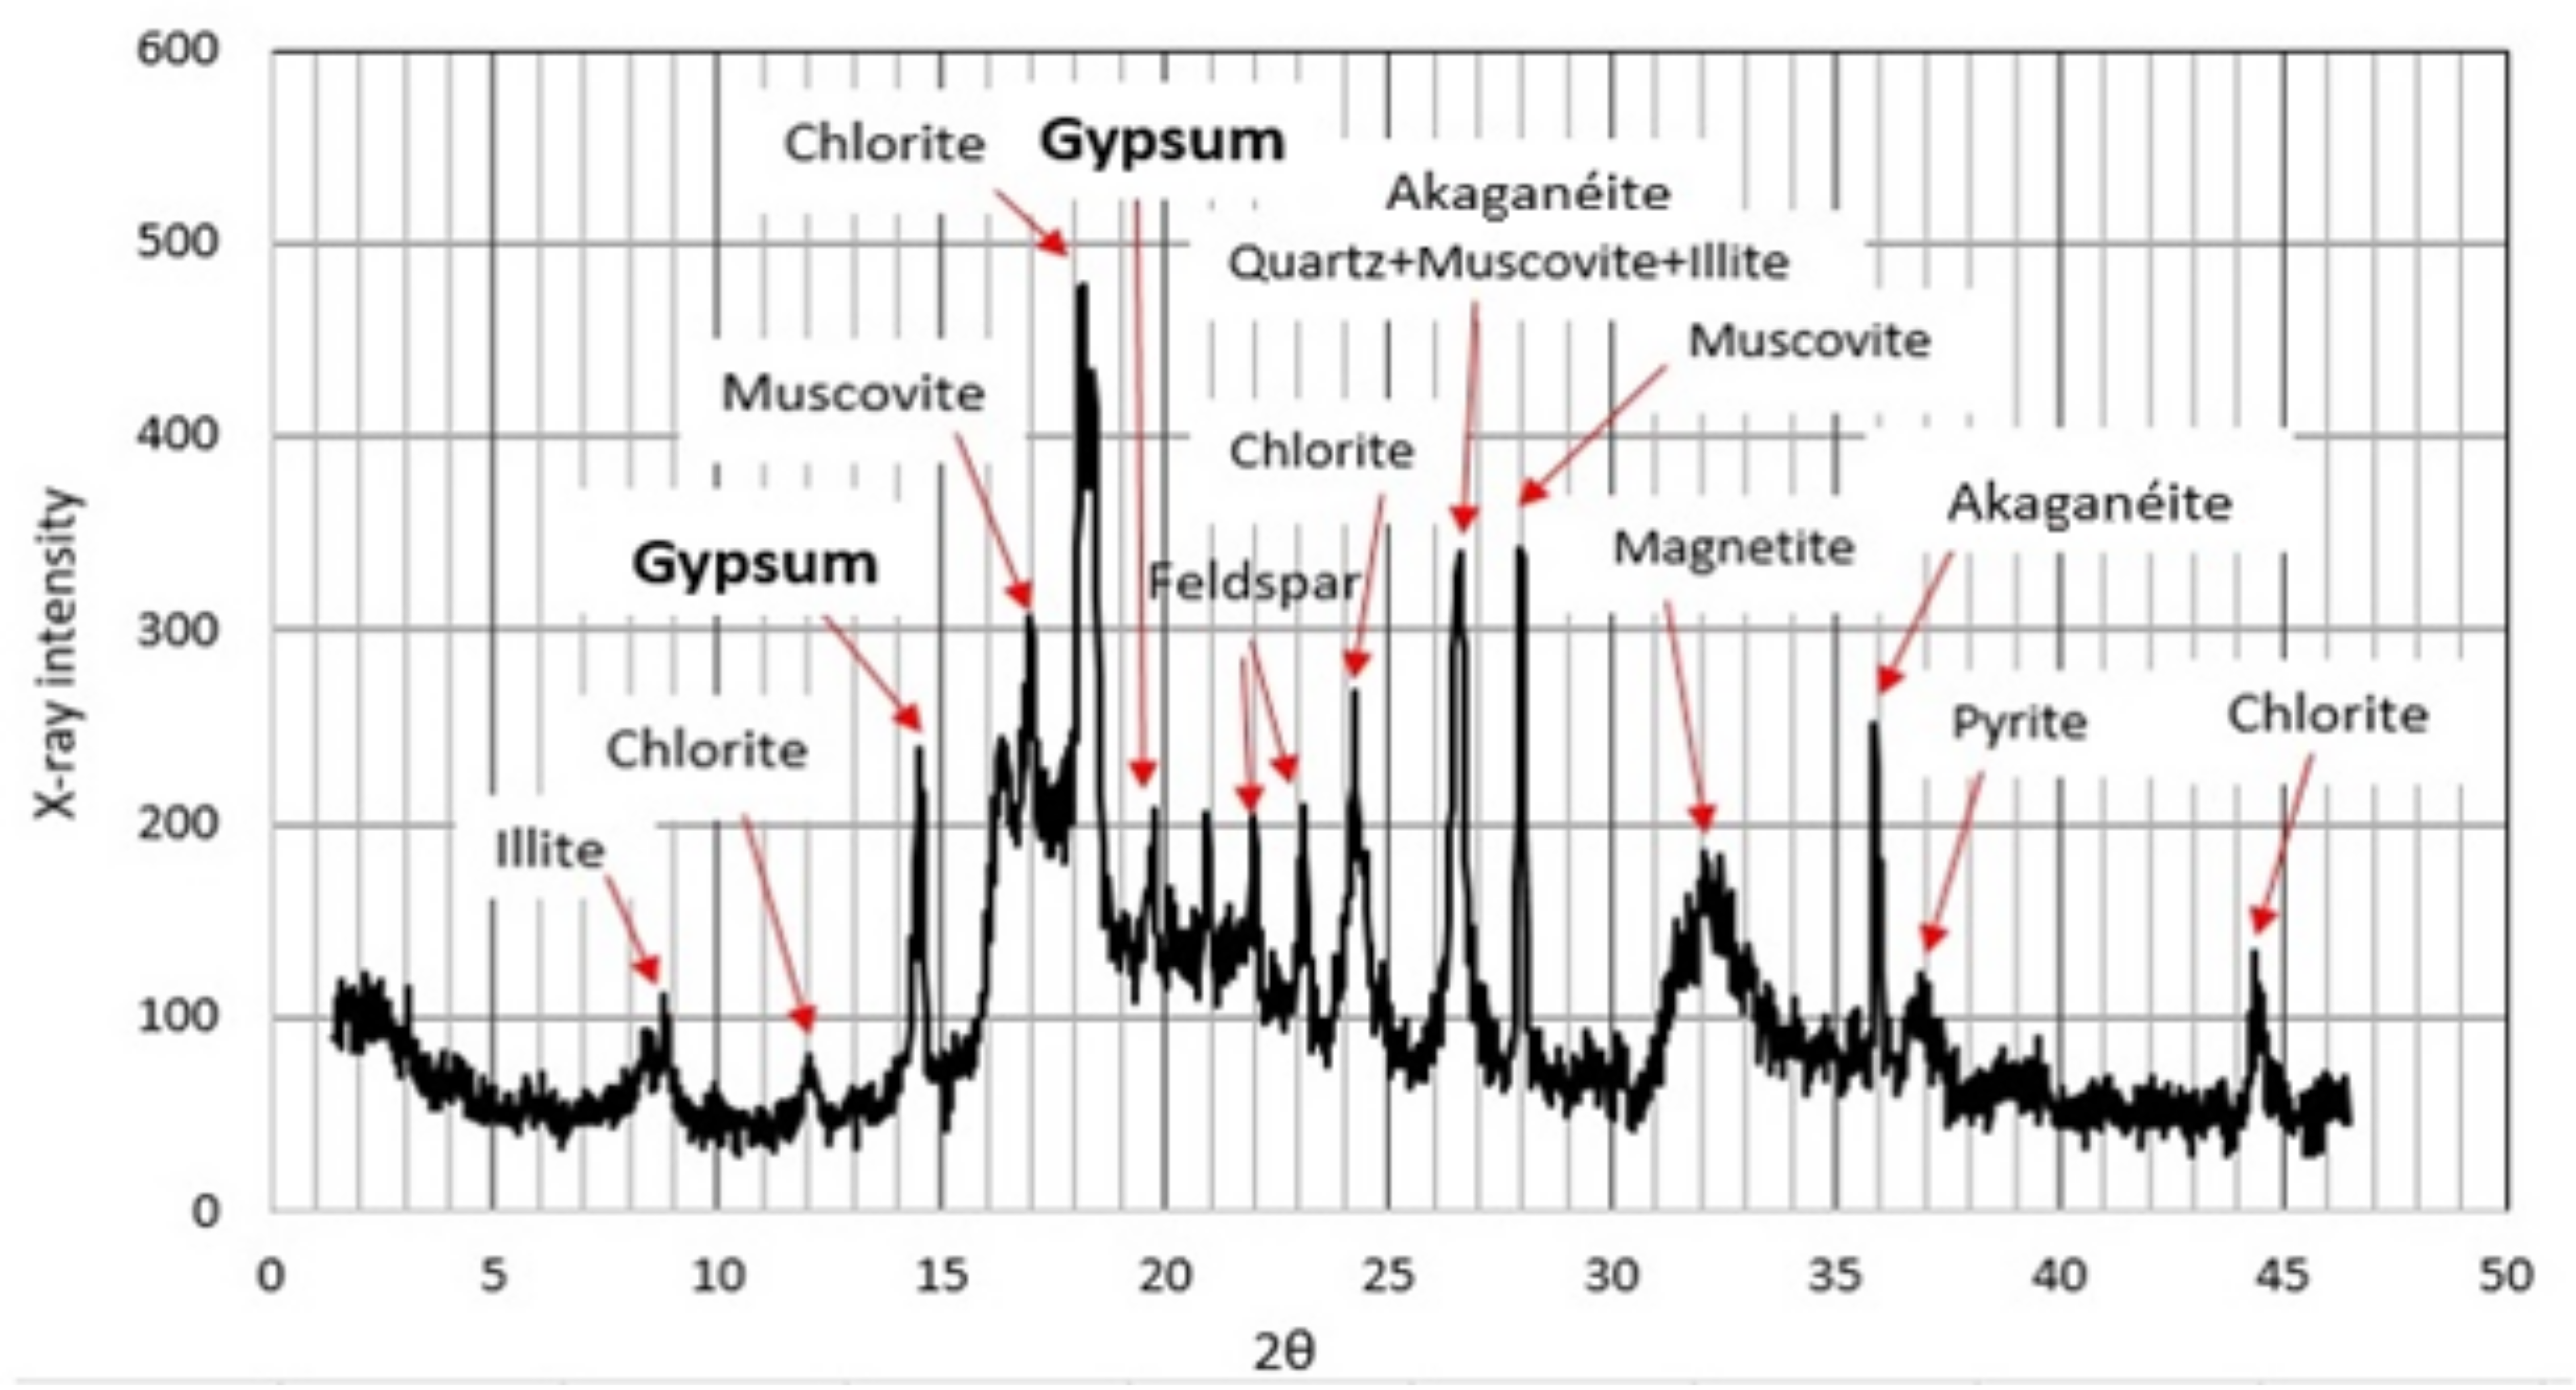
Figure 5 shows an analysis of the mineralogy of the silty layer by X-ray diffraction (XRD) [23]. As a mineralogical feature, the peaks of hemihydrate gypsum (CaSO4·0.5H2O) are remarkable, in addition to those of normal minerals (quartz, feldspar, muscovite), heavy minerals (magnetite, pyrite) and clay minerals (illite, chlorite) [24]. The silty layer itself was probably hydrothermal deposits produced by volcanic activity at or around the lake [21].
Here, why the surface water at site S is Ca2+ and SO42− rich (Figure 3e,f) is discussed. The hemihydrate gypsum is one of the calcium sulfate components with a solubility of ca. 6.7 g/L (α type) or ca. 8.0 g/L (β type) at 20 °C [25,26]. The high solubility could easily yield the high EC25 water at site S and, after inflow, produce density underflow even after the dilution by mixing with the lake water. Such underflow then appears to strongly affect the water quality of the bottom layer. Meanwhile, the high acidity (pH = 2.0 or 2.7) of the surface water at site S could be explained by the oxidation of the pyrite (FeS2) to produce SO42− [27], since the solution of hemihydrate gypsum does not exhibit such high acidity.
Figure 6 shows a mineralogical result of the bottom sediment at site MD. In addition to the mineralogy of the silty layer in Figure 5, the peaks of β-FeOOH (Akaganéite), one of the iron oxyhydroxides, are seen. This deposit could be produced by the oxidization of Fe2+ contained in the lake water (Figure 3a,b). The deposition of β-FeOOH is then advanced by the existence of SO42− [28].
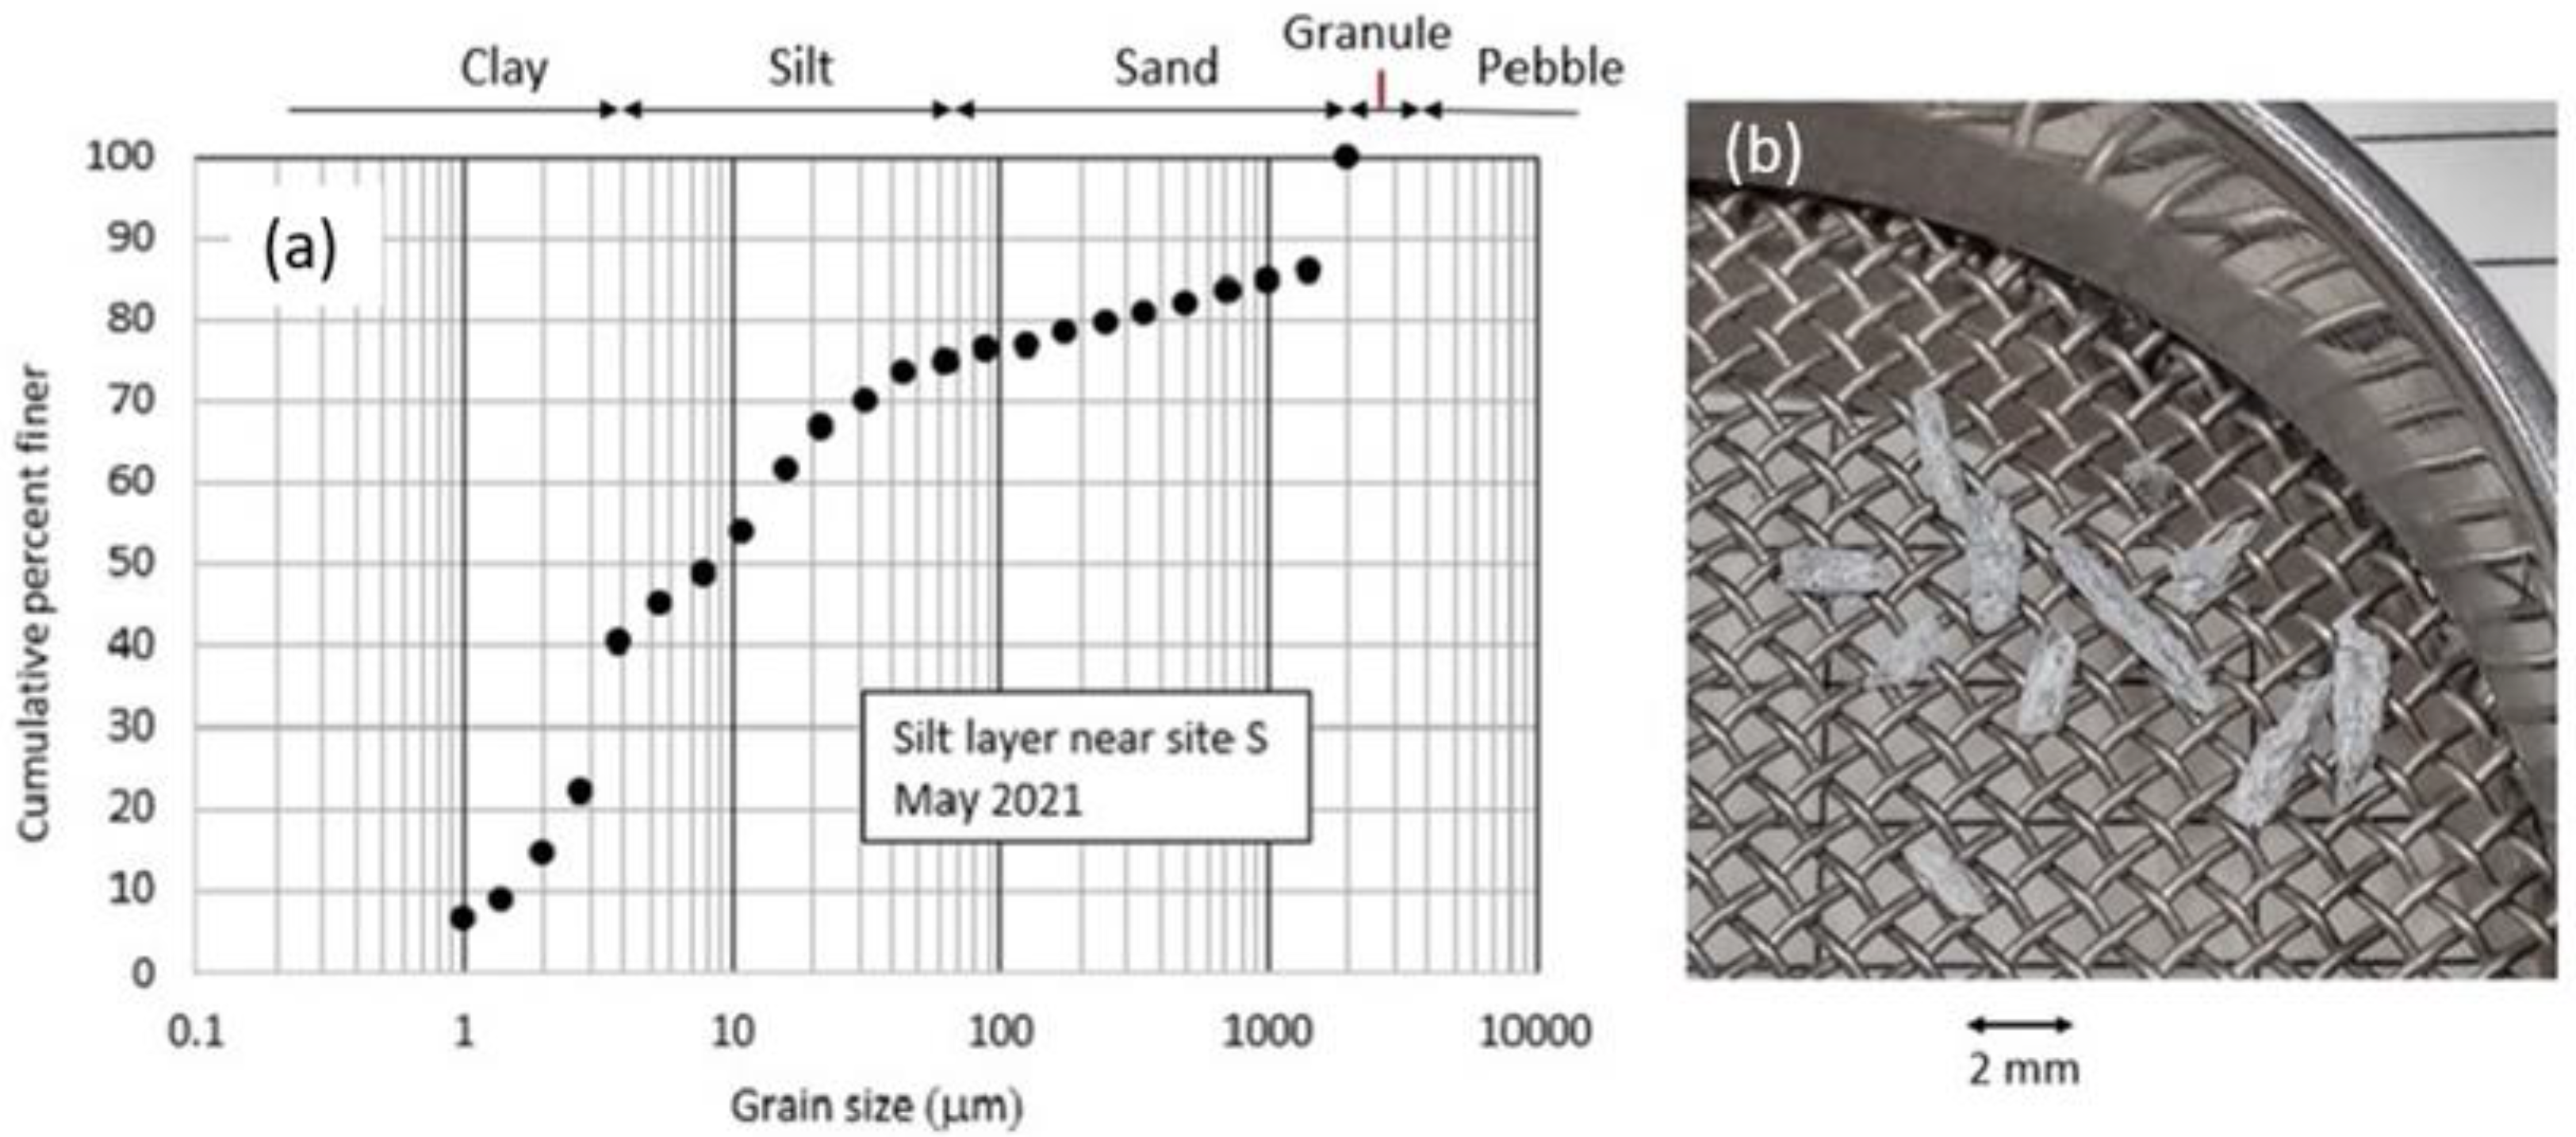
Figure 7 shows (a) the cumulative grain size distribution of the sampled silty layer near site S and (b) needle crystals of gypsum on a 1.41 mm sieve. The silty layer consists of 40.0% clay (grain size d ≤ 3.9 μm), 35.0% silt (3.9 < d ≤ 62.5 μm), and 25.0% sand (62.5 < d ≤ 2000 μm) with a median size of 8.9 μm. Hence, the whitish turbid water at site S observed during or after heavy rainfalls, which flows into the lake, probably includes very fine gypsum grains as suspended sediment. Such sediment was produced by the fluvial erosion of spring water from the slope with the silty layer outcrop. The coarsest grains were dominated by the hemihydrate gypsum crystals (Figure 7b). The whitish turbid water at site S probably contains much dissolved solid by eluting such coarse crystals. The high EC25 values of the surface flow water at site S thus appear to reflect the selective dissolution (Figure 3e,f).
Meanwhile, the surface flow water from the silty layer exhibited a high acidity of pH = 2.0 or 2.7 (Figure 3e,f). This high acidity could be produced by the mechanism promoting the sulfate-rich solution such as the solution of sulfur dioxide or pyrite (Figure 5 and Figure 6) since the saturated solution of gypsum normally has a relatively low acidity of pH = 4.4. Hence, the large ionic balance errors in the stiff diagrams of the surface flow water (Figure 3e,f) are probably due to the missing analyses for metallic ions such as Fe2+ and Al3+.
Figure 8 shows the cumulative grain size distribution of the bottom sediment at site MD (Figure 1a). The sediment consists of 32.6% clay, 26.5% silt, 39.9% sand, and 1.0% granule with a median size of 36.5 μm. The bottom sediment is thus coarser than the silty layer near site S. However, the sediment was not gravelly. This means that the sedimentation at the deepest point of the lake appears to be produced mainly by stream-induced density currents transporting fine grains of clay to sand [29], rather than from the collapse of the surrounding steep slopes.

4.3. Vertical Distributions of Water Chemistry in Okama

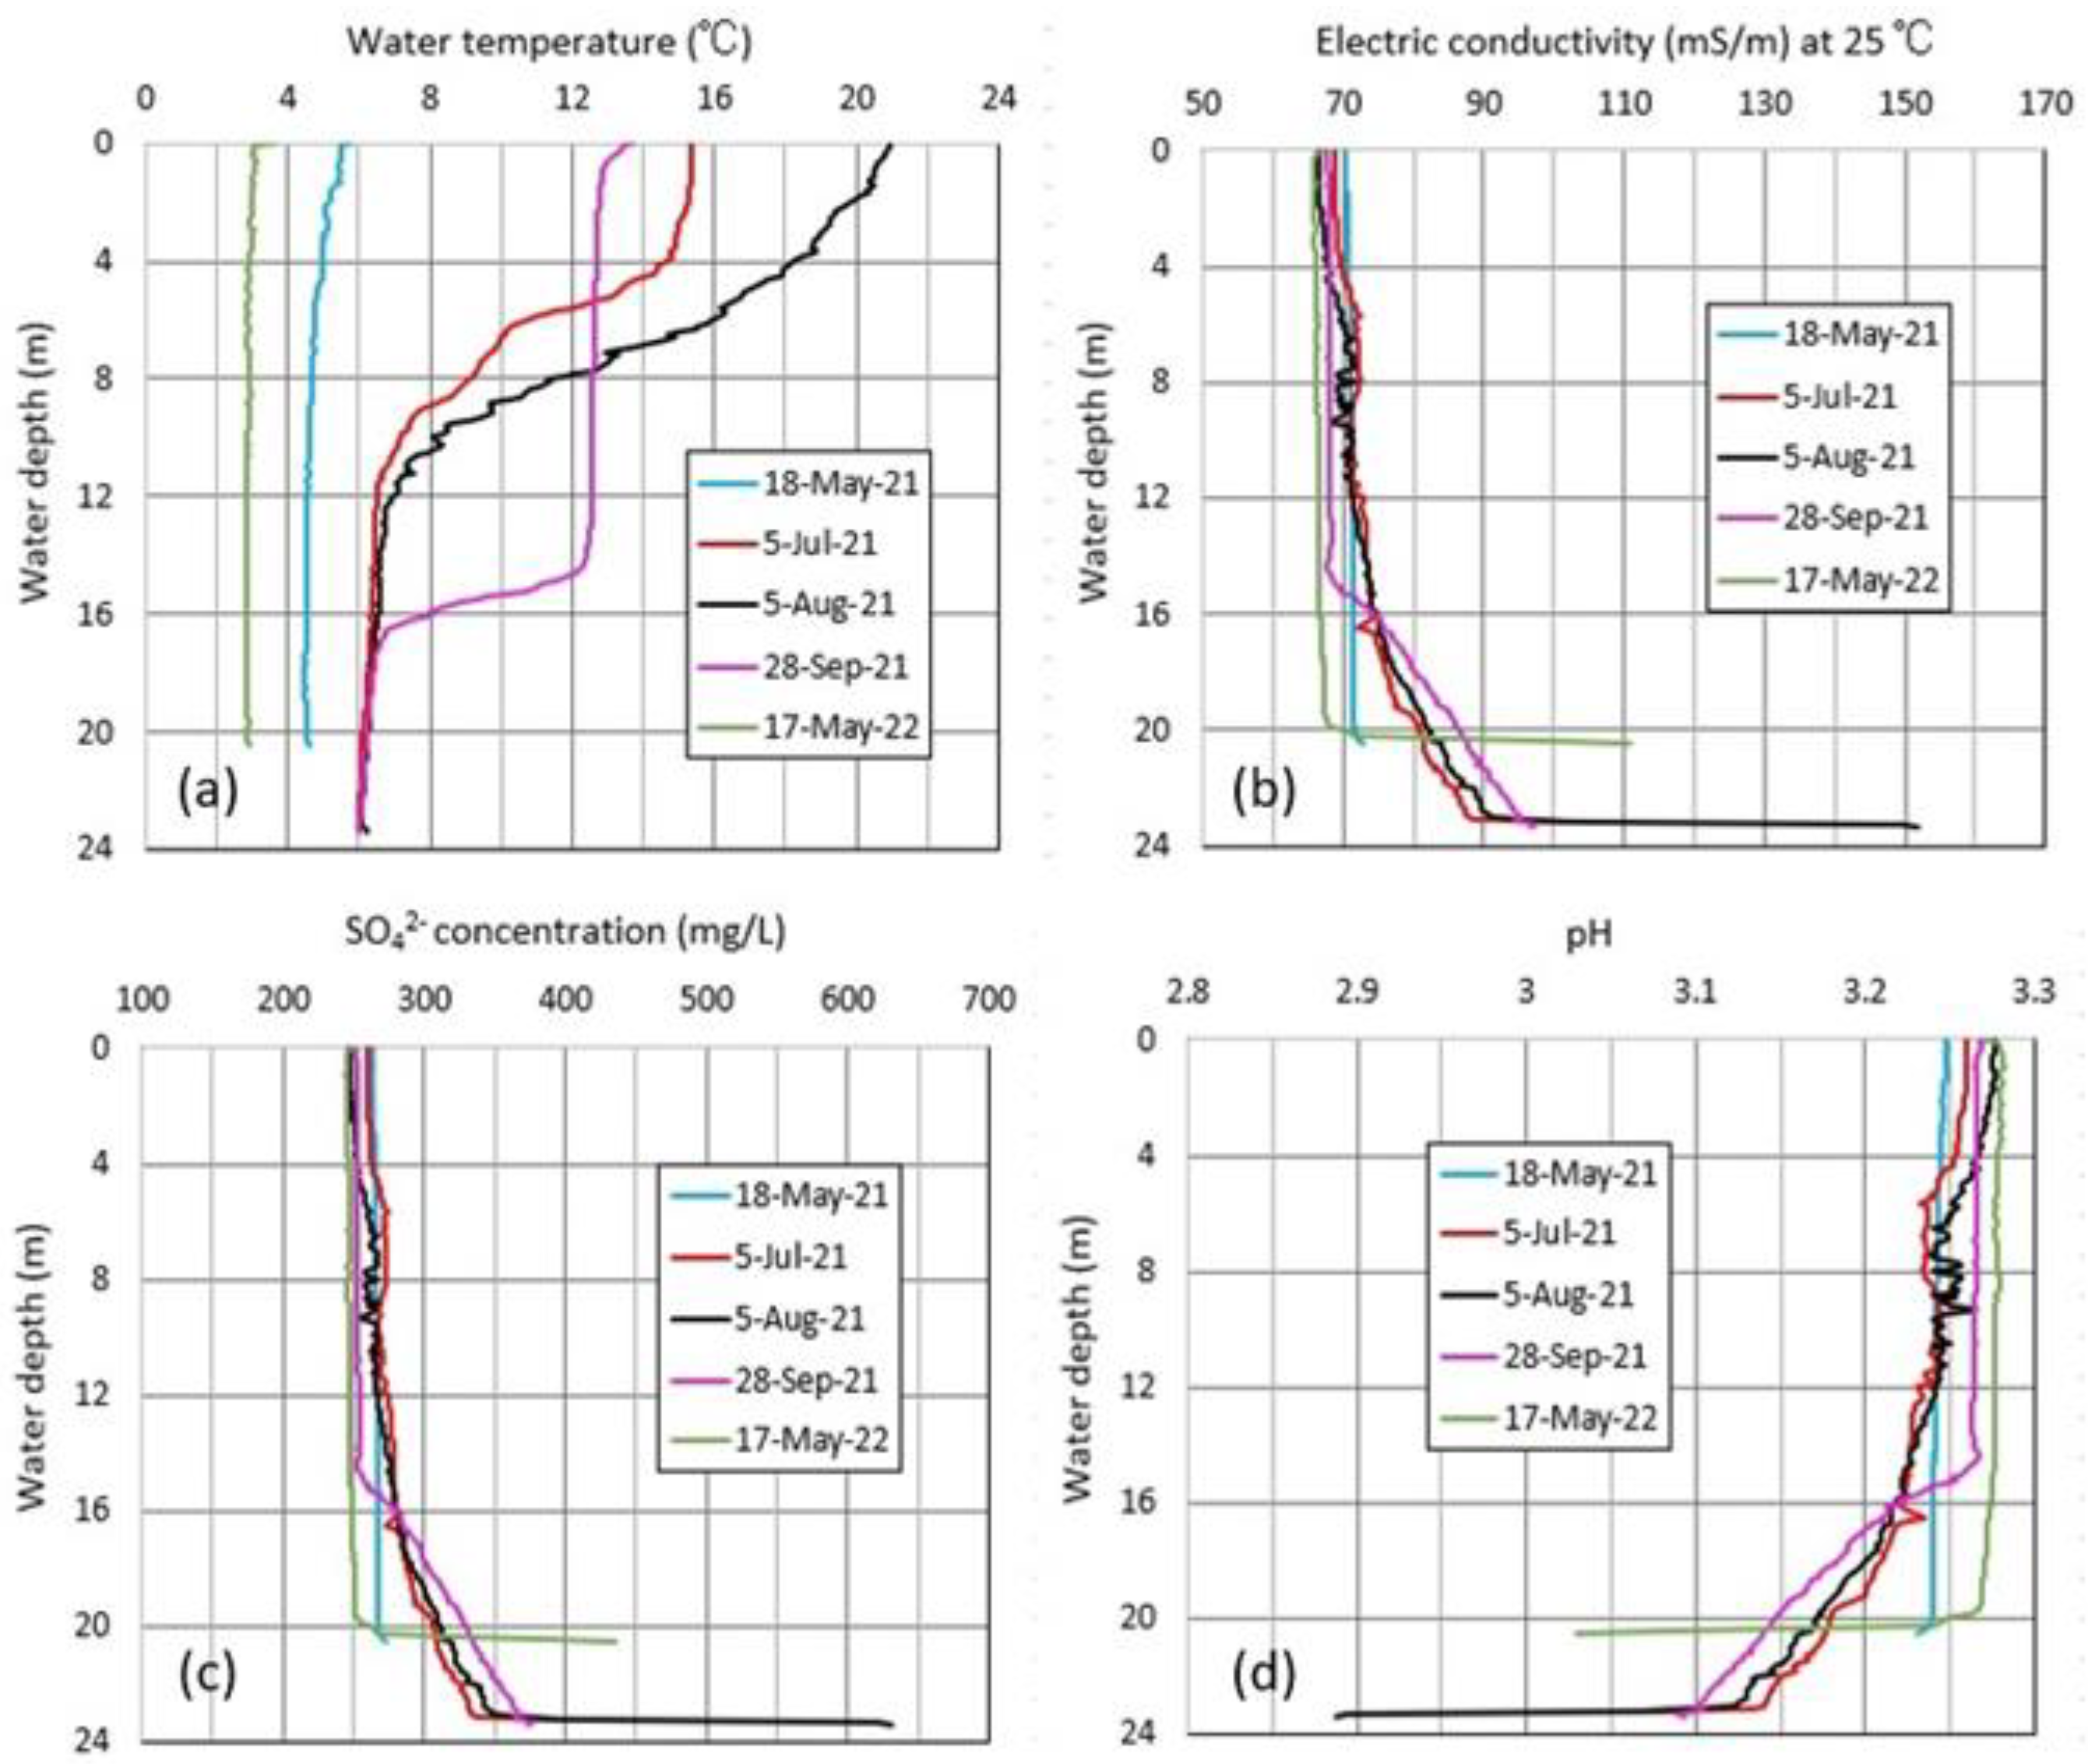
Figure 9 shows vertical profiles of (a) water temperature, (b) EC25, (c) SO42− concentration, and (d) pH at site MD, obtained in May–September 2021 and May 2022. Here, the profile of 29 September 2021 is not expressed because its vertical distribution is similar to that of 28 September. The pH and SO42− concentration profiles were acquired by using the regression curves in Figure 4. The vertical distributions of water temperature exhibit the development of a thermocline in the heating season of July and August and the attenuation and descent of this thermocline in the cooling season of September. In the rainfall season of July–September, the SO42− concentration and the acidity at depths of 16 m or more gradually increased. This suggests that the inflow of surface water following heavy rainfall resulted in a relatively high SO42− concentration and low pH. In the snowmelt season of May, when the vertical circulation occurs at a relatively low lake level, both the SO42− concentration and pH were nearly uniform.
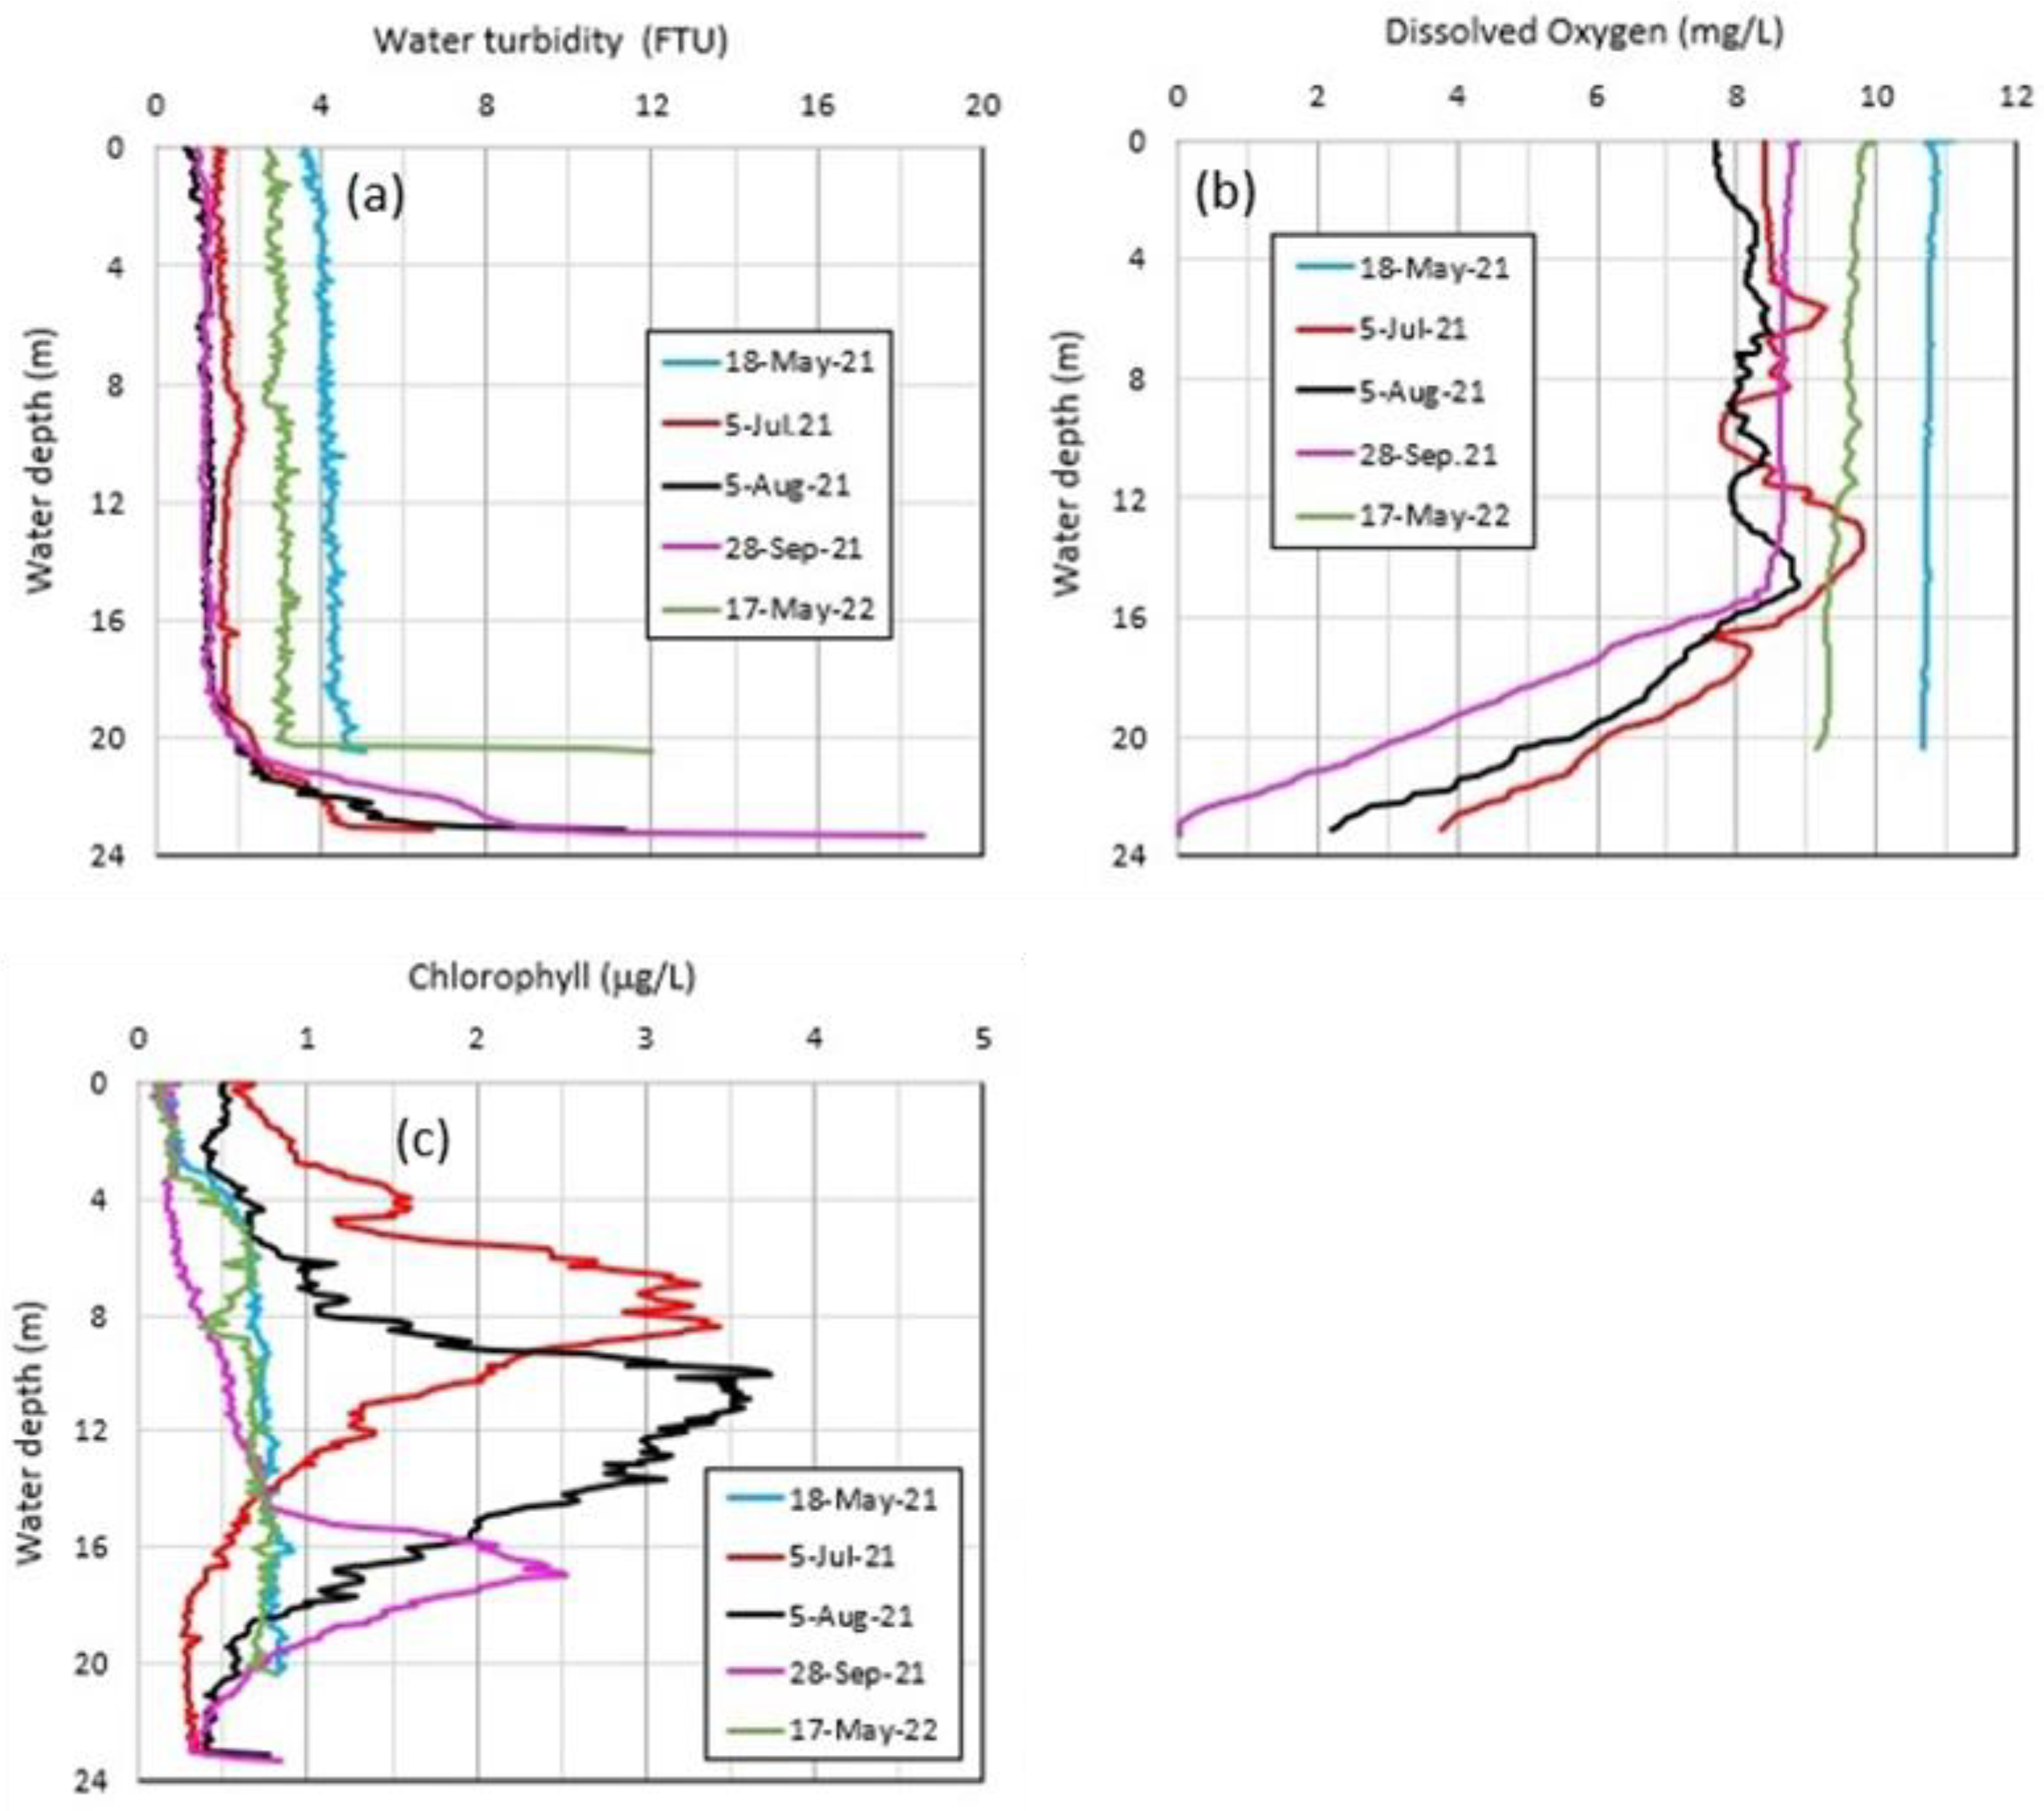
Figure 10 shows vertical profiles of (a) water turbidity, (b) dissolved oxygen (DO), and (c) chlorophyll at site MD on non-rainfall days of May–September 2021 and May 2022. The relatively turbid layer near the bottom likely reflects the intrusion of the inflowing water with high EC25 and acidity in Figure 9. In fact, the spring water from the silty layer near site S exhibits a high EC 25 and acidity as milky water (Figure 3e,f).
The bulk density of the spring water could then be larger than that of the bottom water at site MD, since the bulk density rb = 1001.15 kg/m3 and 1000.36 kg/m3 from water temperature at 16.3 °C and 4.5 °C and total dissolved solids (TDS) at 2,220 mg/L and 360 mg/L for surface water and the Okama’s bottom water, respectively, on 18 May 2021 (Figure 9b). Thus, after inflow, the spring water could intrude into the Okama’s bottom layer as density underflow [29,30]. The TDS values were then obtained from the EC25 values, using the liner relationship of TDS = 5.0·EC25.
In July–September 2021, the peaks of chlorophyll were observed below the thermocline (Figure 9a and Figure 10c). This probably reflects the existence of acid-tolerant photosynthetic bacteria. The drastic DO decrease in the lower layer in Figure 10b is likely due to the decomposition of the bacteria.

4.4. Thermal Variations in Okama

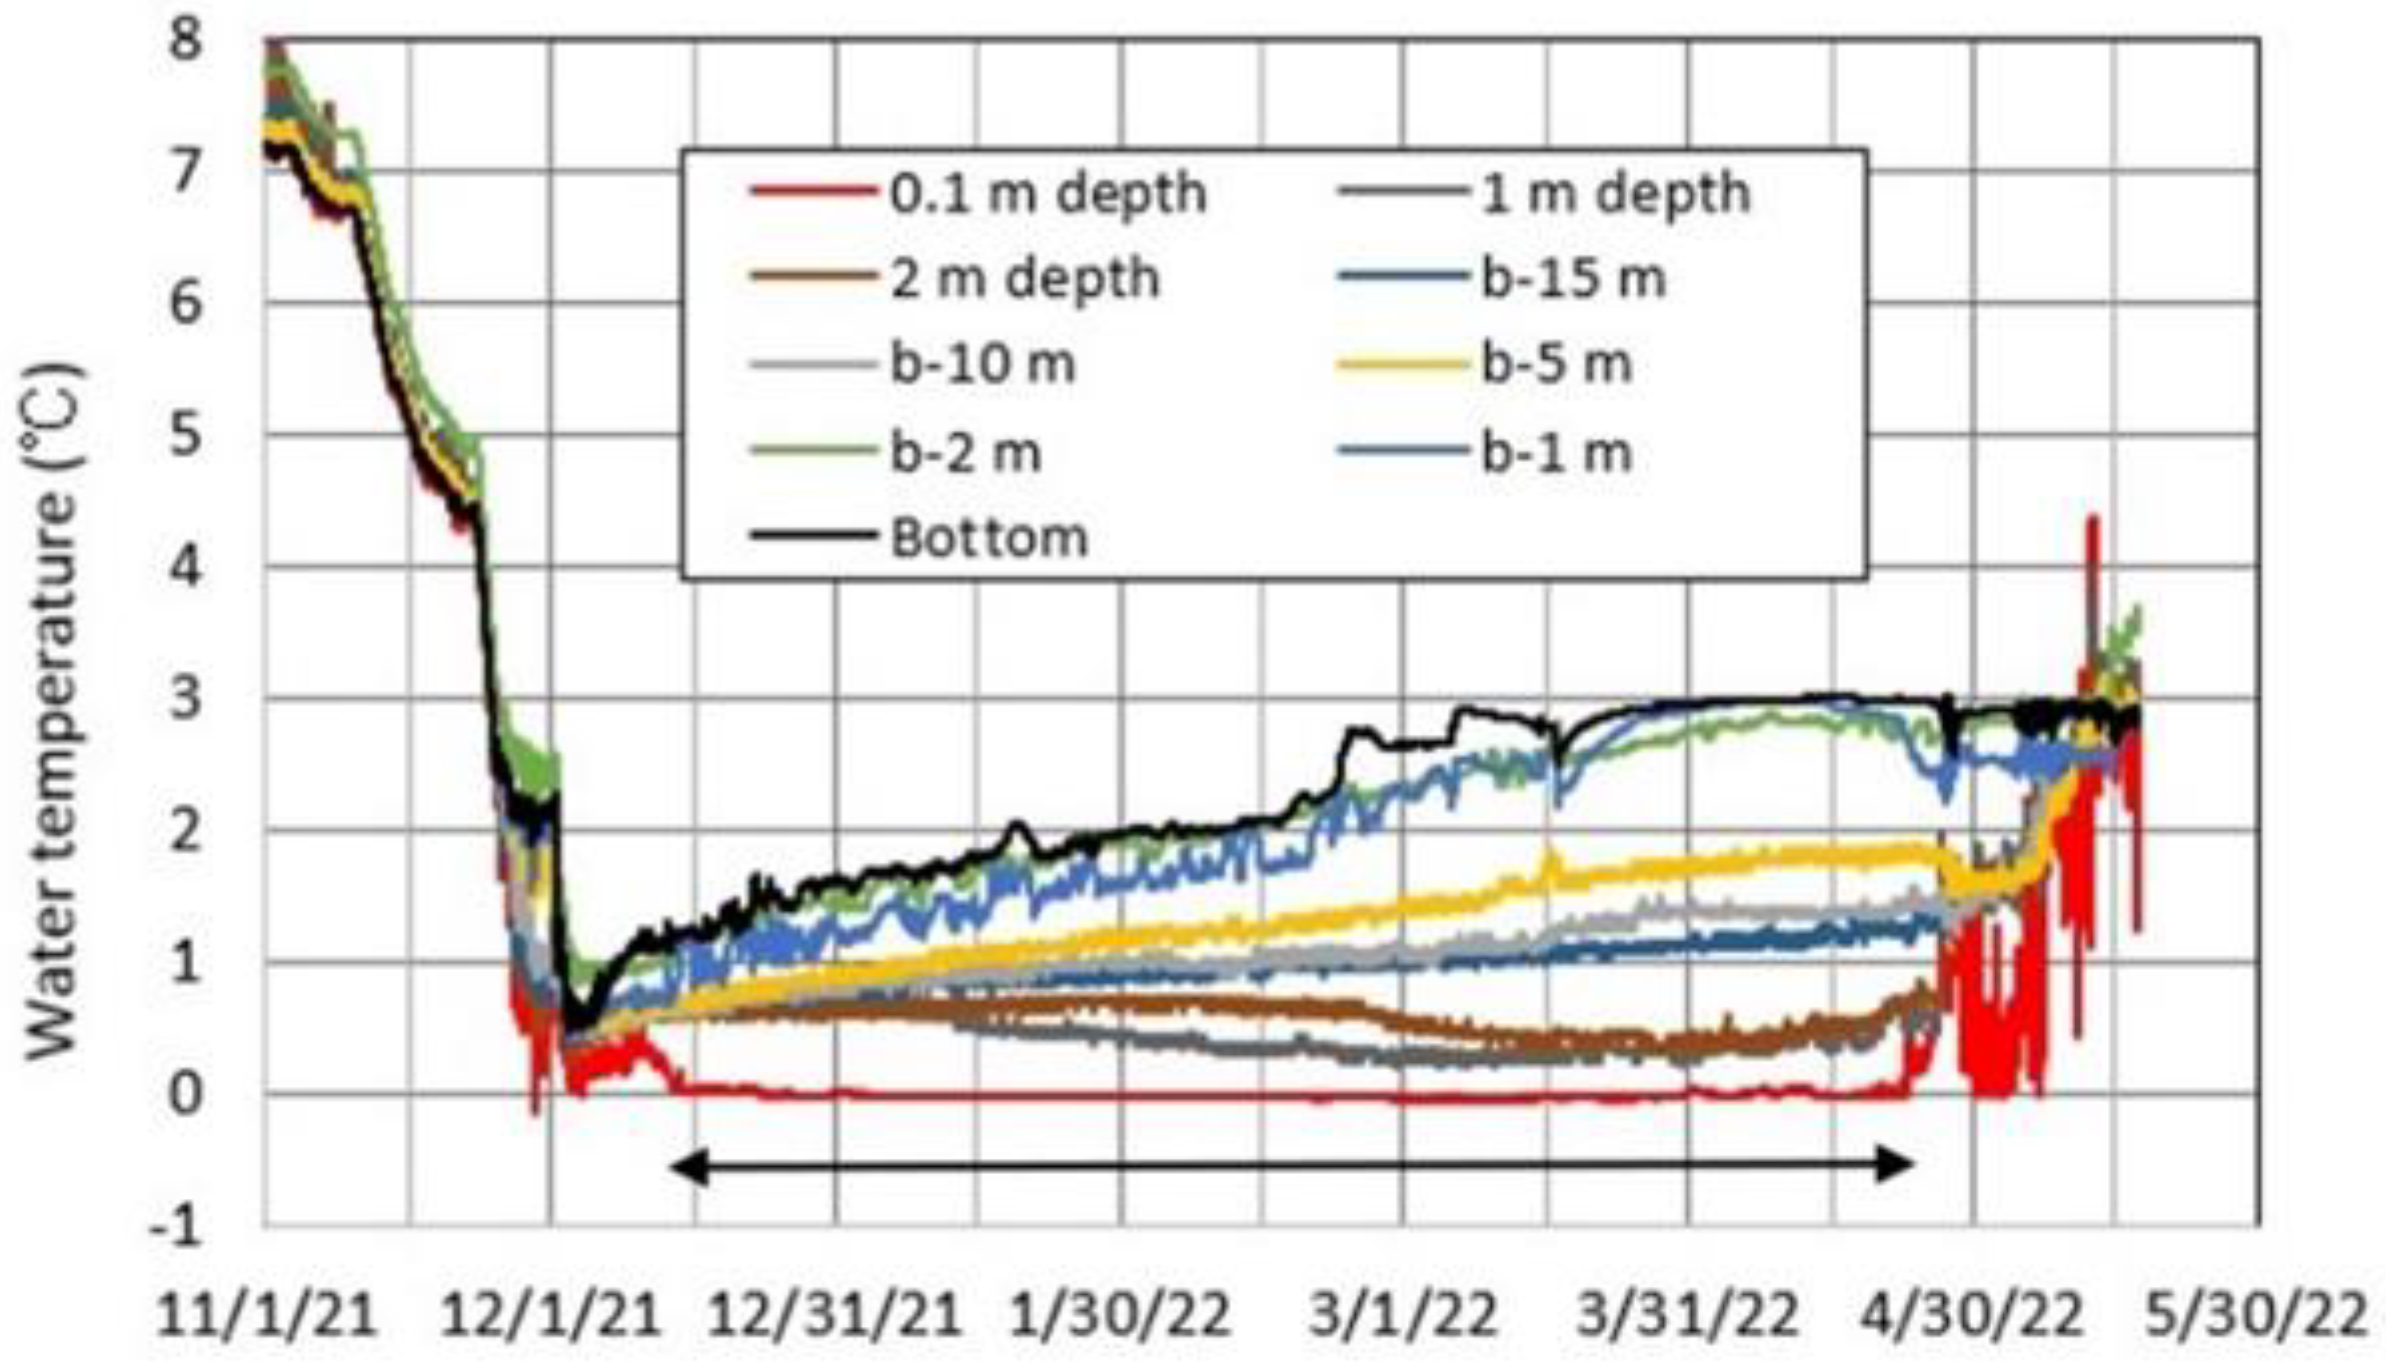
Figure 11 shows the temporal variations in hourly water temperature between the lake bottom and 0.1 m depth for 1 November 2021–17 May 2022. The whole layer was rapidly cooled, indicating 4.3 °C on 22 November 2021 and 2.9 °C on 24 November 2021. Thereafter, the upper layer of 0.1 m–2 m in depth was selectively cooled, indicating the completely inverse density stratification. The whole layer was again cooled to 0.9 °C on 3 December 2021, suggesting a start of the ice cover. The lake surface became completely ice-covered on 13 December 2021, as shown by the water temperature of almost 0 °C at 0.1 m depth (black arrow in Figure 11). Since 23 April 2022, the surface water temperature became more than 0 °C due to the incidence of solar radiation on the open water from ice melt.
For the completely ice-covered period of 3 December 2021–22 April 2022, water temperature increased gradually between the bottom and 15 m above the bottom. Additionally, as the depth increases, the rate of water temperature increase increased. This is evidence that geothermal heat input occurred at the bottom [7]. Under conditions of open water, such a temperature increase was not observed in the lower layer, because the density underflow from the stream inflow could occur on rainy days. Thus, the water temperature increase in the completely ice-covered period could occur because of neither surface water inflow nor percolation of snowmelt water and rainwater in the catchment.

4.5. Meteorology and Lake Level at Okama

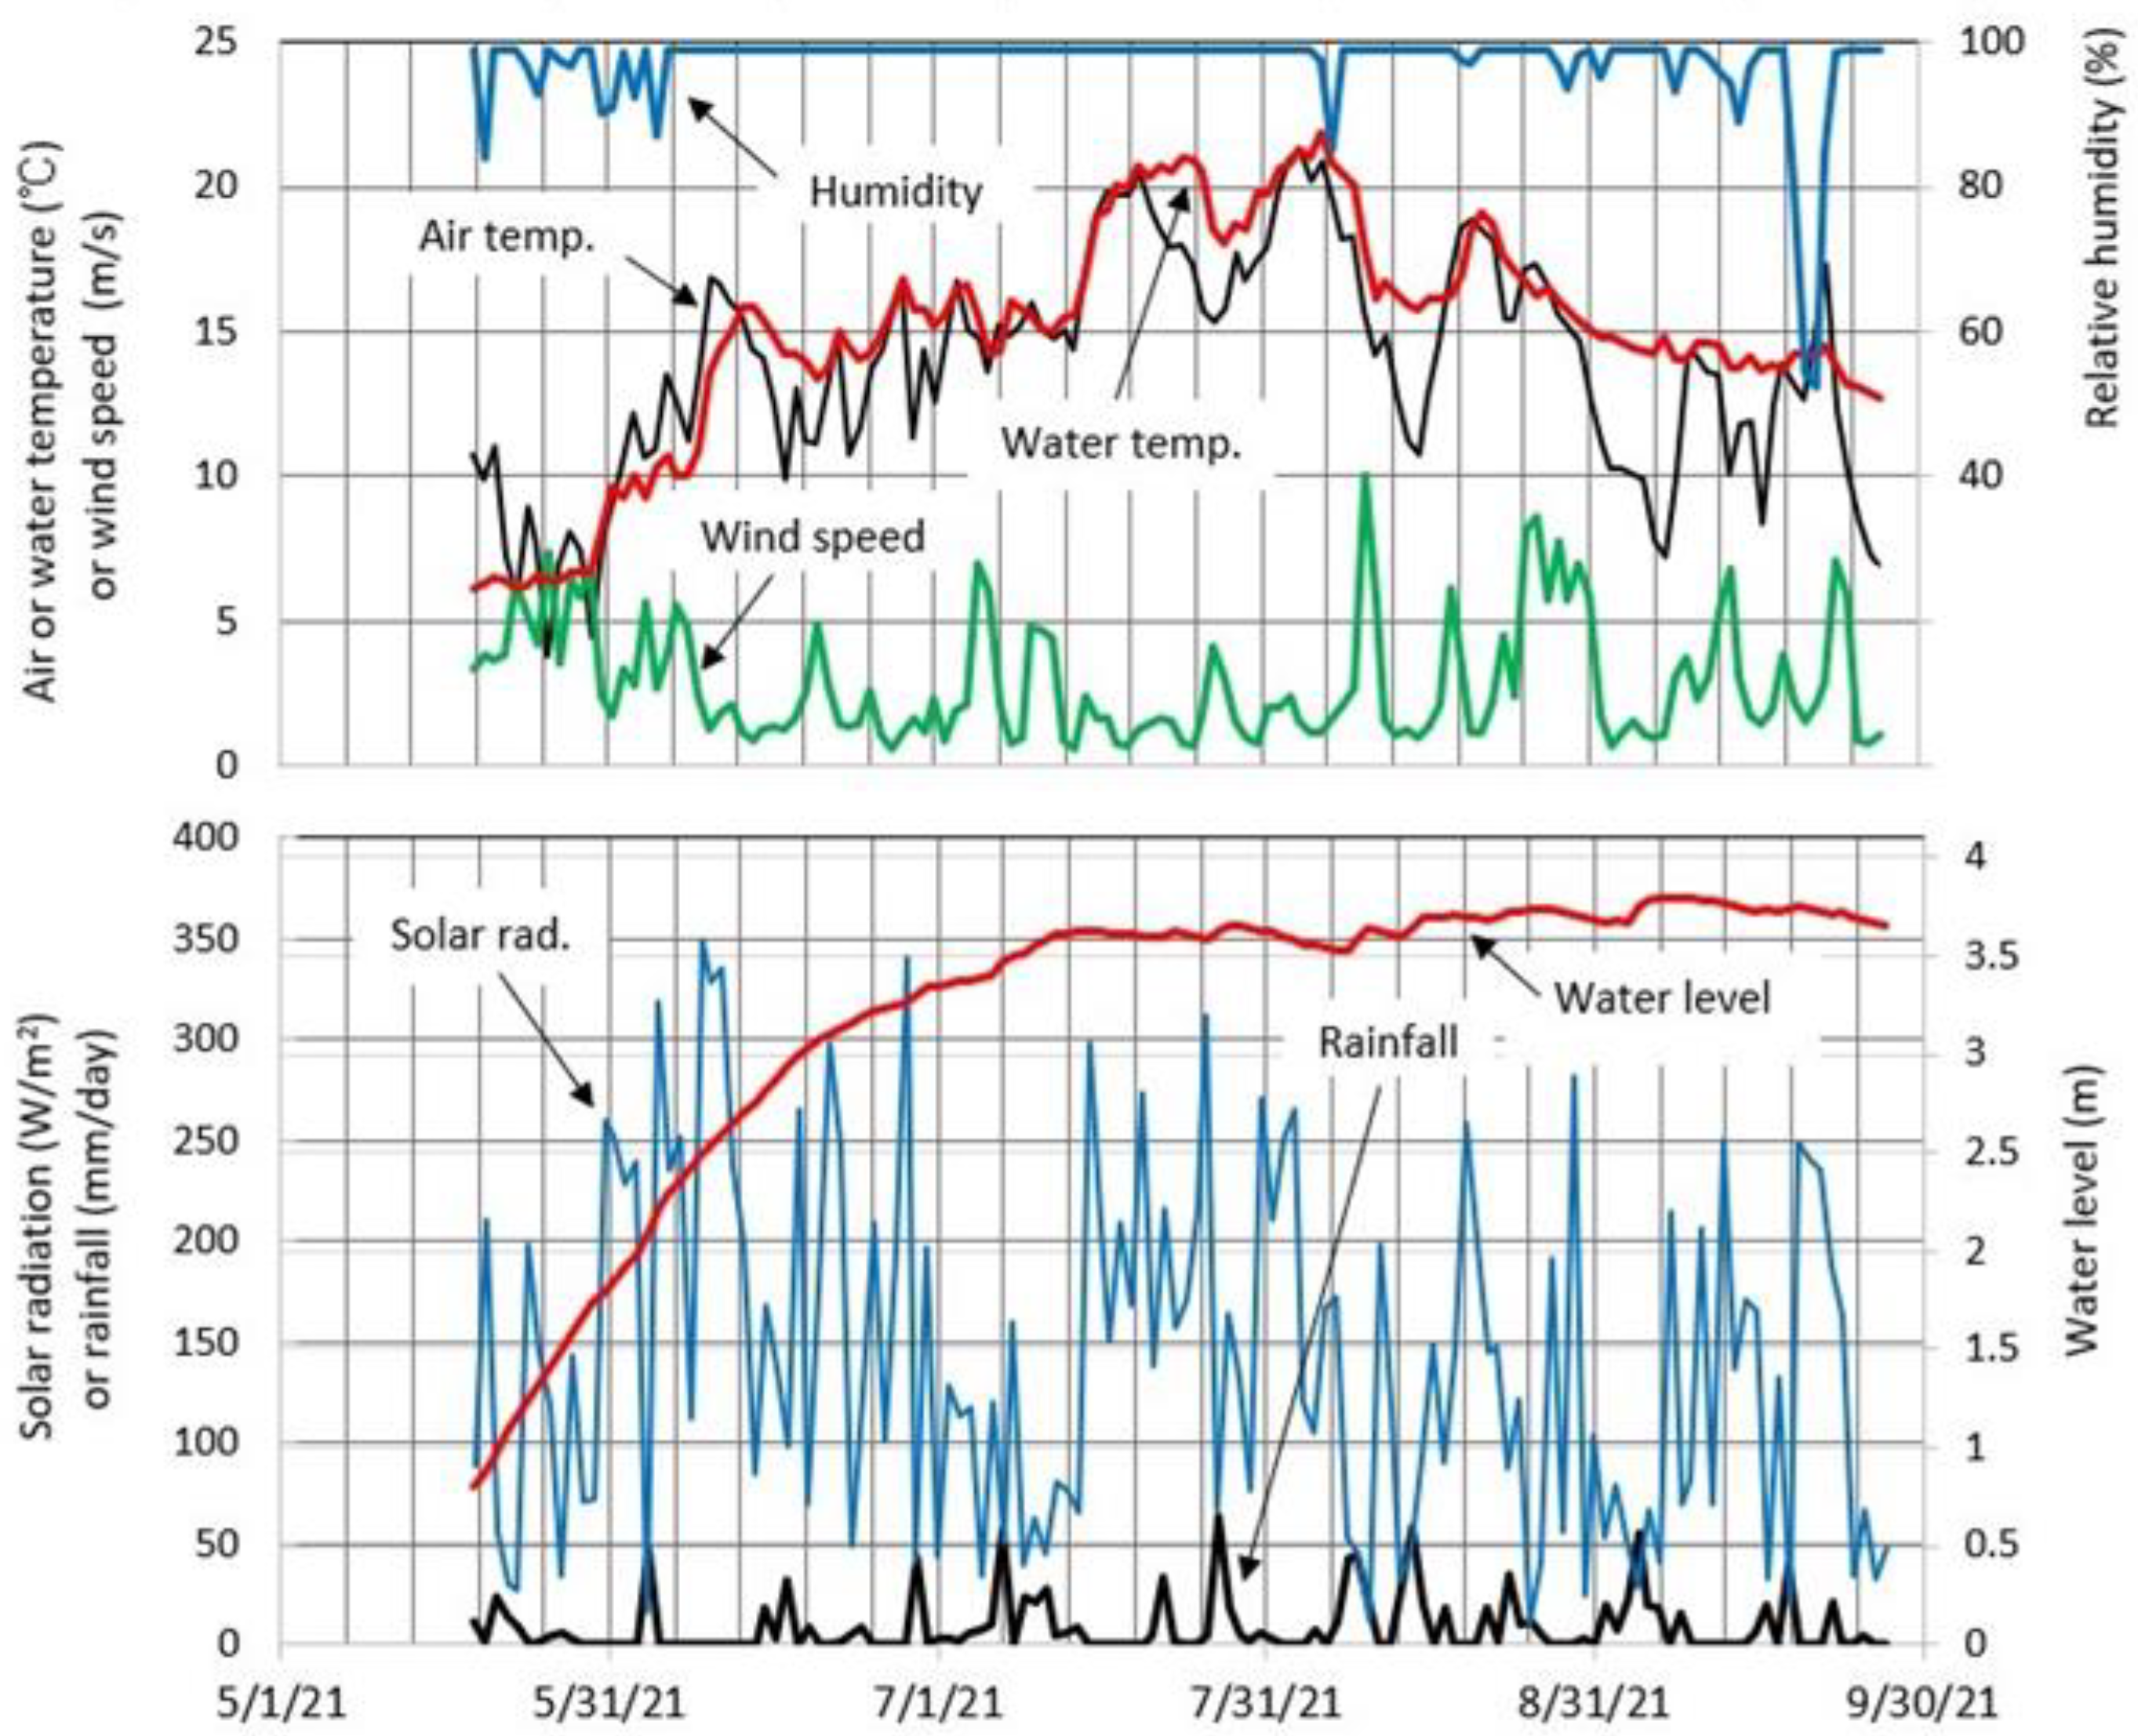
Figure 12 shows the temporal variations in daily mean air temperature, relative humidity, 0.1-m depth water temperature, lake level, wind speed, solar radiation, and diurnal rainfall for 19 May–27 September 2021. For the period of 19 May–12 July, the lake level abruptly increased irrespective of the small rainfall, compared with those periods after 12 July. This is probably due to an increase in groundwater inflow from the active underground percolation by the melting of snow remaining in the Okama catchment (Figure 1). In fact, the solar radiation peaked at 350 W/m2 on 10 June. Thus, the progress in snowmelt could produce a groundwater inflow larger than the groundwater outflow, which makes the net groundwater inflow G in Equation (4) positive [7]. After 12 July, the lake level was relatively stagnant, indicating that the right side in Equation (1) was nearly zero. In such a case, it is seen that the river inflow and direct rainfall onto the lake were roughly balanced by the evaporation at the lake surface plus the positive groundwater outflow.
The data of air temperature, wind speed, relative humidity, and 0.1-m depth water temperature were applied to calculate the evaporative latent heat and the evaporation at the lake surface by using Equations (2) and (3).
Using the linear relationship between site M and the Daikokuten hut (Figure 13b) for air pressure in September 2021 and the data of water pressure and water temperature at site L, the lake level in the ice-covered period was obtained (Figure 14). Using the regression line in Figure 13a, the hourly air temperature at site M was acquired as the annual data for May 2021–31 May 2022, including the completely ice-covered period of 13 December 2021–23 April 2022 (Figure 11). Such data can be utilized as one of the climatic conditions in the Okama.
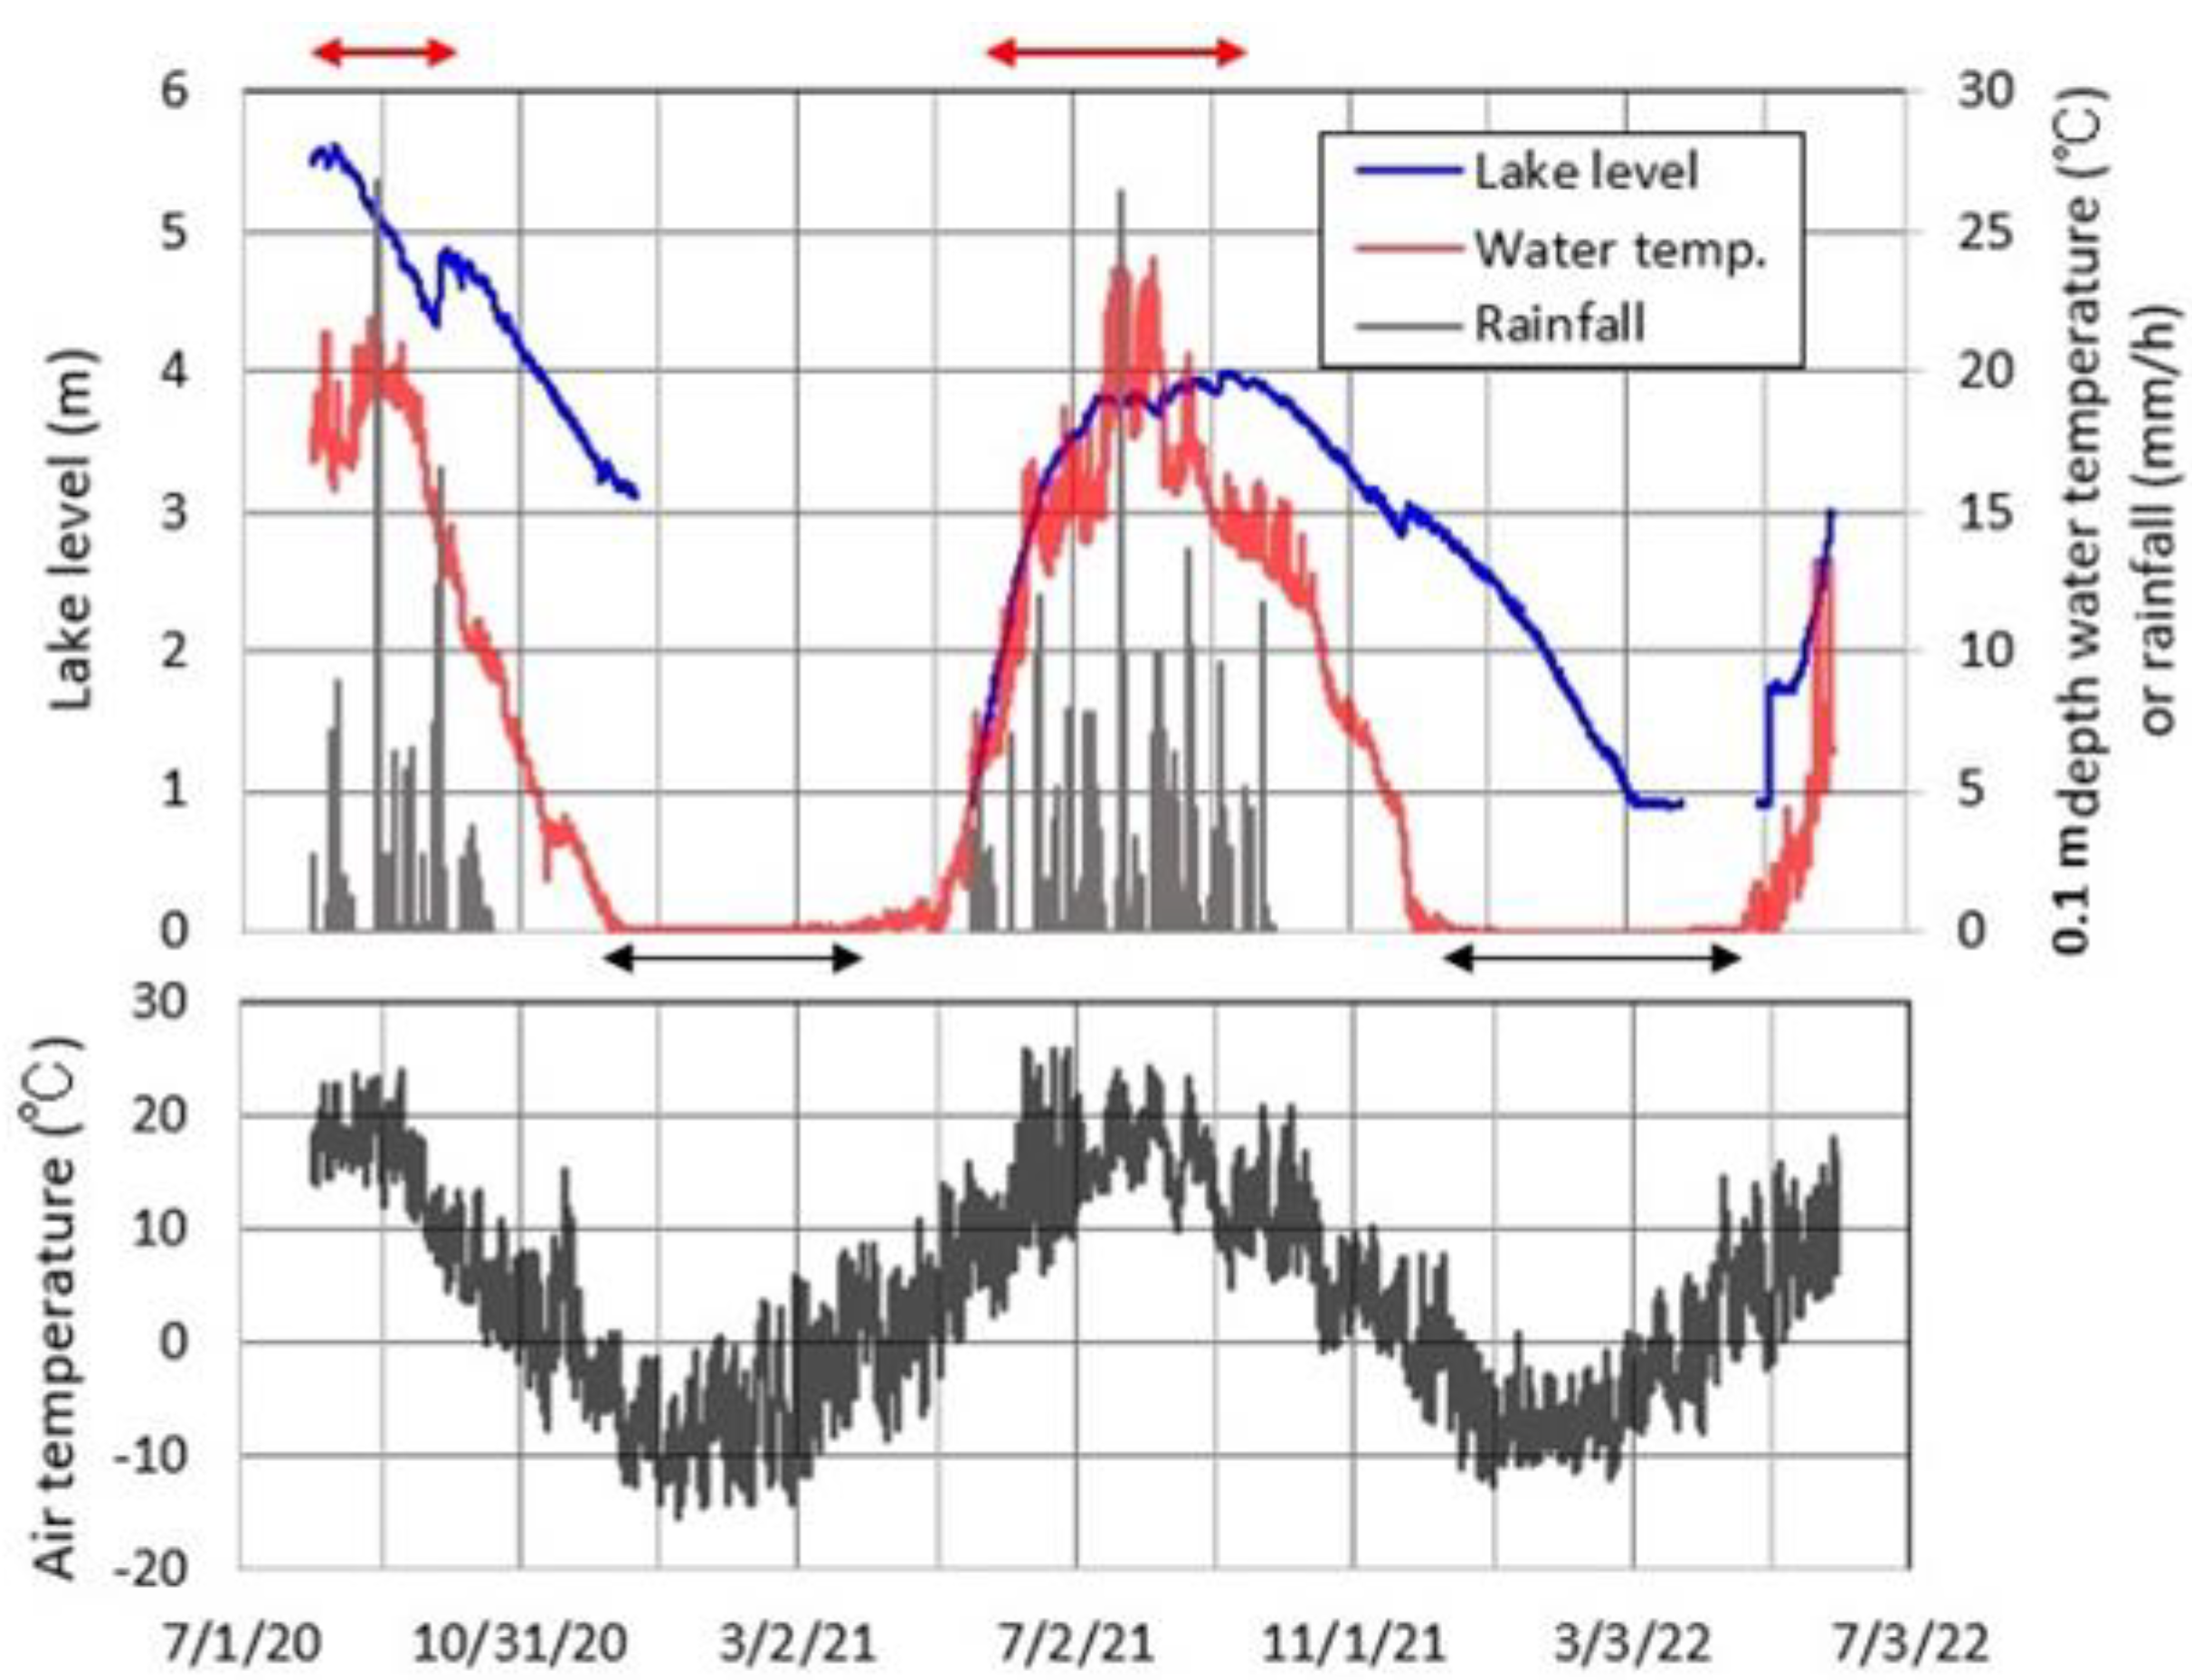
Figure 14 shows the temporal variations in hourly lake level, 0.1 m depth water temperature at site MD, and rainfall and air temperature at site M for the period 31 July 2020–31 May 2022, including the two completely ice-covered periods (black arrows). The lake level in 2020 was calibrated by the leveling among the three benchmarks and lake surface in the field surveys of 2020–2022. In the completely ice-covered period of December 2020 and April 2021 and the subsequent ice-melt season, the water pressure measurement at site L failed because the logger appeared on the lake shore by the large descent of lake level. In the completely ice-covered season of December 2021–April 2022, the lake level measurement failed only for 25 March–30 April. On 30 April 2022, the 0.1 m depth water temperature started to rapidly increase from almost 0 °C, which was probably produced by the breakup of the ice covering based on the positive air temperature after 26 March. Correspondingly, for 4–8 May 2022, the lake level abruptly increased from 0.9 m to 1.7 m. These suggest that the covered ice accumulated by thick snow mass was more broken up.
In this study, the relationship between the lake level and groundwater inflow and outflow evaluated by Equations (6) and (7) is explored by using the data of some non-rainfall periods contained by the two red arrows in Figure 14. This is discussed in Section 5.2 of the Discussion.
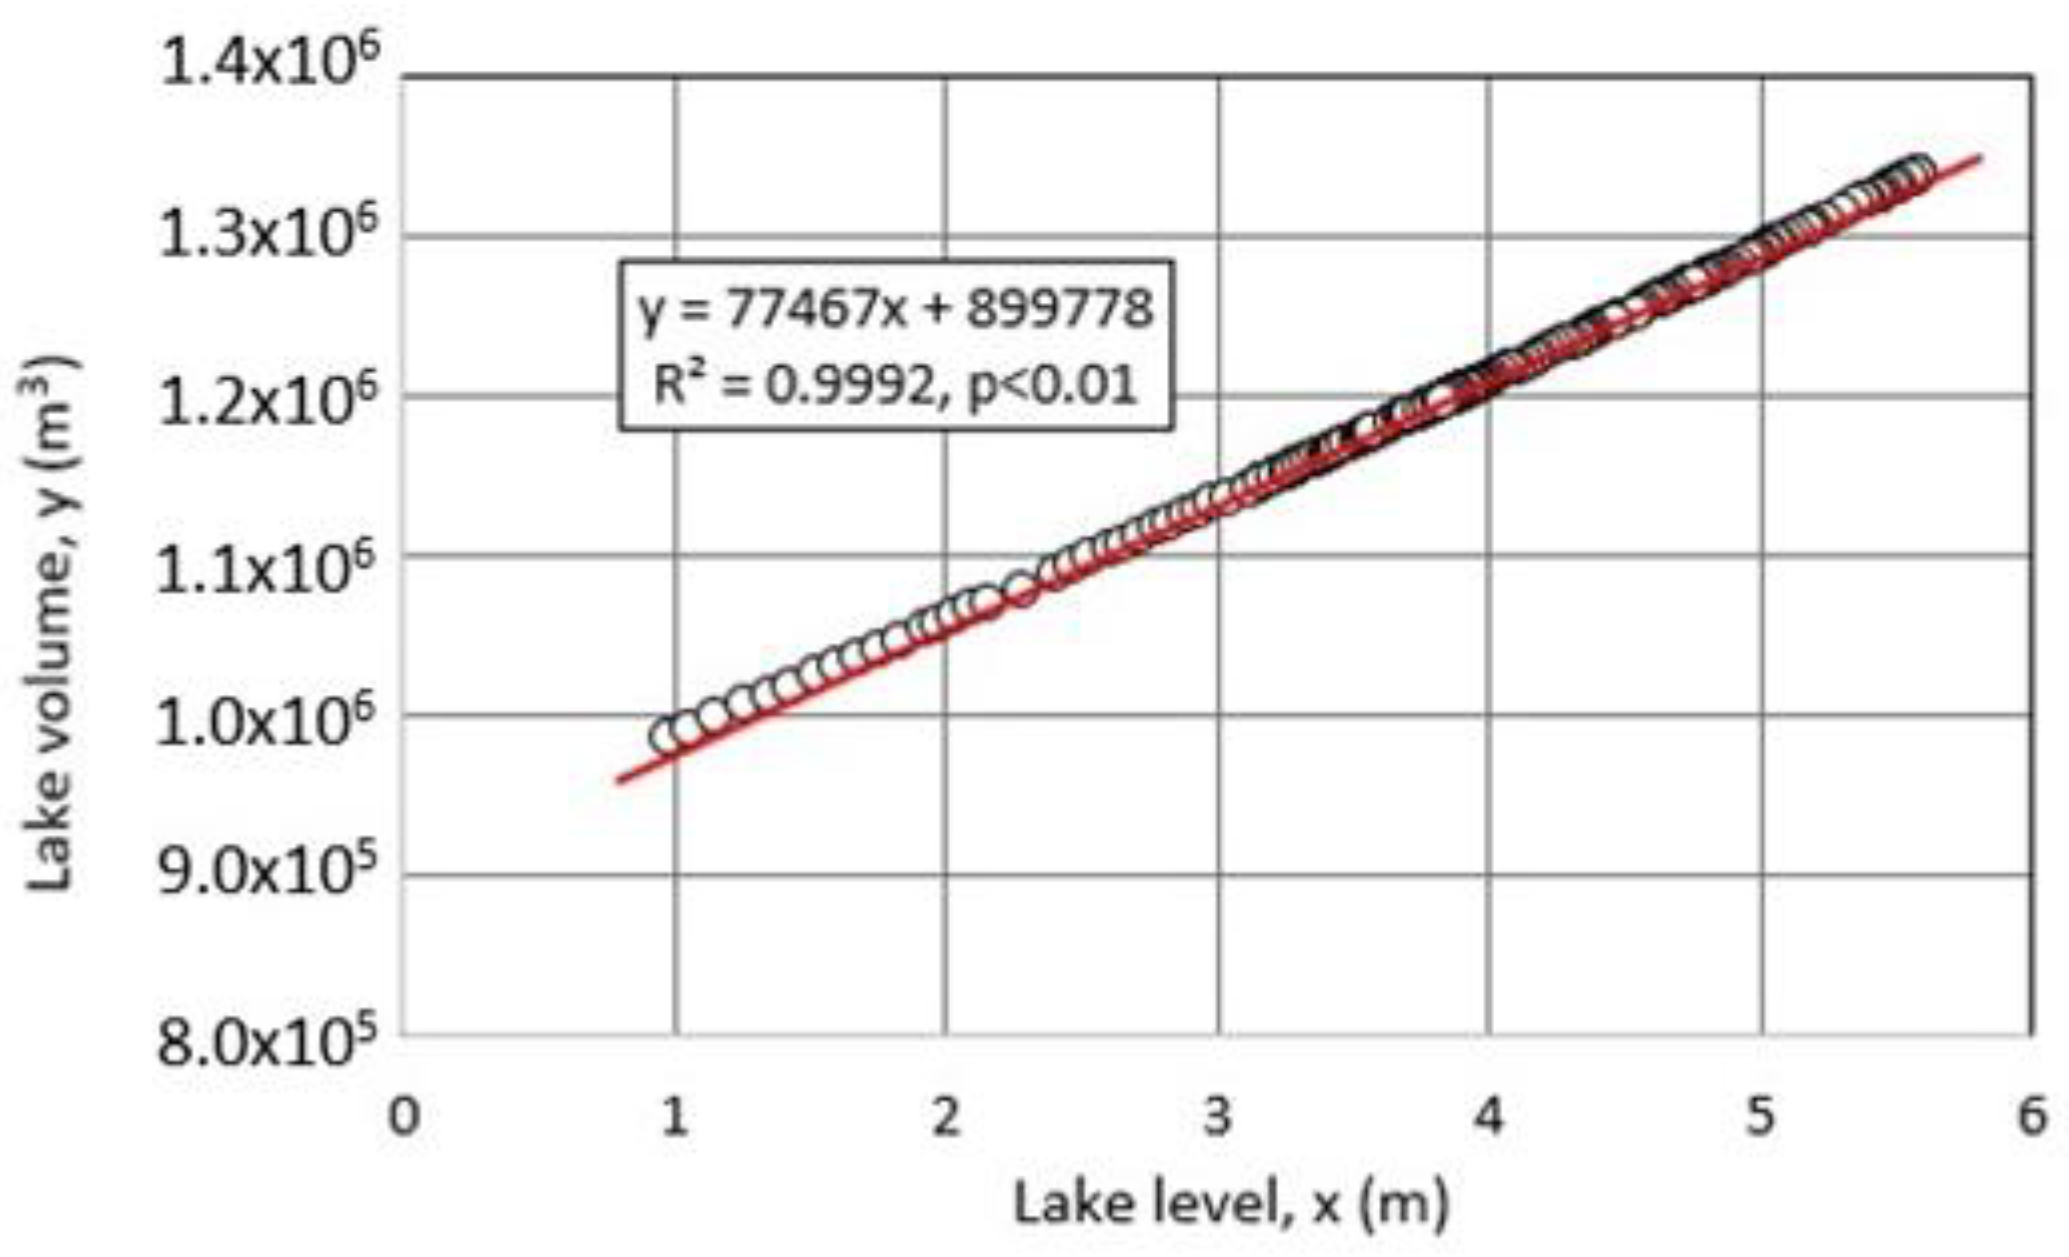
The lake level in Figure 14 was converted to the lake volume as daily mean values because of the high correlation (Figure 15). Thus, the temporal change in the daily mean lake level can be regarded as that in the corresponding lake volume.

5. Discussion

5.1. Geothermal Heat Flux in Okama

In the completely ice-covered periods of December 2021–April 2022, the increase in lake water temperature was observed between the lake bottom and 15 m above the bottom at site MD (Figure 11). This means that some geothermal heat is supplied at the lake bottom. Hence, using the bathymetric map in Figure 1b and the time series of daily mean water temperature from Figure 11, the time series of the daily heat storage change, daily mean heat flux, and its 10-day moving average were acquired (Figure 16). Then, the period of 15 December 2021–28 February 2022 in Figure 11 was selected for the calculation. This is because the relatively large lake-ice growth started to occur on 1 March 2022 as shown by the gradual decrease in 2 m depth water temperature. Such a downward large ice growth was judged to affect the temperature increase produced by the geothermal heat flux from the bottom. Here, the upper limit of the temperature increase was located at 2 m in depth, where the increasing rate was almost zero for the calculation period. The height of 2 m depth from the bottom and its surface area were calculated by using the bathymetric map in Figure 1b and the lake level change in Figure 14.
According to the method of Chikita et al. [7], the area, A(z), at each height of the loggers above the lake bottom was multiplied by ρw·cp·T(z), where ρw is the water density (kg/m3), cp is the specific heat (J/Kg/K) of water, and T(z) is the water temperature (K) at the logger’s height z(m) above the bottom. The total heat storage (J) of the lake on a certain day was obtained by summing Δh{ρw·cp·T(z)·A(z)} between the lake bottom and 2 m depth, where Δh is each height difference between the loggers. Then, the horizontal multi-layer thermal structure in the lake was assumed, i.e., horizontally taking the same temperature at the same water depth. Finally, the heat storage change per day per unit area (W/m2) was calculated by dividing a daily change (J/day) in the total heat storage of the lake by the area (6.718 × 10⁴–6.896 × 10⁴ m2) at 2 m depth (18.69–20.36 m above the bottom) (Figure 1b). Then, the 10-day moving average was calculated, and the water temperature averaged over the heated layer calculated from the heat storage change was accumulated.
Focusing on the temporal variations in the 10-day moving average, the heat flux varied at a range of −0.4–5.5 W/m2. It is noted that the heat flux decreased to almost zero on 2–8 February. Then, the accumulated water temperature stayed almost constant. Ichiki et al. [31] found out that the zone of low specific resistivity exists as the geothermal heat source at ca. 190 m below the lake bottom. The temporal variations in the heat flux thus appear to reflect the thermal behaviors of the underground geothermal heat source.
Meanwhile, the EC25 values from the EC logger at 2 m above the bottom (Figure 2) stayed nearly constant at 62.8–64.2 mS/m for 15 December 2021–28 February 2022. Hence, it is suggested that the geothermal heat input is not due to the hot spring water supply but thermal conduction from the heat source. The accumulated water temperature increased from 1.08 °C on 16 December 2021 to 1.56 °C on 28 February 2022. Such a small increase reflects the stagnant volcanic activity at or around the Okama.

5.2. Contribution of Each Hydrological Term to Lake Volume

Applying the daily data in Figure 12 to the hydrological budget equation, Equation (1), the contributions of diurnal total rainfall (=P·A0 in Equation (1)), diurnal total evaporation (=E·A0), river inflow Rin, and calculated diurnal net groundwater inflow G to the change in lake volume V were numerically estimated (Figure 17). The periods in Figure 17a include the rainfall days in Figure 12. In Figure 17b, hydrological budgets in non-rainfall periods with two or more non-rainfall days were calculated. Compared with the P·A0 by rainfall, the contribution of evaporation, E·A0, is slight at −86.5–216.6 m3/day over the periods (Figure 17a), where the negative values mean condensation to the lake surface.
However, the lake volume in the snowmelt season of May–June increased consistently in very low response to rainfall events. This suggests that the consistent lake volume increase is not produced by the rainfall, but by the river inflow and/or the positive G. In fact, in Figure 17b, it is seen that the positive G values and relatively large Rin then increased the lake volume. After the snowmelt season, the G changed to negative values, where the temporal increases in lake volume were exclusively produced by rainfall events. However, the small variation in lake volume after rainfall appears to be controlled by the variation in the G values. The spring water is seen in the valley downstream of site N (Figure 1a), which possibly originates in groundwater leaked from the Okama [7,15]. Hence, the leveling between the lake level and the springing point is needed as a future study.

5.3. Evaluating Groundwater Inflow and Outflow in Okama

Using Equations (1)–(7), the groundwater inflow and outflow in the Okama were calculated on the daily data from non-rainfall periods, where one day was adopted as a fundamental budget time period Δt in Equations (1) and (5). Here, the SO42− concentration was taken as a representative ionic concentration for the chemical budget of the Okama, because the SO42− concentration was highly correlated to EC25 and pH (Figure 4). Then, the net depositional flux S in Equation (5) was assumed to be zero for SO42− because of the high solubility. The stiff diagrams for lake water and stream water (Figure 3) appear to reflect the dissolution of CaSO4 compounds such as hemihydrate gypsum existing underground or on the surface inside the catchment [22]. In fact, the hemihydrate gypsums of α type and β type can be dissolved into 20 °C water at maximums of ca. 6700 mg/L and ca. 8000 mg/L, respectively [26,32]. Hence, as shown by Figure 3e,f, Figure 4a, and Figure 9c, the deposition of CaSO4 proves to hardly occur in the lake, because even the spring water of high EC25 near site S is diluted by the lake water after the inflow. The saturation indices (SI) of α-hemihydrate gypsum and β-hemihydrate gypsum were −3.4 and −3.5 for the 8-May lake water, −3.0 and −3.1 for the 28-September lake water, −5.1 and −5.2 for the 8-May stream water, −3.9 and −4.0 for the 28-September stream water, −1.6 and −1.7 for the 8-May spring water, and −0.9 and −1.0 for the 28-September spring water, respectively (Ozair [33] for CaCO3]. The negative SI values mean that there exists no deposition of the hemihydrate gypsums for any surface waters in the catchment. Thus the choice of SO42− in the chemical budget equation is likely to be valid for the lake, though the dissolution of hemihydrate gypsum in the bottom sediment could partly occur (Figure 6).
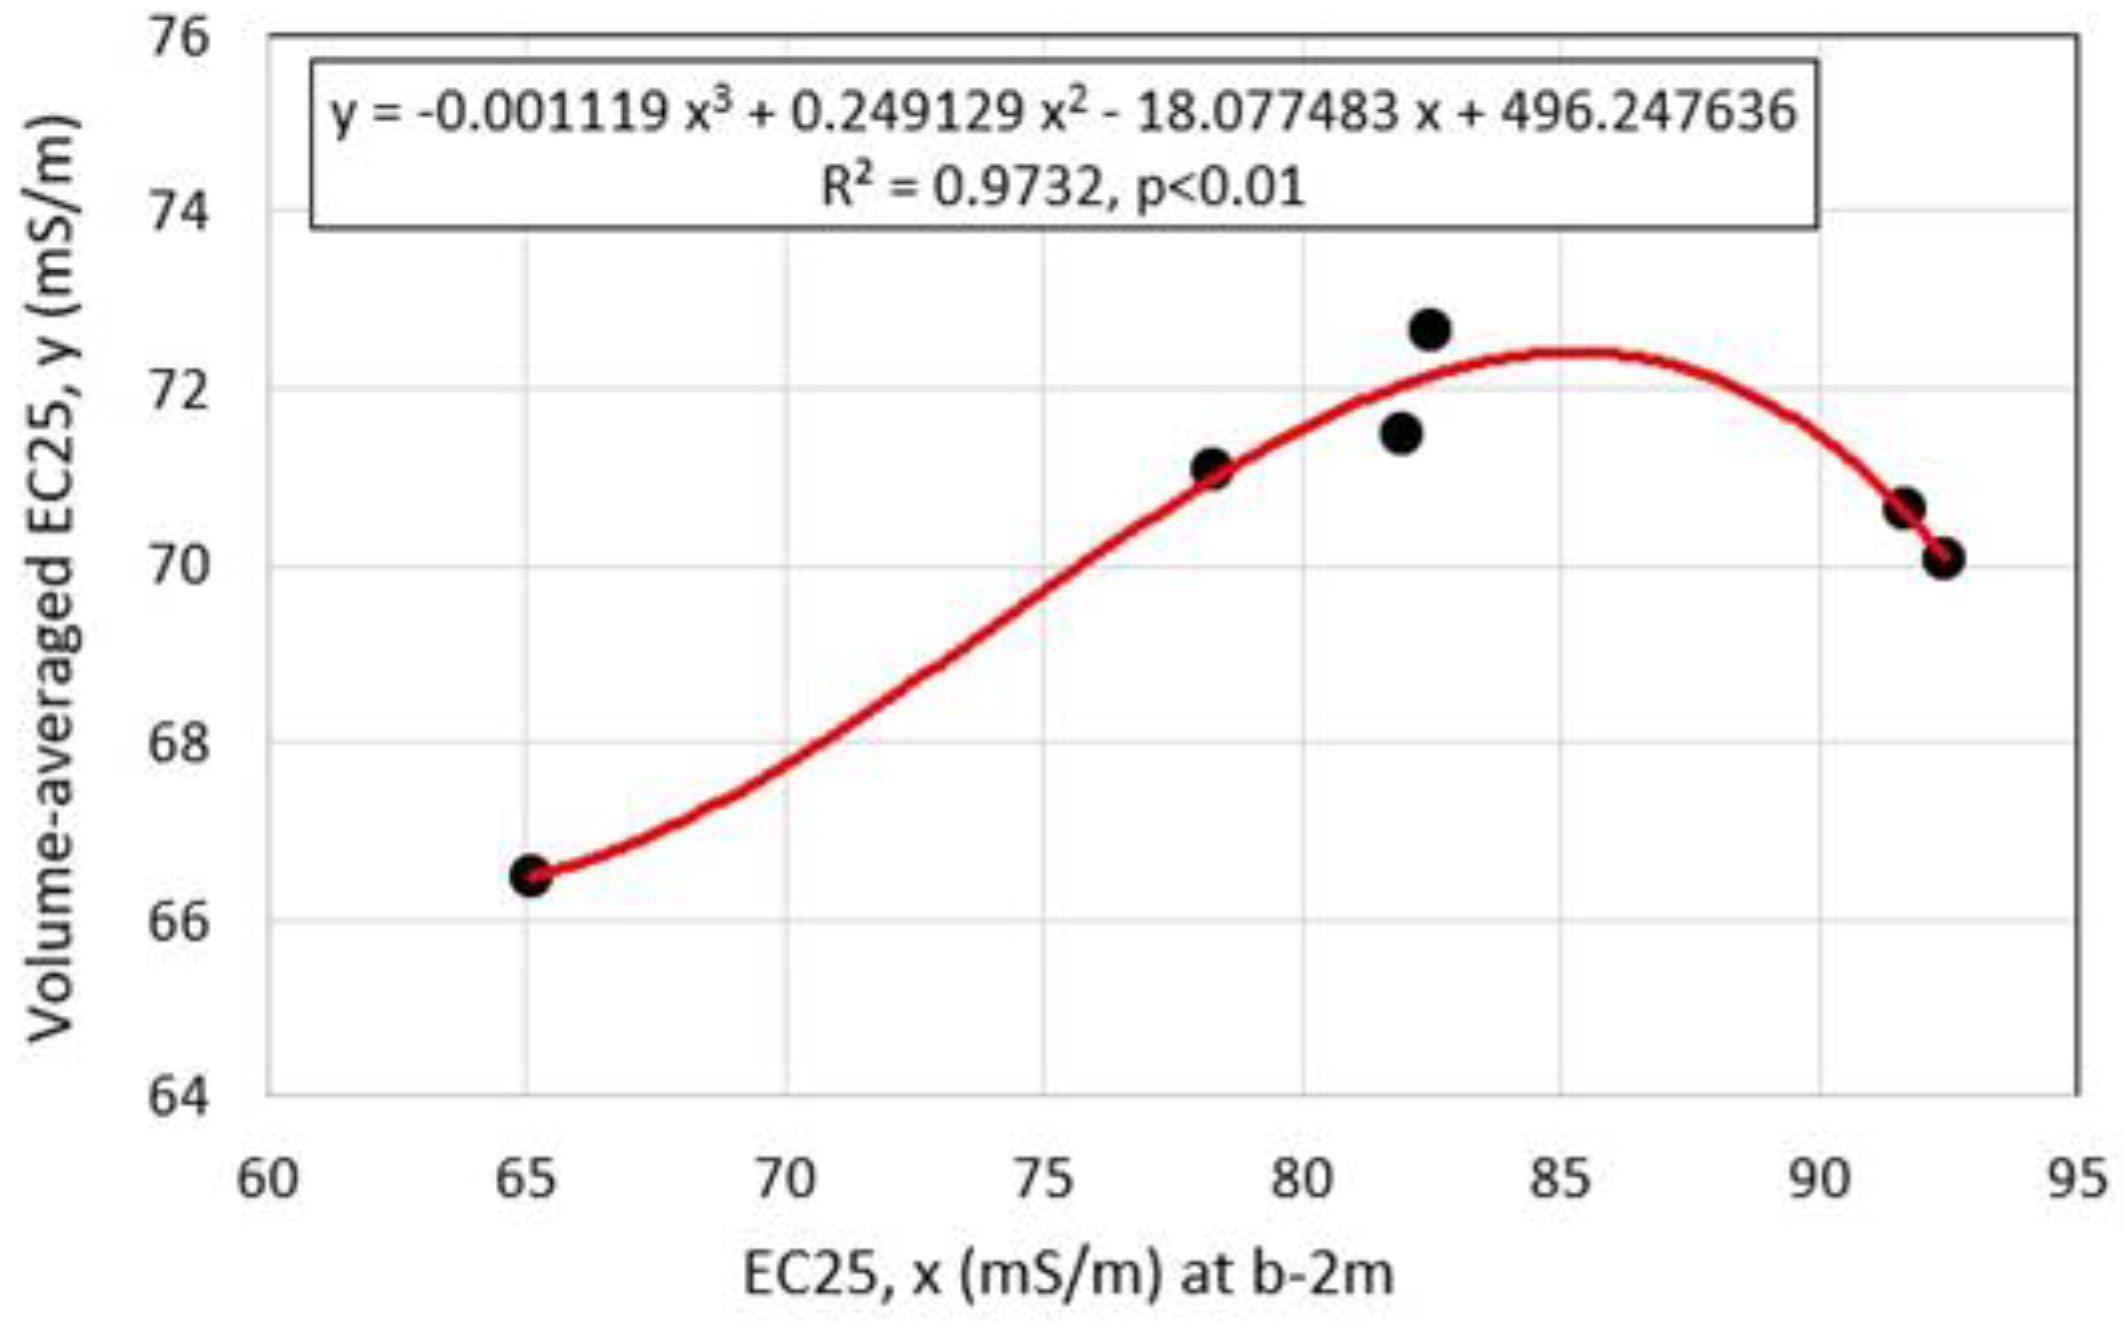
Using Figure 4a, the EC25 values of the EC logger at 2 m above the bottom of site MD were converted to daily series of the SO42− concentration. Thereafter, the volume-averaged SO42− concentration as CL in Equation (5) was acquired by using the relationship between the logger’s EC25 values and the volume-averaged EC25 values from the five vertical profiles in Figure 7b and a profile of 29 September 2021 (Figure 18). Upon acquisition of the relation in Figure 18, the horizontal multi-layered structure of the chemistry in the lake was assumed (here, the same EC25 at the same depth everywhere in the lake), and the bathymetric map of Figure 1b was applied. The relationship in Figure 18 was not linear, because the EC25 values of the profiles were similar at depths of 0–16 m, but the EC25 at 2 m above the bottom then varied greatly (Figure 9b).
Total stream inflow measured on non-rainfall days was given as the river inflow Rin in Equations (1) and (5). The mean SO42− concentration, 823 mg/L, of pore water in the bottom sediment at site MD, was adopted as that of groundwater inflow [7].
Table 1 shows the mean lake levels, the net groundwater inflow (G = Gin − Gout), and separated groundwater inflow Gin and groundwater outflow Gout calculated for the four non-rainfall periods of May–September 2021 (Figure 12 and Figure 14). For the non-rainfall periods, the first day after a rainfall event was omitted because the water supply by a rainfall event appears to raise the lake level with a time lag of a day (Figure 12). For comparison, the calculated results for non-rainfall periods of August–October 2020 are also shown with the lake levels [7].
The net groundwater inflow G was positive only for the periods of increasing lake level in May and June 2021 ((4) and (5) periods in Table 1). This leads us to the conclusion that, compared with the Gin in the rainfall season without snow in the catchment, the Gin in the snowmelt season is relatively large due to the percolation of snowmelt water plus rainwater. Then, the Gout was relatively small. In July–October, when the lake level was relatively high, the G was negative, and thus Gout was larger than Gin. Then, the Gin was relatively small. Hence, it is seen that Gin and Gout are both sensitive to changes in the lake level.
Figure 19 shows the relationship between calculated Gin or Gout and the mean lake level in the periods of the calculation. There is a clear linear relationship between the lake level and Gin or Gout. This means that the lake level seasonally changes in response to the groundwater inflow and the groundwater outflow responds to the lake level change with high sensitivity. The former case occurs in the snowmelt season under the precedent condition of the consistent decrease in lake level in the completely ice-covered period (Figure 14). When the lake level is replaced by the lake volume as shown in Figure 15, the latter case is consistent with the conclusion that, in the caldera or crater lakes, the magnitude of groundwater outflow is highly correlated with the lake volume [7]. The high correlations reflect a hydrological feature of the volcano indicating the high permeability for the percolation in the catchment surrounding the lake and the leakage from the lake.
There is a problem in that the SO42− concentration (=823 mg/L) of Gin was assumed to be equal to that of pore water in the bottom sediment sampled at site MD. The SO42− concentration of Gin in the snowmelt season may be smaller than that of the pore water. However, the stiff diagrams for the stream water and spring water (Figure 3) and the Nigori River water and the mineralogical results in Figure 5 and Figure 6 suggest that the SO42− dissolution from hemihydrate gypsum and sulfur dioxide prevails in or around the Okama catchment. Thus, even in the snowmelt season, the SO42− concentration of Gin could be as high as that of pore water. That said, it is necessary to examine whether the SO42− concentration of pore water is valid for all the inflowing groundwaters by more estimation of the chemical and hydrological budgets.

6. Conclusions

In order to explore a water cycle system and a geothermal condition of a crater lake, the Okama, in the Zao Volcano, data on the hydrometeorology, lake level, and water temperature were acquired throughout the year, and then the geothermal heat flux in the lake and hydrological and chemical budgets of the lake were estimated. The water temperature monitored in the completely ice-covered period of December 2021–April 2022 revealed that water temperature consistently increased between the lake bottom and 15 m above the bottom. The temperature increase is probably due to the geothermal leakage from the heat source at ca 190 m below the lake bottom. The geothermal heat flux calculated as the 10-day moving average varied at a range of −0.4–5.5 W/m2. During the temperature increase, the water temperature averaged over the whole heated layer was calculated and accumulated. As a calculated result, the mean water temperature increased from 1.08 °C to 1.56 °C from 16 December 2021 to 28 February 2022. This small increase reflects an aspect of the stagnant volcanic activity in or around the Okama.
The groundwater inflow Gin and groundwater outflow Gout in the Okama were evaluated by estimating hydrological and chemical budgets in the open water season of May–September 2021. By adding the Gin and Gout values obtained in 2020 to those in 2021, the magnitudes of Gin and Gout were highly correlated to the lake level or lake volume. This indicates that the scale of the groundwater cycle system is controlled by the lake level or lake volume. It is very important to continuously watch how the water cycle system and the geothermal heat flux change following volcanic activity in the future since such changes could be directly connected to changes in the signals of volcanic tremors, crustal movements, fumarolic activity, etc. for the eruption of the Zao Volcano.

Author Contributions

Conceptualization, K.A.C.; methodology, K.A.C., A.G., J.O., T.Y. and H.O.; formal analysis, K.A.C. and T.Y.; investigation, K.A.C.; resources, K.A.C., A.G., and J.O.; data curation, K.A.C., T.Y. and H.O.; writing—original draft preparation, K.A.C.; writing—review and editing, A.G. and J.O.; visualization, K.A.C., A.G. and J.O.; supervision, K.A.C.; project administration, A.G.; funding acquisition, K.A.C. and A.G. All authors have read and agreed to the published version of the manuscript.

Funding

This research was funded by the Earthquake Research Institute, the University of Tokyo, Japan, 2021-KOBO22, JSPS KAKENHI Grant Number JP21K03675, Center for Northeast Asian Studies, Tohoku University, Japan, 2022 and the Arctic Research Center, Hokkaido University, Japan, 2022.

Data Availability Statement

The data presented in this study are available following a request to the corresponding author and his permission. The chemical data of Figure 3 are contained in Table A2 within the article.

Acknowledgments

We are indebted to S. Miura and M. Yamamoto, Tohoku University, Japan, for their welcome support in our observations at the Daikokuten Observation hut. We are grateful to M. Ichiki, Tohoku University, for his useful information about a geothermal heat source below the Okama.

Conflicts of Interest

The authors declare no conflict of interest.

Appendix A

Table A1. Parameters in Equations (1)–(3) and (5).
SymbolParameterUnit
A0Lake surface aream2
aEDimensionless bulk transfer coefficient for latent heatNon-dimensional
EEvaporationmm/day, m/s
ezWater vapor pressure at zPa
e0Saturated water vapor pressure at lake surface temperaturePa
GinGroundwater inflowm3/s, m3/day
GoutGroundwater outflowm3/s, m3/day
VLake water volumem3
ttimesec, day
PPrecipitationmm/h, mm/day, m/day, m/s
pAir pressurePa
QELatent heat flux for evaporationW/m2
RinStream inflowm3/s, m3/day
uzWind speedm/s
zHeight above the lake surfacem
βRatio of water vapor density to dray air densityNon-dimensional
λLatent heat for evaporationJ/kg
raAir densitykg/m3
rwWater densitykg/m3
CRinIonic concentration of inflowing stream waterg/L
CPIonic concentration of precipitationg/L
CGinIonic concentration of inflowing groundwaterg/L
CLVolume-averaged ionic concentration of lake waterg/L
SNet depositional fluxKg/s

Appendix B

Table A2. Ionic concentrations in mEq/L for the stiff diagrams of Figure 3.
SampleDateIonic Concentration (mEq/L)
Na+K+Ca2+Mg2+ClHCO3SO42−
Okama water8 May 20210.2770.0271.2090.3180.0410.002.906
28 September 20210.3130.0472.0910.3140.1000.004.518
Goshiki water8 May 20210.0720.0110.2120.0500.0290.000.333
28 September 20210.2610.0410.7960.2680.0810.001.439
Surface water at site S8 May 20210.4710.0348.9380.4670.0290.0025.32
28 September 20211.2170.05521.3541.5340.0670.0051.21

References

  1. Jasim, A.; Hemmings, B.; Mayer, K.; Bettina Scheu, B. Groundwater flow and volcanic unrest. In Volcanic Unrest; Gottsmann, J., Neuberg, J., Scheu, B., Eds.; Advances in Volcanology; Springer: Cham, Switzerland, 2019; pp. 83–99. [Google Scholar] [CrossRef] [Green Version]
  2. Niida, K.; Katsui, Y.; Suzuki, T.; Kondō, Y. The 1977–1978 Eruption of Usu Volcano. J. Fac. Sci. Hokkaido Univ. Ser. 4 Geol. Mineral. 1980, 19, 357–394. Available online: https://eprints.lib.hokudai.ac.jp/dspace/handle/2115/36693 (accessed on 20 January 2023).
  3. Akita, F.; Tsuneda, Y.; Urakami, K. Thermal water flow system in the Toya-ko hot spring area, southwestern Hokkaido, Japan. J. Hot Spring Sci. 2003, 50, 204–220. Available online: http://www.j-hss.org/journal/back_number/vol50_pdf/vol50no4_204_220.pdf (accessed on 20 January 2023).
  4. Tomiya, A.; Miyagi, I.; Hoshizumi, H.; Yamamoto; Kawanabe, Y.; Satoh, H. Essential material of the March 31, 2000 eruption of Usu Volcano: Implication for the mechanism of the phreatomagmatic eruption. Bull. Geol. Surv. Jpn. 2001, 52, 215–229. Available online: https://www.gsj.jp/data/bulletin/52_04_11.pdf (accessed on 20 January 2023). [CrossRef] [Green Version]
  5. Goto, A.; Kagiyama, T.; Miyamoto, T.; Yokoo, A.; Taniguchi, H. Long-term prediction of Usu volcano 2000 eruptive activity based on the measurements of heat discharge rate. Geophys. Bul. Hokkaido Univ. 2007, 70, 137–144. [Google Scholar] [CrossRef]
  6. Chikita, K.A.; Ochiai, Y.; Oyagi, H.; Sakata, Y. Geothermal linkage between a hydrothermal pond and a deep lake: Kuttara Volcano, Japan. Hydrology 2019, 6, 4. [Google Scholar] [CrossRef] [Green Version]
  7. Chikita, K.A.; Goto, A.; Okada, J.; Yamaguchi, T.; Miura, S.; Yamamoto, M. Hydrological and chemical budgets of Okama Crater Lake in active Zao Volcano, Japan. Hydrology 2022, 9, 28. [Google Scholar] [CrossRef]
  8. Whiteford, P.C. Evidence for Geothermal Areas Beneath Lake Taupo from Heat Flow Measurements. In Proceedings of the 14th New Zealand Geothermal Workshop, Auckland, New Zealand, 4–6 November 1992; pp. 185–188. Available online: https://www.geothermal-energy.org/pdf/IGAstandard/NZGW/1992/Whiteford.pdf (accessed on 20 January 2023).
  9. Tivey, M.A.; de Ronde, C.E.J.; Tontini, F.C.; Walker, S.L.; Fornari, D.J. A novel heat flux study of a geothermally active lake—Lake Rotomahana, New Zealand. J. Volcan. Geotherm. Res. 2016, 314, 95–109. [Google Scholar] [CrossRef]
  10. Candela-Becerra, L.J.; Toyos, G.; Suárez-Herrera, C.A.; Castro-Godoy, S.; Agusto, M. Thermal evolution of the Crater Lake of Copahue Volcano with ASTER during the last quiescence period between 2000 and 2012 eruptions. J. Volcan. Geotherm. Res. 2020, 392, 106752. [Google Scholar] [CrossRef]
  11. Brehme, M.; Giese, R.; Suherlina, L.; Kamah, Y. Geothermal sweetspots identified in a volcanic lake integrating bathymetry and fluid chemistry. Sci. Rep. 2019, 9, 16153. [Google Scholar] [CrossRef] [Green Version]
  12. Ban, M.; Oikawa, T.; Yamazaki, S. Geologic map of Zao Volcano; Geological Survey of Japan, AIST: Tokyo, Japan, 2015; 8p. [Google Scholar]
  13. Ban, M.; Oikawa, T.; Yamazaki, S.; Goto, A.; Yamamoto, M.; Miura, S. Prediction of eruption courses in volcanoes without eruptions under modern observation system: Example of Zao Volcano. Volcano 2019, 64, 131–138. [Google Scholar]
  14. Sendai Reginal Headquarters, JMA. Explanatory Material of Zao Volcano. Explan. Mater. 2023, 1–4. Available online: https://www.data.jma.go.jp/svd/vois/data/tokyo/STOCK/monthly_v-act_doc/sendai/22m12/212_22m12.pdf (accessed on 13 January 2023).
  15. Konno, Y. Nigori-gawa, an acid stream originated from the crater-lake “Okama” of Mt. Zao. Jpn. J. Limnol. 1936, 6, 21–26. [Google Scholar] [CrossRef]
  16. Kondo, J. Meteorology in Aquatic Environments; Asakura Publishing Ltd.: Tokyo, Japan, 1994; 350p. [Google Scholar]
  17. Chikita, K. A field study on turbidity currents initiated from spring runoffs. Water Res. Res. 1989, 25, 257–271. [Google Scholar] [CrossRef]
  18. Chikita, K.A.; Smith, N.D.; Yonemitsu, N.; Perez-Arlucea, M. Dynamics of sediment-laden underflows passing over a subaqueous sill: Glacier-fed Peyto Lake, Alberta, Canada. Sedimentology 1996, 43, 865–875. [Google Scholar] [CrossRef]
  19. Asif Ali, A.; Chiang, Y.W.; Santos, R.M. X-ray Diffraction Techniques for Mineral Characterization: A Review for Engineers of the Fundamentals, Applications, and Research Directions. Minerals 2022, 12, 205. [Google Scholar]
  20. Freedman, L.C.; Erdmann, D.E. Quality assurance practices for the chemical and biological analyses for water and fluvial sediments. In Techniques of Water-Resources Investigations of the United States Geological Survey; US Government Printing Office: Washington, DC, USA, 1982; Chapter A6; 181p. [Google Scholar]
  21. Yanagisawa, F.; Nakagawa, N.; Abe, H.; Yano, K. Chemical composition of snow cover and rime at Mt. Zao, Yamagata Prefecture, Japan. Seppyo 1995, 58, 393–403. [Google Scholar] [CrossRef] [Green Version]
  22. van Hinsberg, V.J.; Berlo, K.; Pinti, D.L.; Ghaleb, B. Gypsum precipitation from volcanic effluent as an archive of volcanic activity. Front. Earth Sci. 2021, 9, 764087. [Google Scholar] [CrossRef]
  23. Bunaciu, A.A.; UdriŞTioiu, G.E.; Aboul-Enein, H.Y. X-ray diffraction: Instrumentation and applications. Crit. Rev. Anal. Chem. 2015, 45, 289–299. [Google Scholar] [CrossRef]
  24. Horai, H.; Kamei, T.; Ogawa, Y.; Shibi, T. Development of bassanite production system and its geotechnical engineering significance—Recycling of waste plasterboard. Jpn. Geotech. J. 2008, 3, 133–142. [Google Scholar] [CrossRef] [Green Version]
  25. Adachi, M.; Tanimoto, A. On the equations representing solubility of calcium sulfate in pure water. Gypsum Lime 1975, 135, 17–26. [Google Scholar]
  26. Singh, N.B.; Middendorf, B. Calcium sulphate hemihydrate hydration leading to gypsum crystallization. Prog. Cryst. Growth Charact. Mater. 2007, 53, 57–77. [Google Scholar] [CrossRef]
  27. Blodau, C. A review of acidity generation and consumption in acidic coal mine lakes and their watersheds. Sci. Total Environ. 2006, 369, 307–332. [Google Scholar] [CrossRef] [PubMed]
  28. Kanie, K.; Muramatsu, A.; Suzuki, S.; Waseda, Y. Effects of sulfate irons on conversion of Fe(OH)3 gel to β-FeOOH and α-Fe2O3. Bull. Inst. Adv. Mater. Process. Tohoku Univ. 2005, 60, 21–27. Available online: http://hdl.handle.net/10097/30818 (accessed on 12 February 2023).
  29. Chikita, K.A. Sedimentation by river-induced turbidity currents: Field measurements and interpretation. Sedimentology 1990, 37, 891–905. [Google Scholar] [CrossRef]
  30. Lambert, A.M.; Kelts, K.R.; Marshall, N.F. Measurements of density underflows from Walensee, Switzerland. Sedimentology 1976, 23, 87–105. [Google Scholar] [CrossRef]
  31. Ichiki, M.; Kaida, T.; Yamamoto, M.; Miura, S.; Kanda, W.; Ushioda, M.; Seki, K.; Morita, Y.; Uyeshima, M. An electrical resistivity exploration of Zao volcano, using audio-frequency magnetotelluric method to evaluate the eruption potential field. In Proceedings of the Fall Meeting 2021, Online, 20–22 October 2021; Volcanological Society of Japan: Hokkaido, Japan, 2021; pp. 1–14. [Google Scholar]
  32. Umetsu, Y. Gypsum from neutralization of sulfuric acid solution with lime stone. Gypsum Lime 1991, 234, 31–37. [Google Scholar] [CrossRef]
  33. Ozair, G. An overview of calcium carbonate saturation indices as a criterion to protect desalinated water transmission lines from deterioration. Nat. Environ. Pollut. Technol. 2012, 11, 203–212. Available online: https://neptjournal.com/index.php/search/Ozair (accessed on 13 February 2023).
Figure 1. Location of the study area (red square on the upper left map) in Miyagi Prefecture, Japan, and (a) location of observation sites (site L: lake level, site M: meteorology, site S: water sampling: site MD: mooring system) in the catchment on the topographic map (10 m contour). Site MD is the deepest point of Okama Crater Lake. The dot-dashed line shows a water divide of the Okama including the peak (red triangle) of Mt. Goshiki, and the dashed line indicates the uppermost part of the water divide of the Nigori River. River water sampling was performed at site N. (b) The bathymetric map of the Okama accompanied by three inflowing streams [7] and the whitish water inflow at site S.
Hydrology 10 00054 g001
Figure 2. Mooring system for fixing ten loggers at site MD in 2021.
Hydrology 10 00054 g002
Figure 3. Stiff diagrams of (a,b) lake surface water, (c,d) Goshiki Stream water, and (e,f) spring water from the volcanic silty layer (site S in Figure 1). The (a,c,e) waters were sampled on 8 May 2021, and the (b,d,f) waters on 28 September 2021.
Hydrology 10 00054 g003
Figure 4. Relationships between EC25 (mS/m) and (a) SO42− concentration (mg/L) and (b) pH for the lake, stream, and spring waters.
Hydrology 10 00054 g004
Figure 5. Mineralogy of the silty layer identified by X-ray diffraction. θ: Bragg angle (°). The two marked peaks of hemihydrate gypsum exist as a mineralogical feature.
Hydrology 10 00054 g005
Figure 6. Mineralogy of the bottom sediment identified by X-ray diffraction. θ: Bragg angle (°). The peaks of Akaganéite exist as a mineralogical feature.
Hydrology 10 00054 g006
Figure 7. (a) Grain size distribution for a silty layer and (b) gypsum crystals, contained in the silty layer, on a stainless sieve.
Hydrology 10 00054 g007
Figure 8. Grain size distribution for the bottom sediment at site MD.
Hydrology 10 00054 g008
Figure 9. Vertical distributions of (a) water temperature, (b) electric conductivity at 25 °C (EC25), (c) SO42− concentration, and (d) pH at site MD in May 2021–May 2022.
Hydrology 10 00054 g009
Figure 10. Vertical distributions of (a) water turbidity, (b) dissolved oxygen (DO), and (c) chlorophyll at site MD in May 2021–May 2022.
Hydrology 10 00054 g010
Figure 11. Temporal variations in hourly water temperature between the lake bottom and 0.1 m depth at site MD for 1 November 2021–17 May 2022. The labels, b-1 m, b-2 m, b-5 m, b-10 m, and b-15 m show water temperature at the heights of 1 m, 2 m, 5 m, 10 m, and 15 m above the bottom, respectively. The black arrow corresponds to the completely ice-covered period of 13 December 2021–23 April 2022, when the water temperature at 0.1 m depth is almost 0 °C.
Hydrology 10 00054 g011
Figure 12. Temporal variations in daily mean air temperature, relative humidity, wind speed, solar radiation, lake level, 0.1-m depth water temperature, and diurnal rainfall for 19 May–27 September 2021.
Hydrology 10 00054 g012
Figure 13. Relationship between (a) air temperature and (b) air pressure between Daikokuten and the Okama (site M) by using the hourly data of 1–28 September 2021.
Hydrology 10 00054 g013
Figure 14. Temporal variations in hourly lake level, 0.1 m depth water temperature, rainfall, and air temperature at Okama for 31 July 2020–31 May 2022. The black arrows and red arrows show the completely ice-covered periods and the periods for calculating groundwater inflow and outflow.
Hydrology 10 00054 g014
Figure 15. Relationship between the daily mean lake level and lake volume acquired by the 2020–2021 data.
Hydrology 10 00054 g015
Figure 16. Temporal variations in daily (blue line) or 10-day moving average (red line) heat flux (W/m2) at the bottom and the cumulative volume-averaged water temperature (black line) in the heated layer for 15 December 2021–28 February 2022.
Hydrology 10 00054 g016
Figure 17. Temporal variations in (a) daily mean lake volume, diurnal total evaporation E·A0, and diurnal total rainfall P·A0 in May–September 2021 (Figure 12), and (b) calculated diurnal net groundwater inflow, observed diurnal river inflow, the total evaporation E·A0, and daily mean lake volume in the non-rainfall periods.
Hydrology 10 00054 g017
Figure 18. Relationship between the volume-averaged EC25 from the six profiles and the EC25 from the EC logger at 2 m above the bottom of site MD.
Hydrology 10 00054 g018
Figure 19. Relations between the lake level and (a) groundwater inflow Gin or (b) groundwater outflow Gout calculated in 2020 and 2021 (Table 1).
Hydrology 10 00054 g019
Table 1. Measured mean lake level, calculated net groundwater inflow (Gin − Gout), and separated groundwater inflow Gin and groundwater outflow Gout for the non-rainfall periods of more than three days in 2020 and 2021.
No.PeriodLake Level (m)Gin − Gout (m3/s)Gin (m3/s)Gout (m3/s)
(1)3–6 August 20205.57−0.0200.0160.036
(2)19–28 August 20205.26−0.0350.0120.047
(3)30 September–4 October 20204.78−0.0280.0070.035
(4)29 May–3 June 20211.830.0250.0370.012
(5)5–13 June 20212.480.0260.0400.014
(6)15–20 July 20213.62−0.0070.0120.019
(7)10–14 September 20213.77−0.0130.0140.027
Disclaimer/Publisher’s Note: The statements, opinions and data contained in all publications are solely those of the individual author(s) and contributor(s) and not of MDPI and/or the editor(s). MDPI and/or the editor(s) disclaim responsibility for any injury to people or property resulting from any ideas, methods, instructions or products referred to in the content.