Abstract
Determining optimal exploitation from aquifers is always a major challenge, especially for aquifers facing a drop in their groundwater level. In aquifers with artificial recharge, more complex algorithms are required to determine the optimal exploitation amount. Therefore, in this study, the optimal amount of harvest from the exploitation wells has been determined using a combined simulation–optimization model considering the artificial recharge in Yasouj aquifer in Iran. The model is based on a combination of MODFLOW code and gene expression programming (GEP) simulator tool to simulate the aquifer and particle swarm optimization (PSO) to maximize the total exploitation from the aquifer. The simulation results showed that the artificial recharge was ineffective in maximum exploitation from the aquifer. As a result, considering several constraints, including the maximum pumping rate from the aquifer and the permissible drop in the groundwater level, the maximum exploitation from the aquifer was defined as the objective function. The optimization results showed that the optimal exploitation rate is equal to 8.84 million cubic meters (MCM) per year, and only 74% of the water from artificial recharge can be used based on this amount. Additionally, the most appropriate locations to exploit this amount of water are the northwest and east of the aquifer. According to the findings, it is suggested to ban exploitation from the central and southern parts of the aquifer due to the low groundwater level. The results of the sensitivity analysis show that the reduction in the maximum exploitation rate along with a 50% drop in the groundwater level play an effective role in decreasing the optimal exploitation amount.
1. Introduction
Owing to increases in cultivated area, rapid population growth, urban sprawl, and industrial development, water demand has continuously increased in recent decades, leading to increased stress on available water resources. This crisis has intensified in arid and semiarid areas due to the lack of surface water resources [1]. A significant part of the current crises in these areas is mainly caused by improper water resources management. Groundwater resources are the main and reliable water supplies in arid and semiarid regions, such as Iran, where groundwater recharge feeds aquifers supplying fresh water to a population over 80 million, a global hotspot for groundwater depletion [2]. At the other extreme, a severe decline in precipitation in the past few decades created an acute drought that negatively impacted around 90% of Iran [3]. Therefore, adoption of comprehensive plans to control the critical conditions of water shortage are vital [4,5]. Various implementation of strategies for groundwater resources management are available such as closing unauthorized wells, artificial recharge, and optimal management of exploitation to prevent the continuous decline of the aquifer [6,7,8].
Among these strategies, reestablishing the balance between the amount of groundwater withdrawal and recharge is essential to sustainably harvest groundwater resources, especially at (semi)arid regional scales such as Iran, which is known as a global hotspot with respect to groundwater depletion. Artificial recharge can be adopted to replace part of the exploited groundwater through excess surface water resources caused by floods, especially in areas with adequate rainfall. On the other hand, the results suggest nonsignificant changes in annual mean precipitation in Iran (2000–2018). This indicates that human interventions have dominantly impacted the decline in Iran’s groundwater recharge [2]. Therefore, optimal exploitation management is essential for proper monitoring of aquifer utilization. Hence, the two strategies of artificial recharge and optimizing management of groundwater exploitation are of great importance as two practical techniques in arid and semiarid regions. Studies show that a lack of optimal management of exploitation of wells in the aquifer would lead to various issues such as the reduction in groundwater reserves, land subsidence, water quality degradation, aquifer salinization, river flow reduction, and destruction of ecosystems dependent on groundwater resources. Moreover, during the last three decades, simulation–optimization models have proven to be quite helpful for water resources management. In addition, evolutionary algorithms have been used on a large scale in the field of water resources management. The combination of simulation models with algorithms together has led to an increase in the performance of water resources models [8,9,10,11,12,13,14,15,16,17].
Literature Review
Gaur et al. combined the analytic element method (AEM) simulator and PSO to develop a simulation–optimization model to maximize the amount of exploitation from new wells in the Dour River Basin of France and to minimize costs [6]. Kumar et al. used the combination of the support vector machine (SVM) and PSO to determine the optimal exploitation rates, suitable locations for exploitation wells, and the optimal pumping rate [18]. Kamali and Niksokhan presented a multiobjective optimization–simulation model for the Isfahan–Barkhar aquifer using PSO [19]. In another study, Shourian and Davoudi solved the problem of optimizing the location of the pumping well and the amount of exploitation from the aquifer in the Kerman region, Iran, using the simulation–optimization method using Processing MODFLOW for Windows (PMWIN) and the firefly optimization algorithm. They reported that soil subsidence stopped after implementing the optimal model [20]. Alaviani et al. studied two options for groundwater exploitation and conjunctive exploitation of water resources in the Hashtgard basin, Iran, using the Groundwater Modeling System (GMS) and PSO to minimize the drop in the aquifer level. The results showed that the best solution was the conjunctive use of all available water resources in each zone [21]. Ghaseminejad and Shourian modeled the Sarakhs aquifer in Iran by combining MODFLOW and the PSO algorithm to determine the optimal location and pumping capacity to meet the existing water demand [15]. Using the integrated approach of SWAT_MODFLOW_PSO method, Sabzzadeh and Shourian estimated the optimal amount of exploitation from the Asman Abad aquifer in Iran by considering the maximum net profit from agricultural products as the objective function [22]. In a study on the Puri aquifer, Dey and Prakash simulated saline water and optimized the number and location of pumping wells. They showed that in addition to doubling the pumping speed, further infiltration of saline water into the aquifer could be prevented by using the optimal model [23]. Fan et al. presented a simulation–optimization method applied to Longkou city, China, with the aim of maximizing groundwater exploitation and minimizing seawater intrusion. They used SVR, KELM, and kriging models for simulation and the nondominated sorting genetic algorithm (NSGA-II) for optimization [24]. The results showed that the proposed method could solve the problem of managing coastal aquifers. The literature shows that the combination of groundwater simulation models along with evolutionary algorithms such as optimization tools is a common approach which has been used in various studies to achieve the desired objective function. However, directly applying the simulation results for large aquifers in the optimization model creates a model that has a search space with high dimensions, where solving such problems is complex and time-consuming. To solve this issue, metaheuristic algorithms can be used as the external interface of simulator and optimizer models to reduce the dimensions of the search space and accelerate the optimization procedure. In this method, which is cost efficient and needs less processing time, the simulator model is approximated to create an interface between the simulation and optimization models, and the approximated model is then used for optimization [25]. This approximation can be performed using various methods [14]: artificial neural networks (ANN) [25,26], fuzzy linear regression [27], regression models [14,28], kernel extreme learning machines (KELM) [29], SVM [30], kriging–KELM–SVM [24], response matrix method [1], and genetic programming (GP) and multigene genetic programming (MGGP) [31]. Owing to the efficient performance of the genetic algorithm (GA) in optimization problems, in this current study, an approach is developed which comprises a simulation model and gene expression programming (GEP) for the simulation—optimization process of aquifer exploitation under artificial recharge.
Recent studies show the diversity and development of new methods in solving water resources management problems. However, there is always a need for new management approaches and definition of more comprehensive objective functions due to the severe crisis of water shortage, especially in arid and semiarid regions with complex groundwater systems. This research was conducted in the Yasouj aquifer basin, which is located in an arid area of Iran and suffers from a severe groundwater drop. The main goal is to investigate the effectiveness of artificial recharge on the aquifer and to estimate the optimal amount of exploitation in such a way that there will be no groundwater level drop. In the present study, in addition to assessing the effectiveness of the artificial recharge in the Yasouj aquifer, a simulation–optimization approach is developed which is capable of managing the amount of exploitation from the recharged water. In this approach, MODFLOW and the GEP algorithm were used to simulate the groundwater flow and the effectiveness of the artificial recharge, and optimal aquifer exploitation was defined using PSO. It is anticipated that the integrated approach developed in this study provides a reliable solution to optimize the exploitation of aquifers under artificial recharge, thus contributing to overall groundwater management efforts.
2. Study Area
The Yasouj Plain (30°10′–30°27′ N, 50°15′–50°21′ E) is located in Kohgiloyeh and Boyer Ahmad Province, southwest Iran. The Yasouj aquifer has an area of 54.1 km2 (Figure 1). The average rainfall in the area is 600 mm, mainly due to the high altitude regions in the area. However, despite high rainfall and the small area of the aquifer, most of the required water is supplied from groundwater resources. In recent years, the groundwater level has dropped remarkably due to decreased rainfall, decline in recharge and excessive groundwater exploitation [2,32]. Therefore, in order to prevent the excessive drop of the groundwater level and to control the flooding of river water and atmospheric precipitation, areas have been considered to control precipitation and surface flows as the artificial recharge plan. Out of these areas, five are located on the Yasouj aquifer. Their locations are on alluvial layers, being suitable for aquifer recharge. Two are inactive due to the lack of dredging of the canal bed, a challenge observed in some plains in Iran, and only three areas are active and usable, the largest of which is Naserabad, located in the northeast of the aquifer (Table 1) [2].
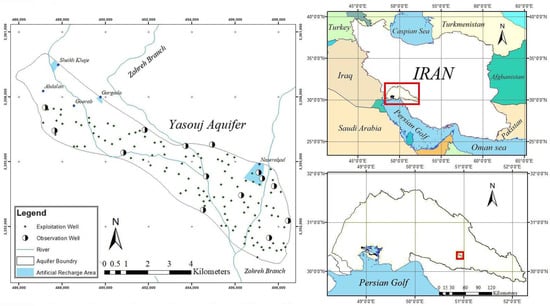
Figure 1.
The location of the Yasouj aquifer, Iran.

Table 1.
The properties of the artificial recharge areas.
The artificial recharge plan for the Yasouj aquifer will be implemented with the main goal of increasing the amount of exploited groundwater in the three regions: Gargada, Sheikh Khaje, and Naserabad (Figure 1). According to the previously conducted studies, the artificial recharge showed a decreased trend during the last decades. Here, the annual average amount of artificial recharge in the Yasouj aquifer is considered equal to 1 MCM per year. Owing to the high volume of exploitation in the three designated periods (September 2018–November 2018, March 2019–May 2019, and June 2019–August 2019), exploiting recharge water is allowed during these seasons [2,32]. Based on initial data, groundwater exploitation in the three determined periods is equal to 8.08 MCM and after artificial recharge, it will be 9.08 MCM.
3. Methodology
For the optimal exploitation of the aquifer under artificial recharge, a simulation–optimization model is presented, which includes three main steps (Figure 2). Step 1 includes a numerical simulation that considers the flow of groundwater and the effectiveness of the artificial recharge. Step 2 utilizes GEP to estimate the drop in groundwater level due to various aquifer exploitations. Step 3 involves an optimization model based on PSO to propose optimal management of aquifer exploitation and estimate the permissible withdrawal volume from the recharged water. All three steps are performed to check the state and decision variables. Groundwater level drop is the state variable, the value of which is obtained in Step 1 based on the groundwater flow simulation model. The decision variable is the pumping rate, and its optimal values are calculated in Step 3 using the optimization model.
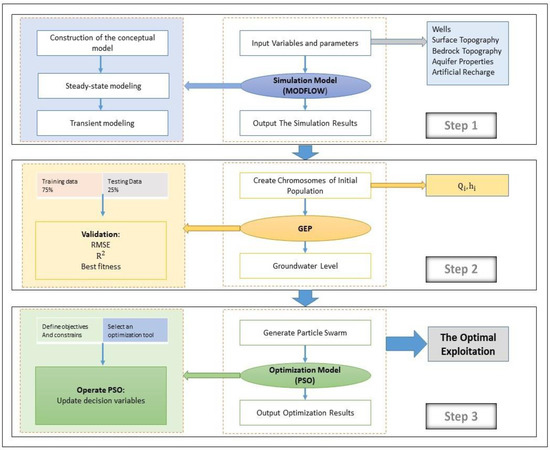
Figure 2.
Proposed simulation–optimization model for optimal groundwater exploitation under artificial recharge.
3.1. Simulation Model of Groundwater
The MODFLOW code is one of the most common groundwater flow simulation codes that simulate the aquifer based on the finite difference method [33]. There are 21 observation wells in the Yasouj aquifer, where the information from 14 wells was used for modeling using GMS, which is designed based on MODFLOW (Figure 1). The model consists of a grid with dimensions 51 × 39, and the dimension of each cell is 250 × 250 m in one layer. The thickness of the aquifer in the model varies from 80 to 260 m. The water flows from the northwest and eastern parts of the aquifer (with higher groundwater levels) to the central and southern parts of the aquifer (with lower groundwater levels), and then to the outlet of the aquifer. Figure 3 shows the boundary of the aquifer, as well as the inlet and outlet fronts of the aquifer. The Yasouj aquifer is recharged by the infiltration of rainwater, return flow, and the water from the Zohreh River. About 18% of monthly precipitation is considered as infiltration from rainfall. It should be mentioned that a significant part of the exploitation of this aquifer is for agricultural purposes, with a 30% of return flow. Finally, 10% of the river water is considered for aquifer recharge.
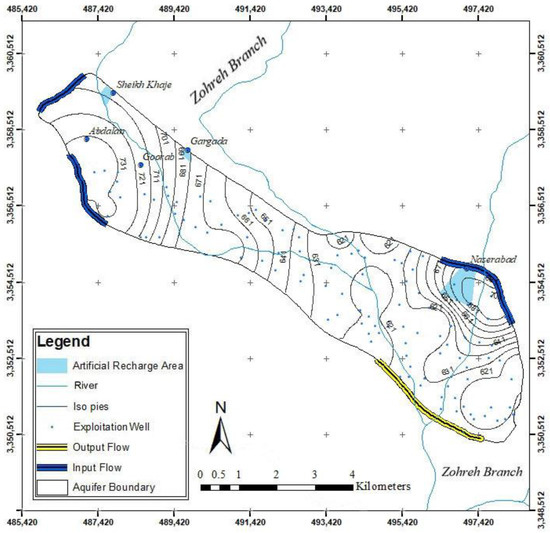
Figure 3.
Aquifer boundaries in the study area.
After constructing the steady-state model and entering the initial data into it, the value of hydraulic conductivity was calibrated using a trial-and-error method due to the differences between the model results and the actual values. Then, the transient model was constructed, and specific yield was calibrated to bring the results closer to the actual values. In this modeling, data related to September 2017 were used for steady-state conditions, while data related to September 2017–August 2019 were used for model calibration. Additionally, the data related to September 2019–August 2020 was used for model validation. After calibrating the transient model and reaching an optimal RMSE for the model, artificial recharge areas were defined in the model as artificial recharge coverage. This model was then used to estimate the groundwater level under various exploitations from the aquifer.
3.2. Estimating the Simulation Model Using Gene Expression Programming
In optimal management of groundwater resources, if the study area is wide or the simulation model is simulated in both steady-state and transient conditions, the direct application of the simulation results (groundwater level drop) in the optimization model is time-consuming due to the increasing dimensions of the search space. As a result, a tool is used as an interface between the simulator and the optimizer models to reduce the processing time and facilitate the solution of the optimization model. The tool estimates the relationship between the amount of aquifer exploitation and the subsequent groundwater level drop to be applied as constraints in the optimization model. In this study, GEP was used as the interface. After simulating the groundwater flow using the MODFLOW code, various exploitation amounts entered the model, and their corresponding groundwater level drops were obtained. Then, the data were defined and fitted in the GEP algorithm to provide a relationship between these two variables. In order for GEP to have enough data to extract relationships, about 1000 random values of exploitation were applied to the MODFLOW code to achieve the corresponding drop. The GeneXpro Tools 4 software was used for implementing GEP, where the amount of exploitation was considered as fixed, and the amount of drop as a variable. About three-fourths of the data were used for training, while the rest were used for the test.
GEP is one of the new artificial intelligence methods, which is developed from two well-known GA and GP techniques. In this method, GEP uses two main chromosomes and an expression tree and provides solutions to eliminate the limitations of the two old algorithms. It can create mathematical relationships between independent variables [34]. The vital advantage of GEP compared to other models, such as ANN, is its flexibility. In the structure of this algorithm, the input variables, target, and position function are determined at first and during the training process, resulting in the optimal structure of the model and coefficients. In contrast, the structure should be first defined in ANN, and only the coefficients of the model are obtained during the training process [35]. Selecting the appropriate input variables in GEP is important in order to achieve the optimal structure of the model and its coefficients, which is often performed through trial and error [36]. GEP is usually implemented through six steps, as follows [37].
The first step is the generation of the initial population of chromosomes, as well as finding a symbolic regression to express the proportion of the initial population and a specified error rate. RRSE was used in this research as the error evaluation criterion. The second step is to evaluate the chromosomes: selecting a set of functions and input variables for chromosome generation with the help of mathematical operators such as basic arithmetic, trigonometric, and logarithmic operators. The third step is to choose the structure of the chromosomes, which includes the length of the head and the number of genes. The fourth step includes the selection of the linker function. In the selection of the linker function between sub-branches of the expression trees (SUB_ETs), there is no rule for which one function is preferable to another. The addition function is used in this model. The fifth step is to determine the growth process for the next generation. Determining the rate of genetic operators, including mutation and transfer, is performed in this step. This process continues until the termination condition is achieved. Finally, the sixth step is to determine the termination condition of the program: the model stops when it is reached. In this study, 3 × 10⁶ iterations of data fitting are considered as the termination condition for the program. The resulting model is in the framework of an optimal formula to provide the relationship between groundwater exploitation and the resulting groundwater level drop.
3.3. Particle Swarm Optimization
As an optimization method, PSO performs more effectively than other evolutionary techniques in many cases [38]. It is based on the simulation of simple social models, such as birds, fish, and particle theory, and is suitable for solving optimal global problems [39]. It includes two factors to achieve the optimal point: the best experience of the particle so far (pbest) and the best experience of all particles so far (gbest). This behavior is similar to a situation when people consider their best personal experience and the best personal experience of the other people around them to make a decision [40,41]. This algorithm is based on searching the solution space in a suitable way, hoping that in this process, the particles will reach a better position so that, finally, all the particles converge at the optimal point. After finding pbest and gbest, the position (xi) and velocity (vi) for each particle are updated in each iteration by using Equations (1) and (2) [42].
where i represents the particle and d is the dimension of particle i; t represents the iteration, and c1 and c2 are learning parameters that are often called acceleration constants and control the effect of the best position of the particle and its best total position in the previous iteration on the speed in the new iteration. Two random numbers, r1 and r2, have values between 0 and 1. The weighted inertia w is an outstanding variant that is considered to control the effect of the previous speed on the new speed to converge the algorithm [42]. When the position of the particles is updated, it should be checked that the particles have not exceeded the boundaries of the search space [6]. Then, pbest and gbest are updated based on the objective function values. This process is repeated until an improvement in the objective function (gbest) is achieved.
PSO solves the optimization problem by defining an initial population and using the objective function and the constraints to find the best amount of groundwater exploitation from the aquifer. This process is repeated until reaching a converged optimal solution. The general steps in solving the optimization problem in this study are as follows:
Problem definition. The first step is to define the objective function and decision variables. In this problem, the optimal pumping rate is calculated after the artificial recharge of the Yasouj aquifer.
Objective function. The objective function is to maximize the amount of water exploitation from the Yasouj aquifer under the artificial recharge without any decrease in the groundwater level (Equation (3)):
where
and Z is the total amount of optimal exploited water in each period, i is the number of the well, t is the period number, and n is the number of exploited wells. Qit and hit are the pumping rate and water level drop in the t-th period; k is a numerical coefficient with a large value; Mi is a binary variable that is equal to zero if the water level drop (hi) is greater than (hmax) and takes the value of one if it is smaller than that. In Equation (4), f is a function that reflects the responses of the groundwater level drop according to the pumping values (Qit) through the groundwater flow equation in the t-th period. According to this equation, the drop in the groundwater level is a function of the amount of groundwater exploitation.
Constraints. The constraints of the problem were defined according to Equations (5) and (6):
where Qmin total(t) and Qmaxtotal(t) are the lower and upper limits of total water pumping from wells in the t-th period. The optimal exploitation rate from the aquifer ranges between these two values; hmaxt is the maximum permissible drop in groundwater in the period t; h2t and h1t are the groundwater level in the t-th period under artificial recharge and without an artificial recharge, respectively. The code that was written to solve the problem is mentioned in the Supplementary Materials, in detail.
4. Results and Discussion
4.1. Simulation of the Yasouj Aquifer
The hydraulic conductivity values were obtained by a trial and error during the simulation. Figure 4 shows that the highest hydraulic conductivity values occur in the northeast and northwest regions of the aquifer. The transient model was constructed for 24 time steps (September 2017–August 2019), and the specific yield was calibrated using the Pest method (Figure 4). Additionally, data from September 2019 to August 2020 in 12 time steps was used for model validation. The RMSE (root mean square error) and MAE (mean absolute error) values for the steady-state were 0.70 and 0.64 (m), respectively, while the values for the transient models were 0.87 and 0.74 (m), respectively, indicating the low error of the model (Table 2). Additionally, Figure 5 shows the observed and calculated groundwater levels in four piezometric wells in various parts of the aquifer. The small difference between these values shows that the model constructed by the MODFLOW code can predict the groundwater level within the Yasouj aquifer.
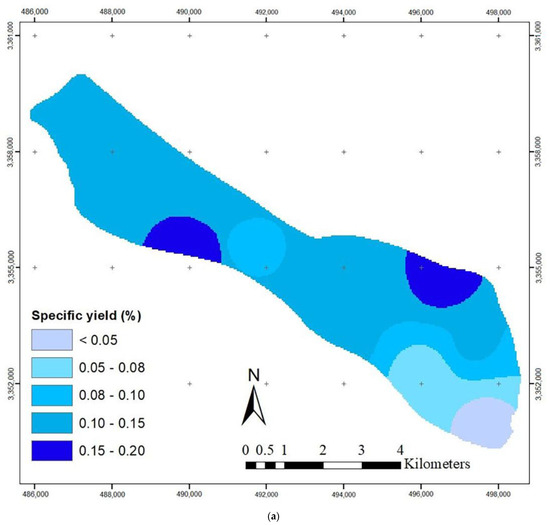
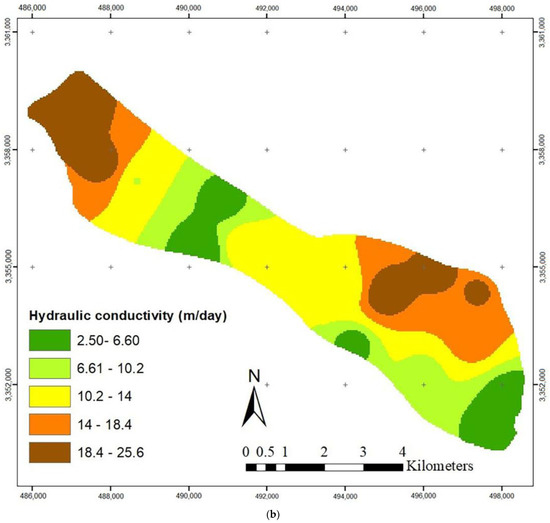
Figure 4.
Calibrated (a) specific yield (%) and (b) hydraulic conductivity (m/day).
Table 2.
Results of error evaluation criteria for groundwater simulation.
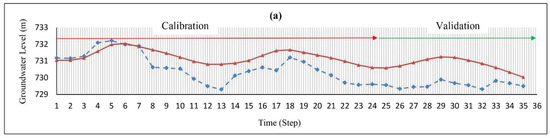
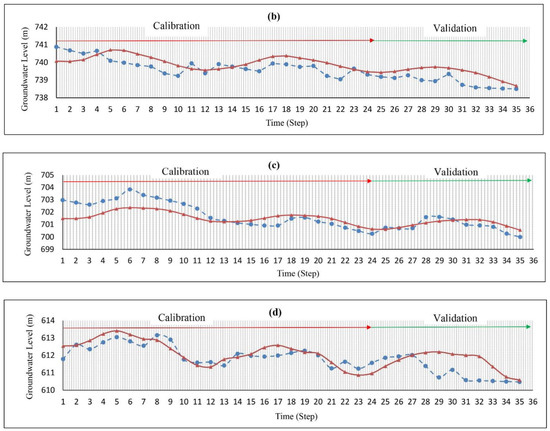
Figure 5.
The observed (dash line) and computed (continuous line) groundwater level of well (a) no. 21, (b) no. 2, (c) no. 16, and (d) no. 18.
After simulating the aquifer and applying an artificial recharge of 1 MCM in the study area, an increase in the groundwater level was observed (Figure 6). These results show that artificial recharge can be used as an alternative solution in managing groundwater resources and can lead to an increase in the groundwater level.
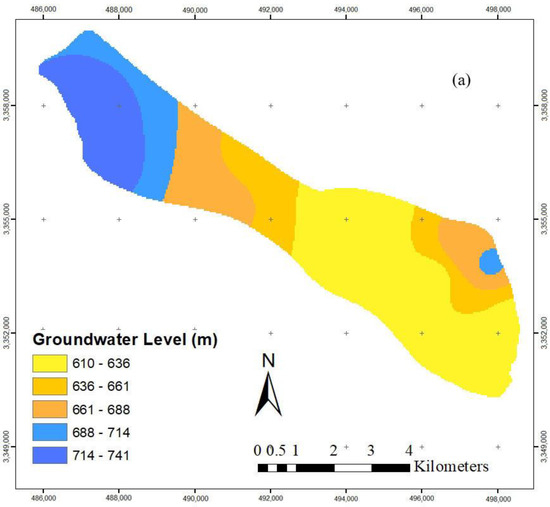
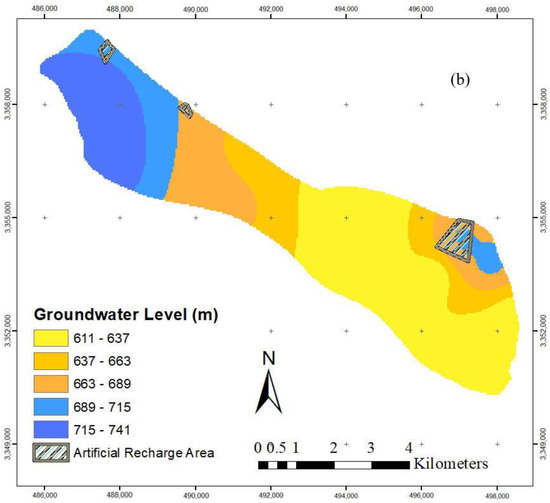
Figure 6.
(a) Groundwater level before artificial recharge. (b) Groundwater level after artificial recharge.
Additionally, by applying the “maximum amount of exploitation” constraint to the simulation model before and after artificial recharge in one period and estimating the average groundwater level in the same period, it was determined that the drop in the groundwater level was not different remarkably between using and not using the artificial recharge (Table 3 and Table 4). On the other hand, from 2000 to 2017, there is a significant decline of around -3.8 mm/yr in the nationwide groundwater recharge, caused primarily by unsustainable development [2]. This indicates the necessity for estimating the optimal amount of exploitation from the aquifer and applying the optimization method. However, in this study, it was assured that the drop in the groundwater level did not exceed a standard level due to applying the optimization model and providing the optimal exploitation.
Table 3.
Fluctuation of groundwater levels due to maximum exploitation in different seasons.
Table 4.
On the fluctuation of groundwater levels due to maximum exploitation and artificial recharge in different seasons.
4.2. Result of Gene Expression Programming
An external interface between simulation and optimization models is usually used to reduce the processing time. GEP was considered as the interface in this study. In order to simulate the MODFLOW results in GEP, 1000 random values of aquifer exploitation were defined as “initial fixed observations” and their corresponding groundwater drop as the “problem variable”.
The parameters of the GEP algorithm and their values are defined in Table 5 and were used in the GeneXproTool 4.0 software. All steps were performed separately for all three periods. After running the GEP simulator model, the error evaluation criteria were obtained for the training and test stages (Table 6). The R2 values of higher than 0.99 and RMSE values of lower than 0.01 and the values obtained for RAE, RSE, and RRSE indicate the suitable conformity between the observations (Qi) and the estimated values (hi), and the high ability of GEP in predicting the groundwater level (hi) by having the amount of exploitation in the i-th month (Qi).
Table 5.
The parameters and their values used in GeneXproTools software.
Table 6.
The values of error evaluation criteria for the GEP model for training and test processes.
4.3. Result of the Optimization Model
According to the preliminary information in solving the optimization problem for the Yasouj aquifer, groundwater exploitation from the aquifer in the three determined periods is equal to 8.08 MCM, while the amount of artificial recharge is equal to 1 MCM. As a result, the constraint on the amount of exploitation in each period was applied in the optimization model according to Table 7. In order to apply a constraint on the “rate of groundwater level drop” (Equation (6)), the values of hmax were obtained in the determined periods (Table 7), which were defined in the model. Additionally, the relationships obtained from GEP were applied to the optimization model to calculate the groundwater level drop in three determined periods. The objective function was defined in the PSO model, the parameters of which are presented in Table 8. This model was implemented in the MATLAB programming environment, and the convergence of the model during 60 iterations is depicted in Figure 7.
Table 7.
The values of pumping rate and (m) as constraints.
Table 8.
PSO parameters and their values.
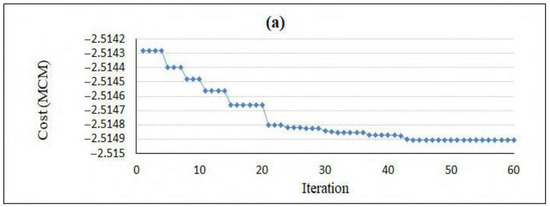
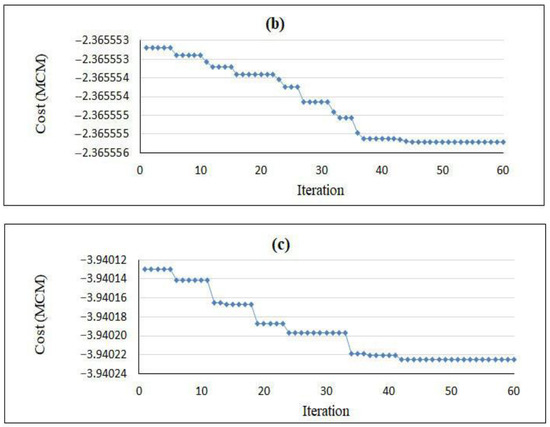
Figure 7.
Convergence of the PSO model: (a) September 2018–November 2018; (b) March 2019–May 2019; (c) June 2019–August 2019.
The numerical results obtained from solving the problem can be seen in Table 9. According to the preliminary information, the maximum amount of exploitation from the aquifer under artificial recharge in these three periods is 9.08 MCM. However, according to the table, the optimal amount of exploitation in these three periods is equal to 8.84 MCM. As a result, from water recharge of 1 MCM, the optimal exploitation rate is equal to 0.74 MCM. The optimal values for each period can be seen in Table 9 and Figure 8. According to Figure 8, 26% of the recharged water can be saved after optimization.
Table 9.
Result of the optimization model.
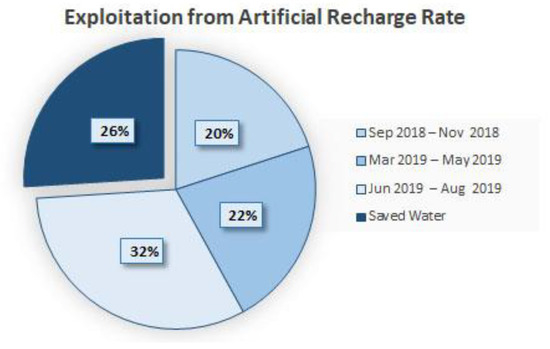
Figure 8.
Optimal exploitation rate (MCM) (%).
By examining the results of the maximum exploitation from the Yasouj aquifer and monitoring the groundwater level in four piezometric wells, 2, 16, 18, and 21, it was observed that by exploiting the total amount of artificially recharged water, the groundwater level was lower than when the optimal exploitation was performed (Figure 9). This reveals that artificial recharge can be used as a solution to solve the problem of groundwater management and cause an increase in groundwater level (Figure 6), but the lack of managing groundwater exploitation leads to lower effectiveness of artificial recharge on the aquifer. Therefore, artificial recharge alone without utilizing optimization methods may not be considered an effective solution to solve the water shortage crisis in the region.
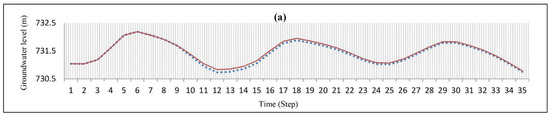
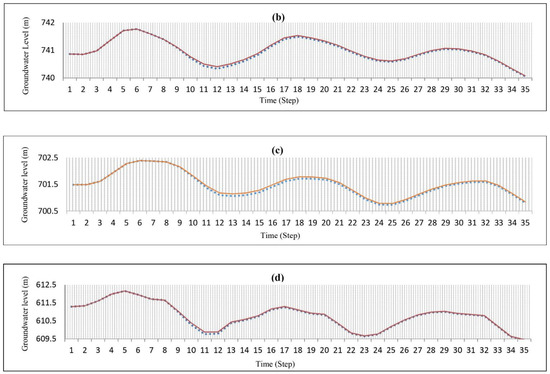
Figure 9.
The effects of optimal exploitation (red line) and conventional exploitation (continuous line) on the groundwater level in well (a) no. 21, (b) no. 2, (c) no. 16, and (d) no. 18.
According to the calculations conducted during the optimization and the generated maps of groundwater level after artificial recharge, it is concluded that the best areas for groundwater exploitation are the northeastern and western parts of the aquifer and in the area of piezometric wells 2, 21, 14, 15, and 16. It is suggested to ban exploitation from the central and southern areas of the aquifer due to the high density of exploitation wells and the low groundwater level (Figure 10). Therefore, monitoring the exploitation of the aquifer under artificial recharge will be of great importance in the water resources management of the region.
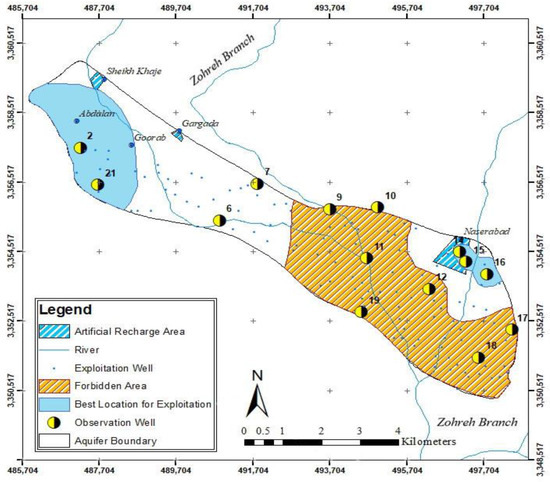
Figure 10.
The best locations proposed for groundwater exploitation.
4.4. Sensitivity Analysis
Various variables are related to both the simulation and optimization models in the proposed simulation–optimization method. Model results might be sensitive to the values of these variables. Therefore, it is essential to investigate the sensitivity of these models toward variables, especially when their values have uncertainty. This sensitivity analysis helps to find the appropriate range of variables that affect the cost function and provides comprehensive ideas for future model implementation [6]. In this study, sensitivity analysis was conducted for one variable of the simulation model (hydraulic conductivity) and two variables of the optimization model (maximum exploitation rate and the permissible groundwater drop). In order to analyze the sensitivity of the model toward hydraulic conductivity, its value was increased by 50% and then decreased by 50% compared to its original value. The sensitivity of the optimization model toward the changes in hydraulic conductivity and its effect on optimal exploitation can be seen in Table 10. According to the results, the amount of hydraulic conductivity of the aquifer does not significantly affect the final optimization solution.
Table 10.
Sensitivity of the model toward hydraulic conductivity.
In addition, to check the sensitivity of the model toward the maximum exploitation rate, the amount of artificial recharge was doubled and then reduced by half. Table 11 indicates the sensitivity of the model toward the reduction in the maximum pumping rate. Afterward, by increasing the permissible drop to 50% and again by reducing it by 50%, the sensitivity of the optimization model toward this variable was obtained. Table 12 shows the high sensitivity of the model toward the permissible groundwater level drop. According to the results, reducing the maximum pumping rate and reducing the permissible drop of the aquifer causes a decrease of about 50% in the optimal exploitation amount. The results of the sensitivity analysis can also be seen in Figure 11.
Table 11.
Sensitivity of the model toward maximum pumping rate.
Table 12.
Sensitivity of the model toward permissible drop rate.
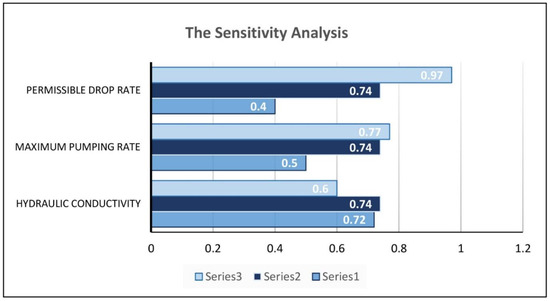
Figure 11.
Results of the sensitivity analysis. The optimal exploitation under artificial recharge (Series 1) after a reduction in the values of the variables, (Series 2) without changes in the values of the variables, and (Series 3) after an increase in the values of the variables.
5. Conclusions
In this study, the effectiveness of artificial recharge in solving the crisis of decreasing groundwater levels is investigated by combining simulation and optimization methods. This problem was studied for the Yasouj aquifer, which supplies the most water needs in the region and is under severe groundwater level drop. The results showed that the optimal exploitation volume was equal to 8.84 MCM, and the optimal exploitation from the artificial recharge of 1 MCM was equal to 0.74 MCM. According to the results, 26% of artificial recharge is expected to be saved by conducting the optimization. As a result, it is possible to keep the groundwater level at the standard level only by exploiting 74% of the volume of artificial recharge. It was suggested that exploitation should be performed primarily in the northeastern and western areas of the aquifer due to the high density of exploitation wells and low groundwater level in the southern and central areas of the aquifer. Implementation of the proposed plan is anticipated to provide suitable conditions for the exploitation of the aquifer in the year during which the groundwater level does not fall below a standard level.
It should be noted that the application of artificial recharge and the estimation of optimal exploitation is the most convenient and suitable approach for managing the recharged water for the existing conditions. The results of the sensitivity analysis of the model showed that changes in hydraulic conductivity did not significantly impact the optimal exploitation volume from the aquifer. The optimization model showed great sensitivity toward the reduction in the maximum pumping rate and the decrease and increase in the permissible level drop.
The problem-solving method in this study was able to properly simulate the effects of artificial recharge on groundwater level due to the ability to include quantitative details in the distribution model constructed in MODFLOW for both the steady-state and transient models. By using the GEP method, the significant capability of these models enabled the accurate prediction (R2 of higher than 0.99) for the amount of groundwater level drop caused by various amounts of exploitation. During this process, due to the possibility of including various types of decision variables, such as pumping wells and the groundwater level drop in the PSO algorithm, this algorithm was capable of optimizing groundwater exploitation. The proposed method in this study, in addition to showing the effectiveness of artificial recharge in the region, introduced an efficient method for its implementation. This optimization method can be successfully implemented for wider aquifers under artificial recharge and with multiobjective functions. Additionally, other algorithms such as the lion algorithm can be utilized and their results can be compared.
Author Contributions
Methodology, R.M.; Investigation, R.M.; Data curation, M.S.; Writing—original draft, R.M. and M.S.; Writing—review & editing, G.G.; Supervision, S.J. All authors have read and agreed to the published version of the manuscript.
Funding
This research received no external funding.
Data Availability Statement
Not applicable.
Conflicts of Interest
The authors declare no conflict of interest.
References
- Kerebih, M.S.; Keshari, A.K. Distributed Simulation-Optimization Model for Conjunctive Use of Groundwater and Surface Water Under Environmental and Sustainability Restrictions. Water Resour. Manag. 2021, 35, 2305–2323. [Google Scholar] [CrossRef]
- Noori, R.; Maghrebi, M.; Jessen, S.; Bateni, S.M.; Heggy, E.; Javadi, S.; Nouri, M.; Pistre, S.; Abolfathi, S.; AghaKouchak, A. Decline in Iran’s Groundwater Recharge. Res. Sq. 2023. [Google Scholar] [CrossRef]
- Maghrebi, M.; Noori, R.; Mehr, A.D.; Lak, R.; Darougheh, F.; Razmgir, R.; Farnoush, H.; Taherpour, H.; Moghaddam, S.M.R.A.; Araghi, A.; et al. Spatiotemporal Changes in Iranian Rivers’ Discharge. Elem. Sci. Anthr. 2023, 11, 00002. [Google Scholar] [CrossRef]
- Javadi, S.; Mehdy, S.; Shahdany, H.; Neshat, A.; Chambel, A. Multi-Parameter Risk Mapping of Qazvin Aquifer by Classic and Fuzzy Clustering Techniques. Geocarto Int. 2020, 37, 6049. [Google Scholar] [CrossRef]
- Kharanagh, S.G.; Banihabib, M.E.; Javadi, S. An MCDM-Based Social Network Analysis of Water Governance to Determine Actors’ Power in Water-Food-Energy Nexus. J. Hydrol. 2019, 581, 124382. [Google Scholar] [CrossRef]
- Gaur, S.; Chahar, B.R.; Graillot, D. Analytic Elements Method and Particle Swarm Optimization Based Simulation–Optimization Model for Groundwater Management. J. Hydrol. 2011, 402, 217–227. [Google Scholar] [CrossRef]
- Sayit, A.P.; Yazicigil, H. Assessment of Artificial Aquifer Recharge Potential in the Kucuk Menderes River Basin, Turkey. Hydrogeol. J. 2012, 20, 755–766. [Google Scholar] [CrossRef]
- Bremer, L.L.; DeMaagd, N.; Wada, C.A.; Burnett, K.M. Priority Watershed Management Areas for Groundwater Recharge and Drinking Water Protection: A Case Study from Hawai’i Island. J. Environ. Manag. 2021, 286, 111622. [Google Scholar] [CrossRef] [PubMed]
- Narasimhan, L.; Boulet, P.; Kuchta, B.; Schaef, O.; Denoyel, R.; Brunet, P. Molecular Simulations of Water and Paracresol in MFI Zeolite-A Monte Carlo Study. Langmuir 2009, 25, 11598–11607. [Google Scholar] [CrossRef]
- Cao, G.; Han, D.; Moser, J. Groundwater Exploitation Management Under Land Subsidence Constraint: Empirical Evidence from the Hangzhou-Jiaxing-Huzhou Plain, China. Environ. Manag. 2013, 51, 1109–1125. [Google Scholar] [CrossRef] [PubMed]
- Jafari, F.; Javadi, S.; Golmohammadi, G.; Karimi, N. Numerical Simulation of Groundwater Flow and Aquifer-System Compaction Using Simulation and InSAR Technique: Saveh Basin. Environ. Earth Sci. 2016, 75, 833. [Google Scholar] [CrossRef]
- Bierkens, M.; Wada, Y. Non-Renewable Groundwater Use and Groundwater Depletion: A Review. Environ. Res. Lett. 2019, 14, 063002. [Google Scholar] [CrossRef]
- Motevalli, A.; Moradi, H.R.; Javadi, S. A Comprehensive Evaluation of Groundwater Vulnerability to Saltwater Up-Coning and Sea Water Intrusion in a Coastal Aquifer (Case Study: Ghaemshahr-Juybar Aquifer). J. Hydrol. 2018, 557, 753–773. [Google Scholar] [CrossRef]
- Milan, S.G.; Roozbahani, A.; Banihabib, M.E. Fuzzy Optimization Model and Fuzzy Inference System for Conjunctive Use of Surface and Groundwater Resources. J. Hydrol. 2018, 566, 421–434. [Google Scholar] [CrossRef]
- Ghaseminejad, A.; Shourian, M. A Simulation–Optimization Approach for Optimal Design of Groundwater Withdrawal Wells’ Location and Pumping Rate Considering Desalination Constraints. Environ. Earth Sci. 2019, 78, 270. [Google Scholar] [CrossRef]
- Zare, M. Hybrid Signal Processing/Machine Learning and PSO Optimization Model for Conjunctive Management of Surface-Groundwater Resources. Neural Comput. Appl. 2021, 33, 8067–8088. [Google Scholar] [CrossRef]
- Sabale, R.; Jose, M. Optimization of Conjunctive Use of Surface and Groundwater by Using LINGO and PSO in Water Resources Management. Innov. Infrastruct. Solut. 2022, 7, 135. [Google Scholar] [CrossRef]
- Kumar, D.; Prasad, R.K.; Mathur, S. Optimal Design of an In-Situ Bioremediation System Using Support Vector Machine and Particle Swarm Optimization. J. Contam. Hydrol. 2013, 151, 105–116. [Google Scholar]
- Kamali, A.; Niksokhan, M.H. Multi-Objective Optimization for Sustainable Groundwater Management by Developing of Coupled Quantity-Quality Simulation-Optimization Model. J. Hydroinformatics 2017, 19, 973–992. [Google Scholar] [CrossRef]
- Shourian, M.; Davoudi, S.M.J. Optimum Pumping Well Placement and Capacity Design for a Groundwater Lowering System in Urban Areas with the Minimum Cost Objective. Water Resour. Manag. 2017, 31, 4207–4225. [Google Scholar] [CrossRef]
- Alaviani, F.; Sedghi, H.; Moghaddam, A.A.; Babazadeh, H. Adopting Gms–Pso Model to Reduce Groundwater Withdrawal by Integrated Water Resources Management. Int. J. Environ. Res. 2018, 12, 619–629. [Google Scholar] [CrossRef]
- Sabzzadeh, I.; Shourian, M. Maximizing Crops Yield Net Bene Fi t in a Groundwater-Irrigated Plain Constrained to Aquifer Stable Depletion Using a Coupled PSO-SWAT- MODFLOW Hydro-Agronomic Model. J. Clean. Prod. 2020, 262, 121349. [Google Scholar] [CrossRef]
- Dey, S.; Prakash, O. Managing Saltwater Intrusion Using Conjugate Sharp Interface and Density Dependent Models Linked with Pumping Optimization. Groundw. Sustain. Dev. 2020, 11, 100446. [Google Scholar] [CrossRef]
- Fan, Y.; Lu, W.; Miao, T.; Li, J.; Lin, J. Multiobjective Optimization of the Groundwater Exploitation Layout in Coastal Areas Based on Multiple Surrogate Models. Environ. Sci. Pollut. Res. 2020, 27, 19561–19576. [Google Scholar] [CrossRef]
- Safavi, H.R.; Darzi, F.; Mariño, M.A. Simulation-Optimization Modeling of Conjunctive Use of Surface Water and Groundwater. Water Resour. Manag. 2010, 24, 1965–1988. [Google Scholar] [CrossRef]
- Ataie-ashtiani, B.; Ketabchi, H.; Rajabi, M.M. Optimal Management of a Freshwater Lens in a Small Island Using Surrogate Models and Evolutionary Algorithms. Hydrol. Eng. 2014, 19, 339–354. [Google Scholar] [CrossRef]
- Safavi, H.R.; Alijanian, M.A. Optimal Crop Planning and Conjunctive Use of Surface Water and Groundwater Resources Using Fuzzy Dynamic Programming. J. Irrig. Drain. Eng. 2011, 137, 383–397. [Google Scholar] [CrossRef]
- Arya, N.; Zahra, A.; Sami, K.; Milan, G.; Zarif, H. A Hybrid Approach Based on Simulation, Optimization, and Estimation of Conjunctive Use of Surface Water and Groundwater Resources. Environ. Sci. Pollut. Res. 2022, 29, 56828–56844. [Google Scholar] [CrossRef] [PubMed]
- Song, J.; Yang, Y.; Wu, J.; Wu, J.; Sun, X.; Lin, J. Adaptive Surrogate Model Based Multiobjective Optimization for Coastal Aquifer Management. J. Hydrol. 2018, 561, 98–111. [Google Scholar] [CrossRef]
- Lal, A.; Asce, S.M.; Datta, B. Optimal Groundwater-Use Strategy for Saltwater Intrusion Management in a Pacific Island Country. J. Water Resour. Plan. Manag. 2019, 145, 04019032. [Google Scholar] [CrossRef]
- Han, Z.; Lu, W.; Fan, Y.; Xu, J.; Lin, J. Surrogate-Based Stochastic Multiobjective Optimization for Coastal Aquifer Management under Parameter Uncertainty. Water Resour. Manag. 2021, 35, 1479–1497. [Google Scholar] [CrossRef]
- Water Budget Report. The Regional Water Company of Yasouj. 2014. Available online: http://wrs.wrm.ir/amar/login.asp (accessed on 5 March 2023). (In Pesian).
- Harbaugh, A.W.; McDonald, M.G. Programmer’s Documentation for MODFLOW-96, an Update to the US Geological Survey Modular Finite-Difference Ground-Water Flow Model; US Geological Survey, Branch of Information Services: Reston, VI, USA, 1996.
- Luo, Z.; Luo, Z.; Qin, Y.; Wen, L.; Ma, S.; Dai, Z. Developing New Tree Expression Programing and Artificial Bee Colony Technique for Prediction and Optimization of Landslide Movement. Eng. Comput. 2020, 36, 1117–1134. [Google Scholar] [CrossRef]
- Bahmani, R.; Solgi, A.; Ouarda, T.B.M.J. Groundwater Level Simulation Using Gene Expression Programming and M5 Model Tree Combined with Wavelet Transform. Hydrol. Sci. J. 2020, 65, 1430–1442. [Google Scholar] [CrossRef]
- Ebrahimi, H.; Jabbari, E.; Ghasemi, M. Application of the Honey-Bees Mating Programming (HBMP) Algorithm to Sediment Concentration Modelling to Sediment Concentration Modelling. Hydrol. Sci. J. 2015, 60, 1853–1864. [Google Scholar] [CrossRef]
- Ferreira, C. Gene Expression Programming: A New Adaptive Algorithm for Solving Problems. arXiv 2001, arXiv:cs/0102027. [Google Scholar]
- Kenned0y, J.; Eberhart, R. Particle Swarm Optimization. In Proceedings of the ICNN’95—International Conference on Neural Networks, Perth, WA, Australia, 27 November–1 December 1995. [Google Scholar]
- Eberhart, R.C.; Shi, Y.; Kennedy, J. Swarm Intelligence; Elsevier Science: Amsterdam, The Netherlands, 2001. [Google Scholar]
- Jarboui, B.; Damak, N.; Siarry, P.; Rebai, A. A Combinatorial Particle Swarm Optimization for Solving Multi-Mode Resource-Constrained Project Scheduling Problems. Appl. Math. Comput. 2008, 195, 299–308. [Google Scholar] [CrossRef]
- Asefpour Vakilian, K. Metaheuristic optimization to improve machine learning in Raman spectroscopic-based detection of foodborne pathogens. In Proceedings of the 2021 7th International Conference on Signal Processing and Intelligent Systems, Tehran, Iran, 29–30 December 2021; pp. 1–5. [Google Scholar] [CrossRef]
- Verardo, E.; Atteia, O.; Rouvreau, L.; Siade, A.; Prommer, H. Identifying Remedial Solutions through Optimal Bioremediation Design under Real-World Field Conditions. J. Contam. Hydrol. 2021, 237, 103751. [Google Scholar] [CrossRef]


Disclaimer/Publisher’s Note: The statements, opinions and data contained in all publications are solely those of the individual author(s) and contributor(s) and not of MDPI and/or the editor(s). MDPI and/or the editor(s) disclaim responsibility for any injury to people or property resulting from any ideas, methods, instructions or products referred to in the content. |
© 2023 by the authors. Licensee MDPI, Basel, Switzerland. This article is an open access article distributed under the terms and conditions of the Creative Commons Attribution (CC BY) license (https://creativecommons.org/licenses/by/4.0/).