Vulnerability to Aquifer Pollution in the Mexican Wine Producing Valley of Guadalupe, México
Abstract
1. Introduction
2. Materials and Methods
2.1. Study Area
2.2. DRASTIC Method
2.3. Sampling and Measurements
Parameters
2.4. Application of the DRASTIC Vulnerability Index (DVI)
2.5. Nitrate Analysis
3. Results and Discussion
3.1. Vulnerability Ranking
3.2. Vulnerability to Pollution of the Guadalupe Aquifer, Application of the DRASTIC Method
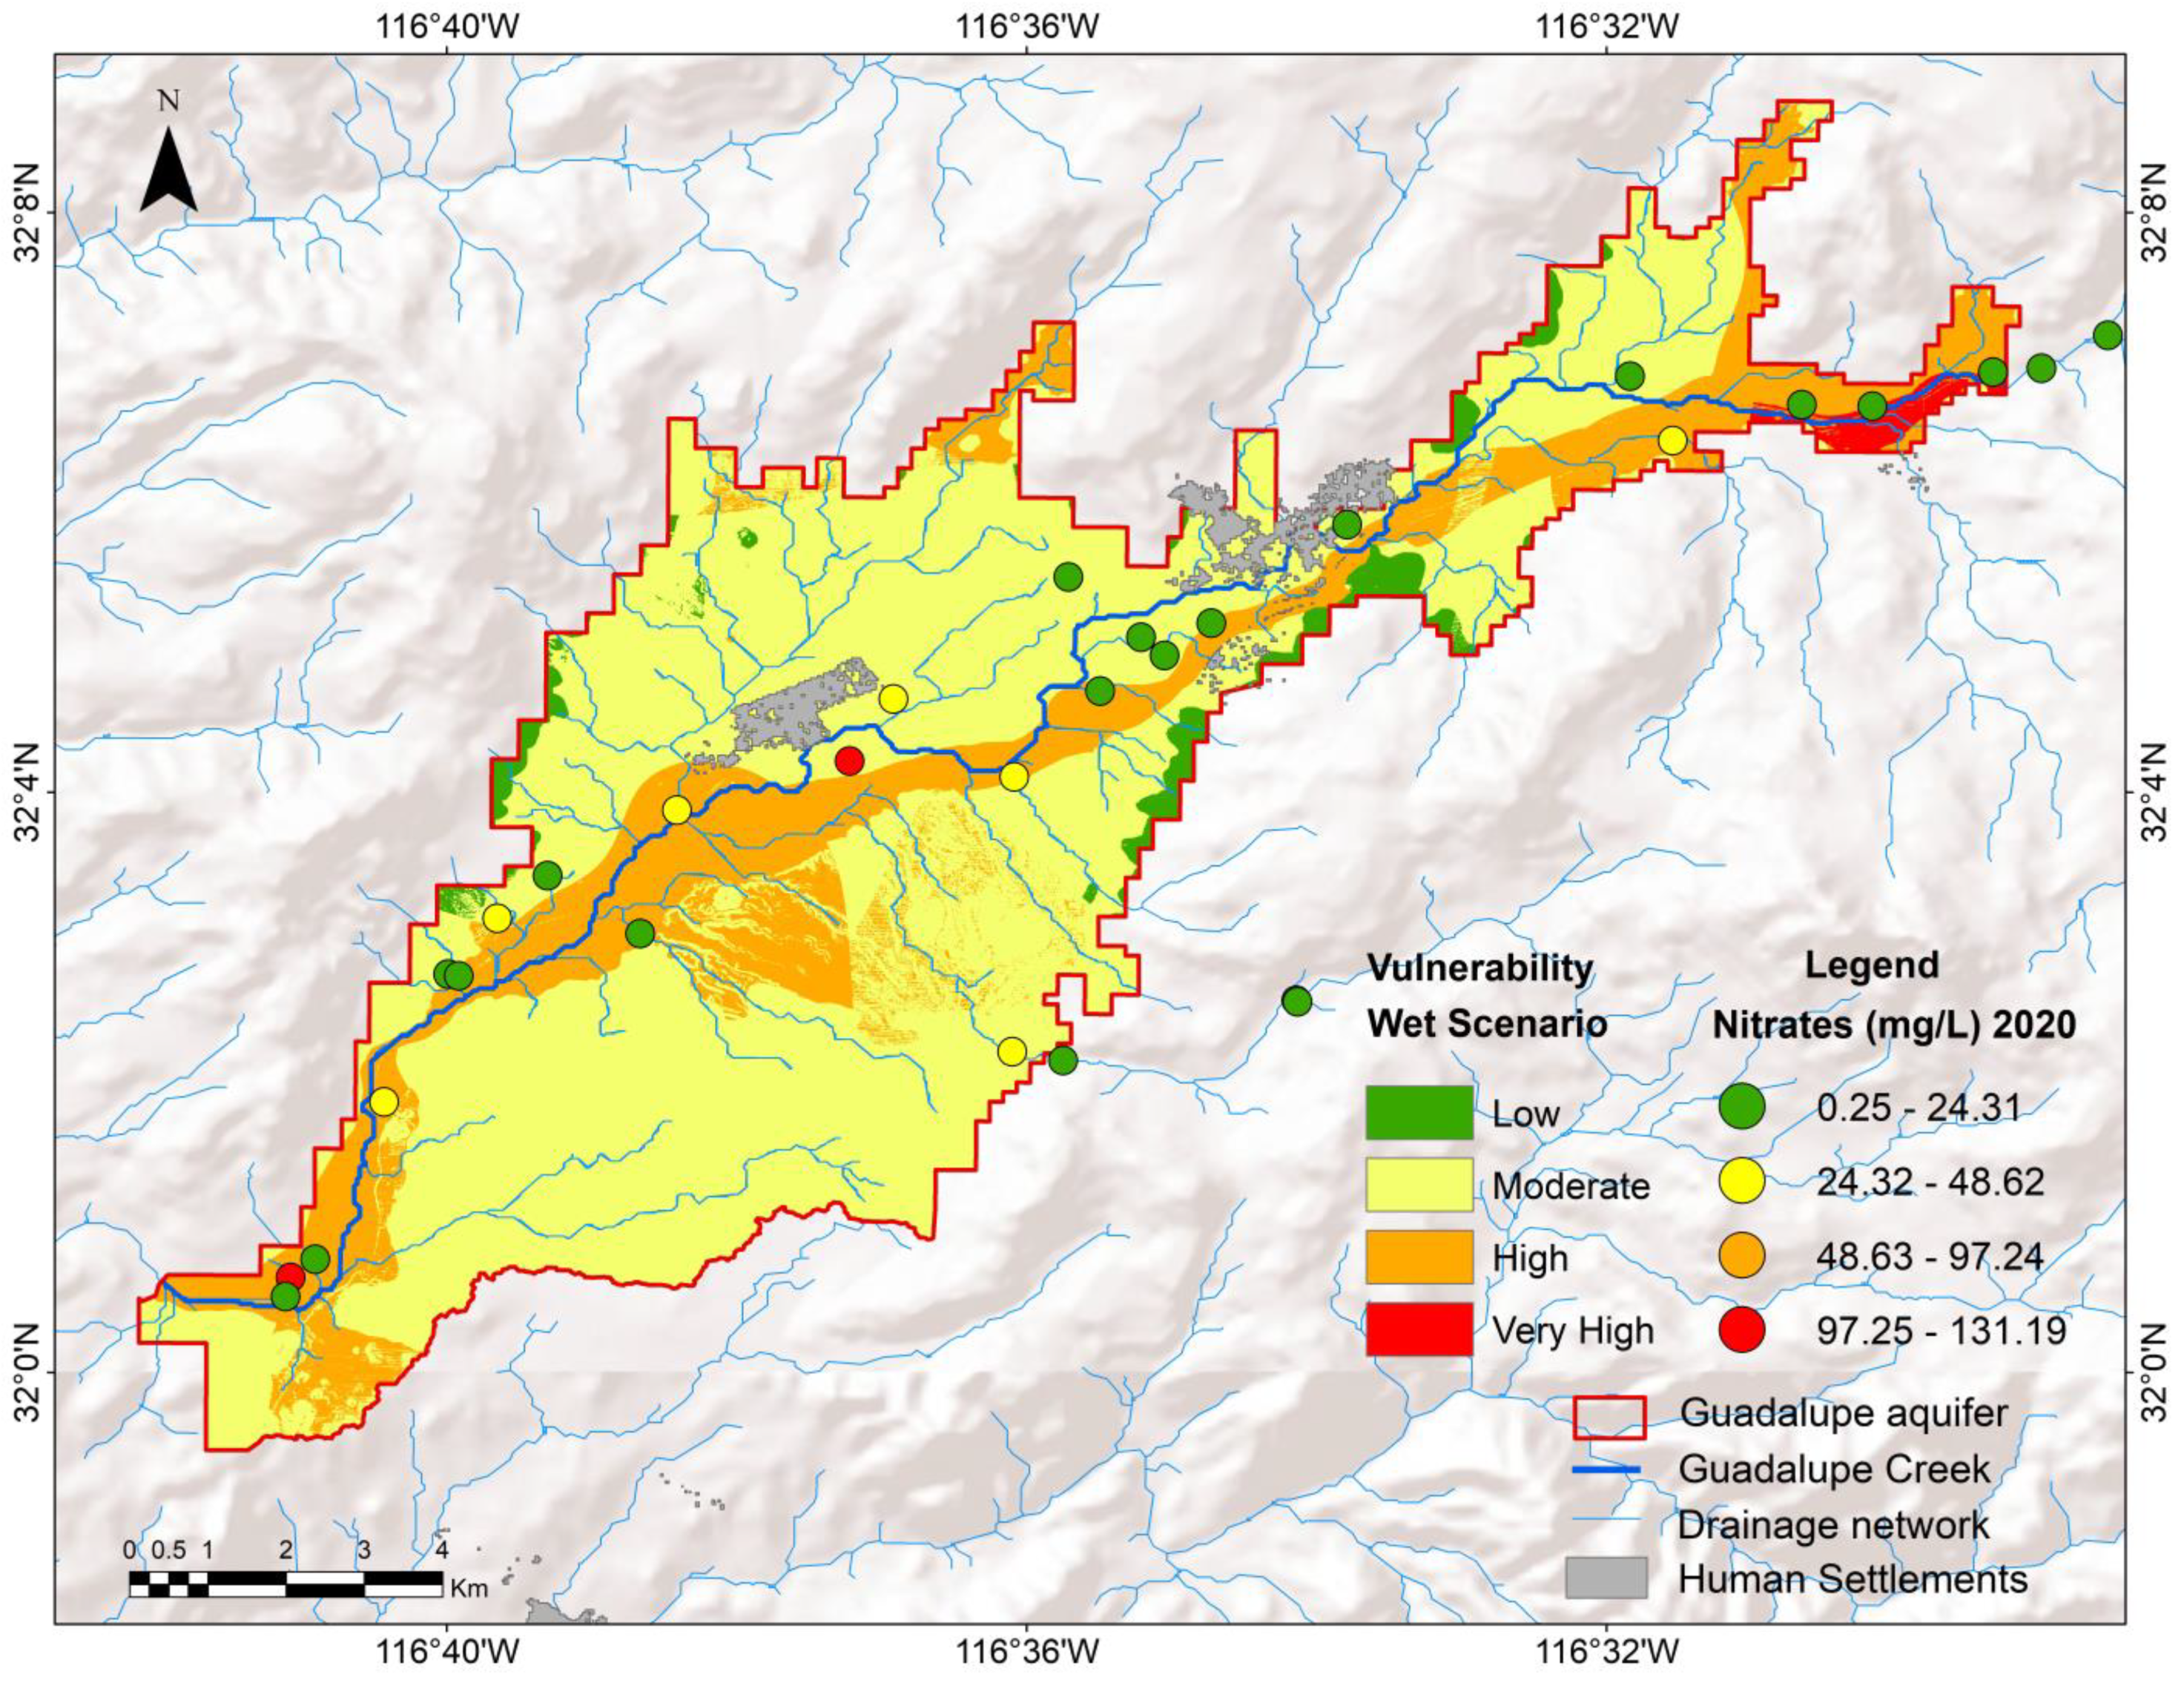
3.2.1. Wet Scenario
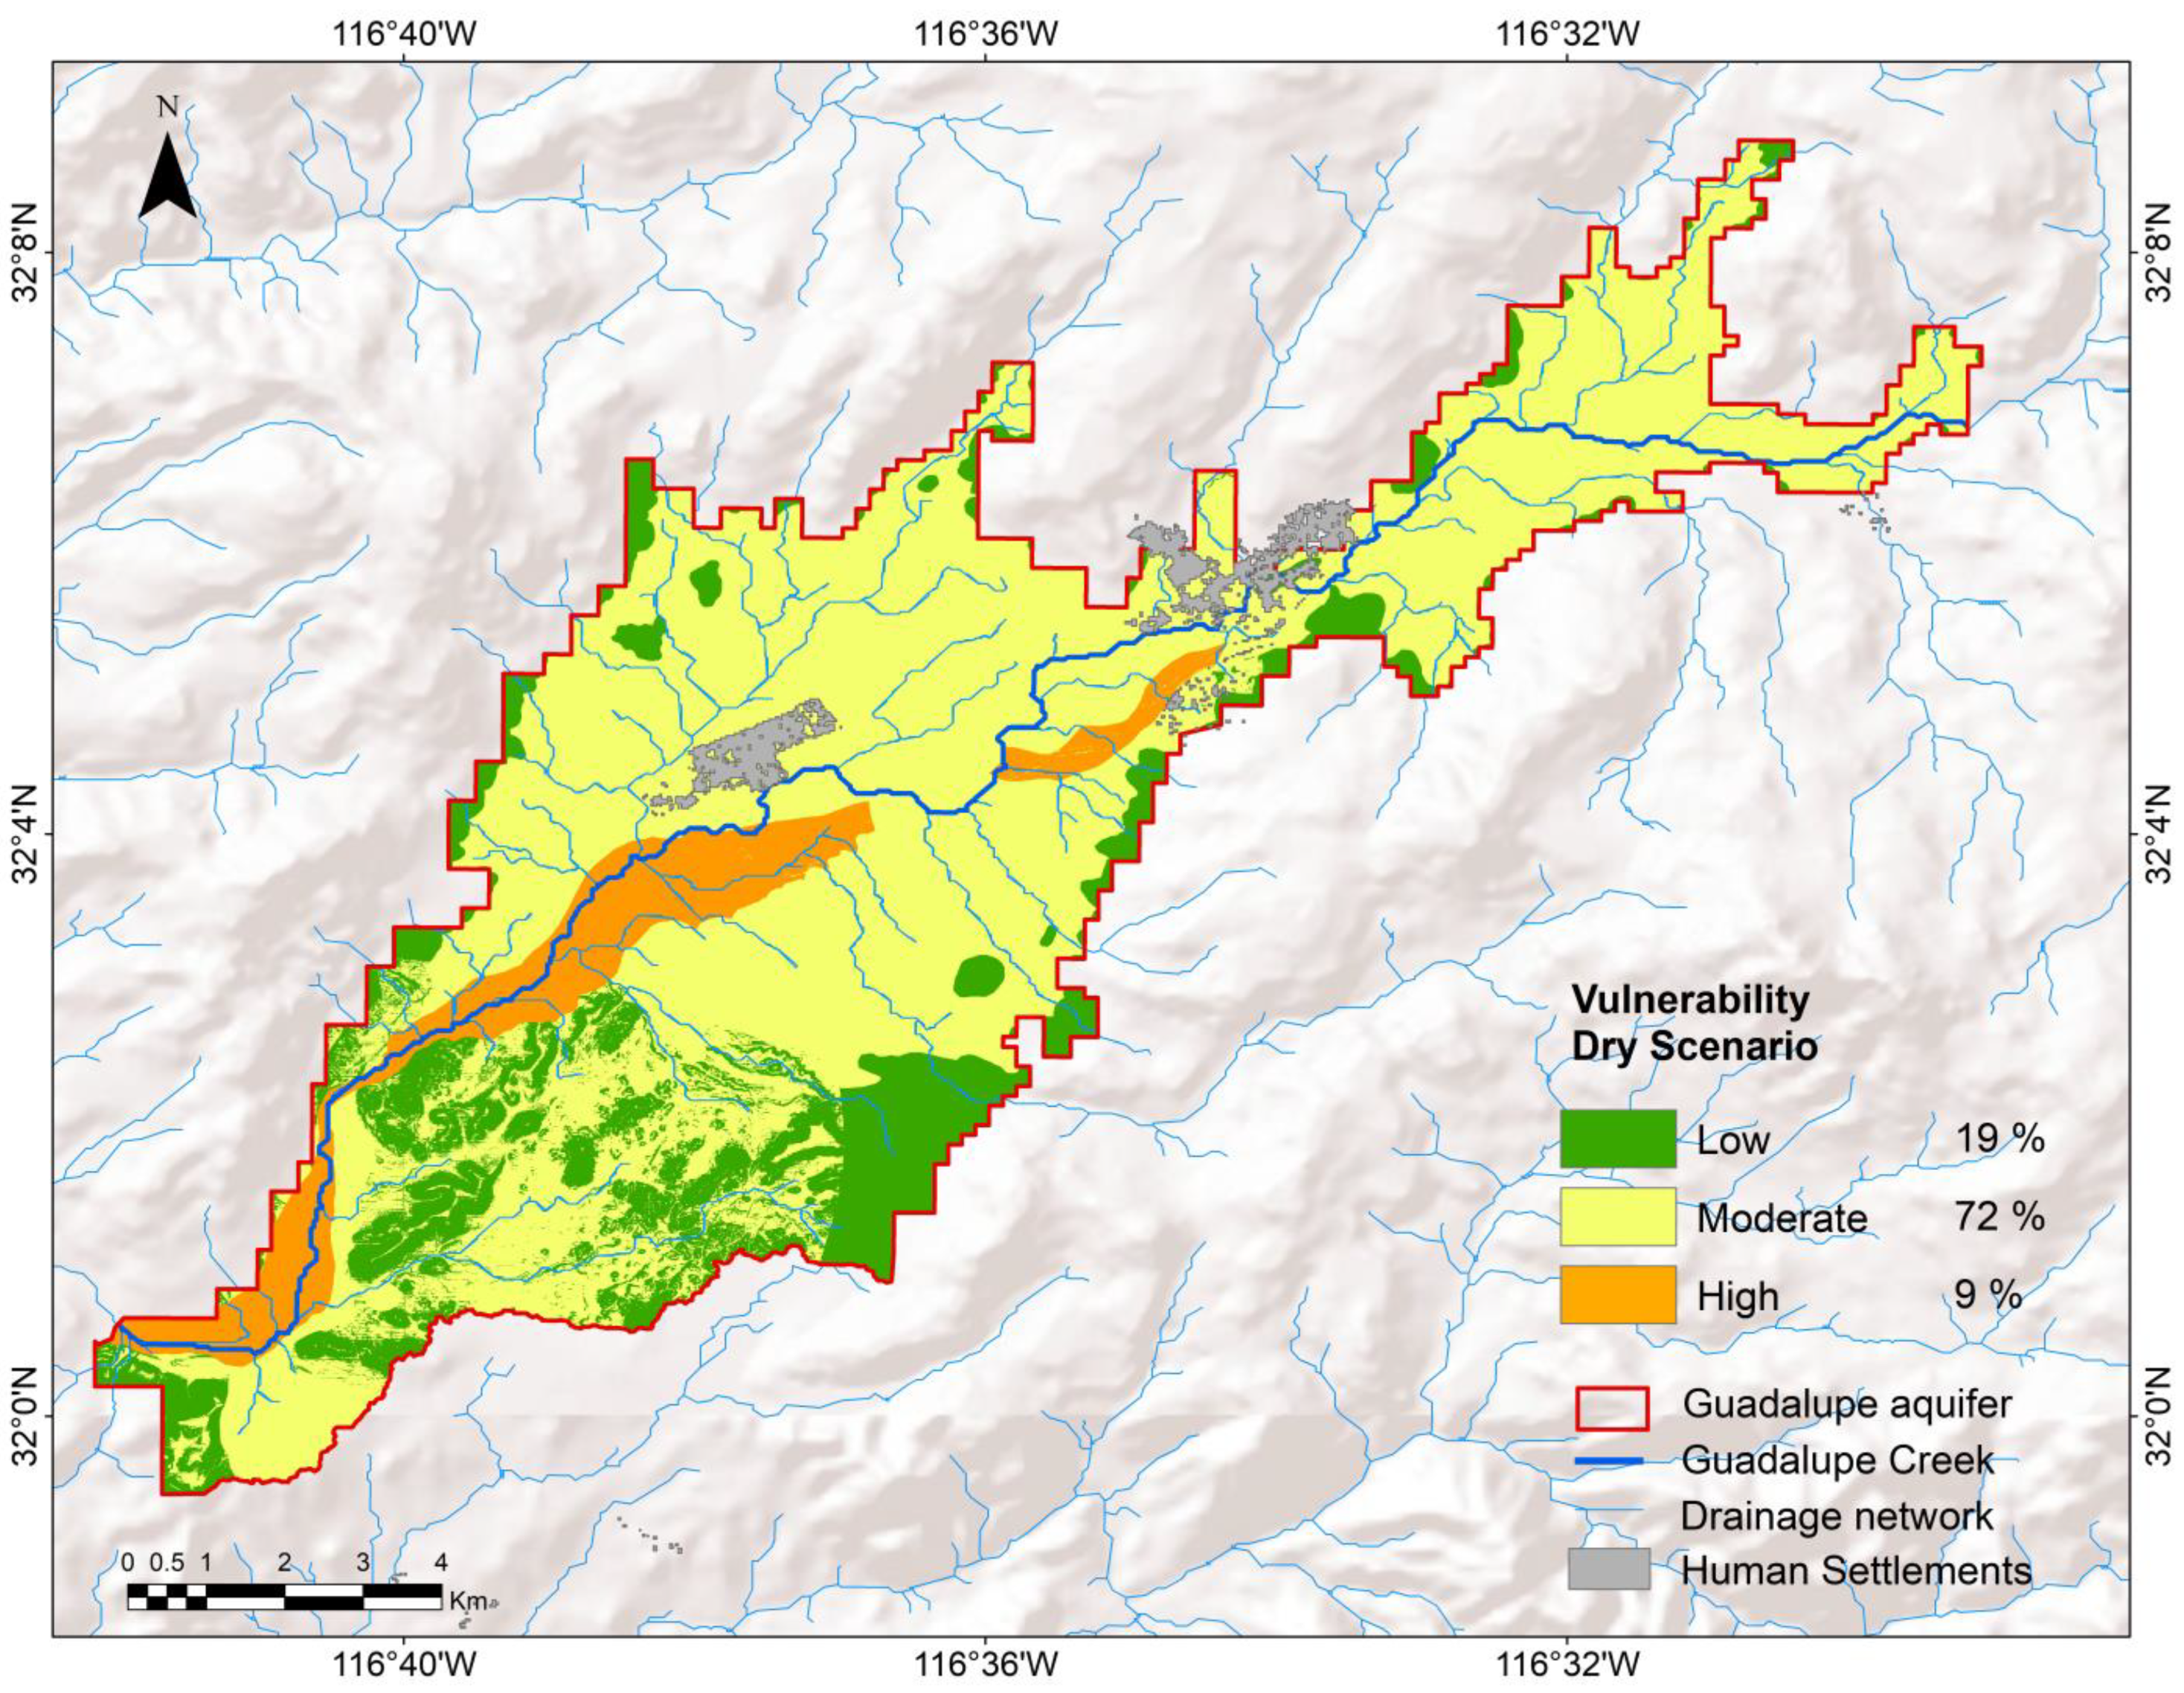
3.2.2. Dry Scenario
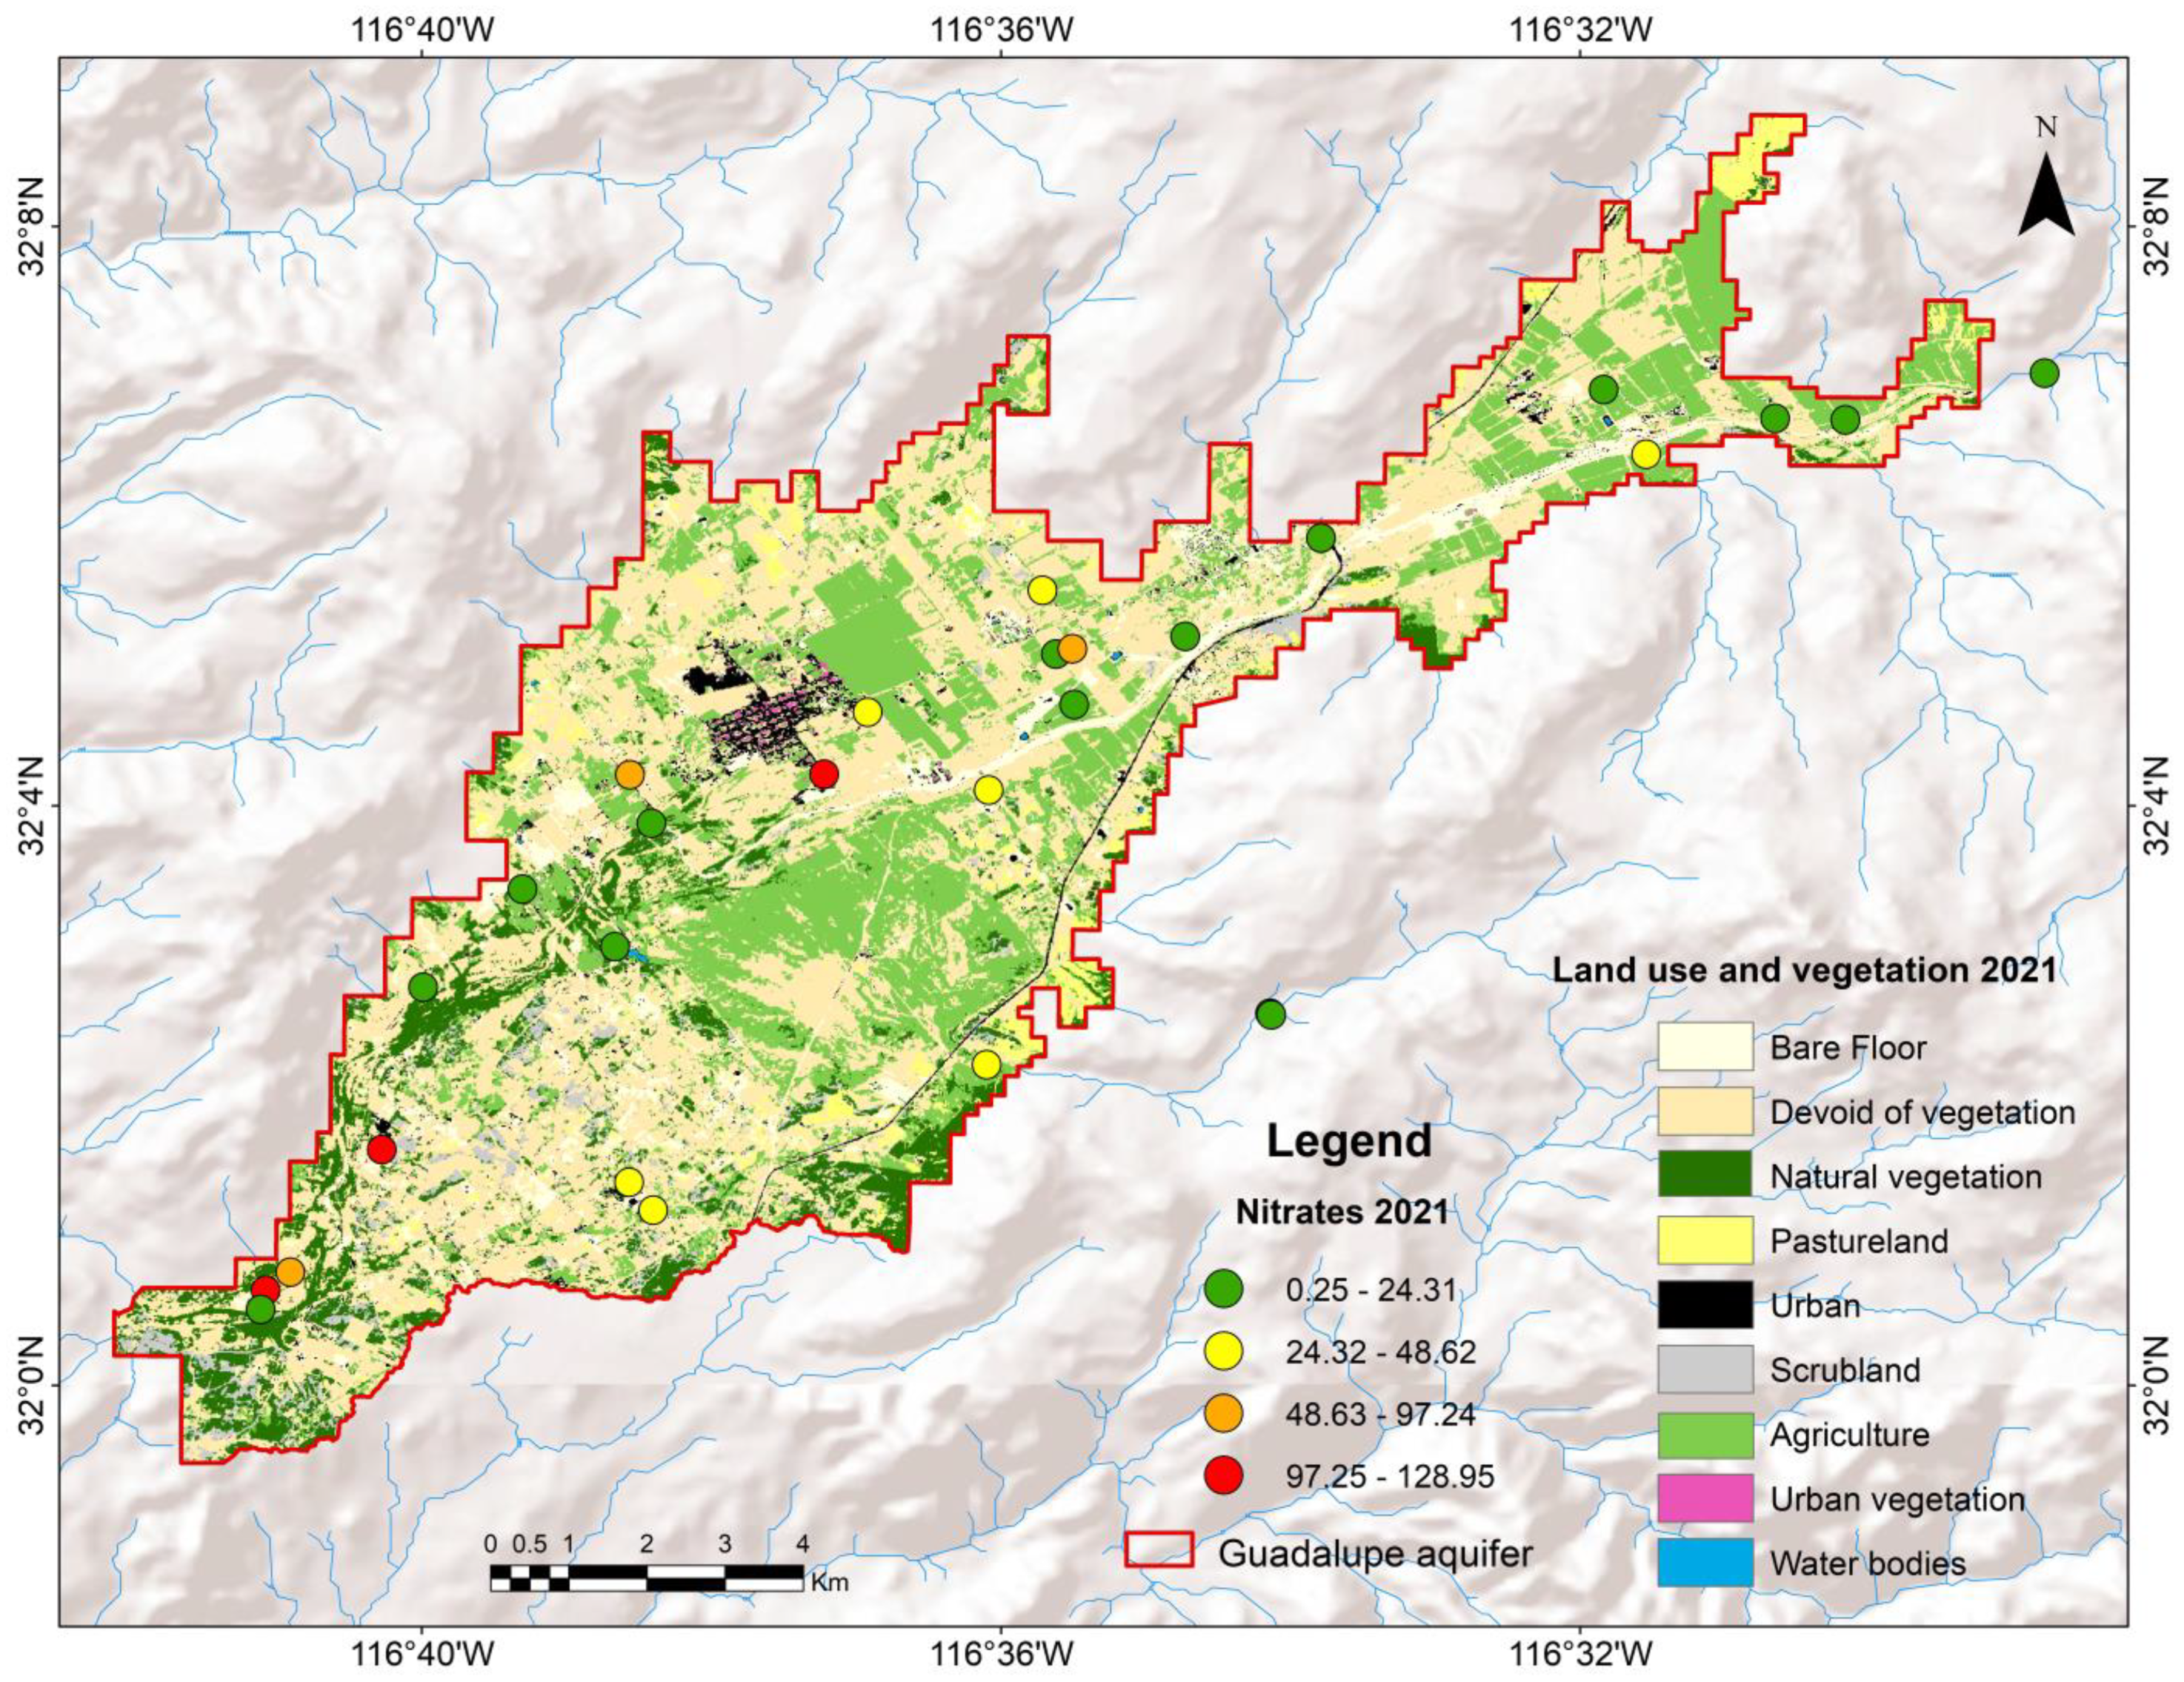
3.3. Nitrate Concentration ()
4. Limitations and Recommendations
5. Conclusions
Author Contributions
Funding
Data Availability Statement
Acknowledgments
Conflicts of Interest
References
- Paris, M. La Seguridad Hídrica y Los Objetivos de Desarrollo Sostenible Manual de Capacitación Para Tomadores de Decisión. La Seguridad; UNESCO, United Nations Educational, Scientific and Cultural Organisation: Montevideo, Uruguay, 2020; Volume 53. [Google Scholar]
- FAO. The State of the World’s Land and Water Resources for Food and Agriculture (SOLAW); FAO: Rome, Italy, 2011; ISBN 9781849713269. [Google Scholar]
- Havryliuk, R.; Savchenko, S. Water Resources Assessment. In Clean Water and Sanitation; Springer International Publishing: Cham, Switzerland, 2022; pp. 871–883. [Google Scholar] [CrossRef]
- Gale, I.; Dillon, P. Strategies for Managed Aquifer Recharge (MAR) in Semi-Arid Areas; Gale, I., Ed.; United Nations Educational, Scientific, and Cultural Organization (UNESCO): Paris, France, 2005; pp. 1–33. [Google Scholar]
- Hernández, R.; Martínez, L.; Peñuela, L.; Rivera, S. Gestión Del Agua Subterránea En Los Acuíferos de La Cuenca Del Río Ayuquila-Armería En Jalisco y Colima, México. Región Y Soc. 2019, 31, 26. [Google Scholar] [CrossRef] [PubMed]
- Foster, S.; Hirata, R. Determinación Del Riesgo de Contaminación de Aguas Subterráneas: GOD. Cent. Panam. Ing. Sanit. y Ciencias Ambient./Organ. Mund. Salud 1991, 2, 80. [Google Scholar]
- Su, C.; Li, Z.; Wang, W.; Cheng, Z.; Zheng, Z.; Chen, Z. Key Factors Dominating the Groundwater Chemical Composition in a Grain Production Base: A Case Study of Muling–Xingkai Plain, Northeast China. Water 2022, 14, 2222. [Google Scholar] [CrossRef]
- Merem, E.; Yerramilli, S.; Twumasi, Y.; Wesley, J.; Robinson, B.; Richardson, C. The Applications of GIS in the Analysis of the Impacts of Human Activities on South Texas Watersheds. Int. J. Environ. Res. Public Health 2011, 8, 2418–2446. [Google Scholar] [CrossRef]
- Bortolini, L.; Maucieri, C.; Borin, M. A Tool for the Evaluation of Irrigation Water Quality in the Arid and Semi-Arid Regions. Agronomy 2018, 8, 23. [Google Scholar] [CrossRef]
- Huang, T.; Pang, Z.; Edmunds, W.M. Soil Profile Evolution Following Land-Use Change: Implications for Groundwater Quantity and Quality. Hydrol. Process. 2012, 27, 15. [Google Scholar] [CrossRef]
- Daesslé, L.W.; Andrade-Tafoya, P.D.; Lafarga-Moreno, J.; Mahlknecht, J.; van Geldern, R.; Beramendi-Orosco, L.E.; Barth, J.A.C. Groundwater Recharge Sites and Pollution Sources in the Wine-Producing Guadalupe Valley (Mexico): Restrictions and Mixing Prior to Transfer of Reclaimed Water from the US-México Border. Sci. Total Environ. 2020, 713, 136715. [Google Scholar] [CrossRef]
- Rakotondrabe, F.; Ngoupayou, J.; Mfonka, Z.; Rasolomanana, E.H.; Nyangono Abolo, A.J.; Asone, B.L.; Ako Ako, A.; Rakotondrabe, M.H. Assessment of Surface Water Quality of Bétaré-Oya Gold Mining Area (East-Cameroon). J. Water Resour. Prot. 2017, 9, 960–984. [Google Scholar] [CrossRef]
- Gogu, R.; Dassargues, A. Current Trends and Future Challenges in Groundwater Vulnerability Assessment Using Overlay and Index Methods. Environ. Geol. 2000, 39, 549–559. [Google Scholar] [CrossRef]
- Foster, S.; Hirata, R.; Gomes, D.; D’Elia, M.; Paris, M. Groundwater Quality Protection: A Guide for Water Utilities, Municipal Authorities, and Environment Agencies. World Bank: Washington, DC, USA, 2003; ISBN 84-8476-146-0. [Google Scholar]
- Orellana, J.; Perles, M.; Causapé, J. A Methodology for Assessing Groundwater Pollution Hazard by Nitrates from Agricultural Sources: Application to the Gallocanta Groundwater Basin (Spain). Sustainability 2021, 13, 6321. [Google Scholar] [CrossRef]
- Nadiri, A.A.; Norouzi, H.; Khatibi, R.; Gharekhani, M. Groundwater DRASTIC Vulnerability Mapping by Unsupervised and Supervised Techniques Using a Modelling Strategy in Two Levels. J. Hydrol. 2019, 574, 744–759. [Google Scholar] [CrossRef]
- Elçi, A. Calibration of Groundwater Vulnerability Mapping Using the Generalized Reduced Gradient Method. J. Contam. Hydrol. 2017, 207, 39–49. [Google Scholar] [CrossRef]
- Bhuvaneswaran, C.; Ganesh, A. Spatial Assessment of Groundwater Vulnerability Using DRASTIC Model with GIS in Uppar Odai Sub-Watershed, Nandiyar, Cauvery Basin, Tamil Nadu. Groundw. Sustain. Dev. 2019, 9, 14. [Google Scholar] [CrossRef]
- Aller, L.; Bennett, T.; Lehr, J.H.; Petty, R.J.; Hackett, G. DRASTIC: A Standardized Method for Evaluating Ground Water Pollution Potential Using Hydrogeologic Settings; Environmental Research Laboratory Office of Reseach and Development U.S.: Dublin, OH, USA, 1987. [Google Scholar]
- Bai, L.; Wang, Y.; Meng, F. Application of DRASTIC and Extension Theory in the Groundwater Vulnerability Evaluation. Water Environ. J. 2012, 26, 381–391. [Google Scholar] [CrossRef]
- Meng, L.; Zhang, Q.; Liu, P.; He, H.; Xu, W. Influence of Agricultural Irrigation Activity on the Potential Risk of Groundwater Pollution: A Study with Drastic Method in a Semi-Arid Agricultural Region of China. Sustainability 2020, 12, 1954. [Google Scholar] [CrossRef]
- Abdeslam, I.; Fehdi, C.; Djabri, L. Application of Drastic Method for Determining the Vulnerability of an Alluvial Aquifer: Morsott—El Aouinet North East of Algeria: Using Arcgis Environment. Energy Procedia 2017, 119, 308–317. [Google Scholar] [CrossRef]
- Neshat, A.; Pradhan, B.; Dadras, M. Groundwater Vulnerability Assessment Using an Improved DRASTIC Method in GIS. Resour. Conserv. Recycl. 2014, 86, 74–86. [Google Scholar] [CrossRef]
- Jia, Z.; Bian, J.; Wang, Y.; Wan, H.; Sun, X.; Li, Q. Assessment and Validation of Groundwater Vulnerability to Nitrate in Porous Aquifers Based on a DRASTIC Method Modified by Projection Pursuit Dynamic Clustering Model. J. Contam. Hydrol. 2019, 226, 103522. [Google Scholar] [CrossRef]
- Hernández, A.; Reyna, A.; Sánchez, E.; Cabral, E.; Carrera, J.; Martínez, P.; Macías, S.; Falorni, G.; Colombo, D. The DRASTIC-Sg Model: An Extension to the DRASTIC Approach for Mapping Groundwater Vulnerability in Aquifers Subject to Differential Land Subsidence, with Application to Mexico City. Hydrogeol. J. 2014, 22, 1469–1485. [Google Scholar] [CrossRef]
- Franco Plata, R. Adecuación del Método de Evaluación de Vulnerabilidad de Acuíferos (DRASTIC), Mediante el Uso del Trazado de Partículas en el Acuífero del Curso Alto Del Río Lerma, Estado de México. Master’s Thesis, Universidad Autónoma del Estado de México, Toluca, Mexico, 2002. [Google Scholar]
- Hasan, M.; Islam, M.A.; Aziz Hasan, M.; Alam, M.J.; Peas, M.H. Groundwater Vulnerability Assessment in Savar Upazila of Dhaka District, Bangladesh—A GIS-Based DRASTIC Modeling. Groundw. Sustain. Dev. 2019, 9, 100220. [Google Scholar] [CrossRef]
- Pacheco, F.A.L.; Martins, L.M.O.; Quininha, M.; Oliveira, A.S.; Sanches Fernandes, L.F. Modification to the DRASTIC Framework to Assess Groundwater Contaminant Risk in Rural Mountainous Catchments. J. Hydrol. 2018, 566, 175–191. [Google Scholar] [CrossRef]
- Ceballos, R.P.; Ávila, J.P. Vulnerabilidad Del Agua Subterránea a La Contaminación de Nitratos En El Estado de Yucatán. Ingeniería 2004, 8, 33–42. [Google Scholar]
- Liang, J.; Li, Z.; Yang, Q.; Lei, X.; Kang, A.; Li, S. Specific Vulnerability Assessment of Nitrate in Shallow Groundwater with an Improved DRSTIC-LE Model. Ecotoxicol. Environ. Saf. 2019, 174, 649–657. [Google Scholar] [CrossRef]
- Mfonka, Z.; Ndam Ngoupayou, J.R.; Kpoumie, A.; Ndjigui, P.D.; Zammouri, M.; Ngouh, A.N.; Mouncherou, O.F.; Mfochivé, O.F.; Rakotondrabe, F. Hydrodynamic and Groundwater Vulnerability Assessment of the Shallow Aquifer of the Foumban Locality (Bamoun Plateau, Western-Cameroon). Arab. J. Geosci. 2019, 12, 165. [Google Scholar] [CrossRef]
- Pórcel, R.A.D.; Schüth, C.; De León-Gómez, H.; Hoppe, A.; Lehné, R. Land-Use Impact and Nitrate Analysis to Validate DRASTIC Vulnerability Maps Using a GIS Platform of Pablillo River Basin, Linares, N.L., Mexico. Int. J. Geosci. 2014, 5, 1468–1489. [Google Scholar] [CrossRef][Green Version]
- Singh, S.; Anil, A.G.; Kumar, V.; Kapoor, D.; Subramanian, S.; Singh, J.; Ramamurthy, P.C. Nitrates in the Environment: A Critical Review of Their Distribution, Sensing Techniques, Ecological Effects and Remediation. Chemosphere 2022, 287, 131996. [Google Scholar] [CrossRef]
- Böhlke, J.K. Groundwater Recharge and Agricultural Contamination. Hydrogeol. J. 2002, 10, 153–179. [Google Scholar] [CrossRef]
- DOF Norma Oficial Mexicana NOM-127-SSAI-2021 Agua Para Uso y Consumo Humano.Límites Permisibles de La Calidad Del Agua. 2021. Available online: https://www.dof.gob.mx/nota_detalle.php?codigo=5650705&fecha=02/05/2022#gsc.tab=0. (accessed on 26 June 2023).
- Gómez, H.; Del Campo, M.; Esteller, M.; Velasco, F.; Alva, E.; Cruz, A. Assessment of Nitrate and Heavy Metal Contamination of Groundwater Using the Heavy Metal Pollution Index: Case Study of Linares, Mexico. Environ. Earth Sci. 2020, 79, 433. [Google Scholar] [CrossRef]
- California Water Boards. Recursos Para Agricultores: Nitrato en el Agua Potable. Programa Regul. Agric. 2013, 1–4.
- Su, X.; Wang, H.; Zhang, Y. Health Risk Assessment of Nitrate Contamination in Groundwater: A Case Study of an Agricultural Area in Northeast China. Water Resour. Manag. 2013, 27, 3025–3034. [Google Scholar] [CrossRef]
- Ward, M.H. Too Much of a Good Thing? Nitrate from Nitrogen Fertilizers and Cancer. Rev. Environ. Health 2009, 24, 357–363. [Google Scholar] [CrossRef]
- Figueroa-Núñez, A.; Campos-Gaytán, J.R. Simulación Numérica Del Agua Subterránea En El Acuífero Guadalupe, Ensenada, Baja California, México: Caso de Estudio, Condiciones Estacionarias y Transitorias. Investig. Y Cienc. Univ. Auton. Aguascalientes 2018, 75, 46–54. [Google Scholar] [CrossRef]
- CONAGUA. Actualización de La Disponibilidad Media Anual de Agua En El Acuífero Guadalupe (0207). 2015. Available online: https://www.gob.mx/cms/uploads/attachment/file/103407/DR_0207.pdf (accessed on 15 May 2023).
- CONAGUA. Actualización de La Disponibilidad Media Anual de Agua En El Acuífero Guadalupe (0207). 2020. Available online: https://sigagis.conagua.gob.mx/gas1/Edos_Acuiferos_18/BajaCalifornia/DR_0207.pdf (accessed on 15 May 2023).
- CONAGUA. Actualización Hidrogeológica Del Acuífero Guadalupe (0207), Estado De Baja California. 2017. Available online: https://sigagis.conagua.gob.mx/gas1/sections/Disponibilidad_Acuiferos.html (accessed on 27 October 2023).
- Daesslé, L.W.; Mendoza-Espinosa, L.G.; Camacho-Ibar, V.F.; Rozier, W.; Morton, O.; Van Dorst, L.; Lugo-Ibarra, K.C.; Quintanilla-Montoya, A.L.; Rodríguez-Pinal, A. The Hydrogeochemistry of a Heavily Used Aquifer in the Mexican Wine-Producing Guadalupe Valley, Baja California. Environ. Geol. 2006, 51, 151–159. [Google Scholar] [CrossRef]
- Andrade, D.P. Zonificación Hidrogeológica e Hidrogeoquímica Del Acuífero de Valle de Guadalupe, B.C., Universidad Autónoma de Baja California. Master’s Thesis, Universidad Autónoma de Baja California, Ensenada Mexico, 2019. [Google Scholar]
- Del Toro Guerrero, F.J.; Kretzschmar, T.; Hinojosa Corona, A. Estimacion del Balance Hidrico en Una Cuenca Semiarida, El Mogor, Baja California, México. Tecnol. Y Ciencias Agua 2014, 5, 69–81. [Google Scholar]
- Saiz-Rodríguez, J.A.; Lomeli Banda, M.A.; Salazar-Briones, C.; Ruiz-Gibert, J.M.; Mungaray-Moctezuma, A. Allocation of Groundwater Recharge Zones in a Rural and Semi-Arid Region for Sustainable Water Management: Case Study in Guadalupe Valley, Mexico. Water 2019, 11, 1586. [Google Scholar] [CrossRef]
- Del Toro-Guerrero, F.J.; Vivoni, E.R.; Kretzschmar, T.; Runquist, S.H.B.; Vázquez-González, R. Variations in Soil Water Content, Infiltration and Potential Recharge at Three Sites in a Mediterranean Mountainous Region of Baja California, Mexico. Water 2018, 10, 1844. [Google Scholar] [CrossRef]
- Doerfliger, N.; Jeannin, P.; Zwahlen, F. Water Vulnerability Assessment in Karst Environments: A New Method of Defining Protection Areas Using a Multi-Attribute Approach and GIS Tools (EPIK Method). Environ. Geol. 1999, 39, 165–176. [Google Scholar] [CrossRef]
- Chamanehpour, E.; Sayadi, M.H.; Yousefi, E. The Potential Evaluation of Groundwater Pollution Based on the Intrinsic and the Specific Vulnerability Index. Groundw. Sustain. Dev. 2020, 10, 100313. [Google Scholar] [CrossRef]
- Khosravi, K.; Sartaj, M.; Tsai, F.T.C.; Singh, V.P.; Kazakis, N.; Melesse, A.M.; Prakash, I.; Tien Bui, D.; Pham, B.T. A Comparison Study of DRASTIC Methods with Various Objective Methods for Groundwater Vulnerability Assessment. Sci. Total Environ. 2018, 642, 1032–1049. [Google Scholar] [CrossRef]
- Puerta, R.; Rengifo, J.; Bravo, N. ARCGIS BÁSICO 10, ESRI, Universidad Nacional Agraria De La Selva. 2011. Available online: https://geoinnova.org/libro/manual-de-arcgis-10-basico/ (accessed on 14 February 2022).
- QGIS Development Team QGIS Desktop 3.22 User Guide. 2022. Available online: https://docs.qgis.org/3.22/pdf/en/QGIS-3.22-DesktopUserGuide-en.pdf (accessed on 16 July 2023).
- Servicio Geológico Mexicano Carta Geológico-Minera Francisco Zarco I11-D82, Baja California. 2001. Available online: https://www.sgm.gob.mx/GeoInfoMexGobMx/#. (accessed on 28 January 2022).
- Campos-Gaytan, J.R.; Kretzschmar, T.; Herrera-Oliva, C.S. Future Groundwater Extraction Scenarios for an Aquifer in a Semiarid Environment: Case Study of Guadalupe Valley Aquifer, Baja California, Northwest Mexico. Environ. Monit. Assess. 2014, 186, 7961–7985. [Google Scholar] [CrossRef]
- Esteller, M.; Quentin, E.; Díaz, C. Uso De Sistemas de Información Geográfica (SIG) Para la Determinación de Parámetros Utilizados en La Construcción de Mapas de Vulnerabilidad de Acuíferos. Rev. Latino-Americana Hidrogeol. 2002, 2, 17–30. [Google Scholar]
- Thermo Fisher Scientific Inc. Thermo Scientific Dionex Aquion Ion Chromatography System Operator’s Manual; Thermo Fisher Scientific Inc.: Munich, Germany, 2016; pp. 1–3. Available online: https://assets.thermofisher.com/TFS-Assets/CMD/manuals/man-22176-97006-aquion-rfic-man2217697006-en.pdf (accessed on 14 March 2022).
- Kurczyn-Robledo, J.A.; Kretzschmar, T.; Hinojosa-Corona, A. Evaluación del Escurrimiento Superficial en el Noreste del Valle de Guadalupe, B.C., México, Usando el Método de Curvas Numeradas y Datos de Satélite. Rev. Mex. Cienc. Geol. 2007, 24, 1–14. [Google Scholar]
- Umar, M.; Khan, S.N.; Arshad, A.; Aslam, R.A.; Khan, H.M.S.; Rashid, H.; Pham, Q.B.; Nasir, A.; Noor, R.; Khedher, K.M.; et al. A Modified Approach to Quantify Aquifer Vulnerability to Pollution towards Sustainable Groundwater Management in Irrigated Indus Basin. Environ. Sci. Pollut. Res. 2022, 29, 27257–27278. [Google Scholar] [CrossRef] [PubMed]
- Manjarrez-Domínguez, C.; Uc-Campos, M.I.; Esparza-Vela, M.E.; Baray-Guerrero, M.D.R.; Giner-Chávez, O.; Santellano-Estrada, E. Geospatial-Temporal Dynamics of Land Use in the Juárez Valley: Urbanization and Displacement of Agriculture. Sustainability 2023, 15, 8499. [Google Scholar] [CrossRef]
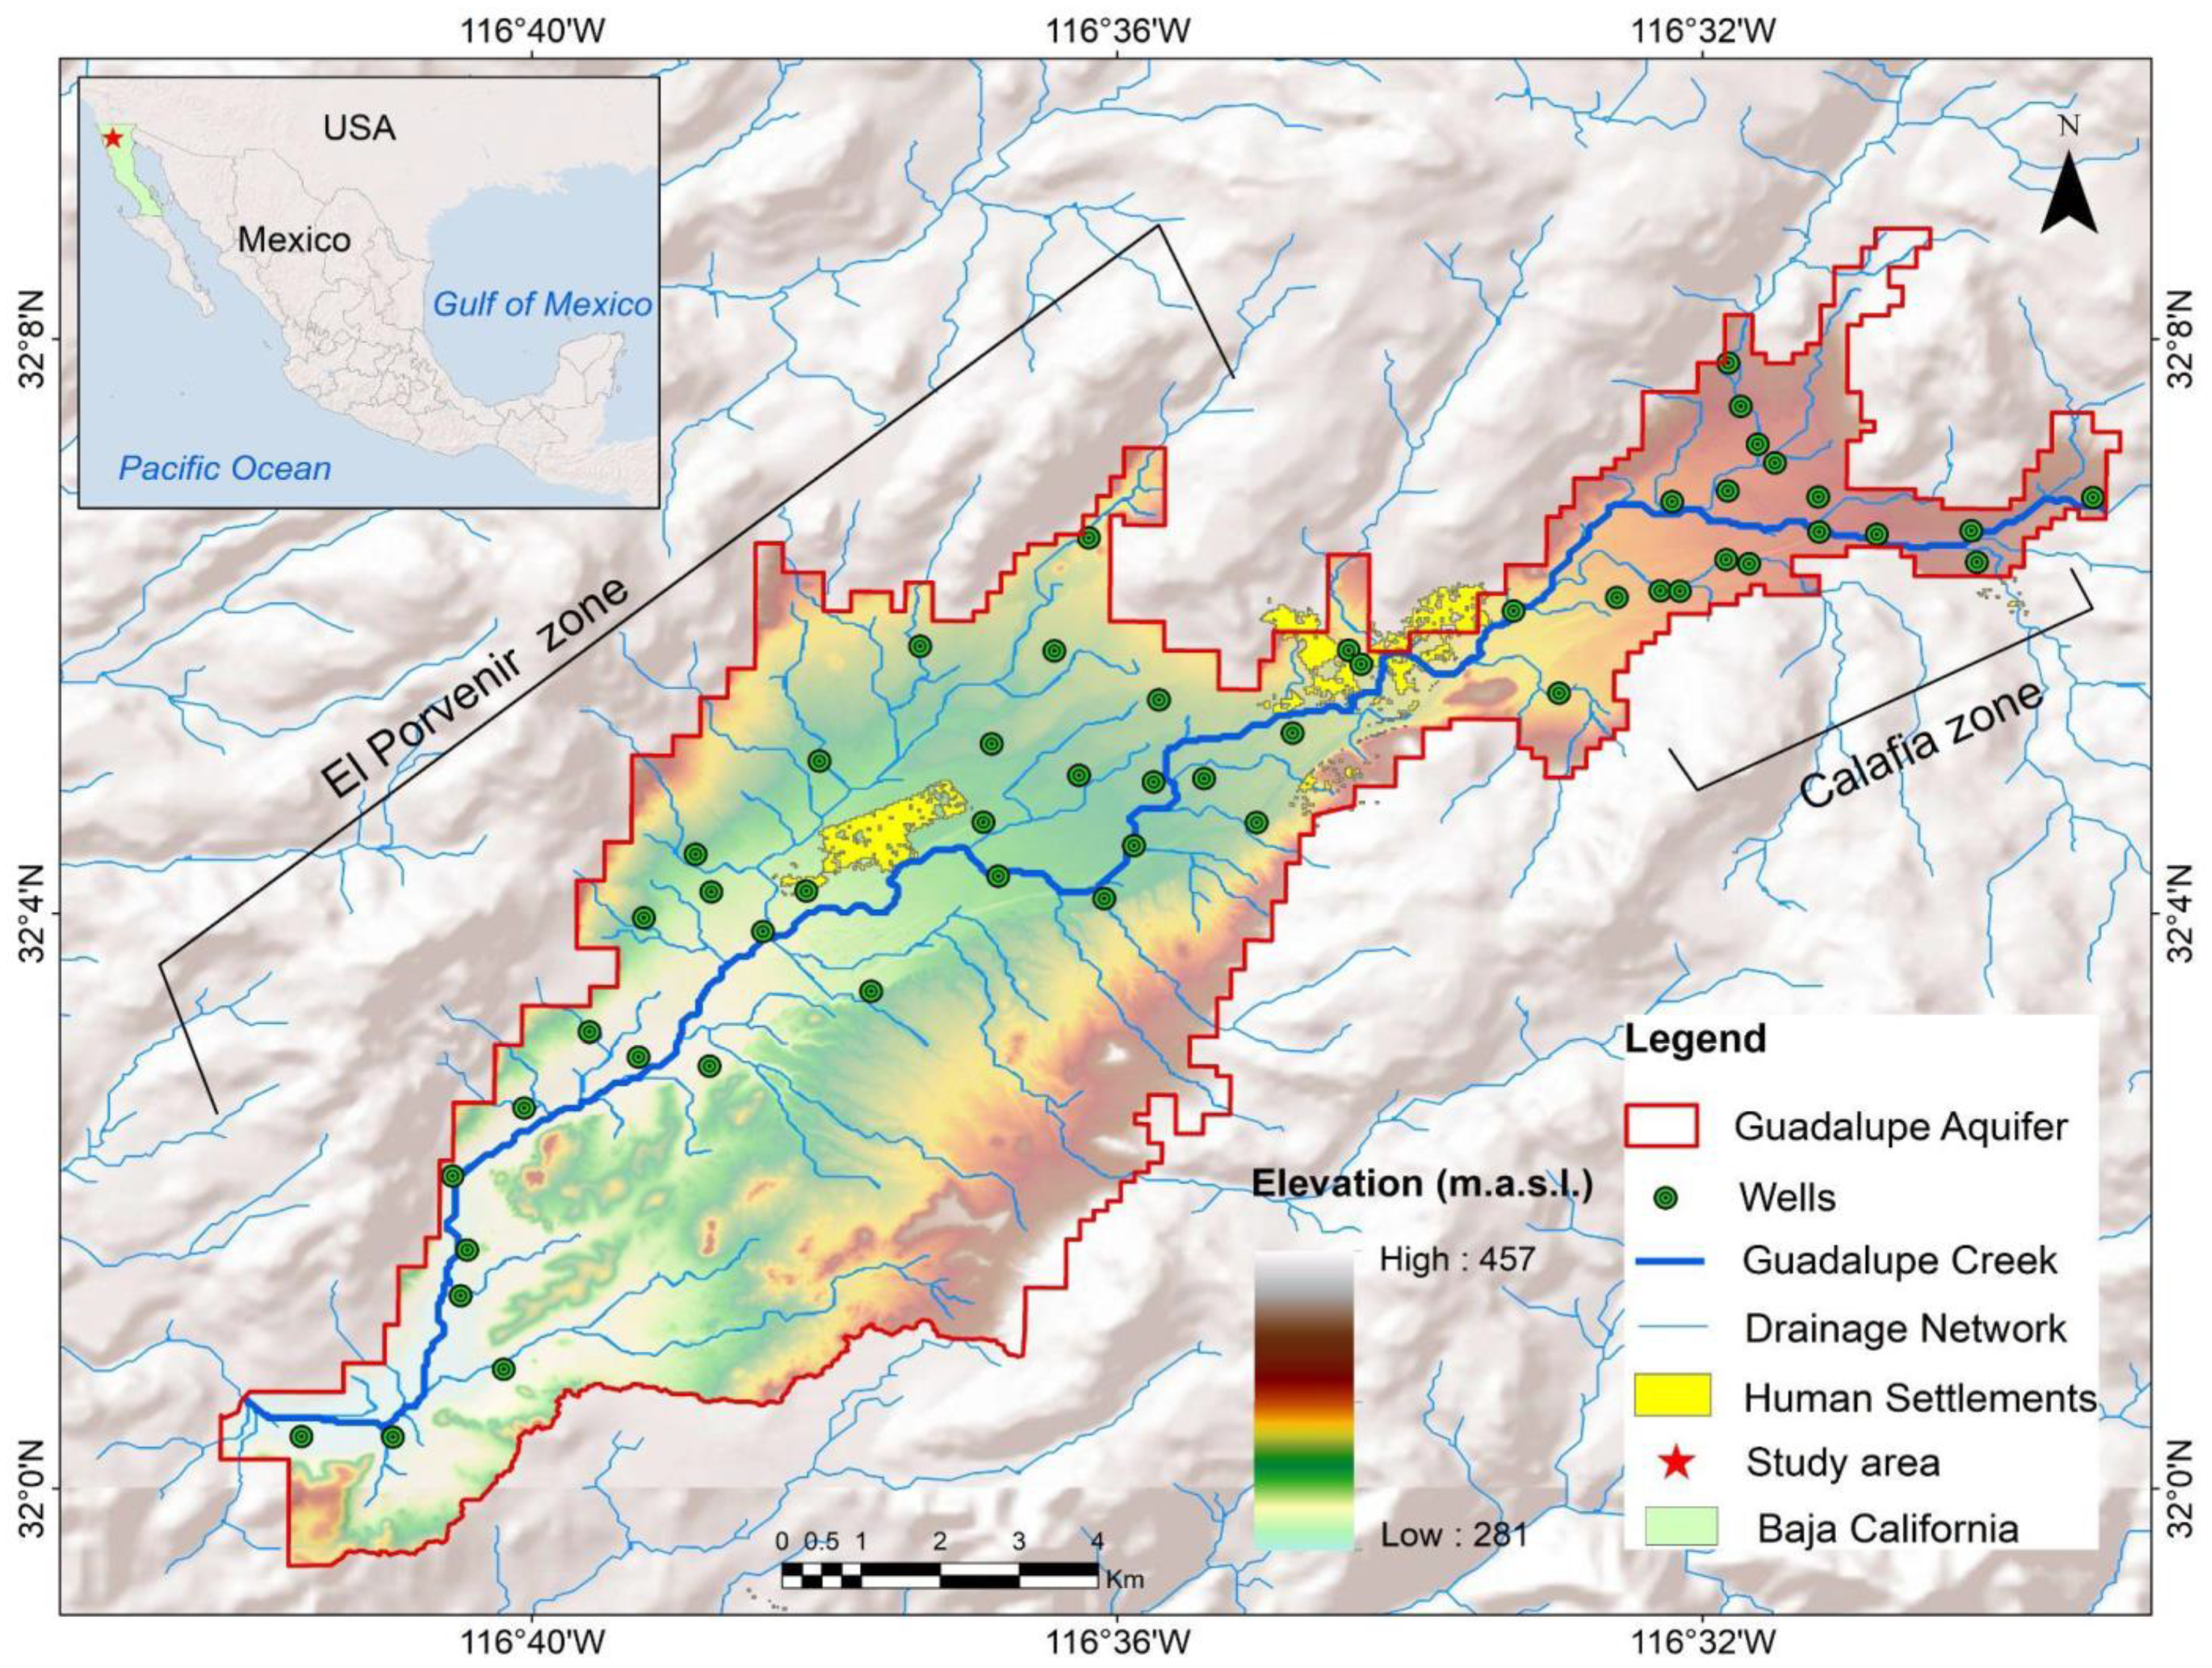
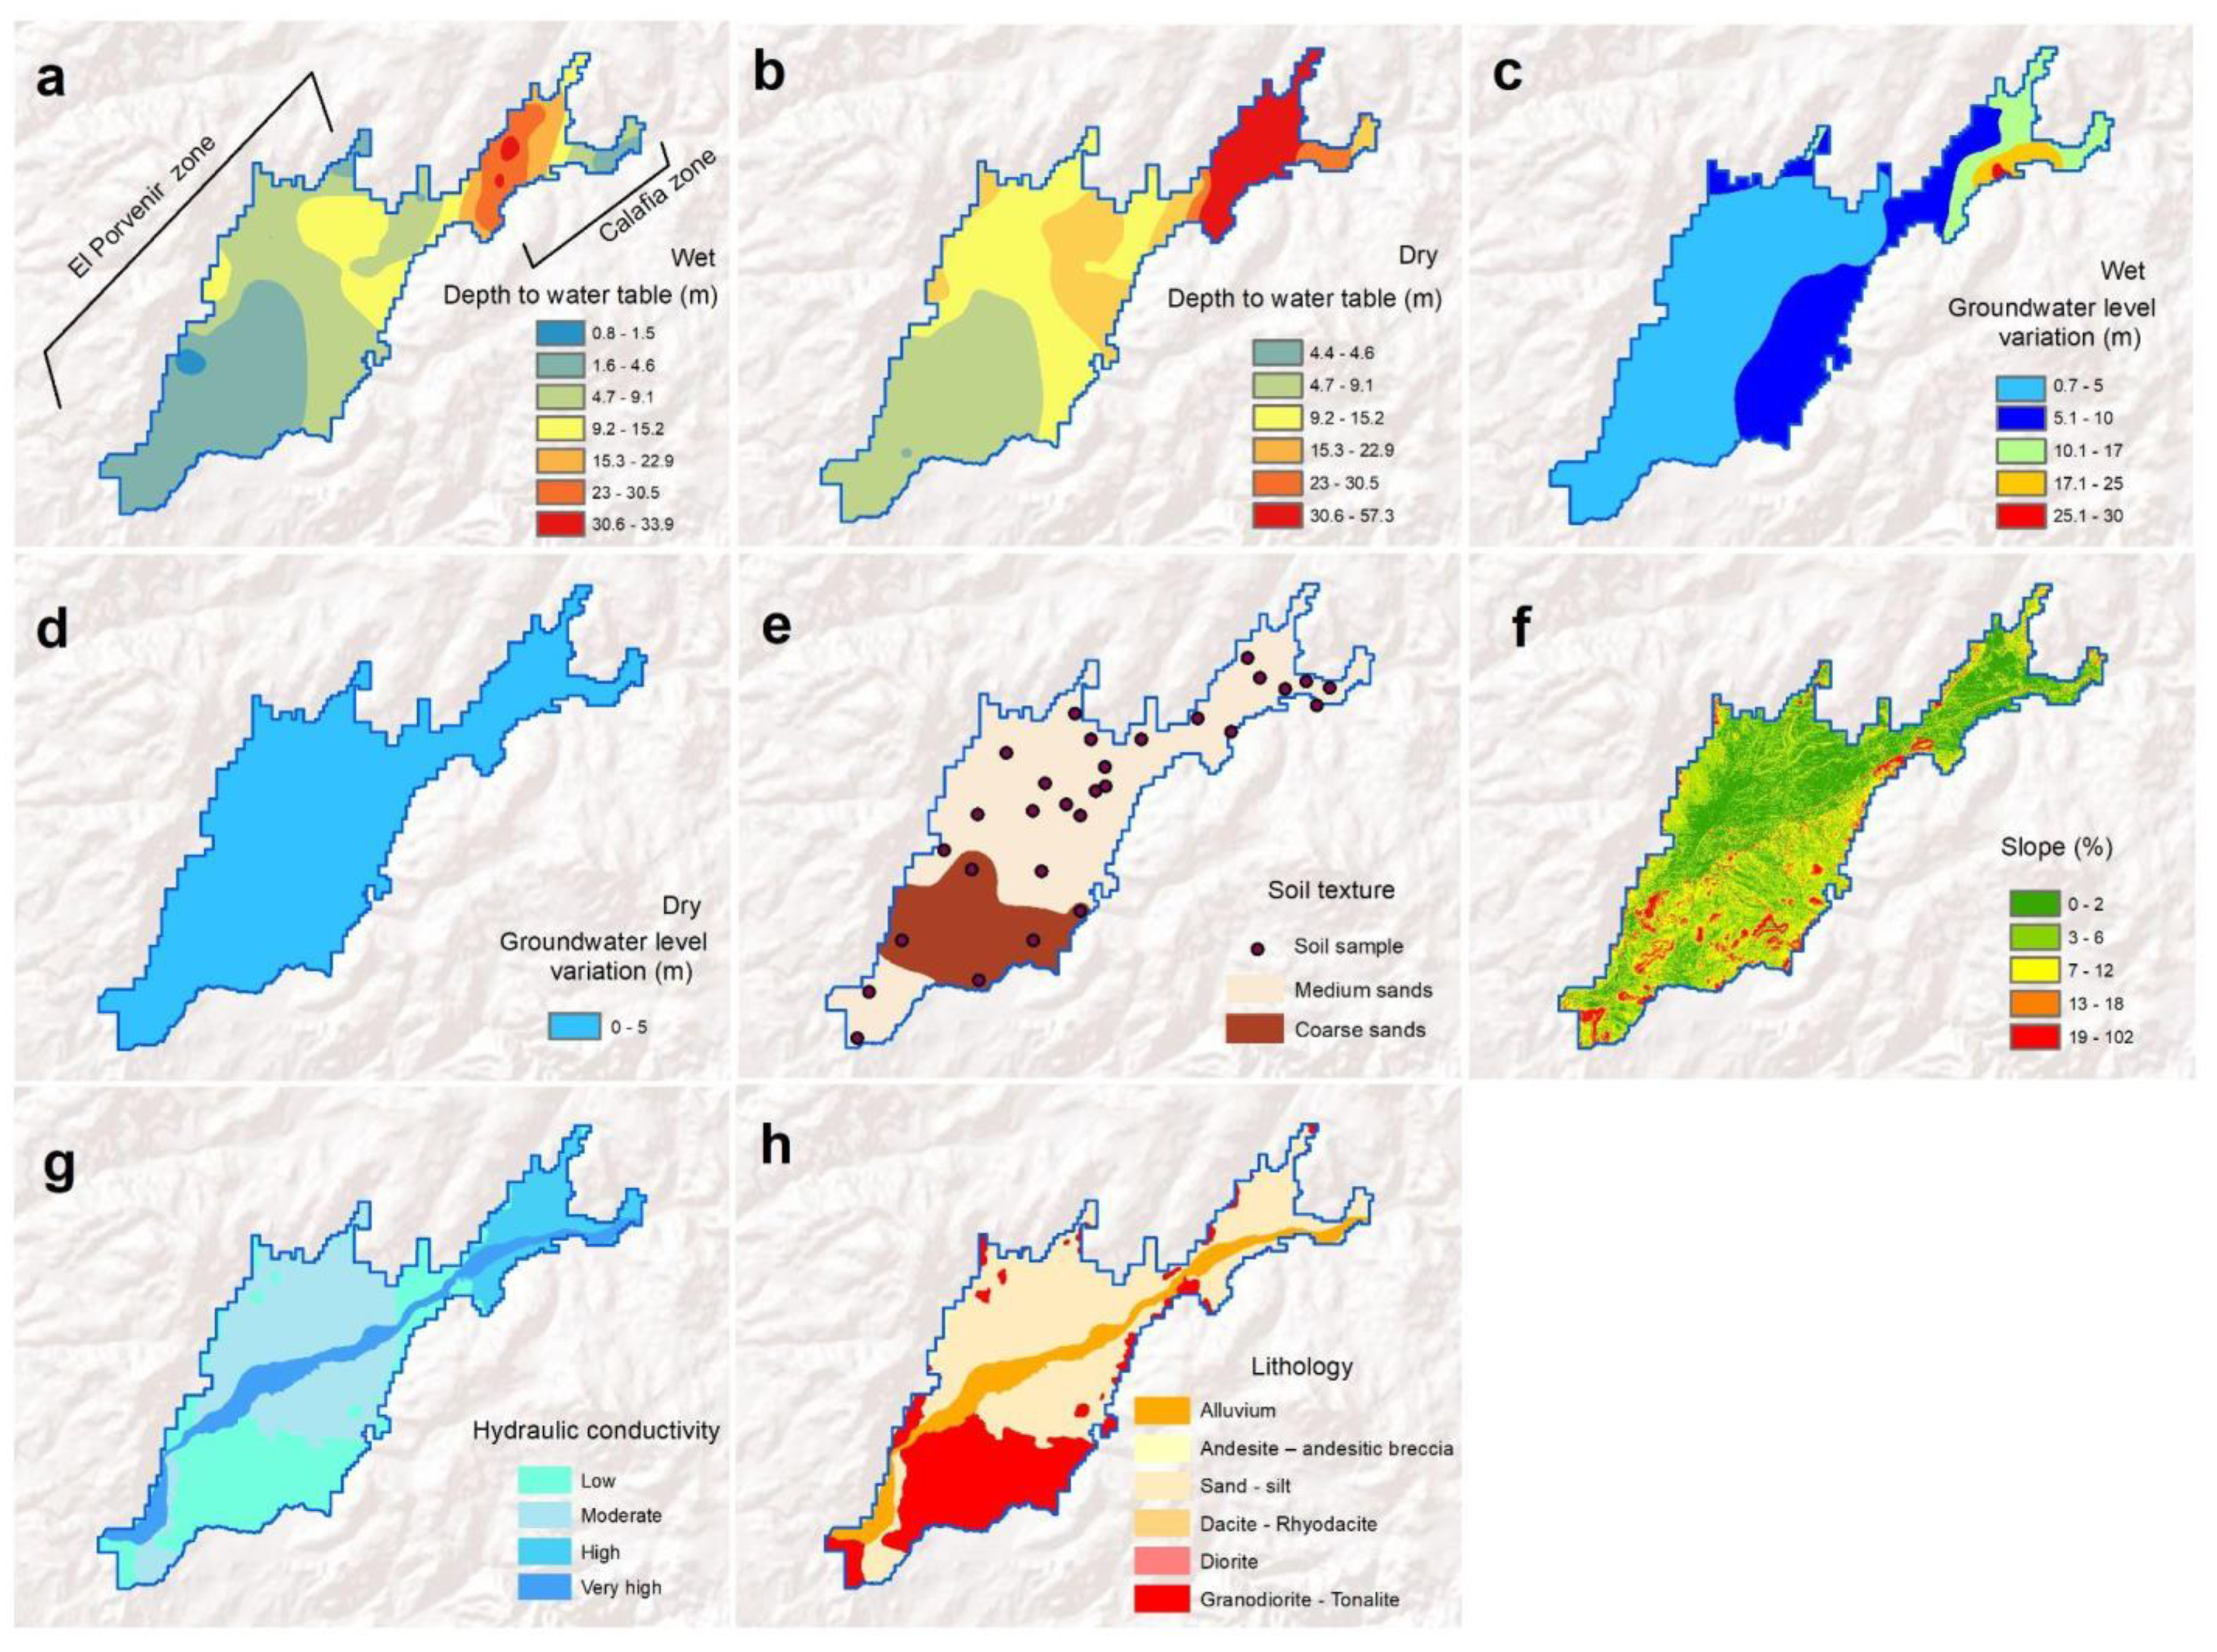
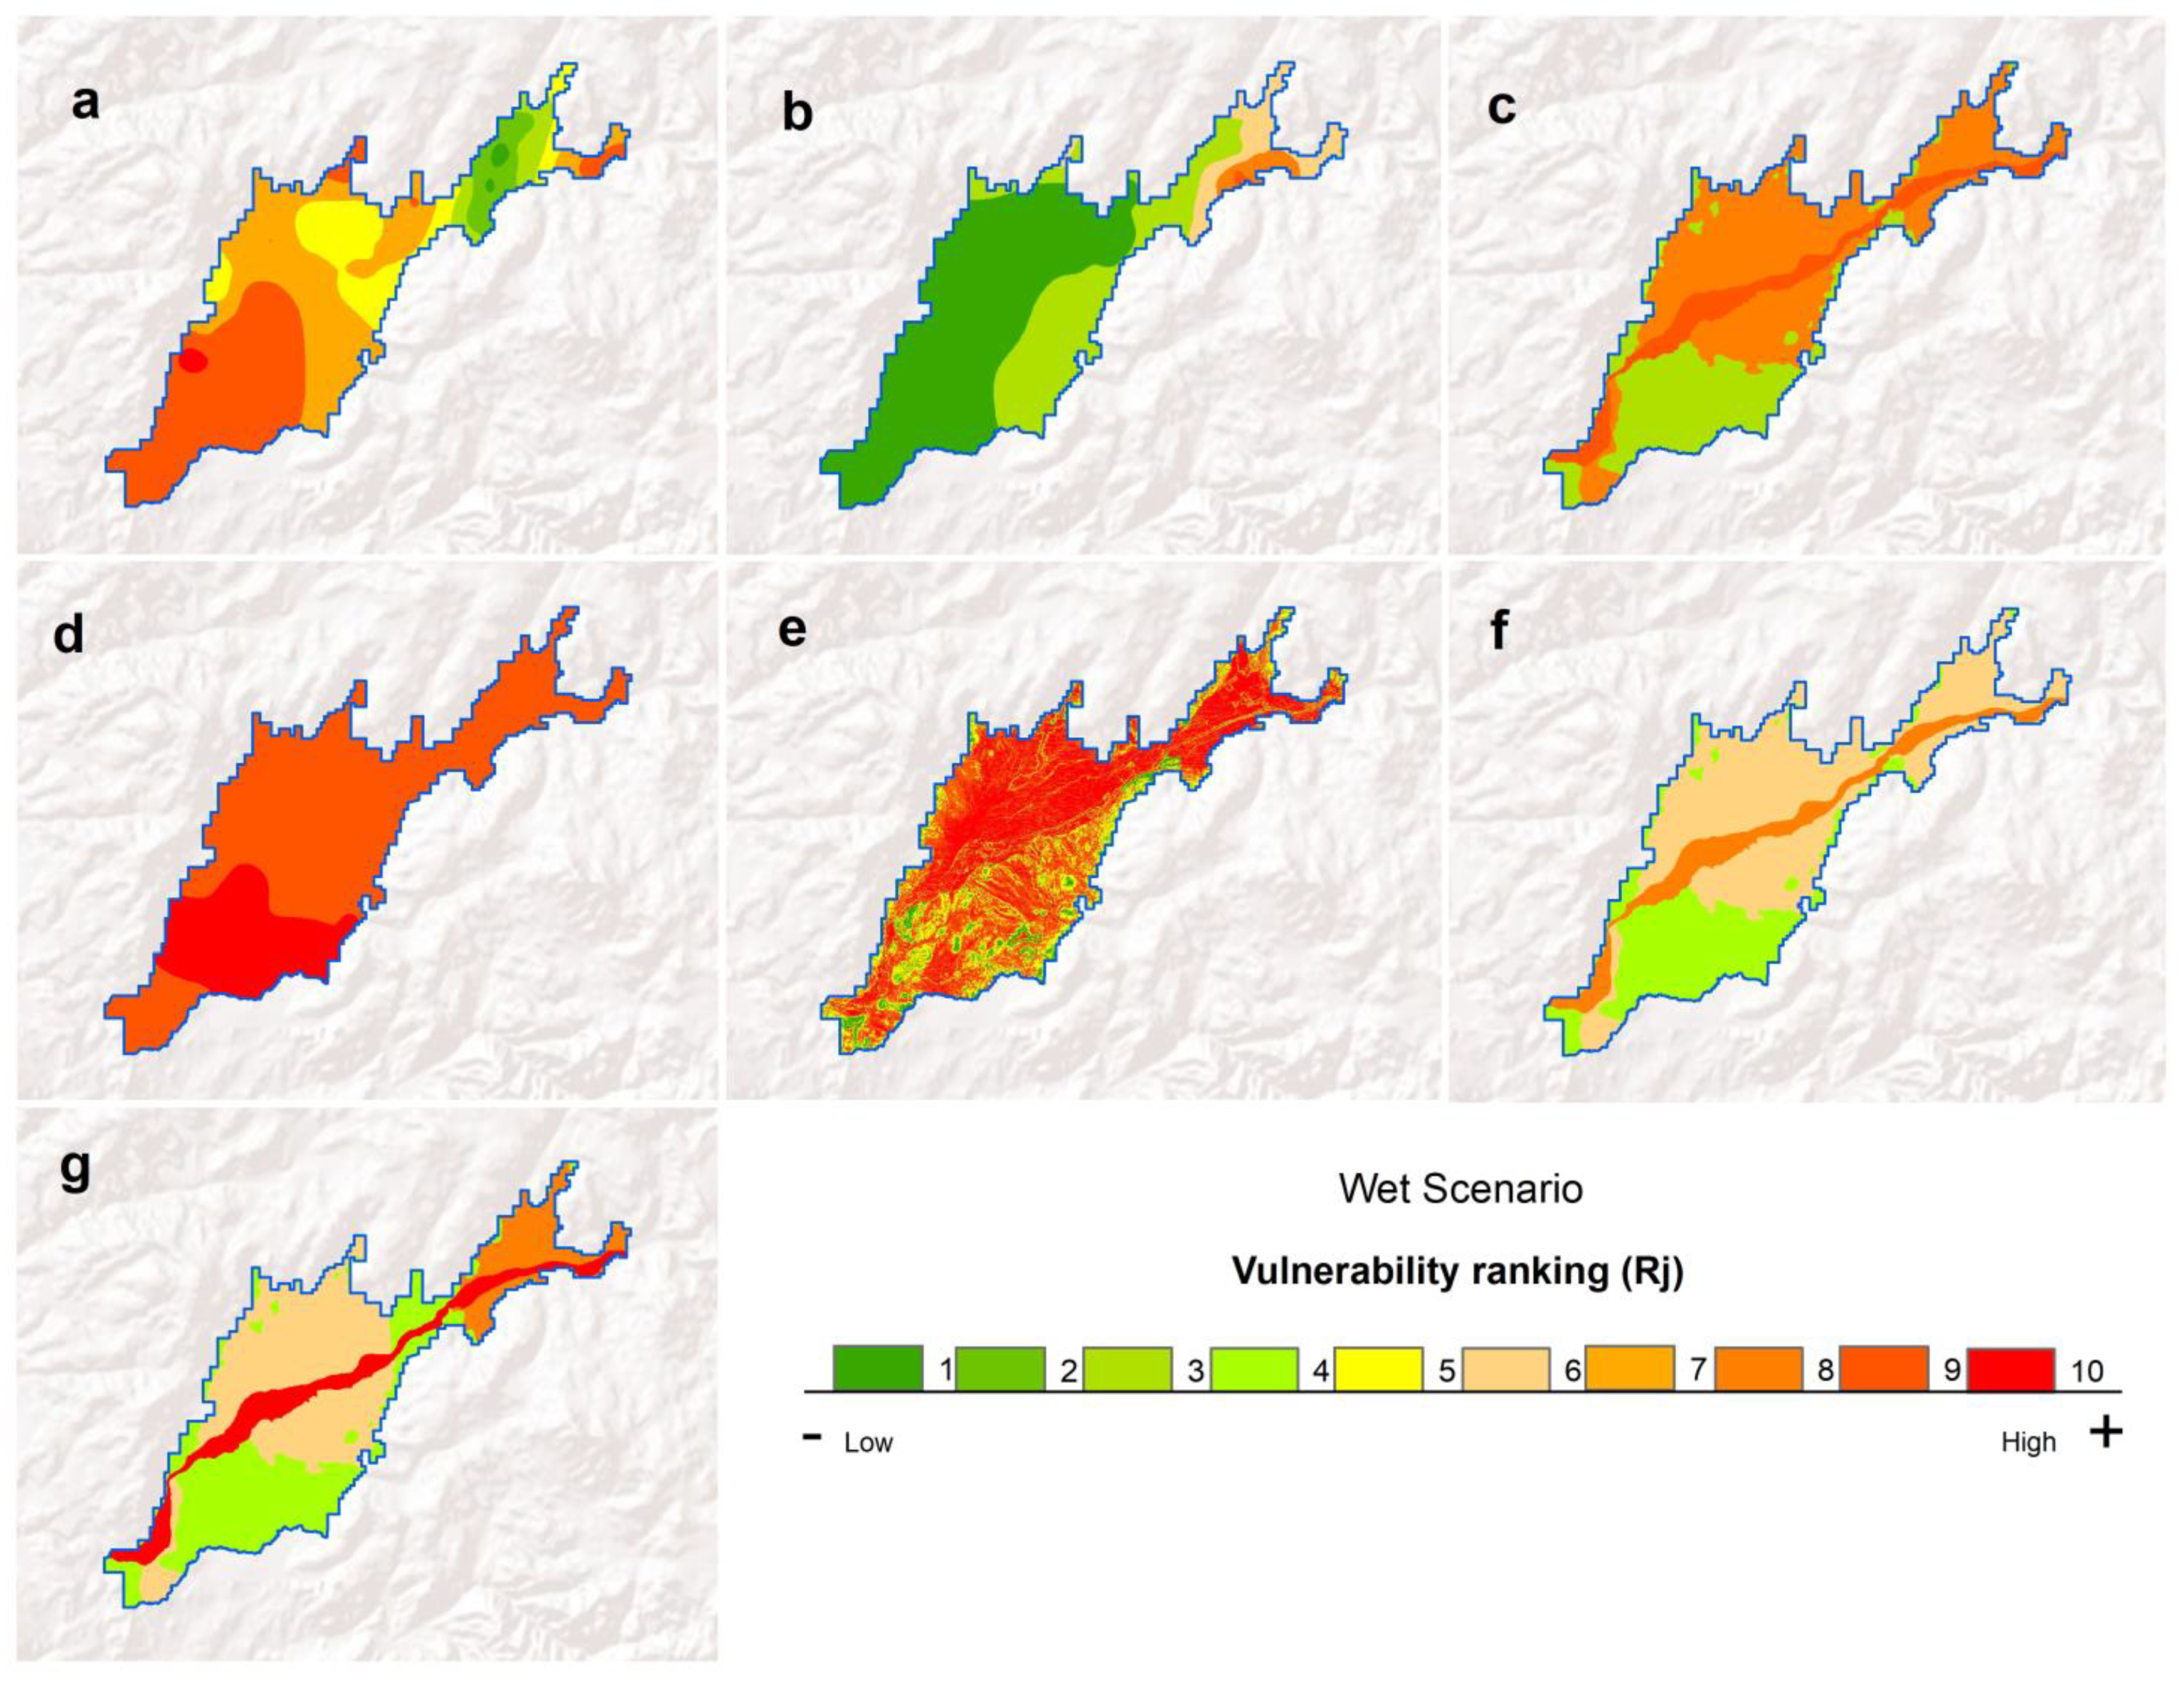

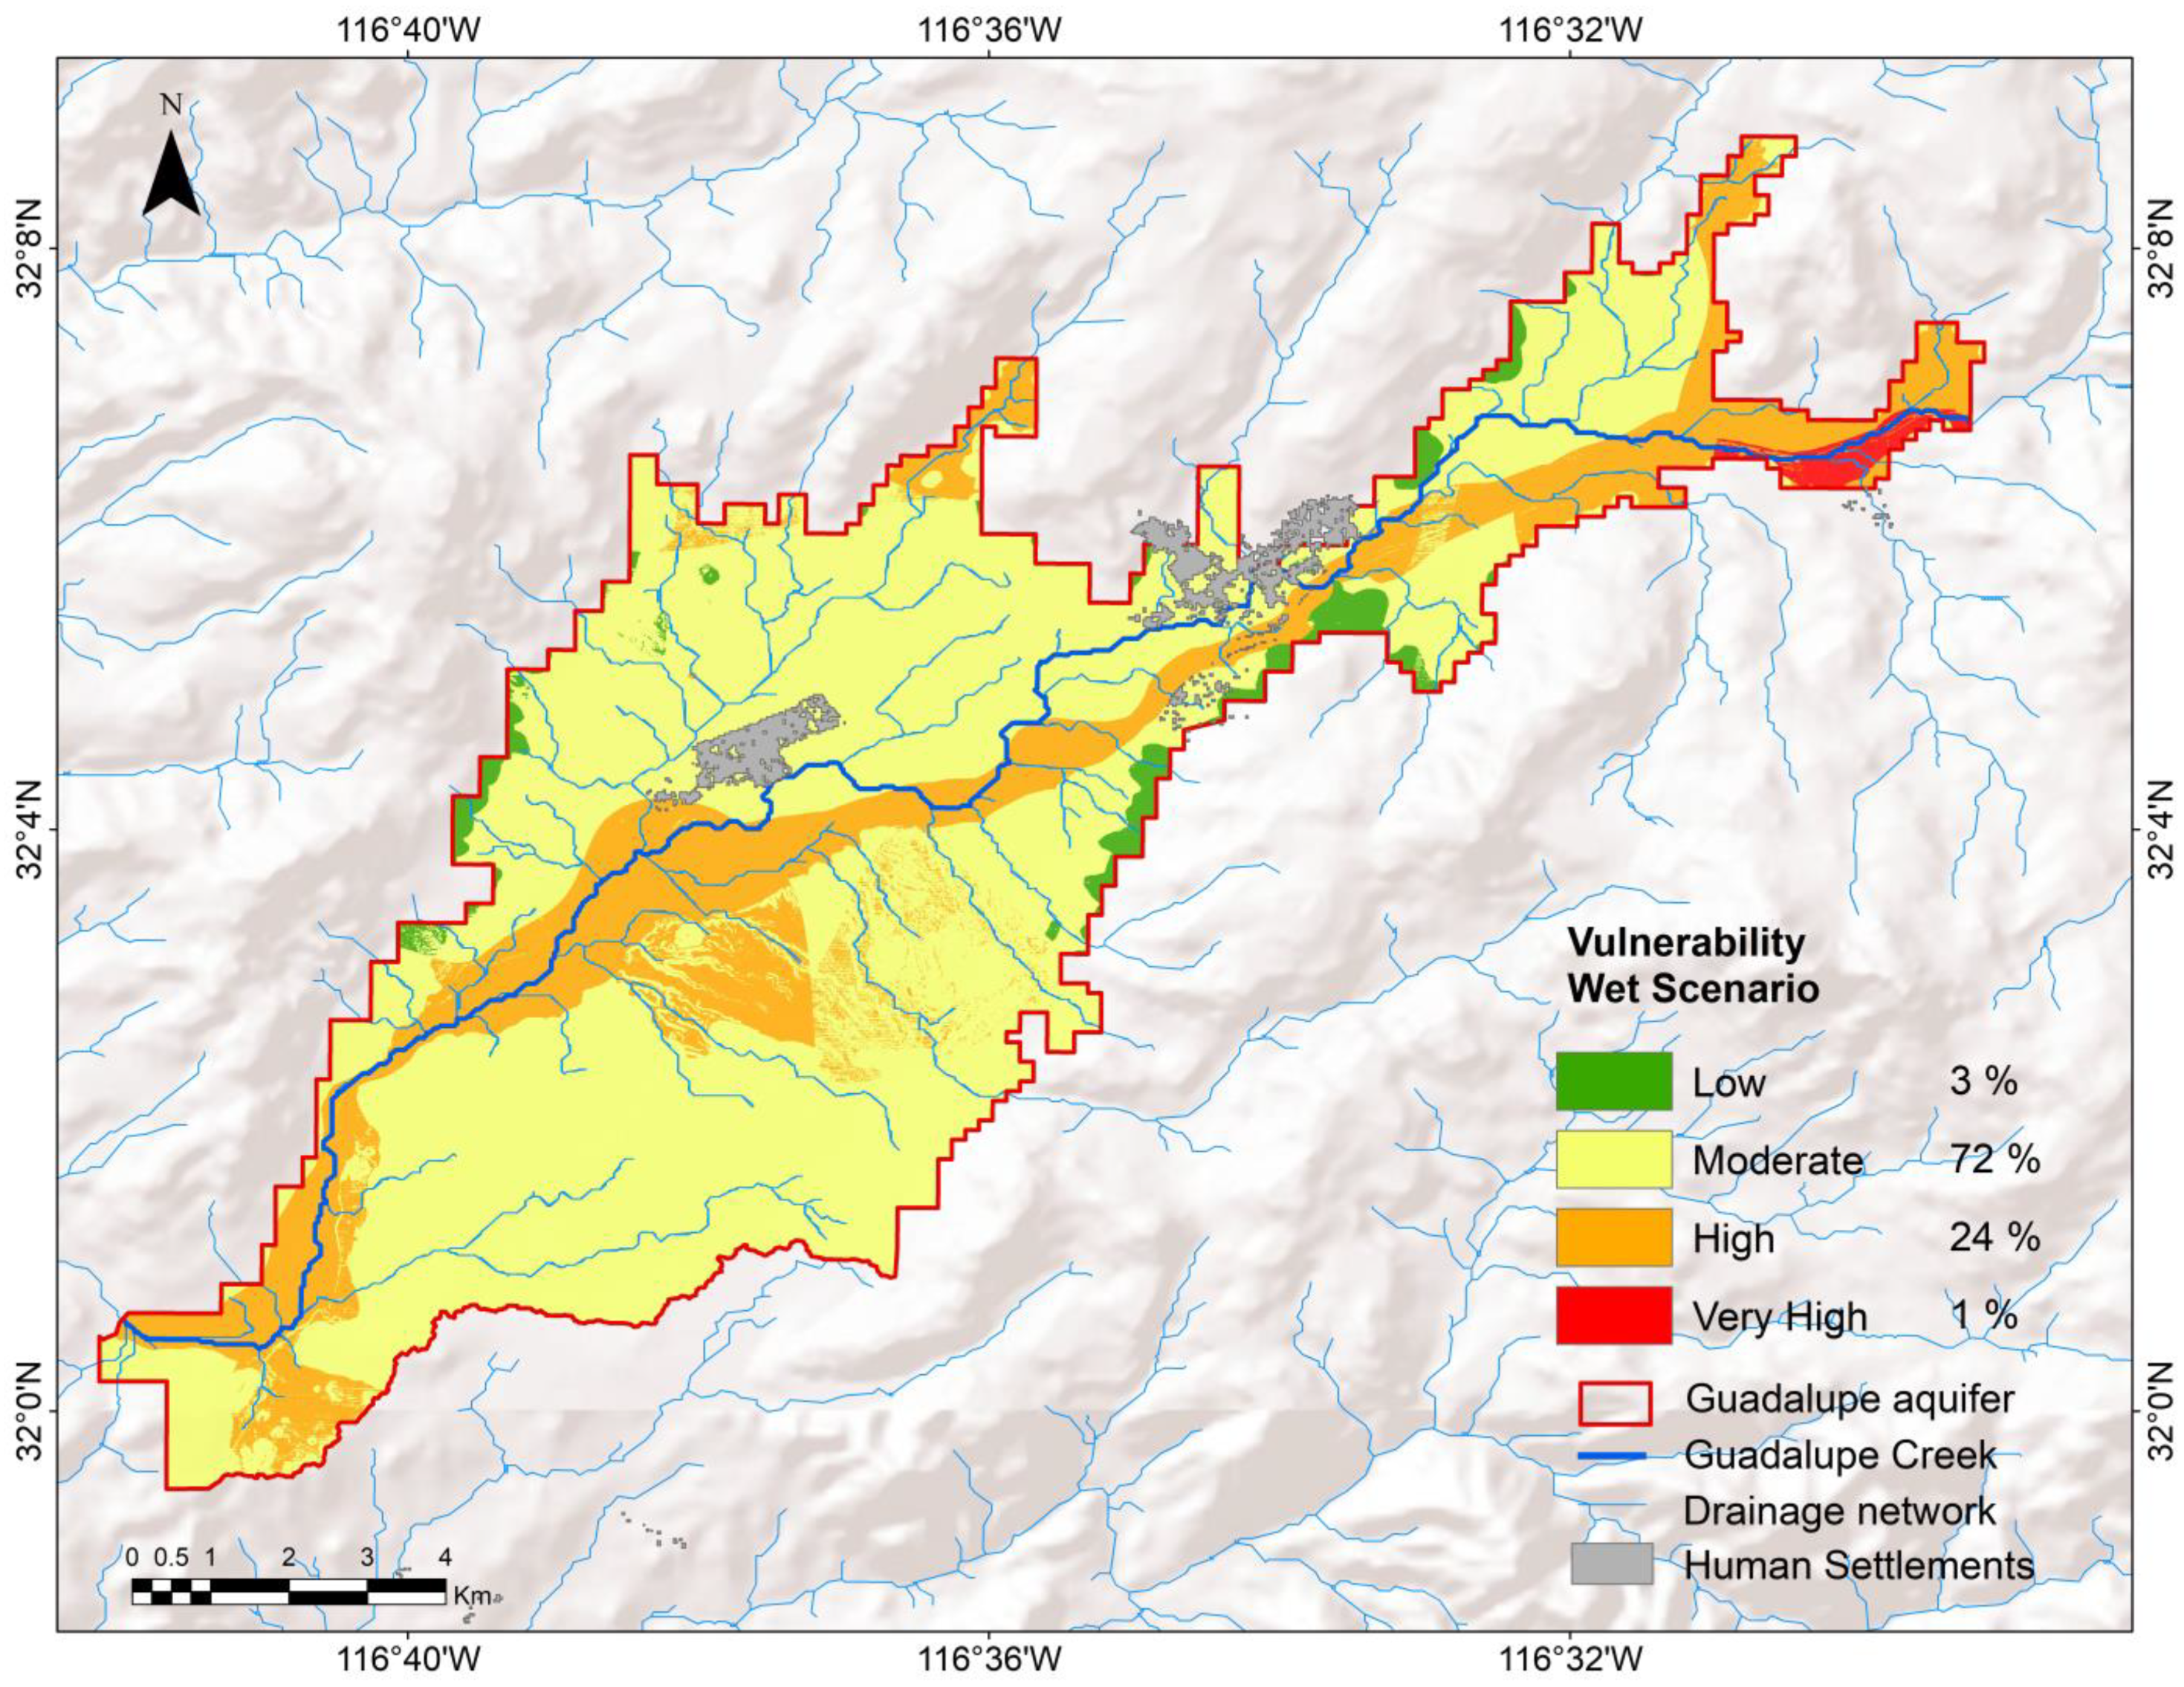



| Parameter | Description |
|---|---|
| D (Depth to Water Table) | The depth to water table indicates the thickness of the unsaturated zone, which is the length through which water travels by infiltration transporting the pollutant until it reaches the saturated zone of the aquifer [49]. The saturated zone is dynamic in unconfined aquifers, fluctuating with the seasons, extractions, and water availability. The deeper the groundwater level, the greater the probability of natural attenuation. |
| R (Recharge) | Recharge indicates the amount of water that infiltrates from the soil surface to the water table, increases the saturated thickness, and is the main transport of potential contaminants [18]. |
| A (Aquifer Media) | The aquifer media represents the lithology and structure of consolidated or unconsolidated sediments, in particular, the capacity of the porous and/or fractured medium to retain and transport water. A is considered a potential pathway for contaminant transport depending on its porosity (primary or secondary) [31]. Overall, the larger the size of the sediment or the more fractures it has, the higher the permeability, the lower the contaminant attenuation capacity, and the higher the probability of pollution. |
| S (Soil) | Soil type represents the uppermost layer of the aquifer, characterized by biological activity and exposure to erosion, where its thickness and texture are significant for attenuation, biodegradation, sorption, and volatilization processes. The S parameter impacts the amount of water that infiltrates into the soil, and its texture modulates the vertical movement of a pollutant to be transported by water through the space between the particles (depending on the size) in the vadose zone [50]. Anthropogenic practices on the land surface such as agricultural applications, can be a potential source of pollution. |
| T (Topography) | In this context, topography represents the slope and controls of surface and subsurface runoff velocity. In the case of a potential pollutant, the effect may be accumulation; for example, in agricultural areas with a lower slope percentage, nitrate concentration may accumulate due to the intensive use of fertilizers [50]. |
| I (Impact of the Vadose Zone) | The impact on the vadose zone corresponds to the site above the water table, controlling the length and time travel of water towards the saturated zone, thus influencing the available time for pollutant transport attenuation processes [51]. |
| C (Hydraulic Conductivity) | Hydraulic conductivity measures the speed with which water can pass through the porous or fractured medium of the aquifer [31]. Specifically, it measures the movement of water flowing through a porous medium. This parameter is controlled by the amount and interconnectedness of voids within the aquifer as a consequence of intergranular porosity and fracturing. |
| Parameter | DRASTIC Weight |
|---|---|
| D | 5 |
| R | 4 |
| A | 3 |
| S | 2 |
| T | 1 |
| I | 5 |
| C | 3 |
| Class | Rating | Definition |
|---|---|---|
| Very low | 23–64 | Presence of confining layers where vertical flow (percolation) is negligible. |
| Low | 65–105 | Vulnerable only to conservative pollutants (not commonly affected by chemical reactions in natural processes) when discharged or leached continuously over long periods. |
| Moderate | 106–146 | Vulnerable to some contaminants only when continuously discharged or leached. |
| High | 147–187 | Vulnerable to many pollutants (except those that are strongly absorbed or easily transformed) in numerous pollution scenarios. |
| Very high | 188–230 | Vulnerable to most pollutants with rapid impact in many pollution scenarios. |
| Depth to Water Table (D) | Recharge–Water Level Variation (R) | Aquifer Media (A) | Soil (S) | ||||
| Range (m) | Rj | Range (m) | Rj | Type | Rj | Texture | Rj |
| 0–1.5 | 10 | 0–5 | 1 | Granodiorite—Tonalite | 3 | Middle sands | 9 |
| 1.6–4.6 | 9 | 5.1–10 | 3 | Greenstone | 3 | Coarse sands | 10 |
| 4.7–9.1 | 7 | 10.1–17 | 6 | Dacite—Rhyodacite | 3 | ||
| 9.2–15.2 | 5 | 17.1–25 | 8 | Andesite | 4 | ||
| 15.3–22.9 | 3 | >25 | 9 | Sand—Silt | 8 | ||
| 23–30.5 | 2 | Alluvium | 9 | ||||
| >30.5 | 1 | ||||||
| Topography (T) | Impact of the Vadose Zone (I) | Hydraulic Conductivity (C) | |||||
| Range (%) | Rj | Type | Rj | Category | Rj | ||
| 0–2 | 10 | Granodiorite—Tonalite | 4 | Low | 4 | ||
| 2–6 | 9 | Diorite | Moderate | 6 | |||
| 6–12 | 5 | Dacite—Rhyodacite | 4 | High | 8 | ||
| 12–18 | 3 | Andesite | 4 | Very High | 10 | ||
| > 18 | 1 | Sand—Silt | 4 | ||||
| Alluvium | 6 | ||||||
| 8 | |||||||
| Class Number | Vulnerability | DRASTIC Index Value | Dry Scenario Area (%) | Wet Scenario Area (%) |
|---|---|---|---|---|
| 1 | Low | 65–105 | 19 | 3 |
| 2 | Moderate | 106–146 | 72 | 72 |
| 3 | High | 147–187 | 9 | 24 |
| 4 | Very high | 188–230 | 0 | 1 |
| Year | Number of Samples | Concentration (mg L−1) | |||
|---|---|---|---|---|---|
| Min | Max | Mean | Standard Deviation | ||
| 2001 [44] | 27 | 0.44 | 115.13 | 26.56 | 26.29 |
| 2020 | 33 | 0.25 | 131.19 | 19.90 | 30.82 |
| 2021 | 28 | 0.08 | 128.95 | 30.74 | 34.76 |
| Color | Categories | Min | Max | |
|---|---|---|---|---|
 | Green | Good | 0.44 | 24.31 |
 | Yellow | Fair | 24.32 | 48.62 |
 | Orange | Bad | 48.63 | 97.24 |
 | Red | Very bad | 97.25 | 131.19 |
Disclaimer/Publisher’s Note: The statements, opinions and data contained in all publications are solely those of the individual author(s) and contributor(s) and not of MDPI and/or the editor(s). MDPI and/or the editor(s) disclaim responsibility for any injury to people or property resulting from any ideas, methods, instructions or products referred to in the content. |
© 2024 by the authors. Licensee MDPI, Basel, Switzerland. This article is an open access article distributed under the terms and conditions of the Creative Commons Attribution (CC BY) license (https://creativecommons.org/licenses/by/4.0/).
Share and Cite
Díaz-Gutiérrez, G.; Daesslé, L.W.; Del-Toro-Guerrero, F.J.; Villada-Canela, M.; Seingier, G. Vulnerability to Aquifer Pollution in the Mexican Wine Producing Valley of Guadalupe, México. Hydrology 2024, 11, 16. https://doi.org/10.3390/hydrology11020016
Díaz-Gutiérrez G, Daesslé LW, Del-Toro-Guerrero FJ, Villada-Canela M, Seingier G. Vulnerability to Aquifer Pollution in the Mexican Wine Producing Valley of Guadalupe, México. Hydrology. 2024; 11(2):16. https://doi.org/10.3390/hydrology11020016
Chicago/Turabian StyleDíaz-Gutiérrez, Guadalupe, Luis Walter Daesslé, Francisco José Del-Toro-Guerrero, Mariana Villada-Canela, and Georges Seingier. 2024. "Vulnerability to Aquifer Pollution in the Mexican Wine Producing Valley of Guadalupe, México" Hydrology 11, no. 2: 16. https://doi.org/10.3390/hydrology11020016
APA StyleDíaz-Gutiérrez, G., Daesslé, L. W., Del-Toro-Guerrero, F. J., Villada-Canela, M., & Seingier, G. (2024). Vulnerability to Aquifer Pollution in the Mexican Wine Producing Valley of Guadalupe, México. Hydrology, 11(2), 16. https://doi.org/10.3390/hydrology11020016


