Abstract
The study examines the impacts of climate change and sea level rise on coastal aquifers, focusing on the influence of the components of the water cycle on seawater intrusion, and the evolution of the phenomenon in the future. The simulation of coastal water resources was performed using an integrated modeling system (IMS), designed for agricultural coastal watersheds, which consists of inter-connected models of surface hydrology (UTHBAL), groundwater hydrology (MODFLOW), and seawater intrusion (SEAWAT). Climatic models for the adverse impact scenario (RCP8.5) and the medium impact scenario (RCP4.5) of climate change were used. Transient boundary head conditions were set to the coastal boundary, to dynamically represent the rise in sea level due to climate change. The response of groundwater in the coastal Almyros Basin, located in central Greece, was simulated from 1991 to 2100. The findings indicate that seawater intrusion will be advanced in the future, in both climate change scenarios. The models show varying patterns in groundwater recharge, with varying uncertainty projected into the future, and sensitivity to time in the fluctuation of the components of the water cycle.
1. Introduction
Groundwater aquifers are facing challenges related to seawater intrusion, due to climate change and anthropogenic activities. The quantity and quality of groundwater resources are being impacted by surface water depletion, rising temperatures, and sea level rise [1,2,3]. In the face of our changing climate, the delicate balance between freshwater and the encroaching sea has become a critical concern for coastal communities and environmental stewards worldwide [4]. As communities grapple with the uncertainty of climate change, and with the freshwater that sustains them under threat, an understanding of the seawater wedge’s evolution becomes extremely important. Seawater contains salts in very high concentrations, the mass of which causes saltwater to have a higher fluid density (1.025 g/cm3) and a higher weight than freshwater (1 g/cm3) [5]. In seawater intrusion, saltwater infiltrates the freshwater in coastal aquifers and forms wedge-shaped plumes of contamination. The impacts of climate change and human activity are worldwide environmental concerns that need to be closely watched and further researched [6]. Sustainable groundwater management practices, aquifer recharge, and careful monitoring are essential for addressing seawater intrusion and ensuring the long-term availability of freshwater resources in coastal regions [7]. Research on seawater intrusion is more prevalent in countries facing a higher risk of this phenomenon due to factors like sea level rise, the over-pumping of groundwater, or specific geological conditions, while it is also greatly influenced by the availability of funding, research institutions, and scientific expertise within each country. The biggest contributions in this field of research, between 1970 and 2019, came from the United States with 23.9%, China with 14.8%, and Australia with 7.7%, followed by Italy, Japan, Canada, France, Germany, India, Spain, and others [8]. Seawater intrusion poses a threat to over 100 nations and regions worldwide, yet much of the coastline is not adequately monitored [9]. The causes of occurrence of seawater intrusion in coastal aquifers can vary in significance, depending on the specific circumstances of each coastal area, e.g., proximity to the sea, natural hydrogeological background, overuse of groundwater, and water table drawdown [10]. Seawater intrusion is a very important problem for coastal aquifer systems across Europe, especially along the Mediterranean coastline [11]. In recent years, the intense degradation of groundwater quality, due to salinization, has become evident in arid or semi-arid climate areas, because these areas are more vulnerable to seawater intrusion than other coastal aquifer systems in other regions of the world. A characteristic example of a highly vulnerable basin is the Mediterranean basin, and its coastal groundwaters have been documented in the literature as having been salinized to a lesser or greater extent. Chloride compounds are allowed in water for human consumption up to a limit of 250 mg/L, but in higher quantities, they are taste-perceptible and are also associated with health problems [12,13]. The maximum limits for chloride ions are also in line with the World Health Organization (WHO) [14]. The Water Framework Directive [15] in Europe, according to articles 17 (1) and (2), includes a specific Directive for Groundwater 2006/118/EC [16], wherein specific measures are established to prevent the degradation of groundwater and its impact on surface water (i.e., rivers, lakes, and wetlands). Significant importance is given to water pollution, distinguishing between substances of a natural background and those originating from other processes, and to seawater intrusion/salinization.
Climate-driven modifications in recharge and sea level rise are major drivers of saltwater intrusion, with rising sea levels affecting a large percentage of coastal watersheds [17]. Seawater intrusion simulation is a valuable tool for understanding and managing the movement of saltwater into coastal aquifers [18]. Numerical and analytical models are being developed to investigate saltwater intrusion and estimate the depth of the freshwater-to-saltwater interface. These simulations typically involve mathematical models that represent the complex hydrogeological processes governing the interaction between freshwater and seawater. The future consequences of climate change on groundwater resources are being evaluated through integrated modeling techniques, such as those joining together groundwater and climate models [19,20]. Thus, considering both sea level rise and freshwater recharge rates can enhance knowledge of the consequences of climate change on seawater intrusion [21]. When modeling seawater intrusion under climate change, several key factors are necessary to consider. These factors include the impacts of climate change on recharge and sea level rise, as well as the influence of freshwater discharges, bed slopes, and hydraulic conductivity on the length of saline intrusion [22,23]. Seawater intrusion is greatly influenced by the capacity of the aquifer to transmit water, known as its hydraulic conductivity, as well as the pattern of water flow within the main aquifers [24]. Furthermore, the rising sea levels and decreasing freshwater reserves can exacerbate the issue of saltwater intrusion [25]. Developing accurate seawater intrusion simulations requires a substantial amount of data, including aquifer properties/parameters, boundary conditions, and historical information. Seawater intrusion models make various assumptions and simplifications, such as assuming steady-state conditions or neglecting certain hydrogeological processes [26]. However, these assumptions may not hold in all situations, leading to potential inaccuracies [27]. One of the primary issues with numerical models is that, on occasion, the initial and boundary conditions must be made simpler. For instance, the boundary of the ocean can be set at a fixed level [28]. Nevertheless, seawater intrusion simulations are particularly valuable in regions with poorly monitored aquifer systems along the coastline, where limited funding for monitoring often hinders direct data collection efforts. Traditional modeling approaches often struggle to capture the variabilities of these systems, leading to inaccuracies and uncertainties in water resource management. By adopting a holistic approach, these simulations enable a comprehensive understanding of the multifaceted factors contributing to seawater intrusion, making them instrumental in formulating effective management strategies under climatic changes [29,30]. Additionally, they provide a timeseries of simulated profiles and expansion, offering a temporal dimension to the understanding of seawater intrusion dynamics and helping decision-makers plan for a more resilient and sustainable coastal future.
This study makes a contribution to the field by providing integrated modeling approaches to estimate the complex impacts of climate change and sea level rise on groundwater aquifer systems, with a specific focus on seawater intrusion. The incorporation of transient head boundary conditions in the models allows for a dynamic representation of the aquifer’s behavior, providing a more realistic representation of the interactions between regional climatic forcings, sea level rise, shifts in groundwater recharge, groundwater uses, and seawater intrusion.
2. Materials and Methods
2.1. Study Area
Many coastal aquifer systems in Greece suffer from seawater intrusion and salinity degradation [31,32]. The research focuses on the Almyros basin, a coastal location in central Greece, specifically within the region of Thessaly. The basin contains a large low elevated plain in its coastal section, and its altitude varies from 0 m to roughly 1710 m, as depicted in Figure 1. The total area is 856 km2 and is elevated by 30% to 150 m, by 57% in hilly areas to 800 m, and by 13% to mountainous areas. Climatic zones were obtained from a publicly available dataset from the global studies of Metzger et al. (2013) [33] and Sayre et al. (2014) [34]. Overlaying the contoured elevation of the study area and the climatic zones, as highlighted in Figure 1, the prevailing climatic conditions are characterized as Mediterranean; however, depending on the elevation, it is observed that specific differentiations exist. Up to 300 m, the climate is warm and semi-arid, up to 900 m, it is warm and moist, and higher than this elevation, it is cool and wet. The basin is divided into six sub-watersheds [35]. Numerous streams with intermittent flow gather into six main streams, and no other storage surface water bodies exist within the basin (Figure 1). The annual areal precipitation is 570 mm and the average temperature is 15 °C. Under the ground, there is a significant granular aquifer system that is used to cover the water supply needs, mainly agricultural and urban, of the basin. The Almyros aquifer system is mainly composed of geological materials of Neogene and Quaternary age, classified into five intercalating groups, namely clay, clay–gravel–sand, sand, clay–sand, and limestone, as highlighted and drawn in Figure 2a [36]. Limited coastal karsts a have direct hydraulic connection to sea, but not with the aquifer. Other small aquifers also exist in Mount Orthrys and to the north, but impermeable materials occur around the Almyros aquifer. Surface runoff accounts for 20% of precipitation across the Almyros Basin; 11–12% of precipitation recharges the Almyros aquifer in the northern and central regions (i.e., the watersheds of Kazani, Lahanorema, Holorema, and Xirias) and 5–6% recharges the aquifer in the southern region (the watersheds of Platanorema and Xirorema). Within the historical period of the study, agricultural activities occupy approximately 205 km2, constituting nearly 70% of the aquifer’s total area. The water uses cover the needs of the irrigated crops of wheat, alfalfa, vegetables, cotton, maize, trees, olive groves, and vineyards. However, the semi-arid hydrological status of the area, combined with the groundwater abstractions for agricultural and other uses, have led to a lowering groundwater table and seawater intrusion in the coastal lowland area, as shown and highlighted in Figure 2b. Groundwater flows from high elevated areas towards the lowlands and the sea in the central region of the aquifer, and the flow directions change on the northern coast and in the southern region, according mostly to hydrogeological permeability and to the difference in elevation between the water table and sea level. Nowadays, the Almyros basin is a basin which faces severe seawater intrusion that has evolved through the years, mostly at the northern coastline, as observed and estimated in previous studies [35,37,38] in the region and as described in the next section.
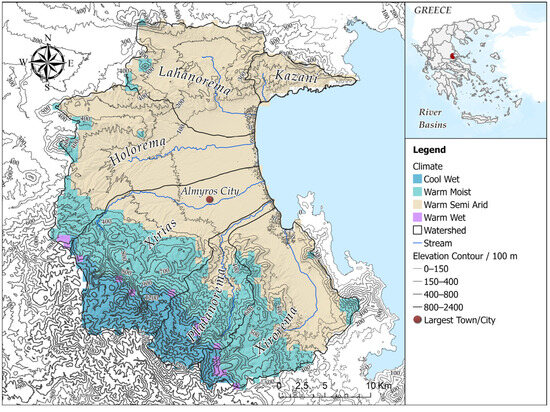
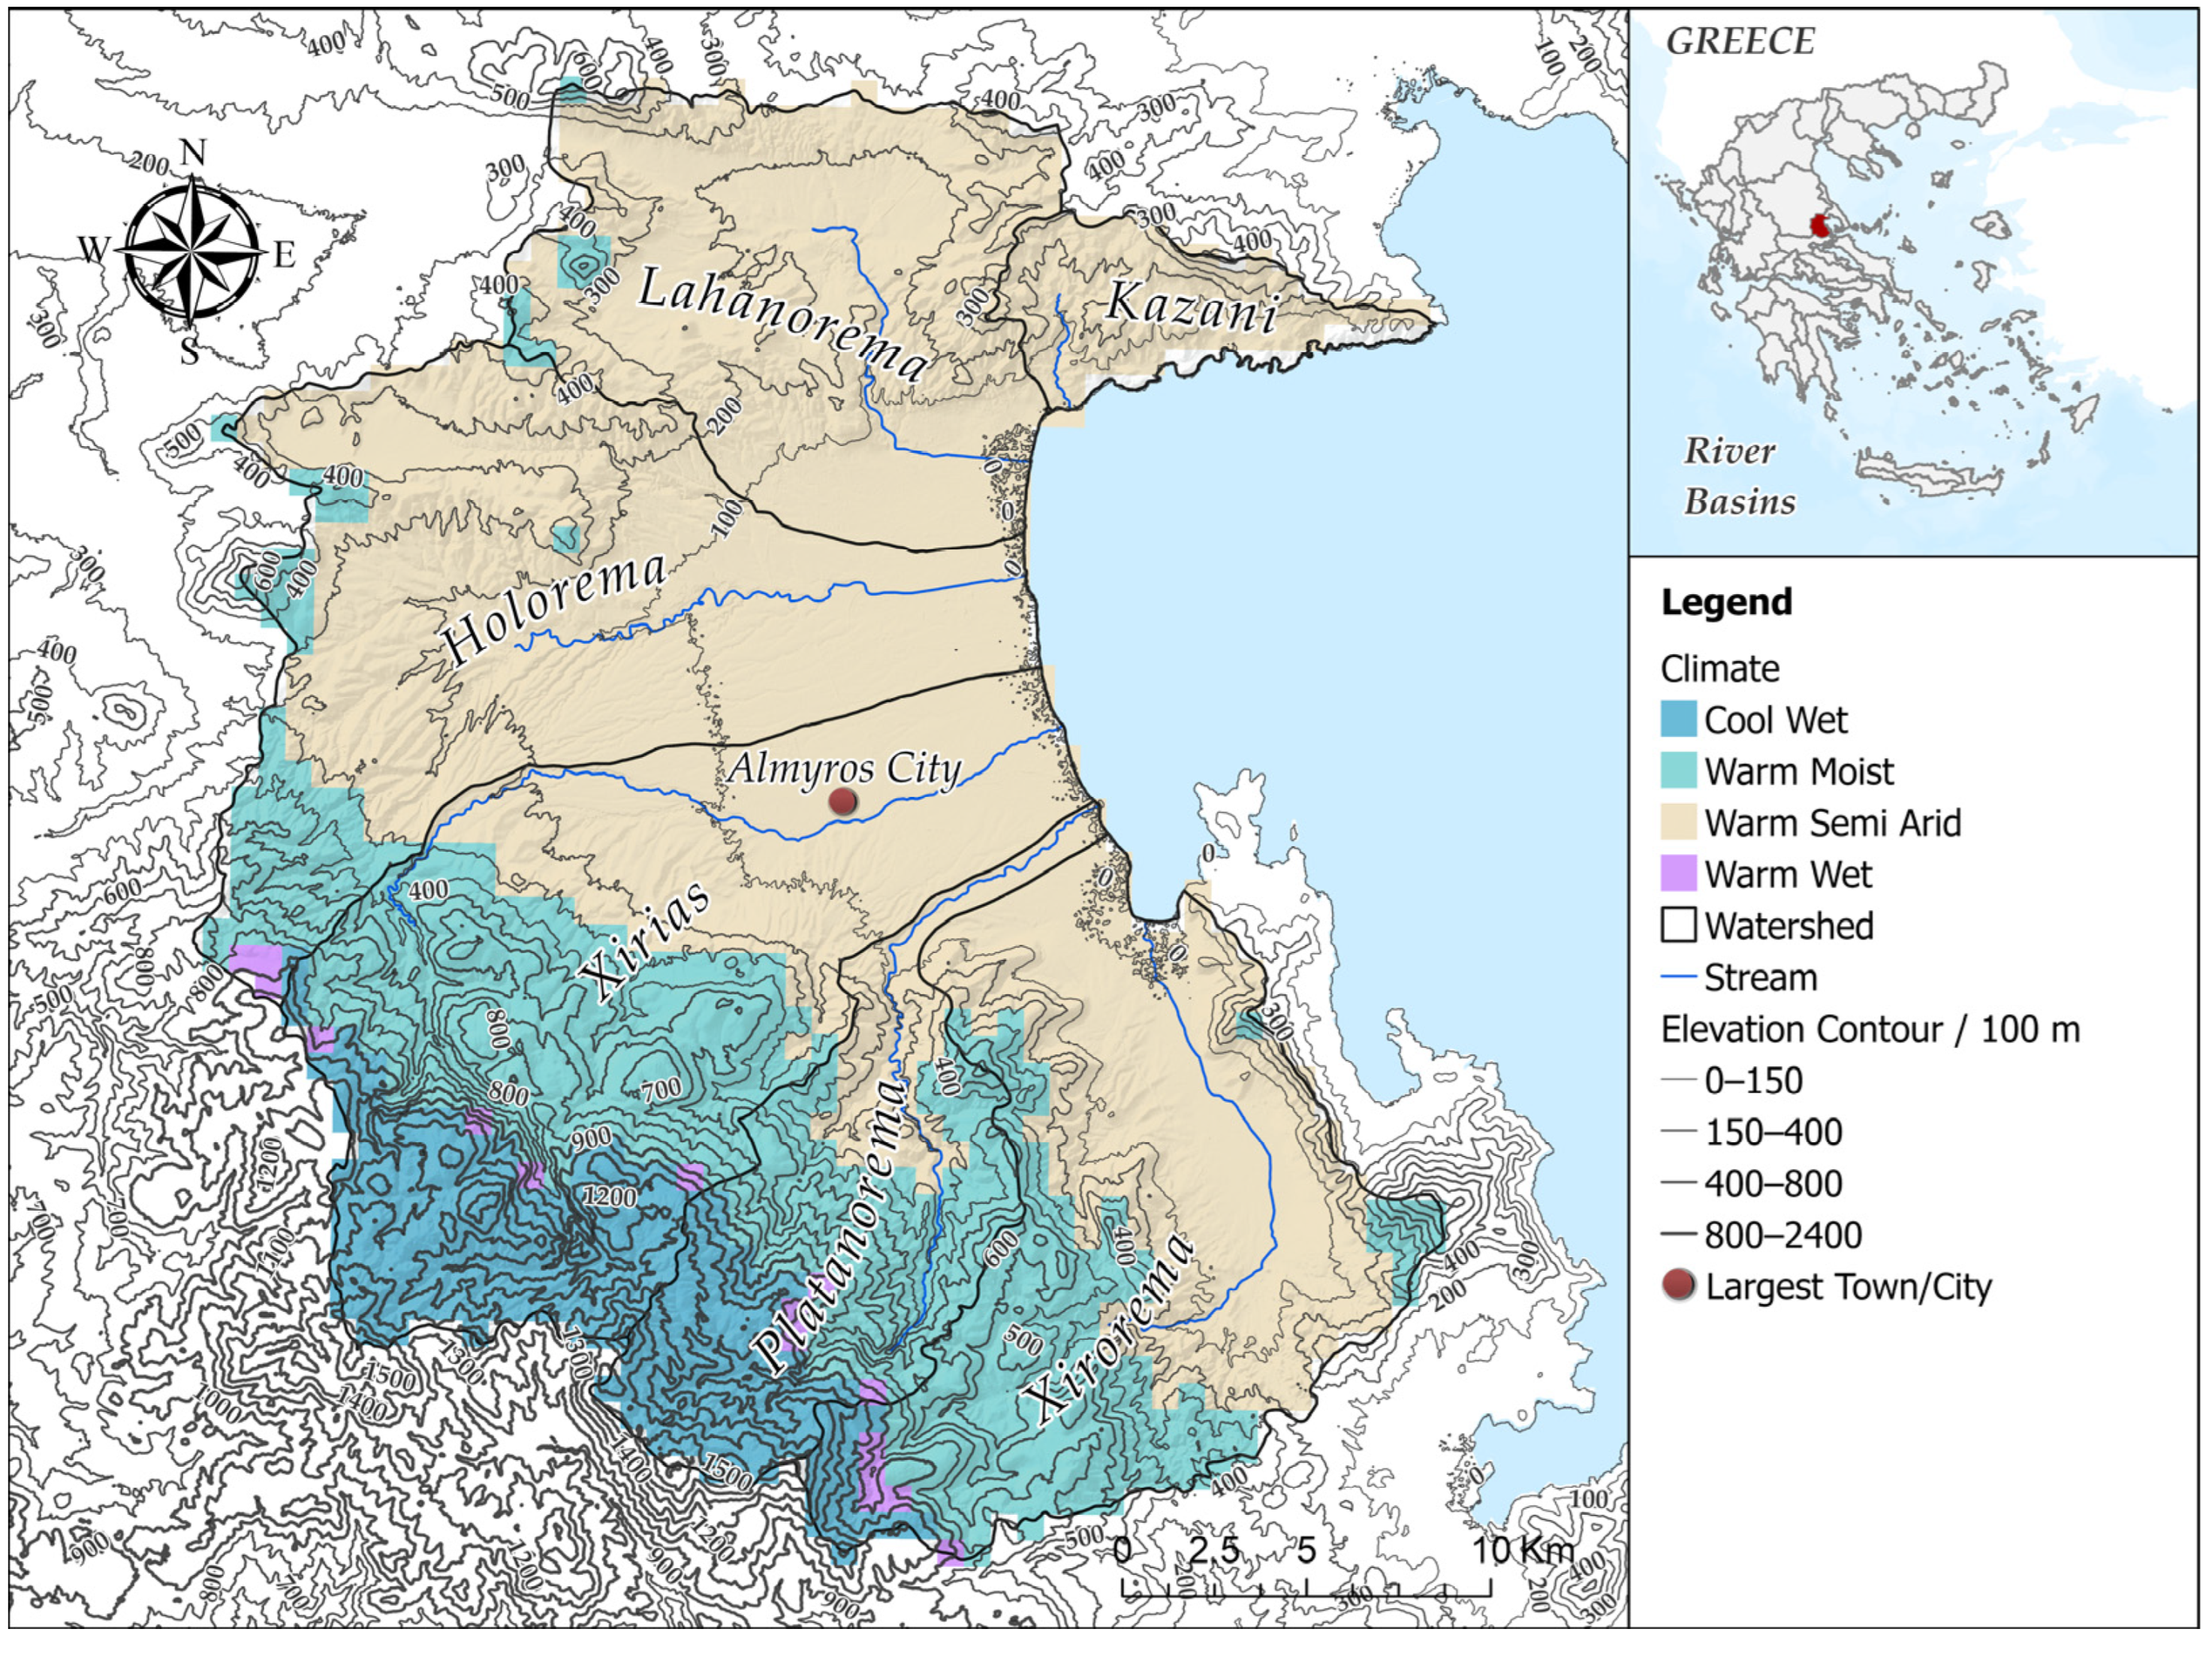
Figure 1.
Map of the Almyros Basin, the climatic zones, the watersheds, the largest town/city of basin, and the contoured elevation of the wider area.
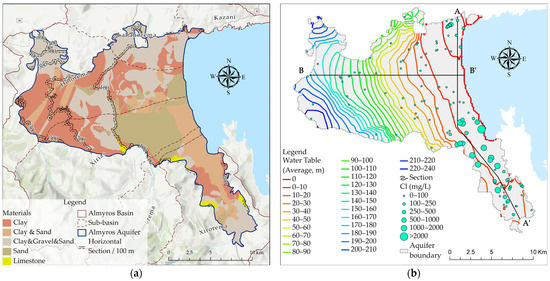
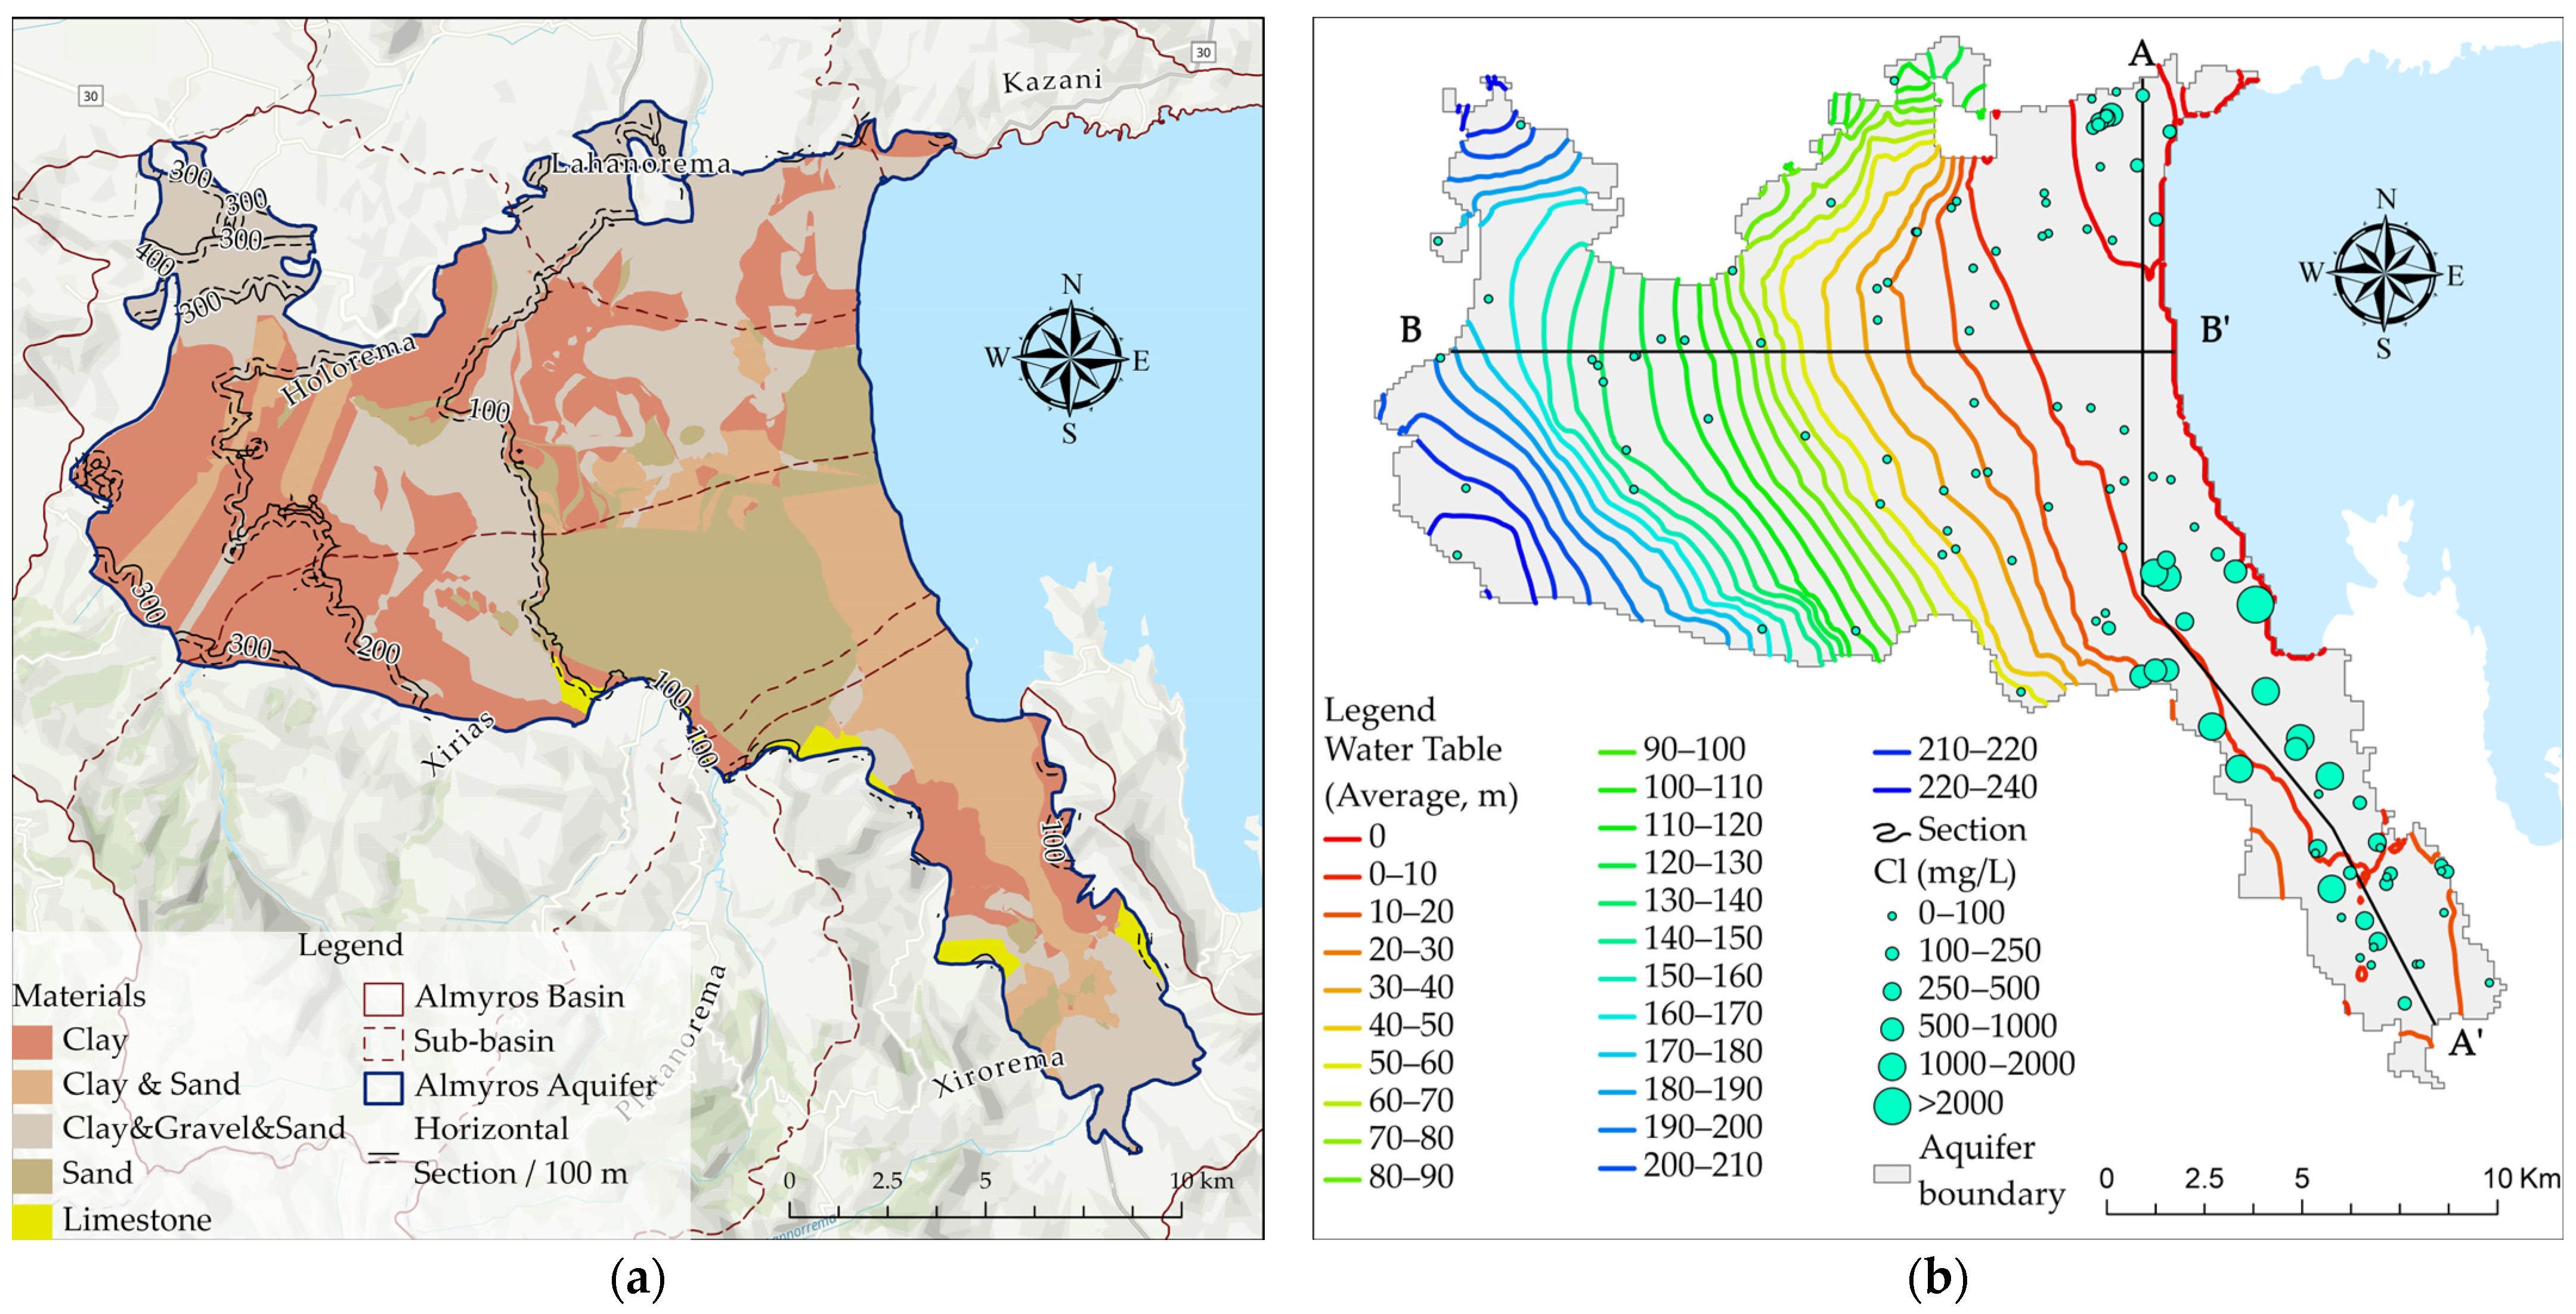
Figure 2.
(a) Hydrogeological formations within the Almyros aquifer [36]. (b) Mean hydraulic heads from the integrated modelling system, with the average observed levels of chloride concentrations during the historical period, spanning from 1991 to 2018, and cross-sections AA’ and BB’.
2.2. Modeling of Seawater Intrusion
2.2.1. Application of a Calibrated and Validated Integrated Modelling System (IMS)
Coastal water resources were studied using an integrated modeling system, developed in a previous study [35]. The integrated modelling system was used for simulating both surface and groundwater resources in the Almyros Basin. It consists of interlinked models which simulate surface hydrology (UTHBAL) [39], groundwater hydrology (MODFLOW) [40], and seawater intrusion (SEAWAT) [41]. A comprehensive study conducted by Lyra et al. in 2021 [35] included substantial preparatory processing, validation, and employing data from observations acquired during years of surveillance. The majority of components in the integrated modeling system underwent rigorous validation and calibration. The historical and future groundwater balance was simulated using the developed IMS. The water needs and abstractions from the groundwater, which is the only freshwater source in the study basin, for irrigation, domestic supply, and other water uses, were estimated for current and future climate conditions under two climate scenarios (RCPs 4.5 and 8.5) and 19 climate models. The groundwater balance was simulated, accounting for natural groundwater recharge (calculated using UTHBAL), groundwater abstractions, irrigation return flows (estimated as a percentage of the irrigation water applied for each crop cultivation), and the variable rise in sea level.
To accomplish this, six meteorological stations inside and around the basin were used to gather climate data for the specified region. These stations were from various sources, including Hellenic Meteorological Service and non-public meteorological stations. After collecting necessary data, these were processed and used as inputs for simulations utilizing the UTHBAL model. Precipitation by month was determined by applying the Thiessen polygon methodology, while the gradient method was utilized for the central points of the watershed. The watershed centroids were utilized in calculating the monthly temperature, through the gradient method. The UTHBAL model uses monthly sequences of areal precipitation, temperature, and potential evapotranspiration to calculate watershed runoff and groundwater recharge. Depending on the available data, the usage of the model may differ among various applications, such as being lumped, partially distributed, or entirely distributed, and comprises six parameters, which are either calibrated or estimated. For the Almyros region, the UTHBAL model was utilized as a semi-distributed model, to simulate surface hydrological processes in the six watersheds of Almyros Basin, from October 1961 to September 2018. These model parameters expressed the watershed characteristics and included the monthly melt rate factor (Cm, 6 mm/°C), the actual evapotranspiration parameter (α, 0.48), the interflow parameter (β, 0.033), the baseflow parameter (γ, 0.033), and the groundwater recharge parameter (K, 0.68), all of which play a crucial role in the functioning of the model. The values for these parameters were derived from UTHBAL’s regional application in Thessaly, as the Almyros watersheds lack sufficient runoff and streamflow data for model calibration. To calculate the weighted mean curve number (CN), according to the United States Soil Conservation Service (SCS) method of considering various factors that influence the CN [42], soil composition, land use, and land cover data for every watershed were included in the calculations, which derived the values of CNKazani, at 67.93, CNLahanorema, at 68.11, CNHolorema, at 68.47, CNXirias, at 60.69, CNPlatanorema, at 51.07, and CNXirorema, at 53.84 [35]. However, the values of CN may have large uncertainties. Groundwater recharge also takes into consideration the mean weighed return flow from irrigation from various types of crops within the study area. Using a systematic approach, the monthly runoff was determined by considering the demands of both rural and urban areas, as well as other factors. Spatial datasets on arable land and crop yields were provided by the Greek Payment Authority, while records on soil hydraulic features were integrated from the European Soil Data Centre [43]. Of the total agricultural water needs calculated with the near irrigation requirement (NIR) technique [44], approximately 9% is distributed in the Kazani watershed, 20% in the Lahanorema watershed, 21% in the Holorema watershed, 19% in the Xirias watershed, 17% in the Platanorema watershed, and 14% in the Xirorema watershed [35]. The inputs of the MODFLOW model include irrigation return flow, groundwater recharge, groundwater abstractions, net monthly sea level rise (set at the beginning of the hydrological year), and, finally, shoreline conductance.
The MOFLOW and SEAWAT groundwater models are built on a grid system, with 200 rows and 200 columns mapped and matched to the sub-watershed delineation of the surface hydrological model (UTHBAL). Each cell in this grid has a size of approximately 150 m × 150 m. The simulation of the unconfined aquifer was accomplished through the application of the layer property flow package. A ‘No-Flow Boundary’ setting was implemented for the western region of the study area, because there are impenetrable geological formations nearby that prevent the flow of fluids. In contrast, a transient head boundary was utilized in the eastern region, to take into account the changing sea level. Different hydrogeological zones were simulated with varying hydraulic conductivity values, ranging from 0.1 to 18.7 m/day, with an mean equal to 2.3 m/day, while the maximum velocities run in the northern coastal region, with clayish and mostly sandy materials [35]. Borehole public data, used to pinpoint locations of water pumping installations, were also a significant input of the groundwater model [45]. Useful field measurements of water levels and chloride levels in groundwater were provided by the Hellenic Survey of Geology and Mineral Exploration, Magnesia Prefecture, Regional Government of Thessaly, and earlier research investigations. The modelling system was calibrated and validated against water levels, and the MODFLOW model demonstrated exceptional performance during both the calibration (1991–2009) and validation (2013–2015) phases. The calibration process yielded high scores of statistical measures, such as Nash–Sutcliffe efficiency (NSE), R2, and index of agreement (IA) values of 0.98, 0.98, and 0.99, respectively. The MODFLOW model demonstrated significant efficiency even throughout the verification phase, with NSE, R2, and IA ratings of 0.99. The seawater intrusion model was also calibrated and validated against chloride concentration observations for the Almyros aquifer. The SEAWAT model demonstrated exceptional performance during both the calibration (1991–2004) and validation (2005–2007) phases. The calibration process yielded high Nash–Sutcliffe efficiency (NSE), R2, and index of agreement (IA) values of 0.92, 0.94, and 0.98, respectively. During the validation phase, the SEAWAT model maintained its high efficacy, with NSE, R2, and IA scores of 0.89, 0.95, and 0.98, respectively. These scores clearly highlight the high efficacy and consistency of the integrated modeling system.
2.2.2. Climate Change Scenarios
In order to accurately simulate the Almyros aquifer’s water resources and seawater intrusion in light of potential climate shifts, it was imperative to utilize datasets projecting future alterations in temperature, precipitation, and sea level. Climatic models were acquired from Med-CORDEX (Coordinated Regional Climate Downscaling Experiment for the Mediterranean region), a repository for regional climate model data focusing on the Mediterranean region. Specifically, the representative concentration pathways (RCP) scenarios 8.5 (RCP8.5) and 4.5 (RCP4.5) were selected for analysis. RCP8.5 represents a higher greenhouse gas emission trajectory, reflecting a scenario of increased emissions and greater climate change impacts. On the other hand, RCP4.5 represents a more moderate emission trajectory. The Med-CORDEX models used in the study are given in Table 1.

Table 1.
Simulations from the Med–CORDEX utilized for analysis.
After obtaining climate models from Med-CORDEX for the RCP8.5 and RCP4.5 scenarios, a crucial step was taken in guaranteeing the precision and dependability of the data. The bias correction technique of Quantile Empirical Mapping, a highly regarded method, was utilized to refine and harmonize the model outputs, which was undertaken in earlier studies [36,37], the results of which were used in the present simulations. Critical efficacy scores are summarized in Appendix A. The use of bias-corrected future climatic data is integral in addressing any systematic errors or inconsistencies between the climate model projections and actual observations. By implementing quantile mapping, the accuracy of climatic models was improved, ensuring they accurately reflect historical climate patterns and serve as a reliable basis for projecting future scenarios in the Almyros basin.
2.2.3. Sea Level Rise and Transient Head Boundary Conditions
Sea level rise in the Mediterranean Sea is a pressing issue which has garnered significant attention in recent years. As global temperatures continue to rise, the resulting melting of polar ice caps and glaciers has led to an increase in sea levels worldwide. The Mediterranean region is particularly vulnerable to sea level rise, as it is surrounded by densely populated coastal areas that are at risk of flooding and erosion. However, it has a lower rate of sea level rise compared to other regions. The sea level rise is also influenced by other factors, such as atmospheric pressure anomalies, variations in evaporation and precipitation, the North Atlantic oscillation, Eastern Mediterranean transient, and the balancing effect of salinification near the coasts [46,47].
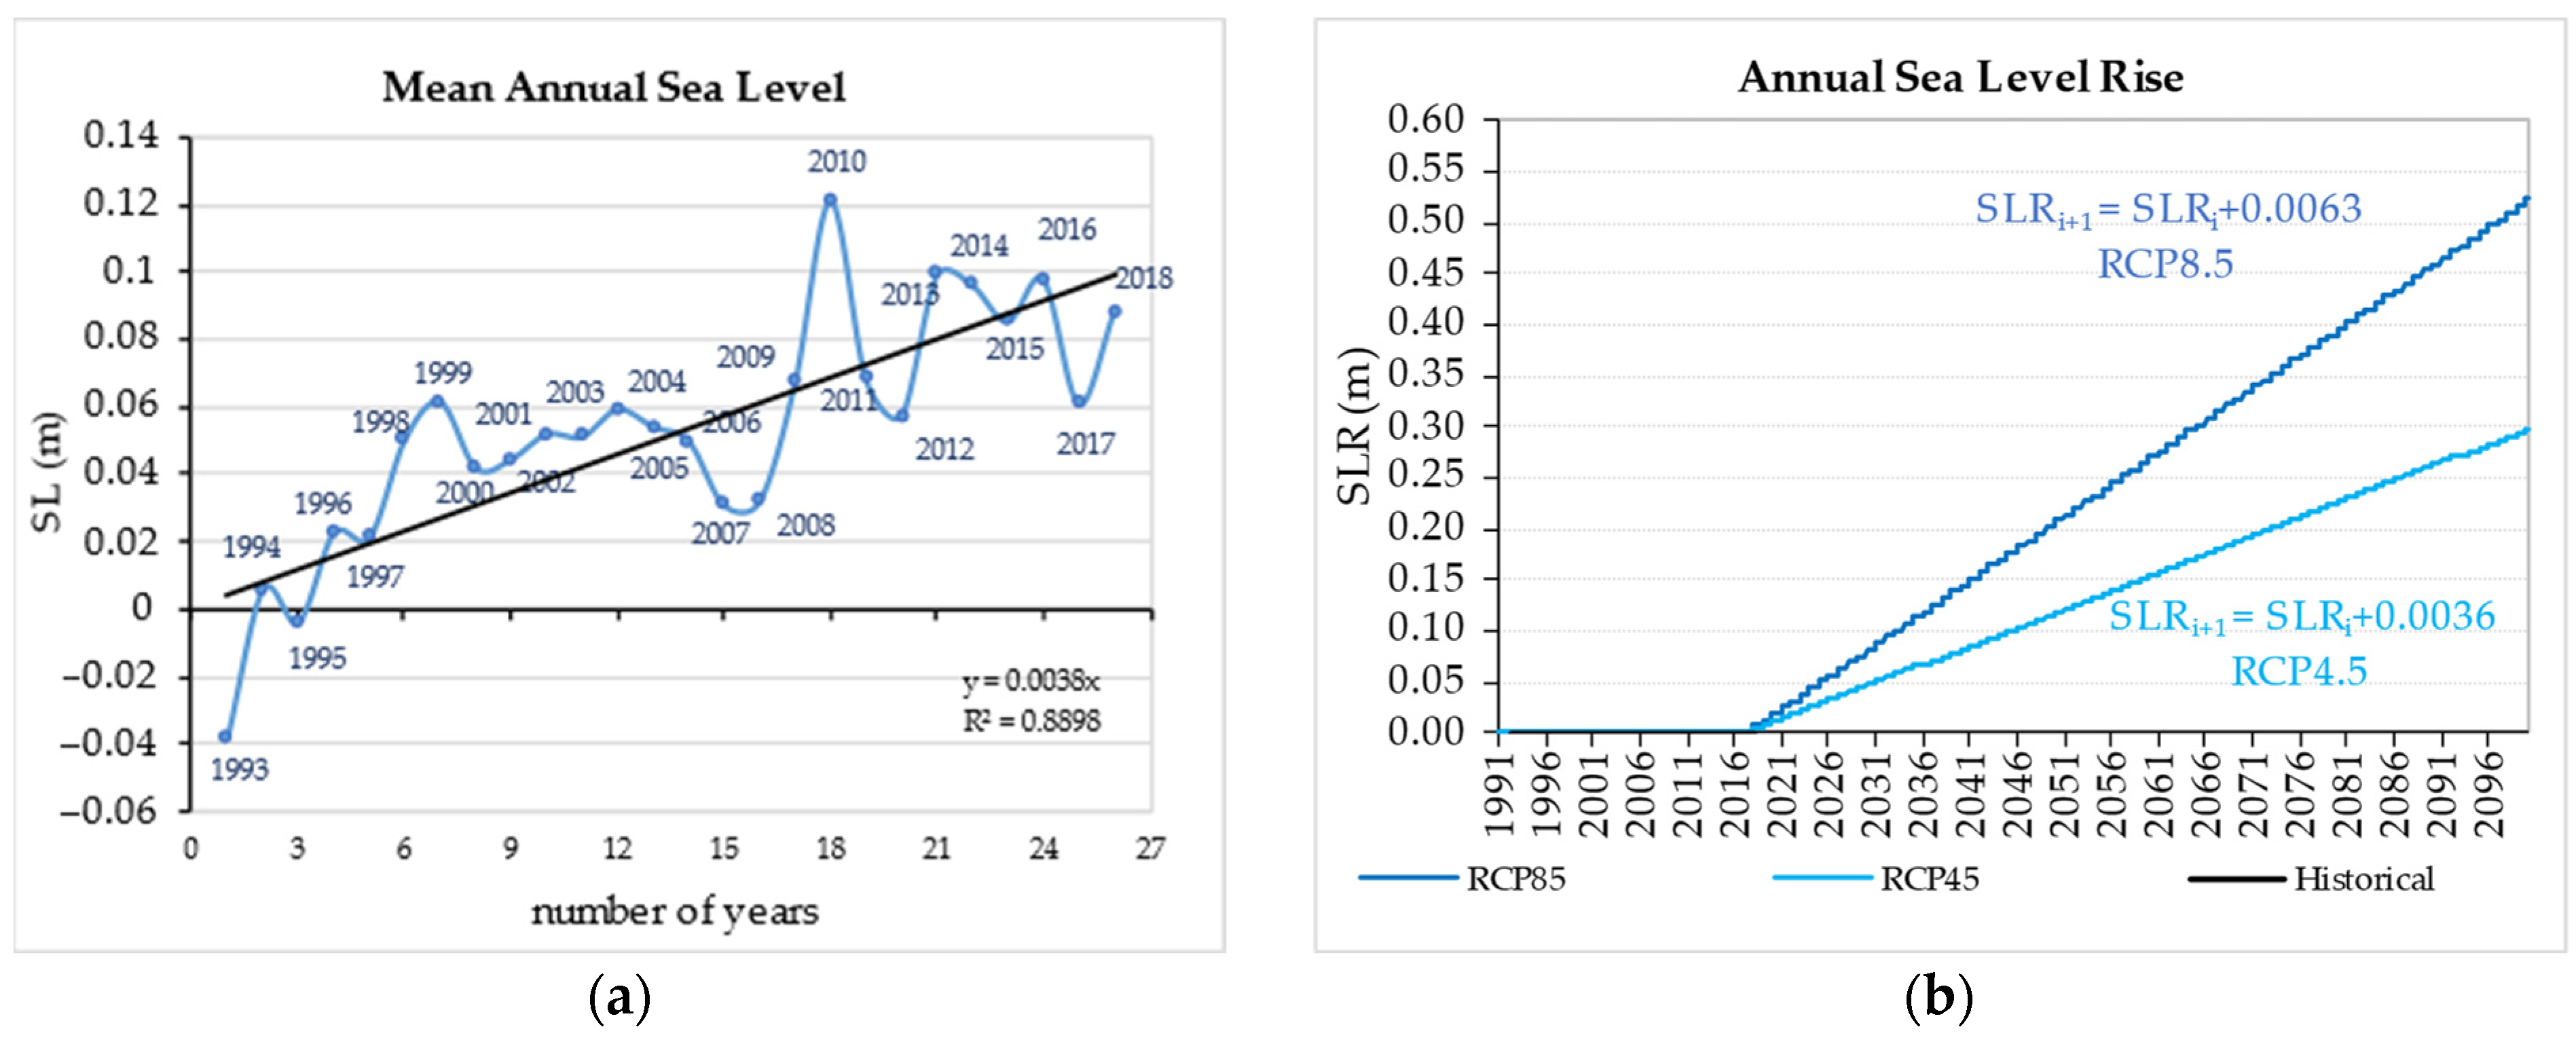
According to gridded satellite historical datasets, the average sea level at the coastline of Almyros was 0.05 m between 1993 and 2018 (25 years) [48]. The annual rate of increase was calculated to be 3.8 mm (the Figure 3a), which was also verified by the estimations of the European Environmental Agency (EEA) [49] for the period of 1992 to 2013. However, the sea level rise was considered to be zero during the period of 1991 to 2018, because the available timeseries of the sea level did not cover the time span of historical simulations. The formation of climate scenarios had to also include the projected change in the average sea level, since the Almyros watershed and the aquifer system are located adjacent to the sea (Figure 2). The sea level is estimated to increase in the future, with a higher rise in the RCP8.5 climate scenario and a lower rise in the RCP4.5 climate scenario. The sea level rise for the climatic scenario RCP4.5 is projected to be between 0.3 and 0.4 m between 2081 and 2100 according to the EEA [50], and, for RCP8.5, is projected to be 0.5–0.6 m between 2081 and 2100 [51], respectively. These estimated projected values of sea level rise were equally distributed over time for the period 2019–2100 (Figure 3b). The sea level rise was considered to happen at the start of every hydrological year (i.e., each October).
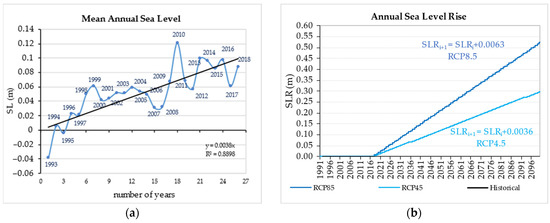
Figure 3.
(a) Mean annual sea level for the period 1991–2018 according to [48]. (b) Simulated sea level rise for the period 1991–2100.
For RCP4.5, the sea level rise was calculated as 3.6 mm/y, for the total sea level rise to reach 0.3 m in 2100, and for RCP8.5 as 6.3 mm/y, for the total sea level rise to reach approximately 0.5 m in 2100.
2.3. Evaluation of Results
A ternary diagram is a comprehensive visual tool used in environmental science to depict the composition of a three-component system [52]. This diagram features an equilateral triangle, with each point representing one of the three components, and the sides representing all possible combinations of these components. Every point in a ternary diagram precisely represents the combination or content of the three elements. The distance between the point and the triangle’s sides indicates the relative weights of each element. Importantly, the sum of these distances is constant, illustrating the fact that the three components together make up the entirety of the system. The ternary diagram has been used to assess seawater intrusion in coastal aquifers, a growing concern in many regions due to the development of coastal areas and increasing demands for freshwater. By analyzing the inflows and outflows of coastal aquifers using the ternary diagram, the analysis of the water balance of aquifer systems can provide valuable information for the dynamics of water movement and the key components that influence water availability and seawater intrusion.
3. Results
The studies by Lyra and associates (2021) [35] and Lyra and Loukas (2022) [37] gave rise to the development of the integrated modeling system, utilized to model and project the potential effects of climatic changes on the Almyros basin and its aquifer system, in Thessaly, Greece, covering both the worst-case (RCP8.5) and moderate (RCP4.5) climate scenarios. The findings of the simulation process implemented for the evaluation of seawater intrusion and climate change scenarios and climatic models are provided and analyzed in the following paragraphs.
3.1. Projected Water Balance—Seawater Intrusion
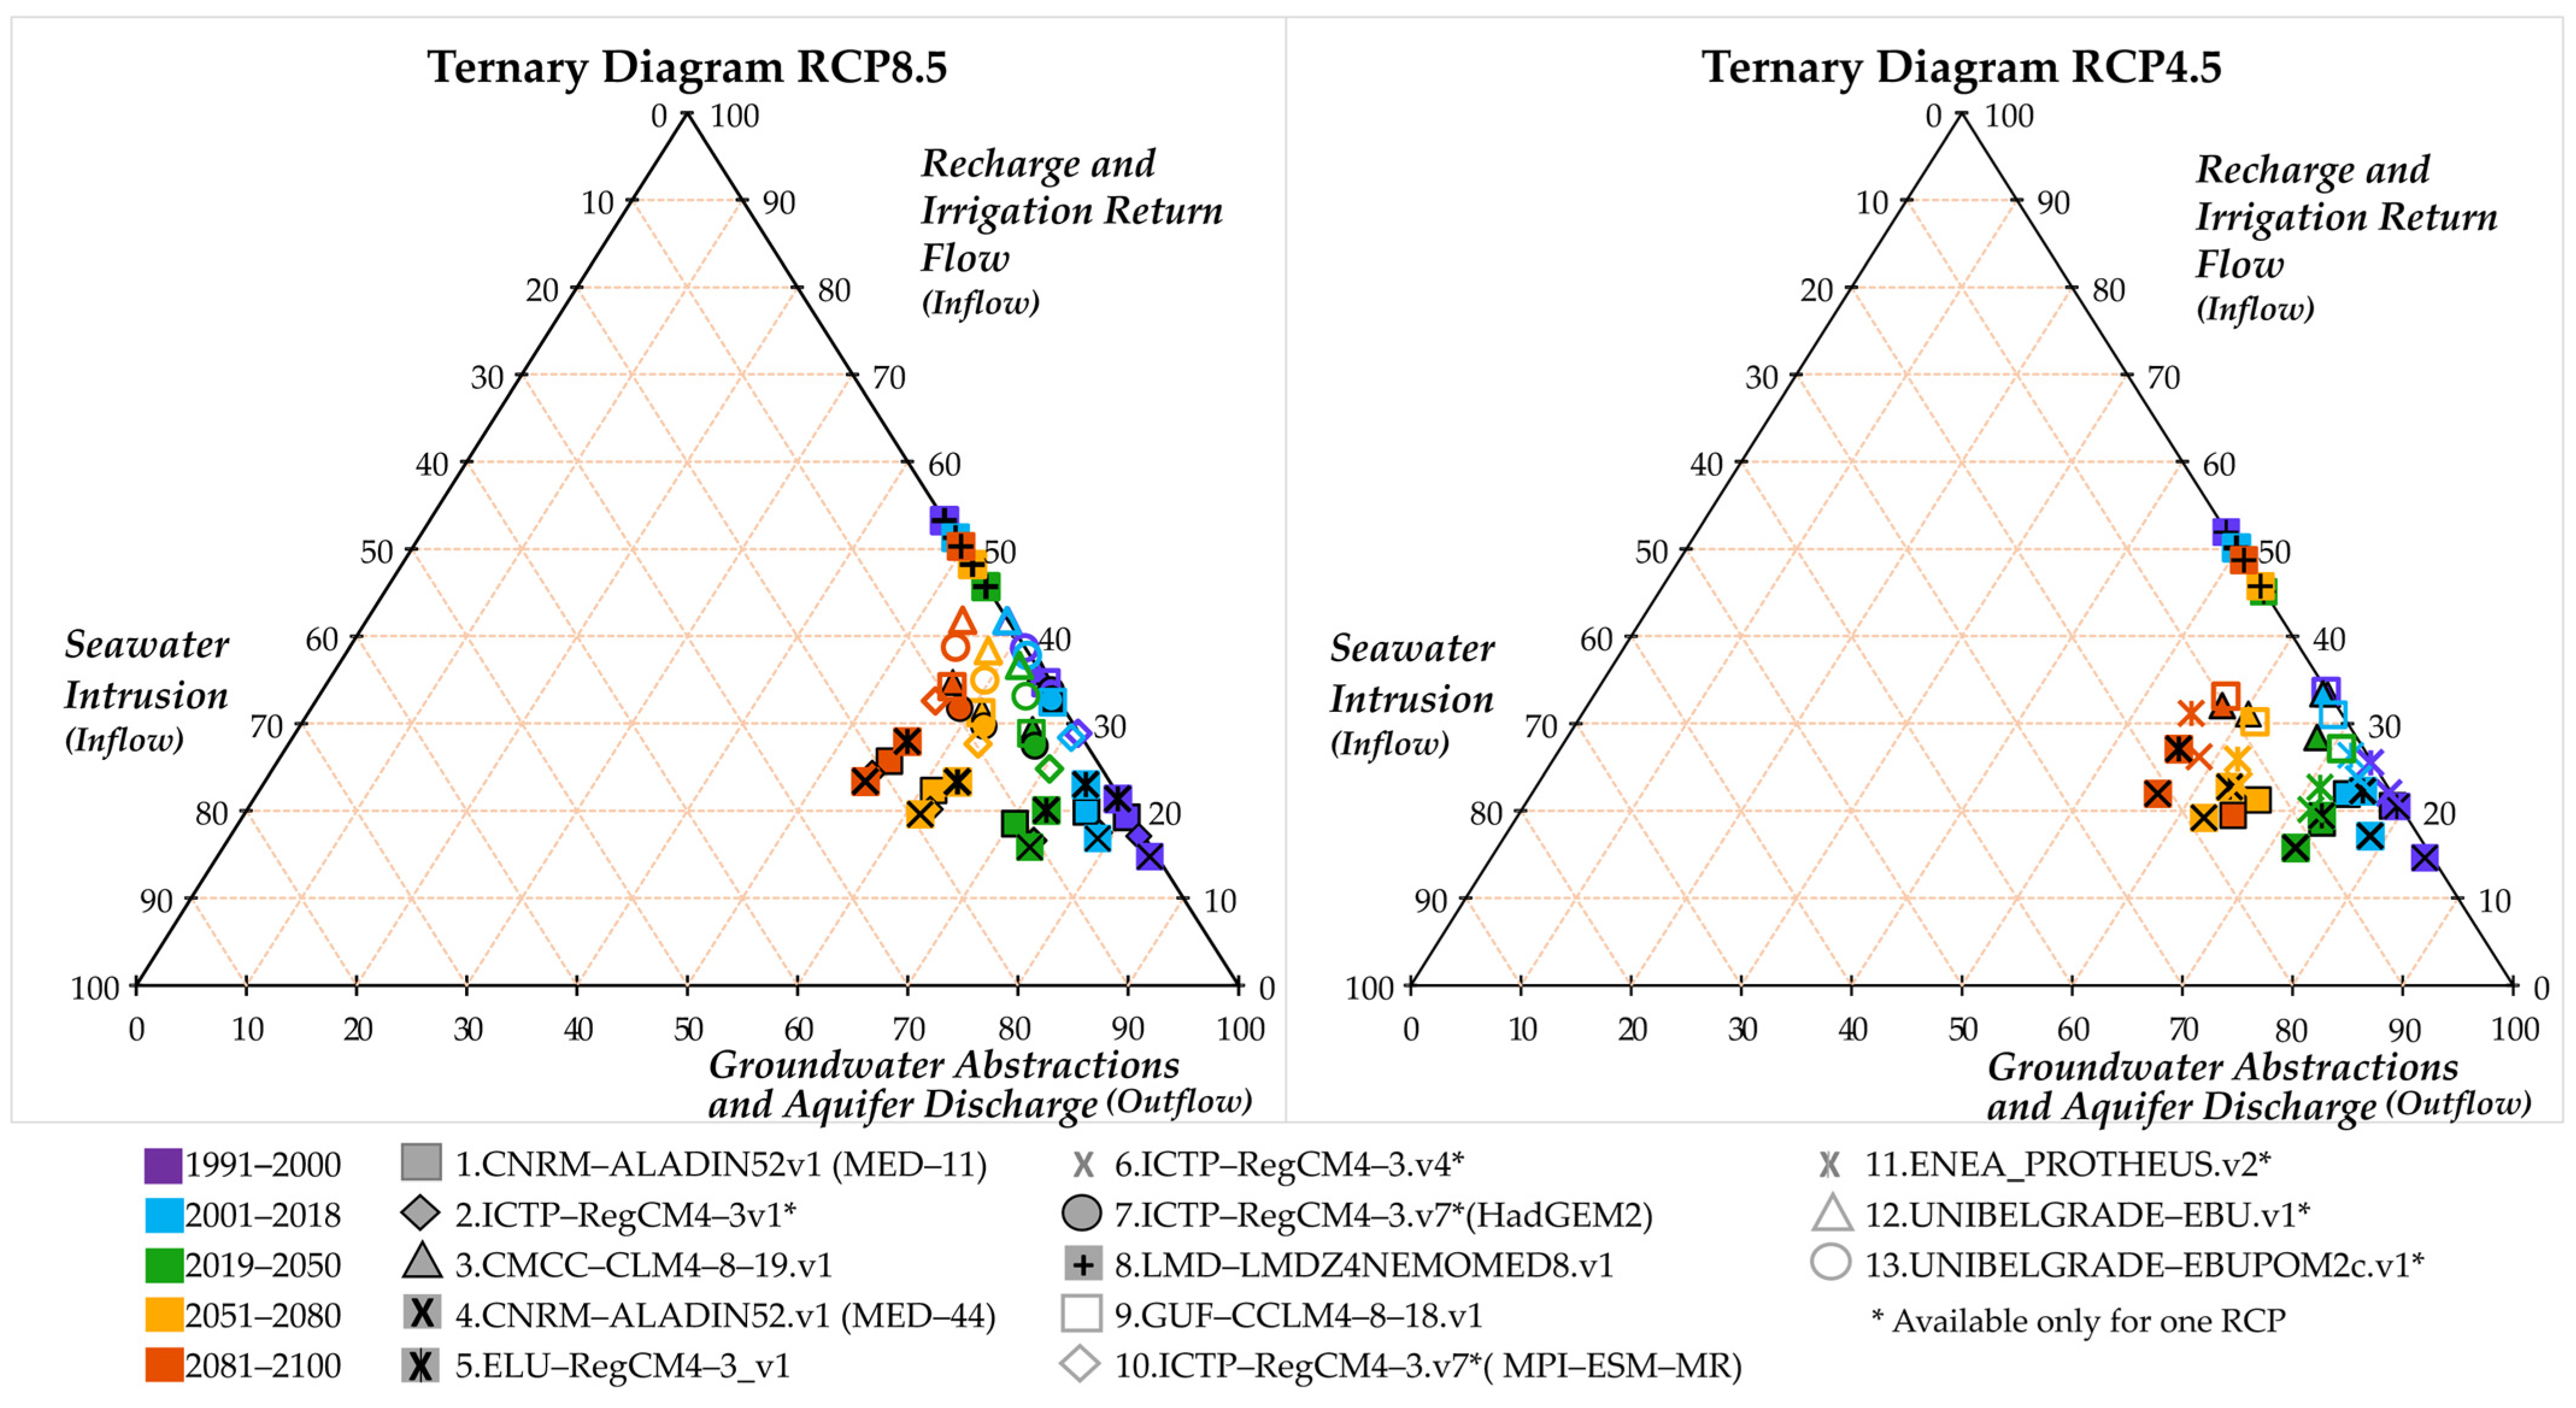
The results of the simulations of the integrated modelling system regarding the water balance for the two climatic scenarios and climatic models are depicted in Figure 4. The ternary diagram was employed for analyzing the components of the water budget of the aquifer system, particularly in the context of seawater intrusion, groundwater recharge, irrigation return flow, groundwater abstractions, and aquifer discharge. The grouping of the variables was firstly considered, namely which components held the inflows and the outflows of the aquifer system. The aquifer outflows consisted of groundwater abstractions, while the aquifer inflows were considered separately. Water inflows from the sea are displayed on the left side of the triangle, while water inflows from groundwater recharge and irrigation return flows are the displayed on the right side of the triangle. Then, the original values of the results were normalized as percentages. The normalized percentages of the components of the water budget were displayed as averaged annual values of the three components for the periods of 1991 to 2000, 2001 to 2018, 2019 to 2050, 2051 to 2080, and 2081 to 2100. These factors are represented by the three equilateral triangle corners, and all potential combinations of the three are shown on each side. The ideal distribution would be 0% seawater intrusion, 50% groundwater recharge and irrigation return flows, and 50% groundwater abstractions and aquifer discharge, for freshwater to not be contaminated with seawater, and for permanent groundwater reserves to not be consumed for water needs. Through the placement of the proportional relations of the components of the groundwater budget as points within the triangle, the diagram allows for a thorough examination of how seawater intrusion, groundwater recharge, and groundwater abstractions interact and impact the distribution of freshwater in the aquifer system.
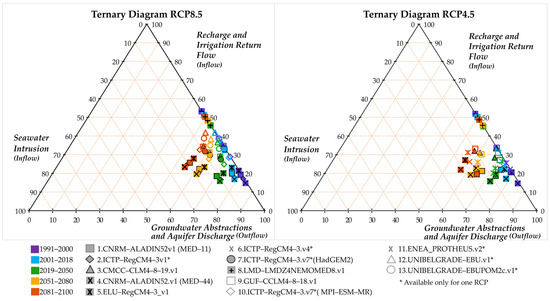
Figure 4.
Ternary plots of the water balance components under climate scenarios RCP8.5 and RCP4.5 during various time periods. The time periods covered are 1991–2000, 2001–2018, 2019–2050, 2051–2080, and 2081–2100. The integrated modeling system (IMS) was utilized for the simulations.
From the ternary plots, it is observed that, in both climatic scenarios, RCP8.5 and RCP4.5, the aquifer outflows constitute 55% to 85% of the water balance for all periods. The outflows consist mostly of groundwater abstractions while the aquifer discharge is negligible. Hence, this is why the points of the diagram are accumulated at the right side of large component values. Moreover, it is observed that the groundwater recharge and irrigation return flow form a more distinct relation with seawater intrusion, because, when the aquifer recharge is high, the seawater intrusion is quite low and almost zero in some climate models. As the recharge of water in the aquifer decreases, the presence of seawater in the water balance increases, leading to the salinization of the groundwater. Notably, as the time progresses to 2100, groundwater abstractions are reduced due to altered seasonality; the groundwater recharge and irrigation return flow decrease in 2019–2050 but increase in 2050–2100; and the seawater intrusion increases from 2019 to 2100. Hence, the groundwater recharge and irrigation return flow play the most critical roles in the evolution of seawater intrusion under climate change when groundwater is abstracted, even with a decreasing trend. According to RCP8.5, the analyzed models show varying patterns in groundwater recharge and irrigation return flow over distinct periods. For example, the 1.CNRMALADIN52v1 (MED11) model displays a fluctuation of 19.2% to 25.7% for these factors, suggesting a sensitivity to time. Similarly, the 8.LMDLMDZ4NEMOMED8.v1 model depicts a gradual decrease from 53.3% to 50.3%. Seawater intrusion also exhibits upward trends throughout the projected timeframes, as illustrated by multiple climate models. In the initial period of 1991–2000, all models showed relatively low percentages, ranging from 0.1% to 0.7%. However, as the decades progress, there was a clear escalation in seawater intrusion percentages. Between the years 2001 and 2018, there was a steady increase in values for seawater intrusion, ranging from 0.1% to 4.3%, across multiple models. This trend is expected to continue for the foreseeable future, with projected percentages for 2019–2050 ranging from 1.6% to 11.0% and, for 2051–2080, escalating to 3.5% to 19.1%. The latter part of the century (2081–2100) shows a continuing upward trend, with expected percentages of seawater intrusion between 4.1% and 22.2%. Interestingly, the 4.CNRMALADIN52.v1 (MED44) model consistently predicts the highest percentage of seawater intrusion across all time periods. In contrast, most models show a consistent decrease in groundwater abstractions and aquifer discharges across different time periods. For example, when observing changes over time, it is evident that the 1.CNRMALADIN52v1 (MED11) model experienced a significant decrease, from 80.2% to 55.5%. This highlights a notable decrease in both groundwater usage and aquifer discharge. On the other hand, the 4.CNRMALADIN52.v1 (MED44) model initially had the highest percentages, at 84.6%, but, over time, it experienced a noteworthy decline to 54.5% by 2081–2100. In contrast, the 8.LMDLMDZ4NEMOMED8.v1 model displayed an increase from 46.7% to 54.2%, indicating a positive trend in groundwater outflows.
During the initial period of RCP4.5 (1991–2000), the variability among climatic models was evident, as the values of groundwater recharge and irrigation return flow ranged from 20.6% to 51.9%. As time progresses, fluctuations and trends become apparent. Many models show a decreasing trend in recharge in the later periods, although there are some fluctuations. For example, the 4.CNRMALADIN52v1 (MED44) model experienced a decline from 15.8% to 19.2% in the initial period but then shows a slight increase to 22.0% in the final period. A similar trend can be observed in the 8.LMDLMDZ4NEMOMED8v1 model, which displays a steady decrease from 51.9% to 48.7%, indicating a potential impact of climate change on the recharge of groundwater and return flow from irrigation. From 1991–2000 to 2081–2100, there were significant fluctuations in the rates of seawater intrusion, according to different models. One consistent trend is seen in Model 8.LMDLMDZ4NEMOMED8v1, which maintains consistently low percentages throughout the time period, with a peak of 0.1% in the later years. However, Model 4.CNRMALADIN52v1 (MED44) shows a worrisome increase, starting at 0.7% in 1991–2000 and reaching 21.2% in 2081–2100. The same unpredictability is seen in the trends of groundwater abstractions and aquifer discharge from 1991–2000 to 2081–2100, as shown by various climatic models. One example is the decline seen in Model 1.CNRMALADIN52.v1, which shows a decline from 78.8% to 64.8%, indicative of a reduction in groundwater abstractions and aquifer discharge. The 3.CMCCCCLM4819v1 model consistently exhibits a decline from 66.5% to 57.6%, indicating a persistent downward trend throughout the evaluated periods. On the contrary, the model 8.LMDLMDZ4NEMOMED8v1 displays a contrasting trend, with an increase from 48.0% to 51.2%.
3.2. Projected Chloride Concentrations with the SEAWAT Model under Climate Change
The SEAWAT model was applied to simulate the flow of variable density and the movement of chlorides in the Almyros coastal aquifer at a monthly time step for the two climate scenarios RC8.5 and RCP4.5, for the 19 climatic models. The time periods under examination included 1991 to 2000, 2001 to 2018, 2019 to 2050, 2051 to 2080, and 2081 to 2100.
3.2.1. Groundwater Model Cross-Sections
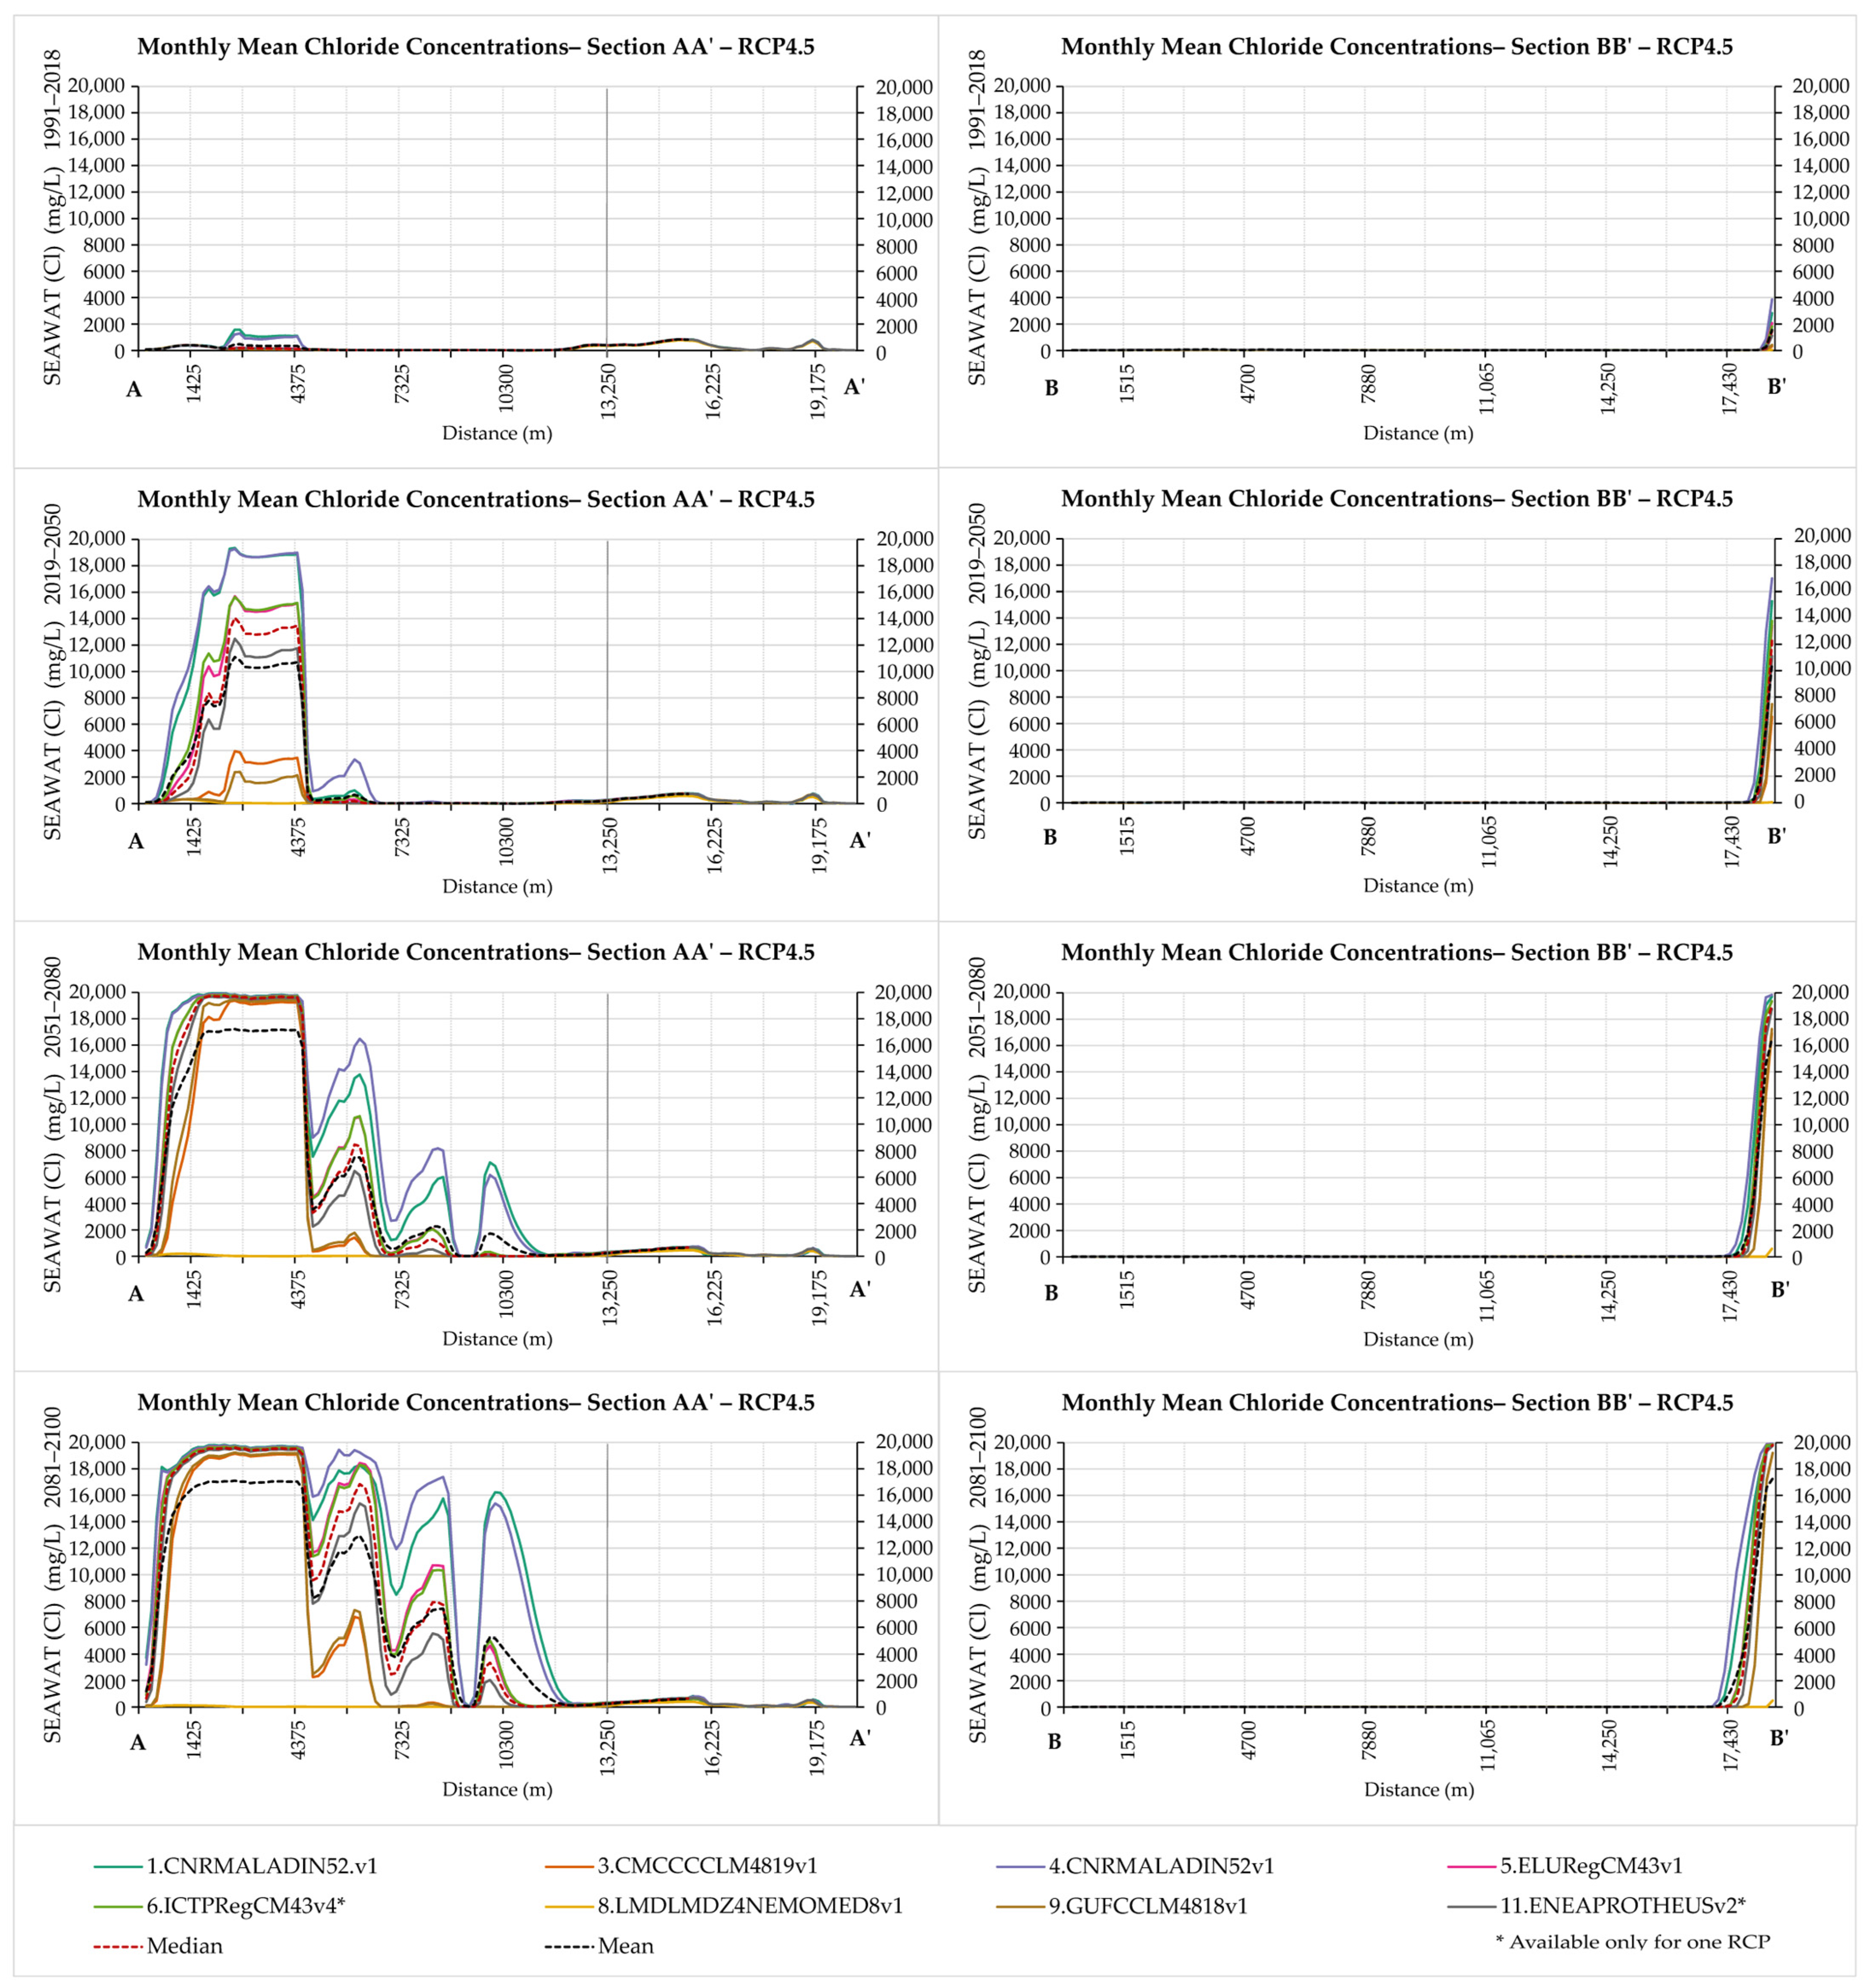
Figure 5 and Figure 6 provide a thorough examination of the impacts of sea level rise and climate change on the Almyros aquifer system, presenting intricate details and analyses. Figure 5 captures the changes in sections AA’ and BB’ (presented in Figure 2b) for the eleven bias-corrected models under the RCP8.5 scenario of adverse impacts, while Figure 6 focuses on the medium impacts scenario, RCP4.5, and displays the corresponding sections for the eight bias-corrected models. All the SEAWAT model simulations for chloride concentrations for the historical period of 1991–2018 showed a consistent pattern across the various climatic scenarios and models. As time progresses towards 2100, the results reveal distinct changes and fluctuations, particularly in the levels of chloride concentrations.
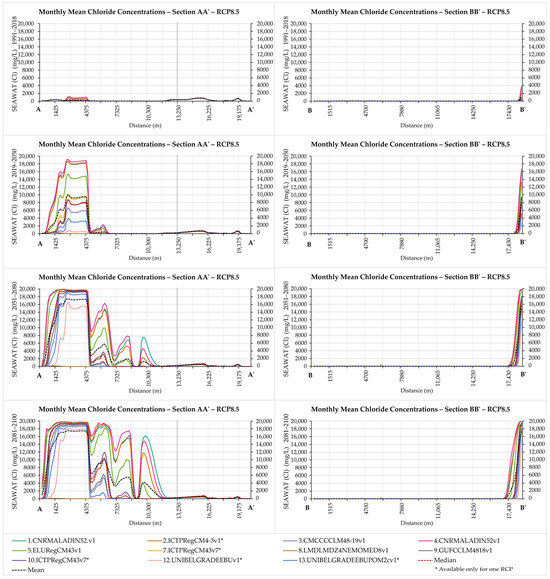
Figure 5.
Section AA’ on the left side and Section BB’ on the right illustrate the chloride concentrations in milligrams per liter (mg, L) across the following four time periods: 1991–2018, 2019–2050, 2051–2080, and 2081–2100. These concentrations are derived from the bias-corrected Med-CORDEX models under the RCP8.5 scenario.
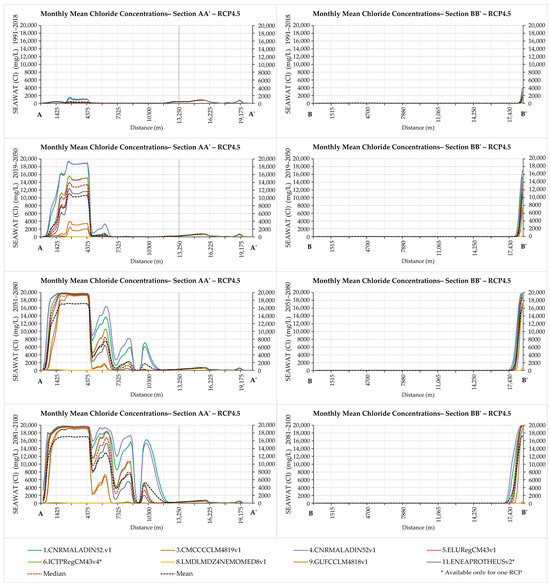
Figure 6.
Section AA’ on the left side and Section BB’ on the right illustrate the chloride concentrations in milligrams per liter (mg, L) across the following four time periods: 1991–2018, 2019–2050, 2051–2080, and 2081–2100. These concentrations are derived from the bias-corrected Med-CORDEX models under the RCP4.5 scenario.
Concerning the incorporation of the climatic scenario RCP8.5 in Figure 5, in Section AA’, the highest chloride concentrations are found on the northern coast, when using the bias-corrected climate models 4.CNRMALADIN52.v1 (MED44), 1.CNRMALADIN52v1 (MED11), and 2.ICTPRegCM43v1* in 2019–2050, and also when using 5.ELURegCM43v1 up to 2100. The greater differentiations among the models present in the areas of sandy and clayish materials in the central region of the coastal zone, originated from the same climate models. Chloride concentrations in Section BB’ verify the aforementioned distributions of the effects of climate models and show the shape of the seawater wedge in the aquifer system towards the inland, which advances with time.
In the case of the climate scenario RCP 4.5 in Figure 6, in Section AA’, the highest chloride concentrations are produced on the northern coast, when using the bias-corrected climatic models 4.CNRMALADIN52v1 (MED44) and 1.CNRMALADIN52.v1 (MED11), the values of which are similar to the values of RCP8.5. However, the model 5.ELURegCM43v1 presents lowered chloride concentrations, compared to RCP8.5. The greater differentiations among the models again present in the areas of sandy and clayish materials in the middle of the coastal region, originated from the same climatic models. In Section BB’, the seawater wedge appears similar to the distributions of RCP8.5, with no significant variations in the maximum values of accumulated chlorides from seawater intrusion.
For these reasons, the extent to which seawater intrusion expands inland was calculated by taking the tolerance limit for crops, 100 mg/L, as a threshold value. Table 2 depicts the statistics of the creation of the seawater wedge in the aquifer system of Almyros for RCP8.5 climatic scenario and model, for the time periods from 1991 to 2100.
Table 2.
Maximum seawater intrusion and the formation of a saltwater wedge inland, in km, under RCP8.5.
The table presents data on seawater intrusion and the formation of saltwater wedges inland under the RCP8.5 scenario, categorized by different Med-CORDEX models and time periods. The values in the table represent the distance of intrusion in kilometers for each model during the following four time intervals: 1991–2018, 2019–2050, 2051–2080, and 2081–2100. The values indicate the extent of seawater intrusion, with higher values representing a greater intrusion distance. The maximum seawater intrusion is observed when using the model 4.CNRMALADIN52v1 (MED44) during the last time interval, reaching 1.575 km, while the minimum intrusion is found when using the 8.LMDLMDZ4NEMOMED8.v1 model during the 2081–2100 period, with a distance of 0.099 km. It should be noted that the climatic models 8.LMDLMDZ4NEMOMED8.v1, 12.UNIBELGRADEEBU.v1*, and 13.UNIBELGRADEEBUPOM2c.v1* present a complete lack of seawater intrusion during the historical periods, while under 8.LMDLMDZ4NEMOMED8.v1 model continues to present a complete lack of seawater intrusion until 2080. The steeper increases happen under the climatic models 1.CNRMALADIN52v1 (MED11), 2.ICTPRegCM43v1*, 3.CMCCCLM4819.v1, and 4.CNRMALADIN52.v1 (MED44), while the rest of the models present milder trends. Table 3 shows the statistics of the creation of the seawater wedge in the aquifer system of Almyros for the RCP4.5 climatic scenario and model, for the time periods from 1991 to 2100. The 1.CNRMALADIN52v1 (MED11) model exhibits a minimum intrusion of 0.297 km in the period 1991–2018, while the maximum intrusion increases to 1.450 km in the later period of 2081–2100. The model 8.LMDLMDZ4NEMOMED8.v1 indicates the minimum seawater intrusion of 0.131 km and a maximum intrusion of 0.138 km in the latter two periods. The steepest increases happen for the climate model 4.CNRMALADIN52v1 (MED44), while the rest of the models also show steep trends in the formulation of the seawater wedge, except for 8.LMDLMDZ4NEMOMED8.v1.
Table 3.
Maximum seawater intrusion and formation of saltwater wedge inland, in km, under RCP4.5.
3.2.2. Spatial Analysis of Seawater Intrusion under Climate Change
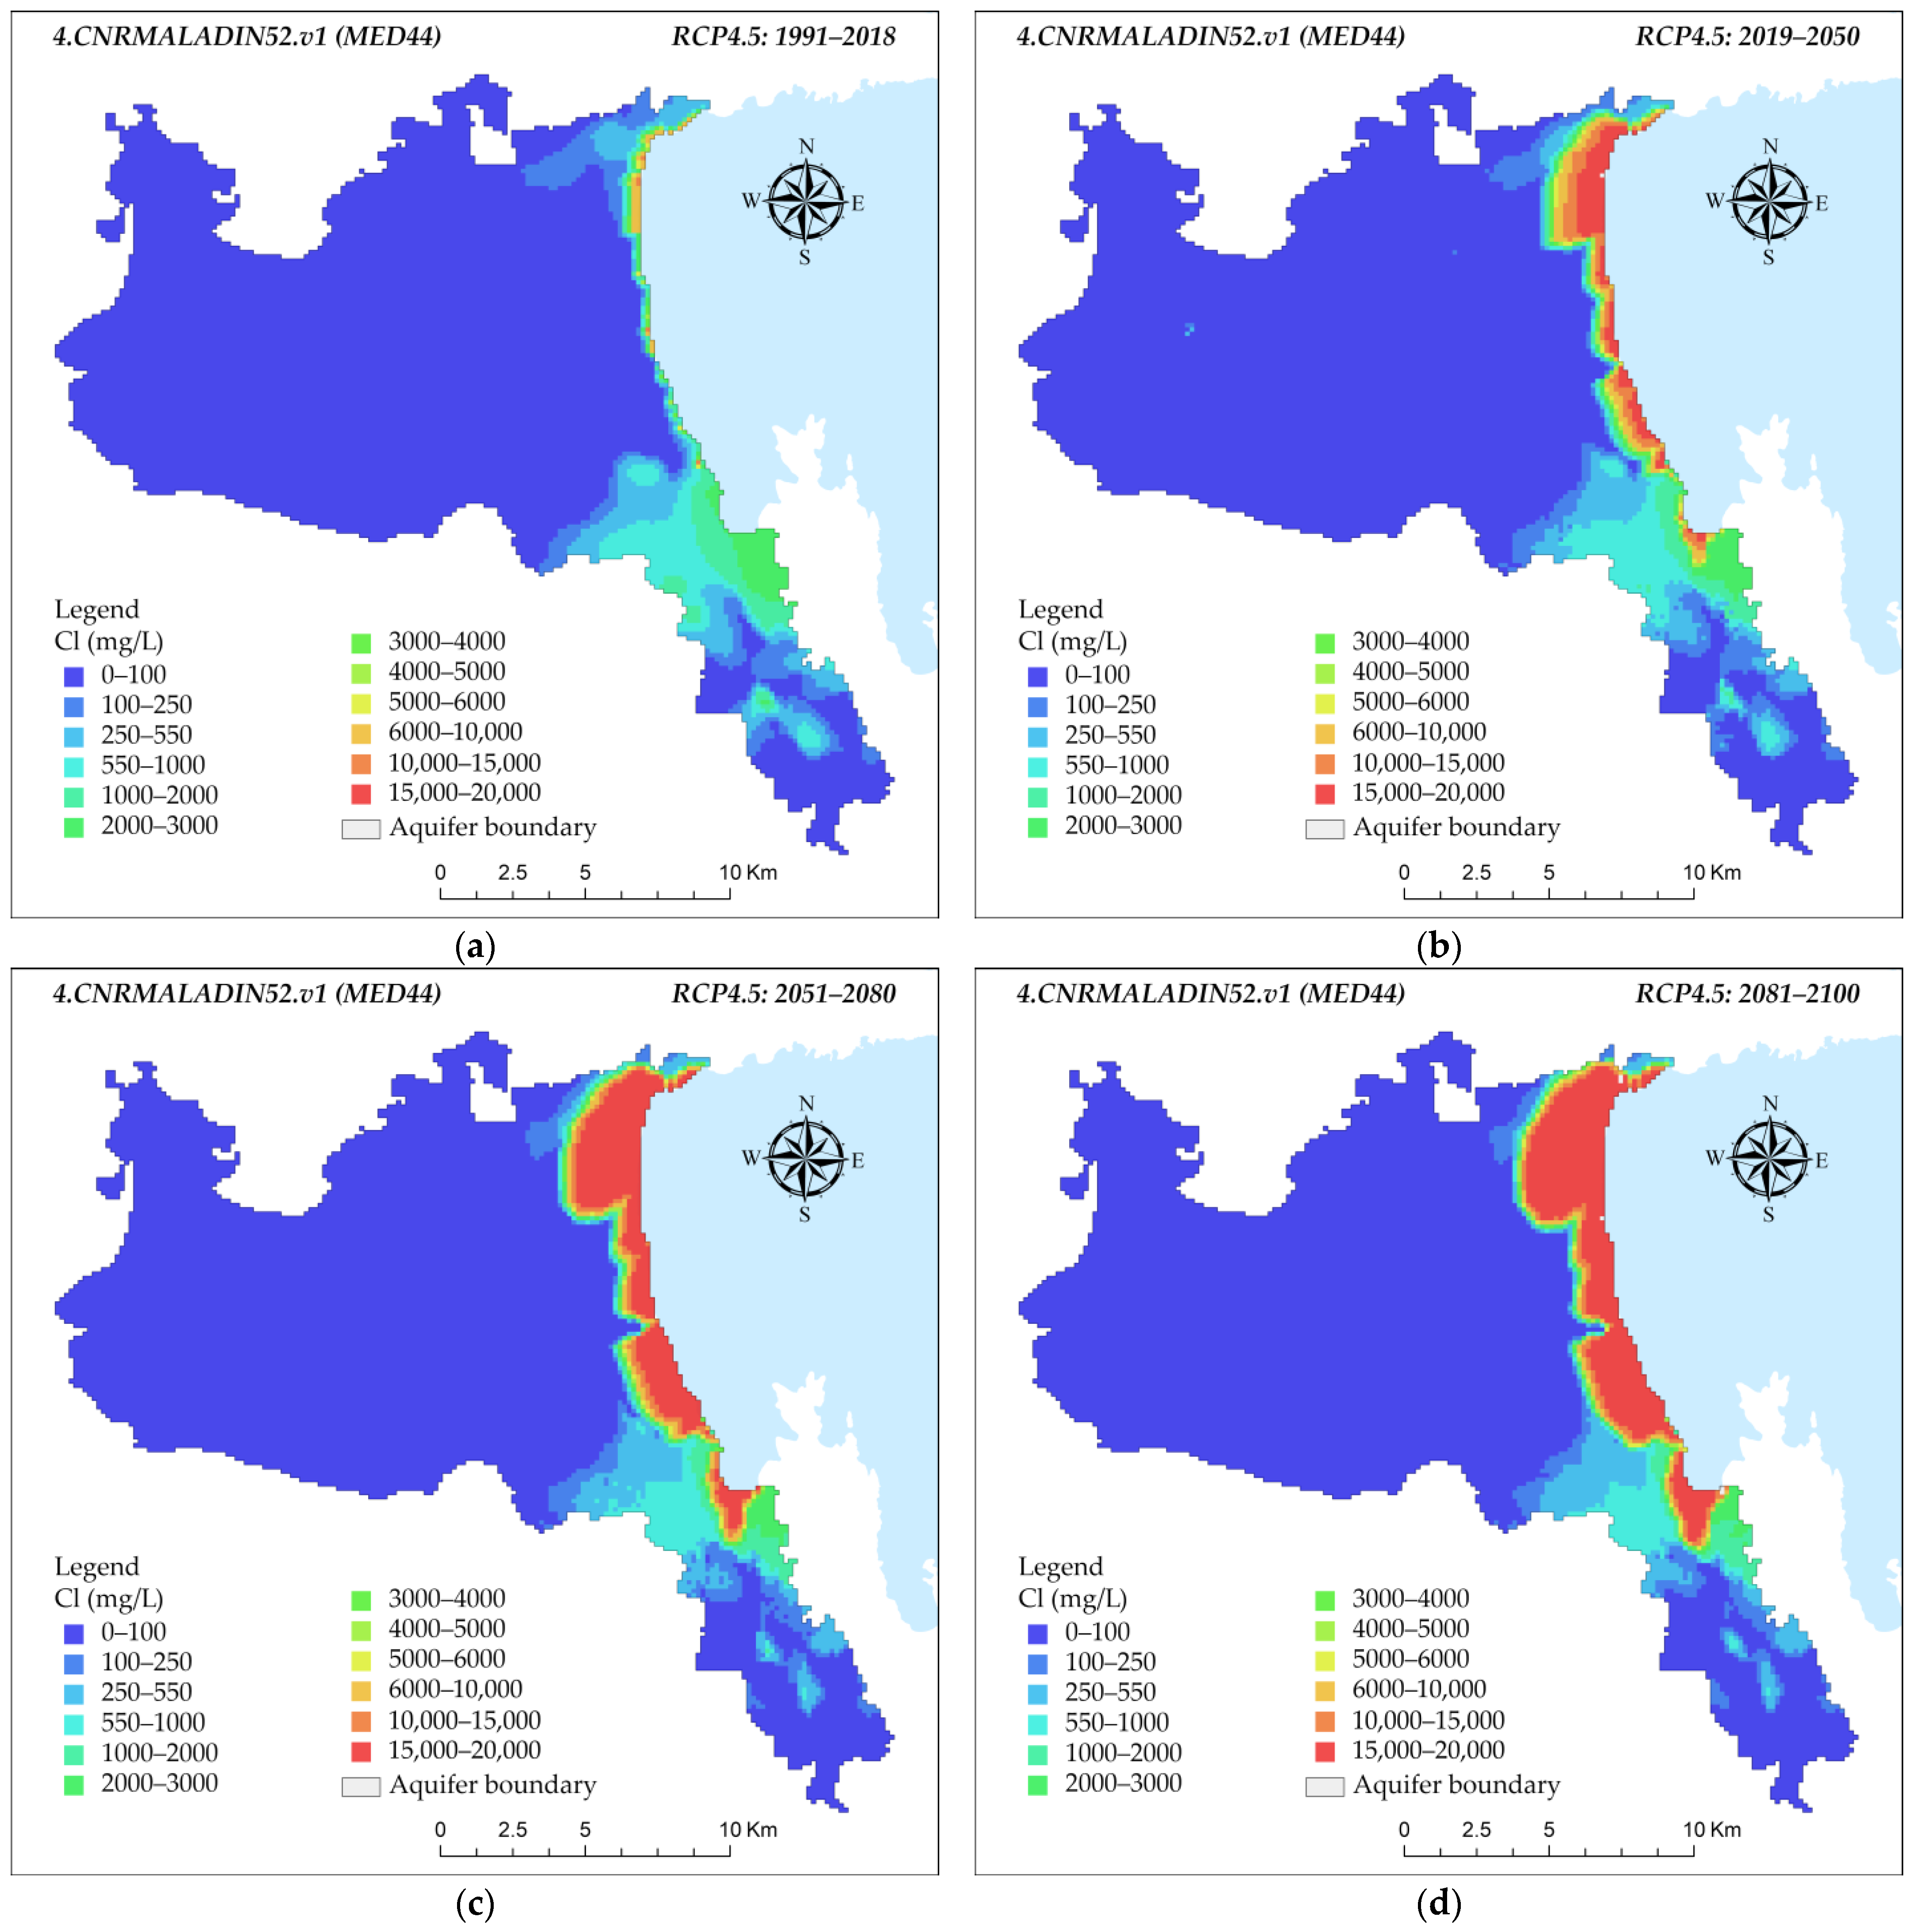
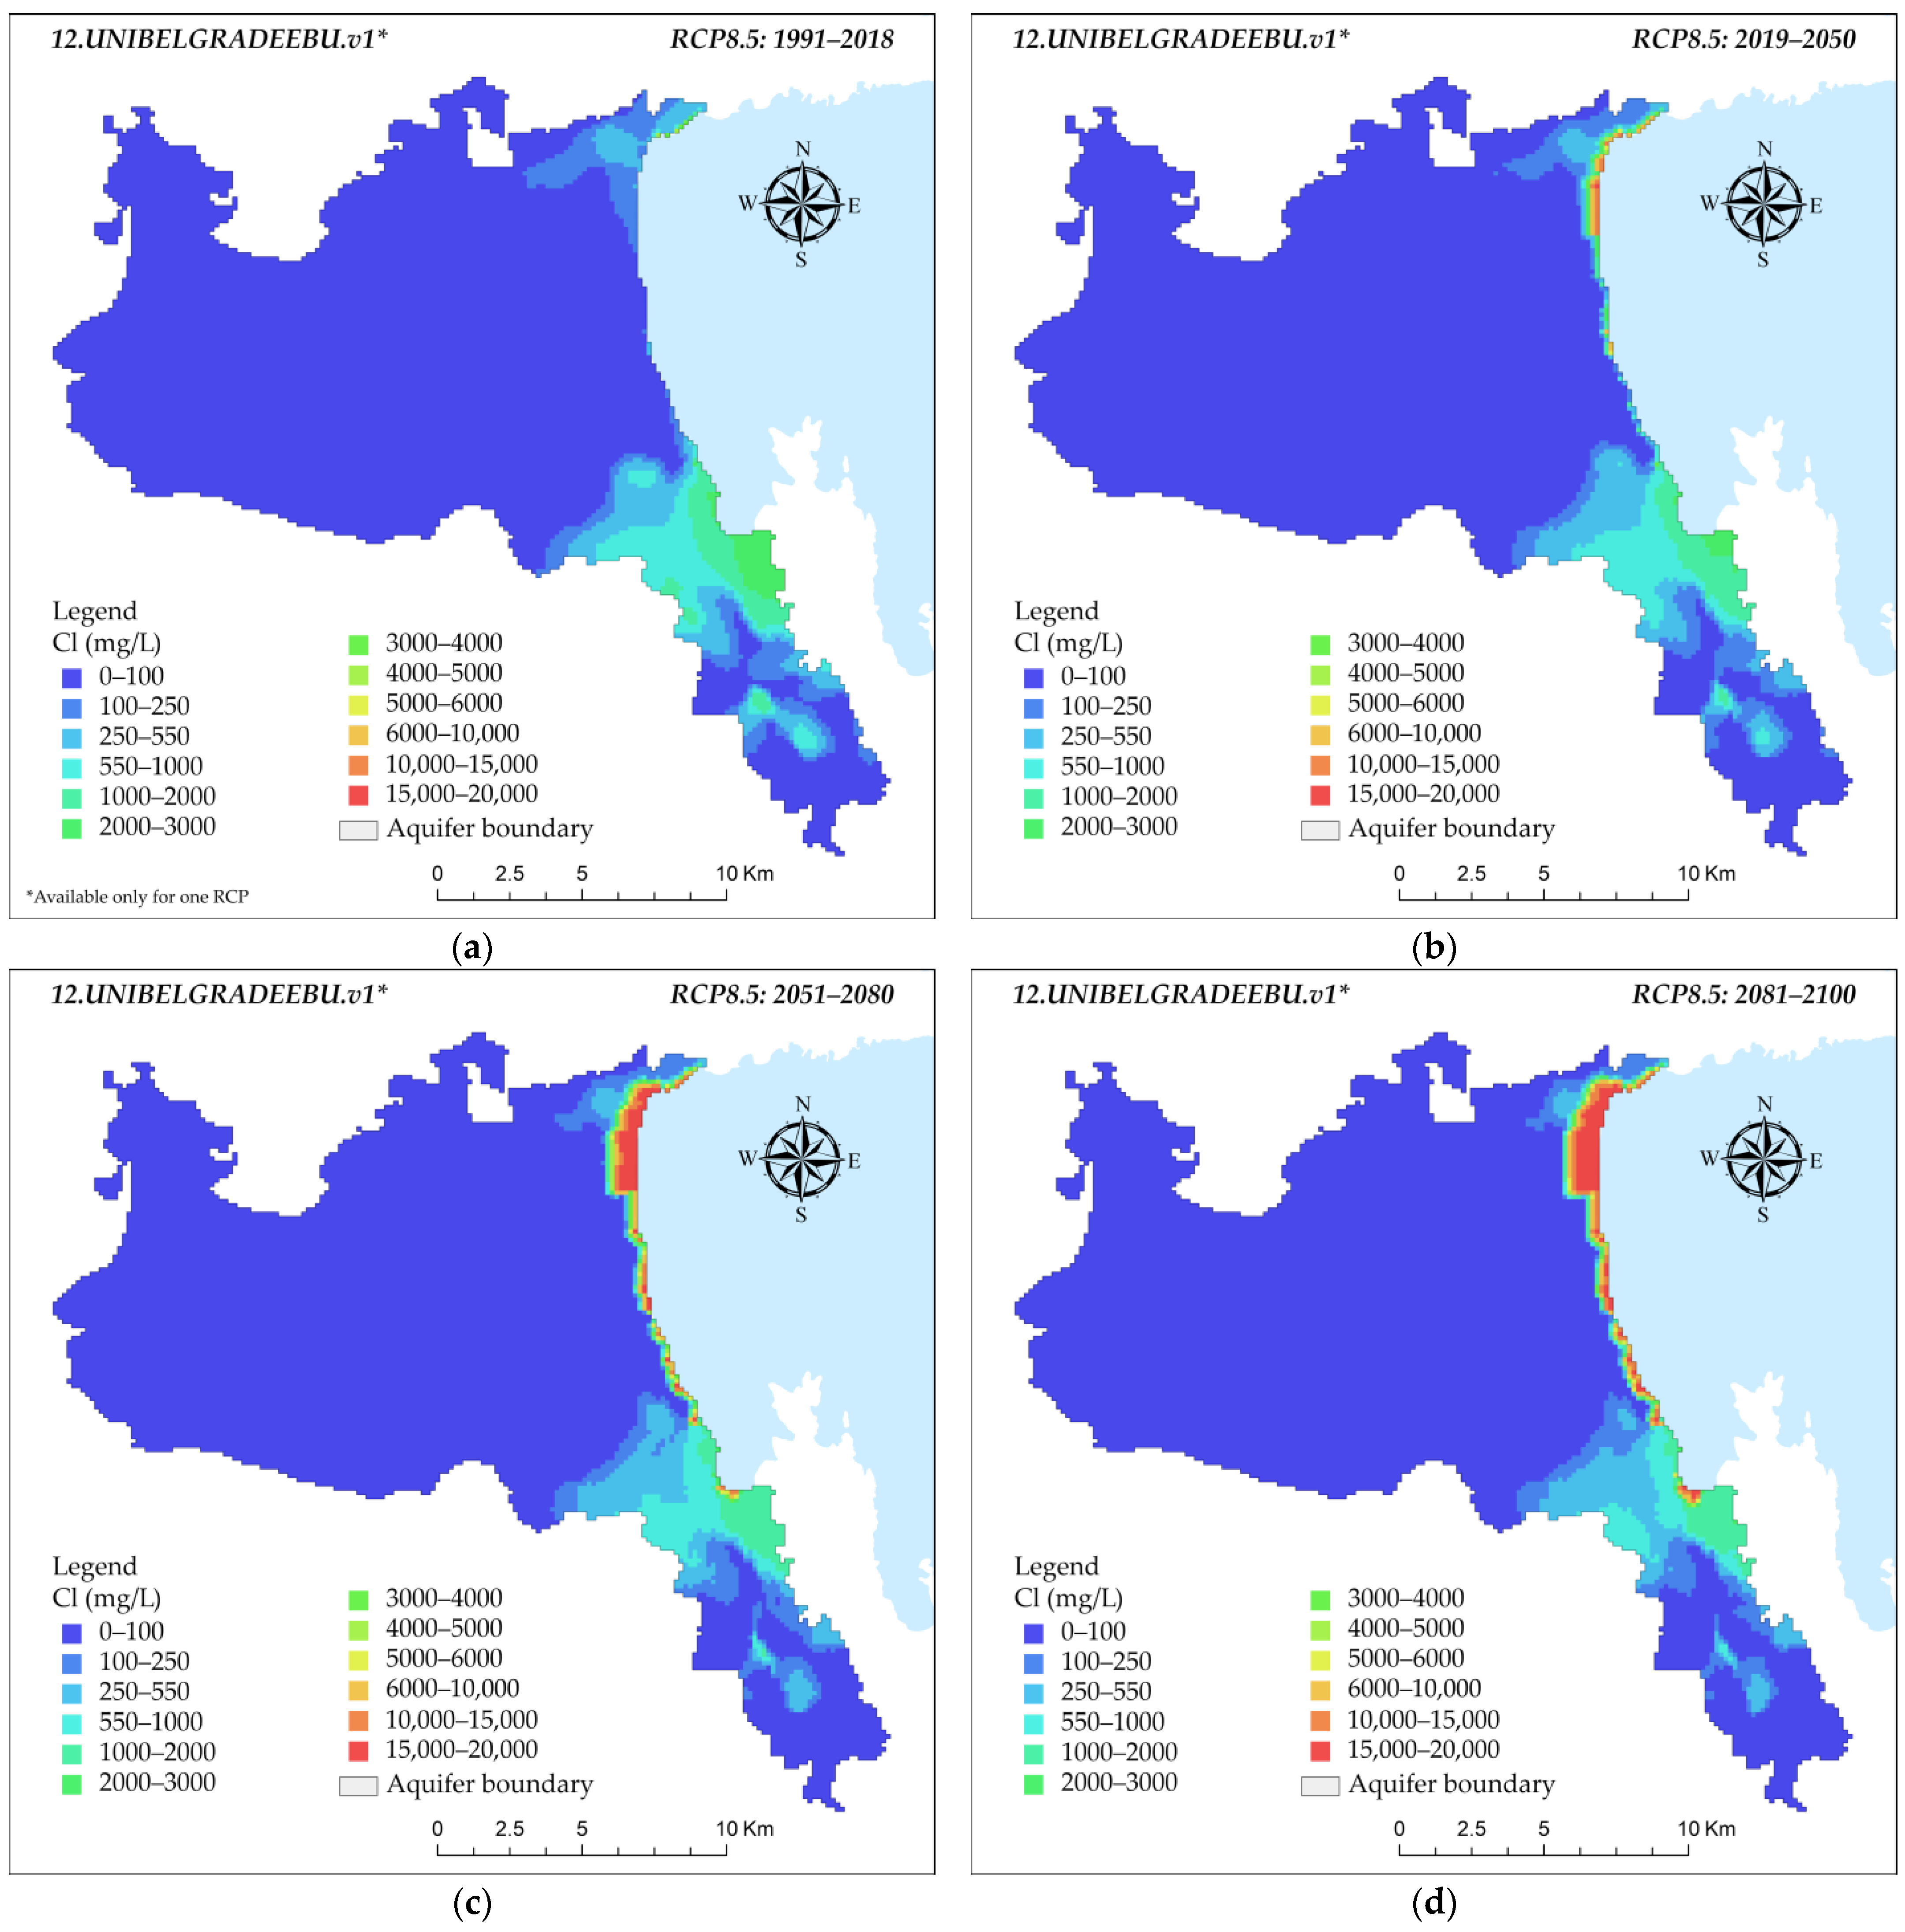
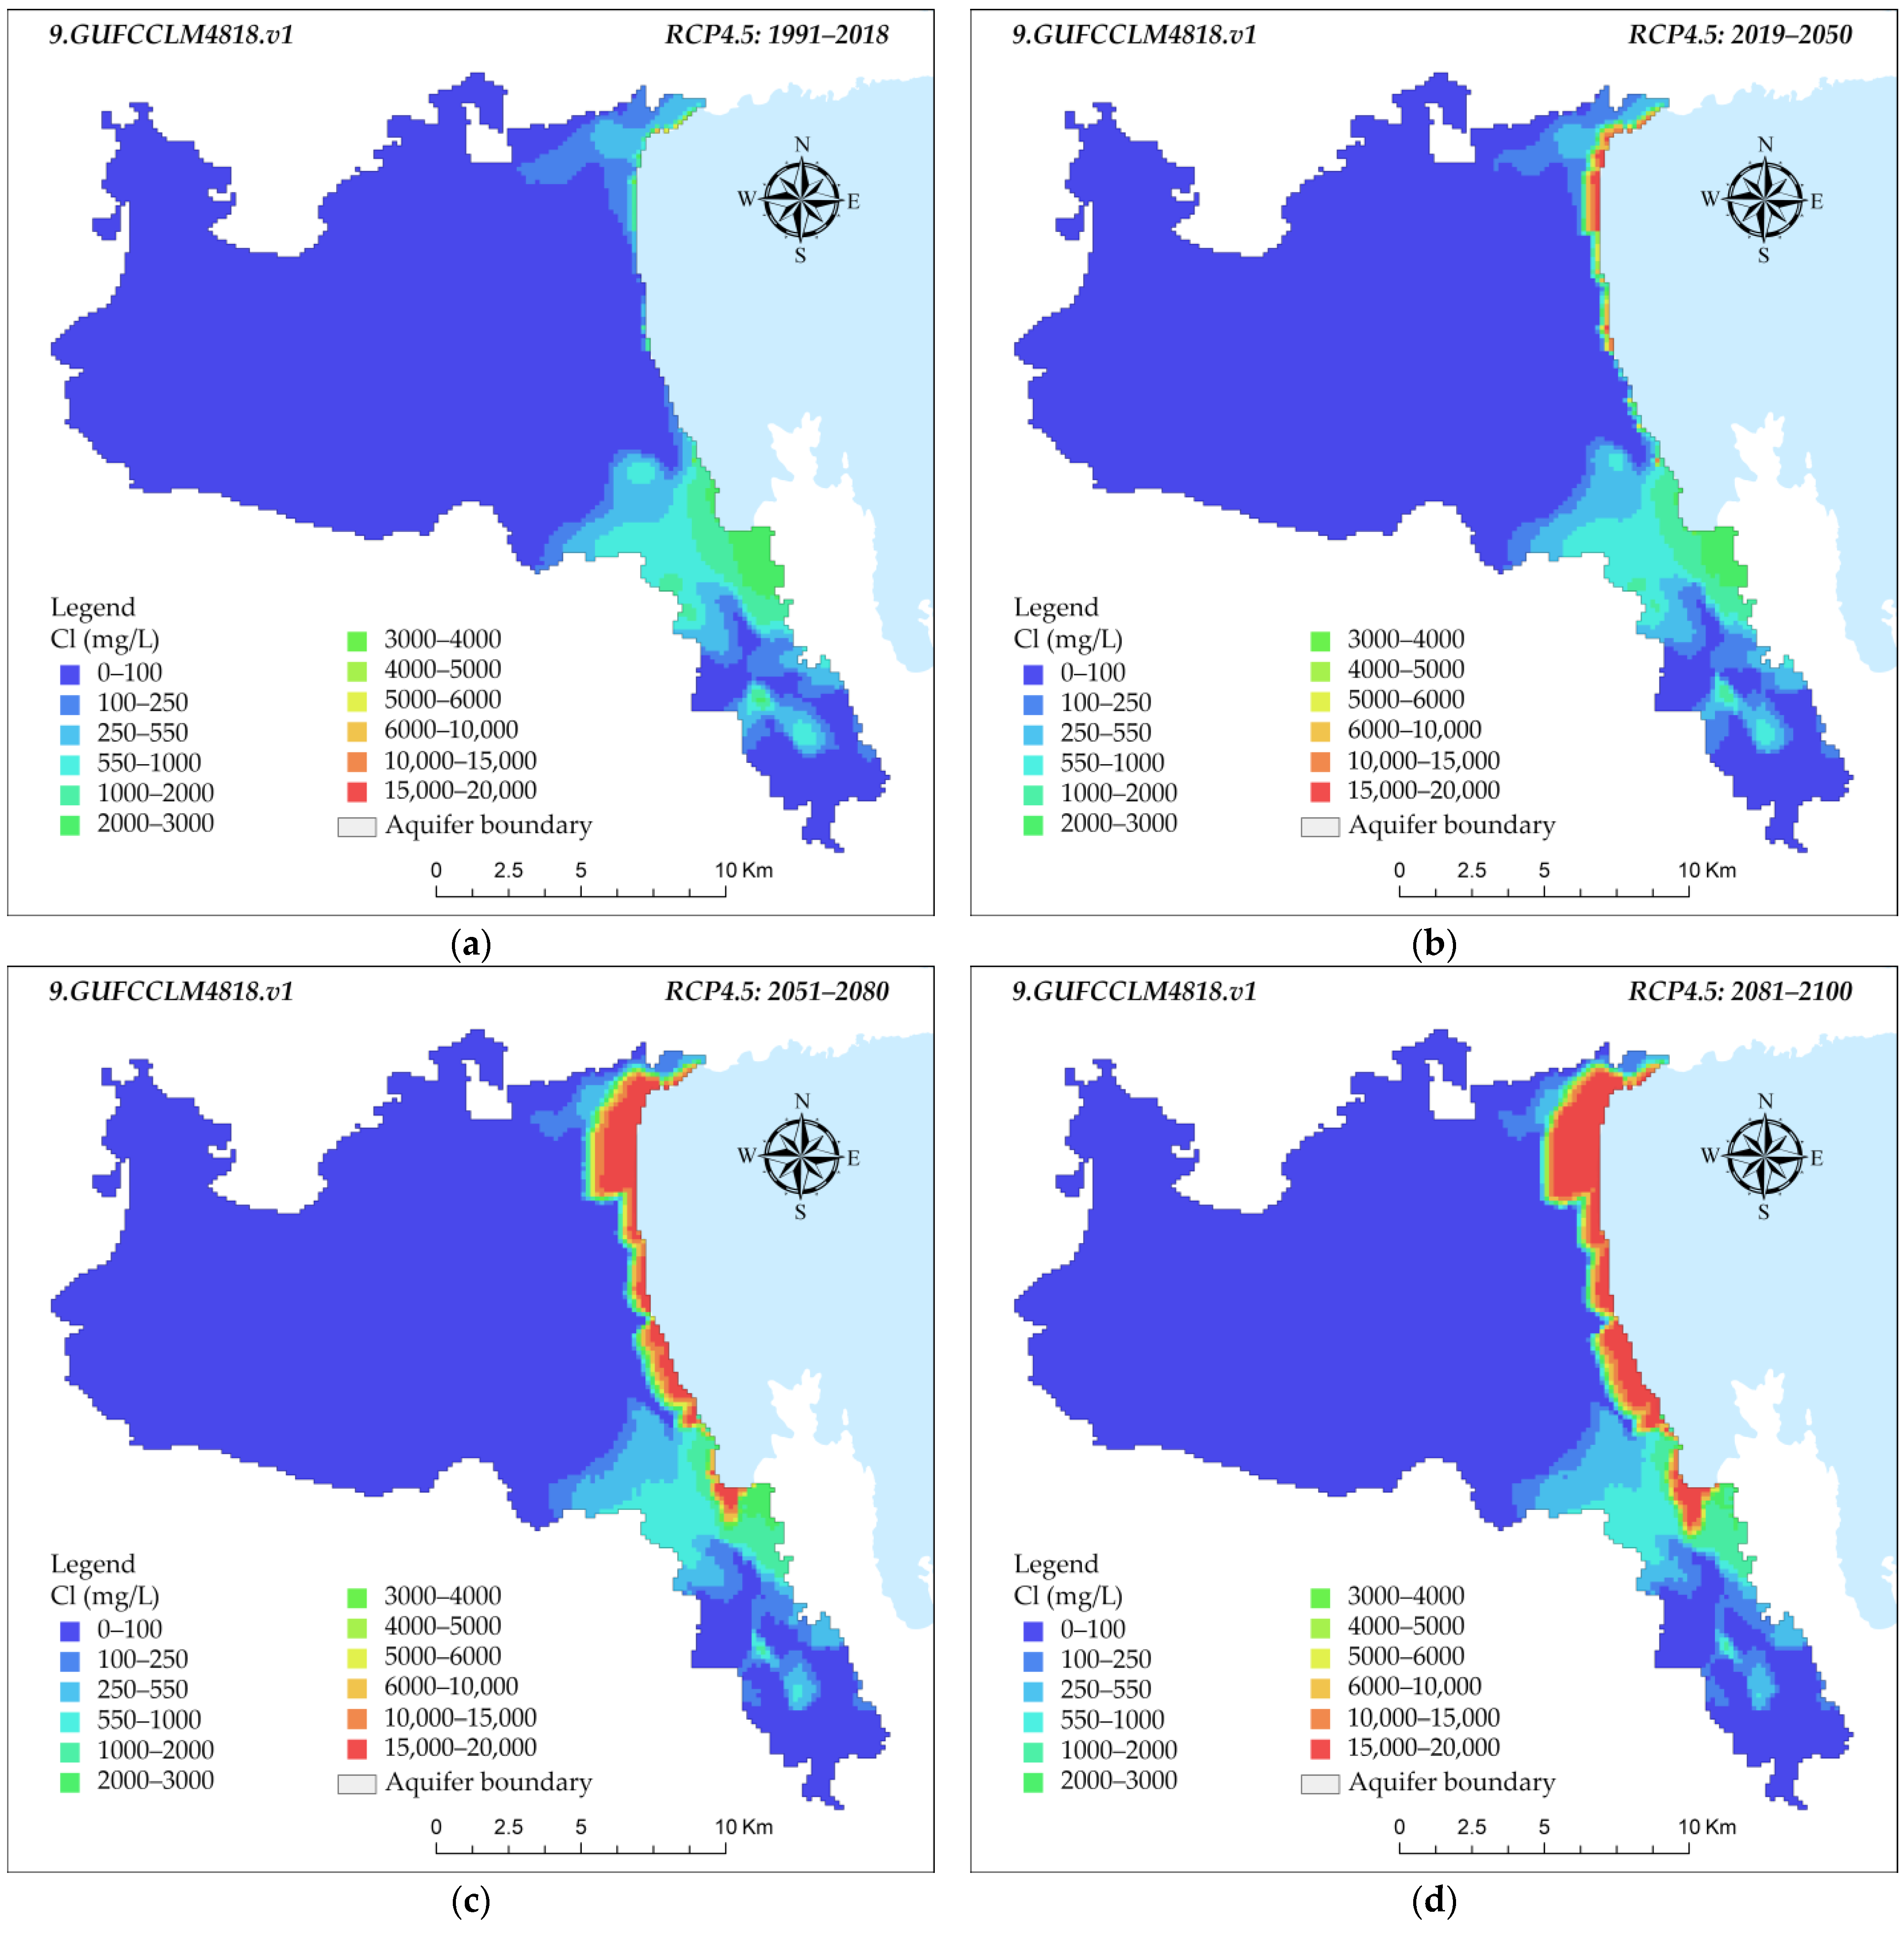
The spatial distributions of chloride concentrations simulated with the integrated modeling system (IMS) and the SEAWAT model are displayed in the following figures. The IMS climatic outputs that were chosen to be presented are the largest and smallest seawater intrusion levels, according to the results presented in Table 2 (RCP8.5) and Table 3 (RCP4.5) for each of the climate scenarios. The simulated results were averaged for their monthly values for the time frames of both the historical period, 1991 to 2018, and the future periods, from 2019 to 2050, 2051 to 2080, and 2081 to 2100. Figure 7, Figure 8, Figure 9, Figure 10 and Figure 11 display the progression of chloride concentrations in (mg/L) across the following four distinct time periods: 1991–2018, 2019–2050, 2051–2080, and 2081–2100. The progression through the four panels from (a) to (d) visually communicates the simulated chloride concentration over time, indicating areas that might experience significant environmental changes due to seawater intrusion. Each map is segmented into different colored areas, each representing a specific range of chloride concentration, from 0–100 mg/L up to 15,000–20,000 mg/L, highlighting areas of varying salinity levels, and providing a clear visual representation of how chloride levels change over time and space.
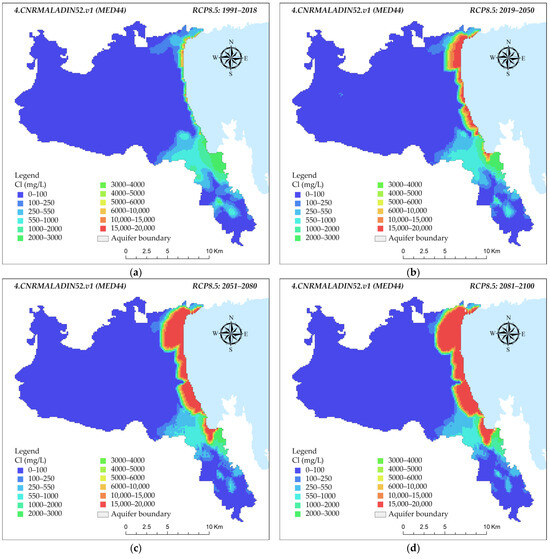
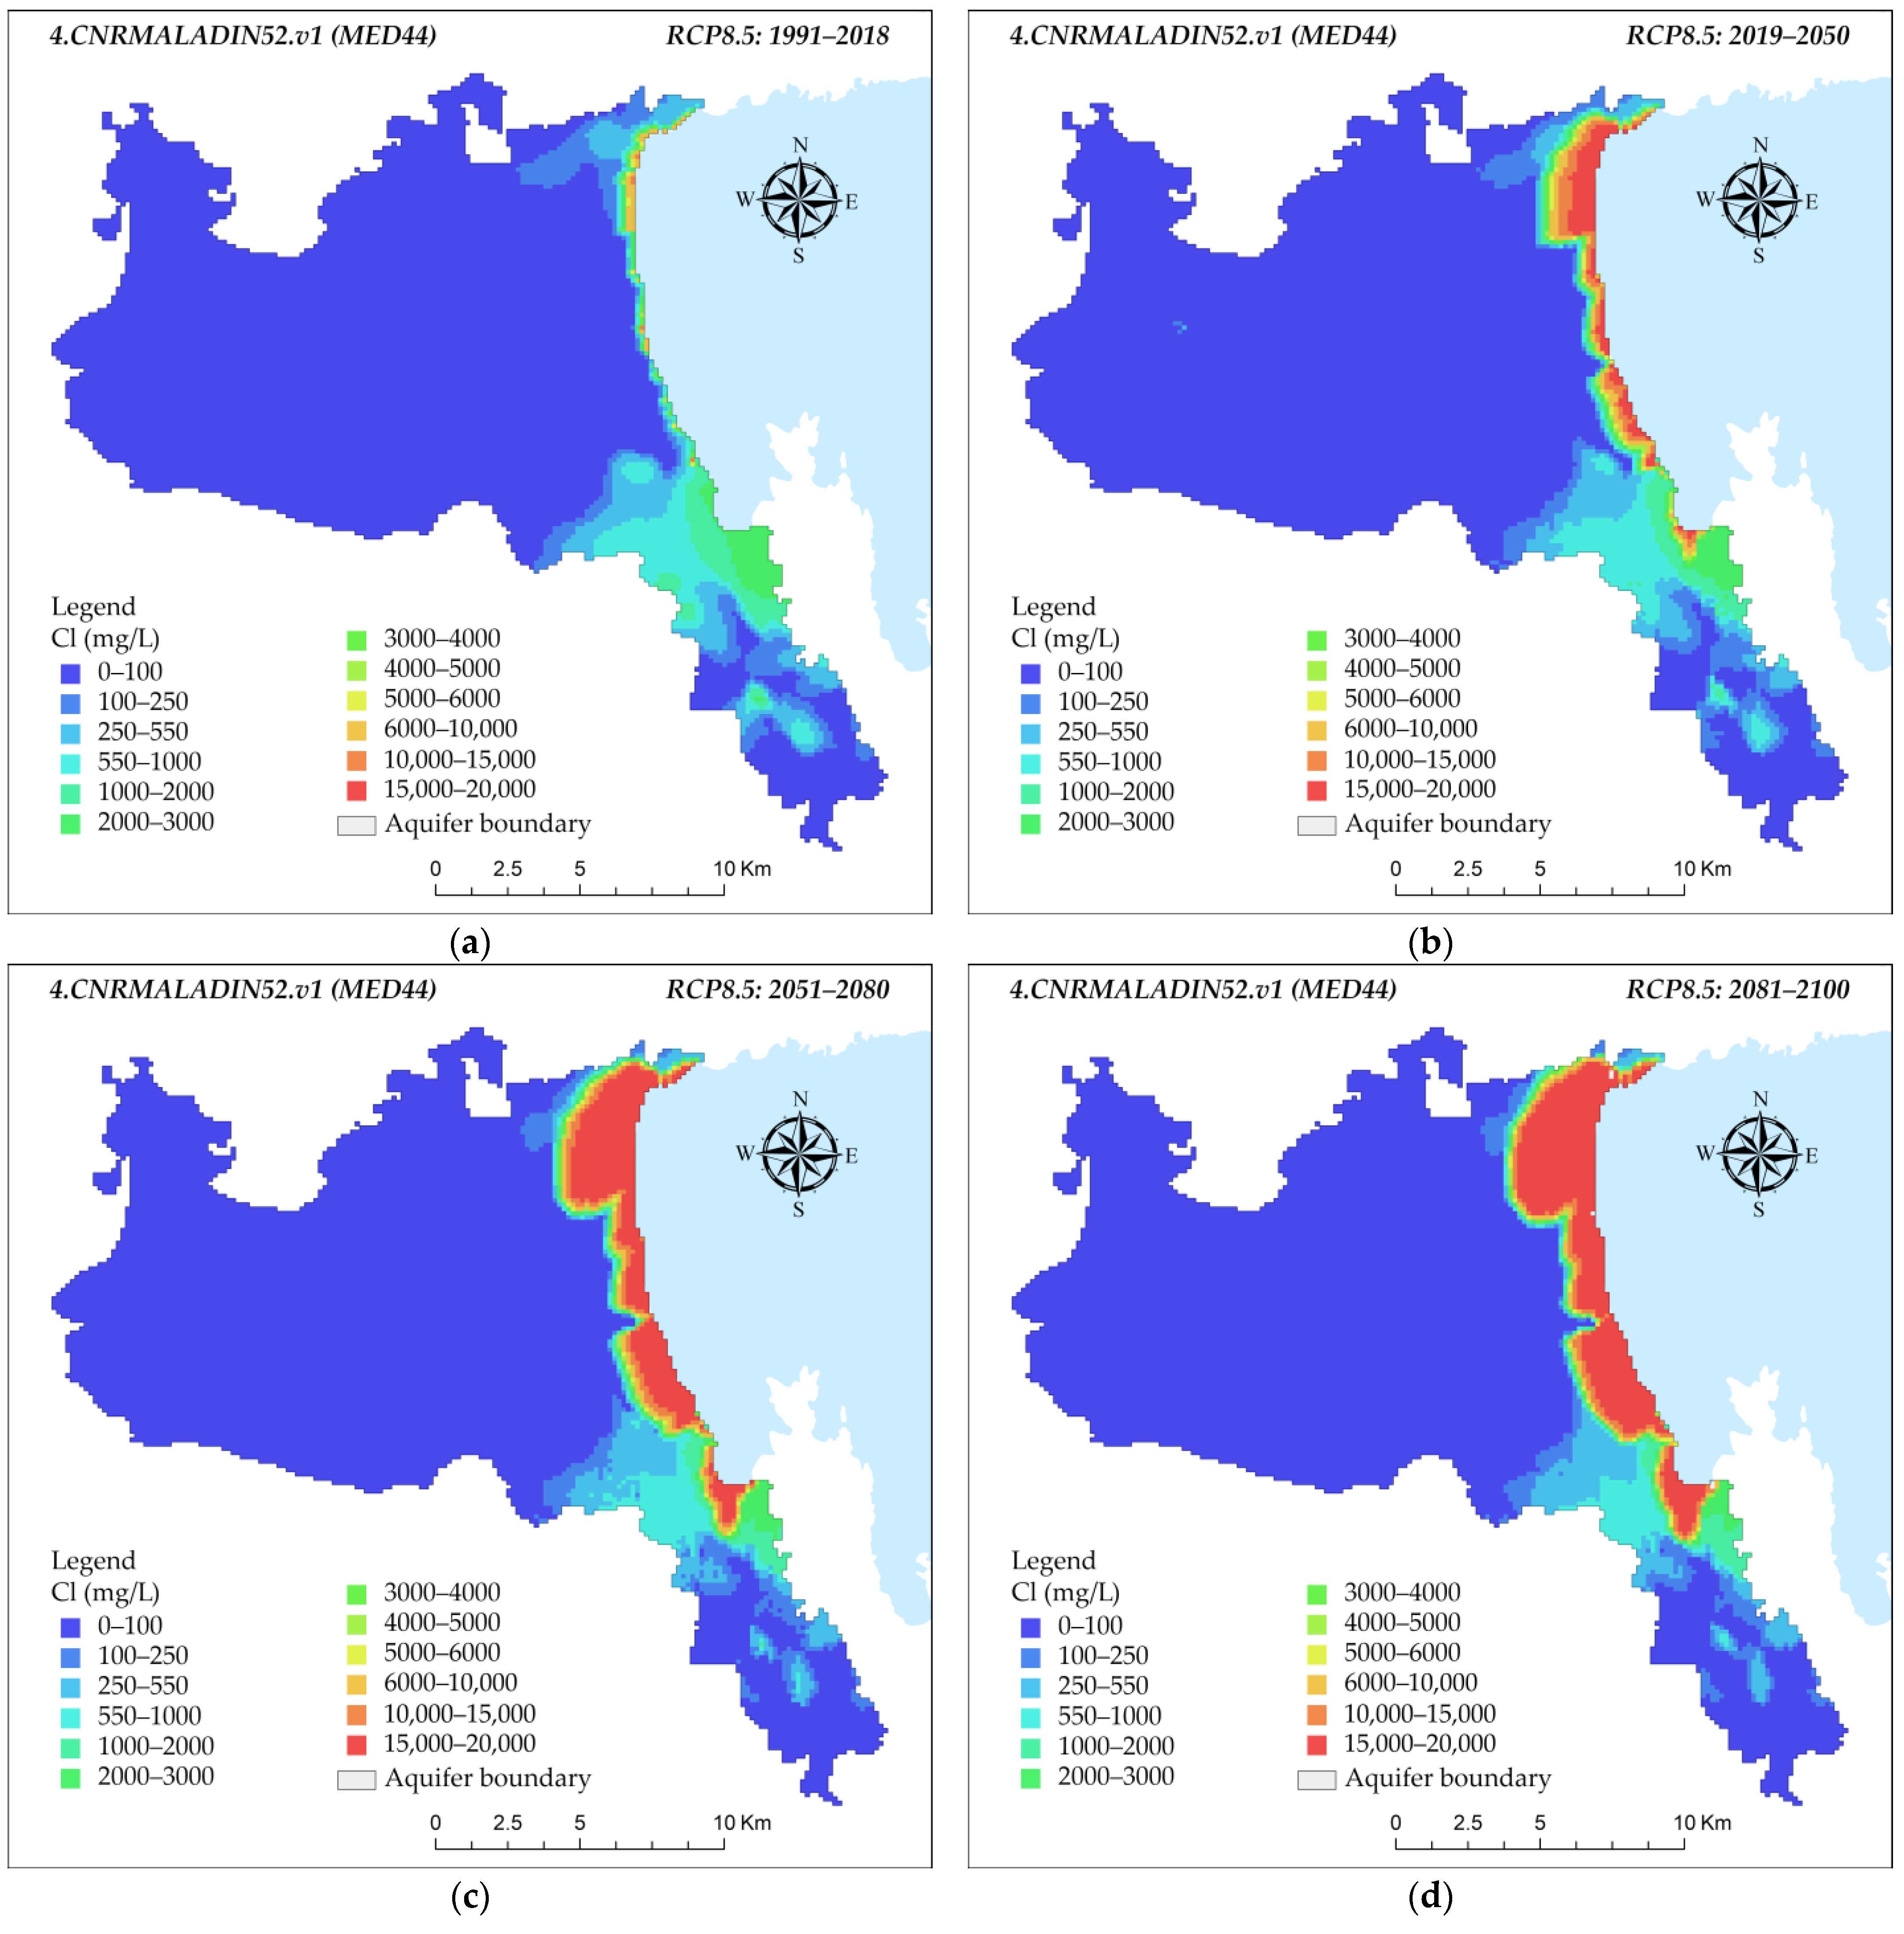
Figure 7.
Chloride concentrations in milligrams per liter (mg/L) across the following four time periods: (a) 1991–2018, (b) 2019–2050, (c) 2051–2080, and (d) 2081–2100. These concentrations are derived from the bias-corrected 4.CNRMALADIN52.v1 (MED44) model under climate scenario RCP8.5.
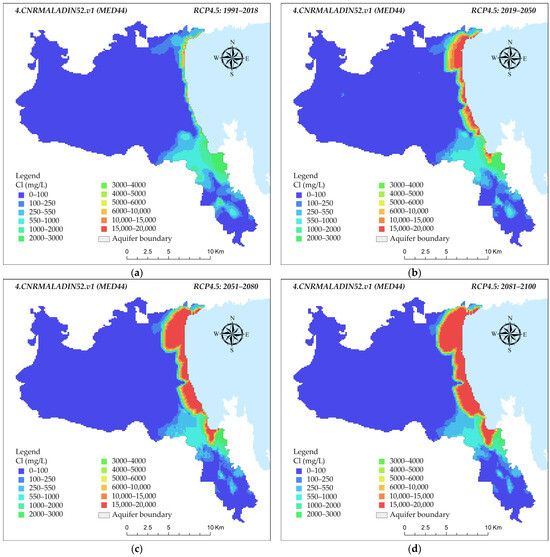
Figure 8.
Chloride concentrations in milligrams per liter (mg/L) across the following four time periods: (a) 1991–2018, (b) 2019–2050, (c) 2051–2080, and (d) 2081–2100. These concentrations are derived from the bias-corrected 4.CNRMALADIN52.v1 (MED44) model under climate scenario RCP4.5.
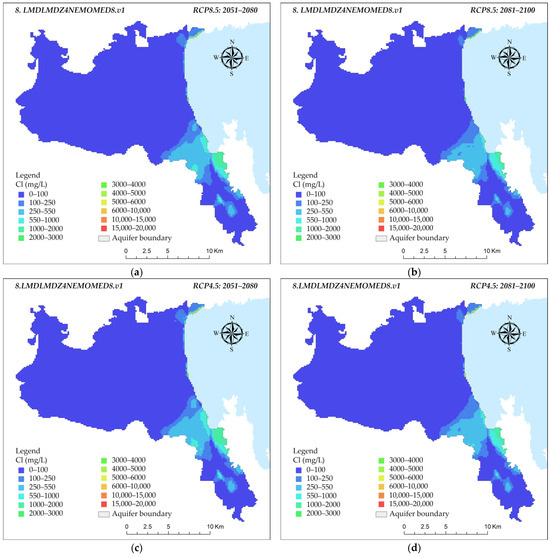
Figure 9.
Chloride concentrations in milligrams per liter (mg/L) across the following time periods: (a,c) 2051–2080 and (b,d) 2081–2100. These concentrations are derived from the bias-corrected 8.LMDLMDZ4NEMOMED8.v1 model under climate scenarios RCP4.5 and RCP8.5.
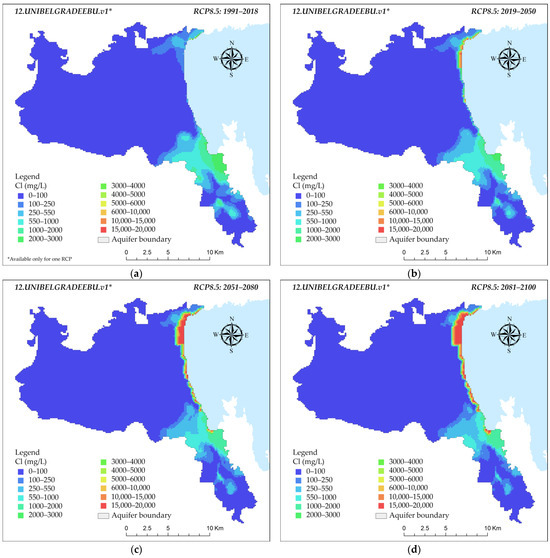
Figure 10.
Chloride concentrations in milligrams per liter (mg/L) across the following four time periods: (a) 1991–2018, (b) 2019–2050, (c) 2051–2080, and (d) 2081–2100. These concentrations are derived from the bias-corrected 12.UNIBELGRADEEBU.v1* under climate scenario RCP8.5. (*Available only for one RCP).

Figure 11.
Chloride concentrations in milligrams per liter (mg/L) across the following four time periods: (a) 1991–2018, (b) 2019–2050, (c) 2051–2080, and (d) 2081–2100. These concentrations are derived from the bias-corrected 9.GUFCCLM4818.v1 model under climate scenario RCP4.5.
For RCP8.5, the simulated data were derived from the bias-corrected 4.CNRMALADIN52.v1 (MED44) model, which yields the maximum seawater intrusion and is illustrated in Figure 7. The average chloride concentrations during the period of 1991–2018 are aggregated mostly in the northern coastal region and the southern coastal strait of the aquifer system (Figure 7a). The values of chloride concentrations range from 100 mg/L to the colored class of 6000 to 10,000 mg/L, with local points exceeding 10,000 mg/L. The progression to the next time period (2019–2050) shows significant increases along the whole coastline (Figure 7b). The aggregation of chlorides falls in the colored class of 15,000 to 20,000 mg/L, and the groundwater at the coastal area is salinized almost up to the concentration of chlorides in seawater. Seawater intrusion appears most intense and fierce in the north, and in the central southern coastal areas. Moving on to the subsequent time frame (2051–2080), the chloride concentrations reach the levels of seawater and take over 1.5 km of the whole coastline and coastal area inland (Figure 7c). Seawater intrusion shows variations in expansion among the northern, the central, and the southern coastal areas. During the final time period (2081–2100), seawater intrusion shows extreme intensification (Figure 7d). The aggregation of chlorides reaches the levels of seawater and expands over 2 km inland, while the course also shifts into the southern part of the aquifer system. For RCP4.5, the simulated data are derived from the bias-corrected 4.CNRMALADIN52.v1 (MED44) model, which yields the maximum seawater intrusion and is illustrated in Figure 8.
The spatial distributions of simulated chlorides, the pace of seawater intrusion intensification, and its progression are evident in the four panels from (a) to (d). As graphically verified through cross-checking, the chloride concentrations closely resemble those obtained under RCP8.5, with negligible differences in inland expansion. For both the RCP8.5 and PCP4.5 scenarios, the simulated chlorides are derived from the bias-corrected 8.LMDLMDZ4NEMOMED8.v1 model, which yields the minimum seawater intrusion and is illustrated in Figure 9. Seawater intrusion is detected for the future periods from 2051 to 2100, according to Table 2 and Table 3.
The panels of Figure 9a,b illustrate the simulated chloride levels for RCP8.5, in the periods of 2051 to 2080 and 2081 to 2100, respectively. Chloride concentrations aggregate in the northernmost coastal region and in the southern coastal strait of the aquifer. However, the chlorides appear diluted in both time periods under 8.LMDLMDZ4NEMOMED8.v1 model, in the southern coastal strait, reaching mostly the colored class of 550 to 1000 mg/L. Seawater intrusion levels for RCP4.5 present alleviating shifts in the southern coastal strait of the aquifer but increase in the northernmost coastal region. The phenomenon is not intense under the climatic model 8.LMDLMDZ4NEMOMED8.v1, for either of the two scenarios of climate change.
For RCP8.5, the simulated data are derived from the bias-corrected 12.UNIBELGRADEEBU.v1* model, which yields significant seawater intrusion levels and is illustrated in Figure 10. The average chloride concentrations during the period of 1991–2018 are aggregated mostly in the southern coastal strait of the aquifer system (Figure 10a).
The values of chloride concentrations range from 550 mg/L to the colored class of 3000 to 4000 mg/L, with local points exceeding 15,000 mg/L. The progression to the next time period (2019–2050) shows significant increases along the northern coastline (Figure 10b). The aggregation of chlorides falls in the colored class of 15,000 to 20,000 mg/L, and the groundwater at the coastal area is salinized almost up to the concentration of chlorides in seawater near the coast. Moving on to the subsequent time frame (2051–2080), the chloride concentrations reach the levels of seawater and take over approximately 1 km of the northern coastal area inland (Figure 10c). The salinized southern coastal strait of the aquifer shows minor shrinkage, although the aggregated chlorides remain at same levels as during 2019 to 2050, while local exceedances of 15,000 mg/L are detected near the coast. During the final time period (2081–2100), seawater intrusion shows notable intensification (Figure 10d). The aggregation of chlorides reaches the chloride levels of seawater and expands over 1.5 km inland. Seawater intrusion expands along the coastline, reaching chloride concentration levels more than 15,000 mg/L, but the inward expansion is quite short, compared to previous models.
For RCP4.5, the simulated chlorides are derived from the bias-corrected 9.GUFCCLM4818.v1* model, which yields significant seawater intrusion levels and is illustrated in Figure 11. The average chloride concentrations during the period of 1991–2018 are aggregated mostly in the southern coastal strait of the aquifer system (Figure 11a). The values of chloride concentrations range from 550 mg/L to the colored class of 4000 to 5000 mg/L, while no local increases occur. The progression to the next time period (2019–2050) shows significant increases along the northern coastline and down along the central coast (Figure 11b). Seawater intrusion reaches the chloride concentration of seawater in the north, over 15,000 mg/L, and the inward expansion is limited, compared to the results of the previous model, with more adverse impacts. The chloride concentrations seem relatively stable in the southern coastal strait of the aquifer. Moving on to the subsequent time frame (2051–2080), the seawater intrusion levels show variations in expansion among the northern, central, and southern coastal areas. Seawater intrusion appears most intense and fierce in the northern, central, and southern coastal areas. The chloride concentrations reach the levels of seawater and take over approximately 2 km of the inland northern coastal area, and 1 km of the inland southern coastal area (Figure 11c). The phenomenon appears to quickly exacerbate during this time frame. During the final time period (2081–2100), seawater intrusion shows evident intensification (Figure 11d). The chloride concentrations take over more than 2 km of the northern coastal area, approximately 1 km of the central coastal region, and 2 km of the southern coastal area. Remarkably, an inland shift of seawater is detected in the southern strait of the aquifer. The phenomenon appears exacerbated and adverse during the last time frame of the century.
4. Discussion
This research examined water reserves, particularly focusing on groundwater, and the components of water balance and seawater intrusion for two climatic scenarios, RCP8.5, and RCP4.5, alongside the projected climate data from nineteen (19) climatic models within the Med-CORDEX database. The scopes of this research were as follows: (i) to provide integrated modeling approaches to assess the complex impacts of climate change and sea level rise on groundwater aquifer systems, with a specific focus on seawater intrusion; (ii) to incorporate transient head boundary conditions in the models for a dynamic representation of the aquifer’s behavior; (iii) to provide a more realistic and sophisticated representation of the interactions between regional climatic forcings, sea level rise, changes in recharge, groundwater uses, and seawater intrusion; and (iv) to examine the components of the water cycle that affect and cause the exacerbation of seawater intrusion. The assessment process employs the integrated modeling system [37] specifically developed for agricultural coastal watersheds. This system comprises linked models for surface water hydrology [32] and groundwater models of aquifer hydrology [40] and seawater intrusion [41].
The integrated modelling system simulations reveal that the water balance of the aquifer system is affected by seawater intrusion, groundwater recharge, and groundwater abstractions. In both climatic scenarios, aquifer outflows constitute 55% to 85% of the water balance, mostly consisting of groundwater abstractions. Groundwater recharge and irrigation return flow form a distinct relation with seawater intrusion, with high recharge levels causing low seawater intrusion, which drops to almost zero in some climate models.
As the time progresses to the year 2100, the advancement of seawater intrusion in the coastal aquifer is strongly controlled by the combined effects of the rate at which groundwater is replenished by natural sources (recharge), the water pumped out of the aquifer (abstractions), and the water applied to crops (irrigation) that seeps back into the groundwater system (return flow), especially in light of changing climate conditions.
Seawater intrusion poses a substantial challenge, impacting groundwater recharge and irrigation return flow. Different climate models under the RCP8.5 scenario show various trends. However, most models predict that seawater intrusion will rise over time. From 1991–2000, seawater intrusion percentages are relatively low, but as decades progress, they increase. The projected percentages for 2019–2050 and 2051–2080 are expected to rise, while the last timeframe of the century (2081–2100) showcases a continuing upward trend. Most models show a consistent decrease in groundwater abstractions and aquifer discharge, with the highest percentage predicted by the 4.CNRMALADIN52.v1 model. Groundwater recharge and irrigation return flow experience variability during the initial period of RCP4.5 (1991–2000). As time progresses, fluctuations and trends become apparent, with many models showing a decreasing trend in recharge. From 1991–2000 to 2081–2100, significant fluctuations in seawater intrusion rates are observed, with one consistent trend maintaining low percentages. Variability is also observed in the groundwater abstractions and aquifer discharge trends, depending on the increase or decrease rate of precipitation and temperature indicated by the various climatic models. Climate change may impact groundwater recharge and return flow, which are crucial components of the water cycle.
The SEAWAT model simulations for chloride concentrations In the historical period of 1991–2018 show consistent patterns across various climatic scenarios and models. As time progresses towards 2100, the results reveal distinct changes and fluctuations, particularly in the levels of chloride. The highest chloride concentrations are produced at the northern coast using bias-corrected climate models 4.CNRMALADIN52.v1 (MED44) and 1.CNRMALADIN52.v1 (MED11), while the seawater wedge in the aquifer system advances inland over time. The extent to which seawater intrusion expands inland was calculated by taking the tolerance limit for crops, 100 mg/L, as a threshold value. The statistics for the creation of the seawater wedge in the aquifer system of Almyros, categorized by different Med-CORDEX models and time periods, show steeper increases in the formation of the seawater wedge, except for the model 8.LMDLMDZ4NEMOMED8.v1.
The spatial distributions of chloride concentrations, as simulated by the integrated modeling system (IMS) and SEAWAT model, were averaged monthly for both the historical period, of 1991 to 2018, and the future periods, from 2019 to 2100. Comparing the spatial distributions of chloride concentrations under the two climate scenarios, RCP8.5 and RCP4.5, respectively, it is observed that the phenomenon of seawater intrusion appears mostly exacerbated and high-paced, with great expansion across the coastal lowlands. Interestingly, seawater intrusion is more high-paced in RCP8.5 than RCP4.5. In the RCP8.5 scenario, from 1991 to 2018, chloride concentrations are concentrated primarily in the northern coastal region and the southern coastal strait, ranging from 100 mg/L to 6000–10,000 mg/L. From 2019 to 2050, there are substantial increases in chloride concentrations along the entire coastline, peaking at 15,000–20,000 mg/L, with intense seawater intrusion observed in the northern, central, and southern coastal areas. Moving into 2051–2080, chloride concentrations reach seawater levels, extending over 1.5 km of the coastline, and displaying variations in expansion across the northern, central, and southern coastal areas. The period of 2081–2100 witnesses the extreme intensification of seawater intrusion, with chloride concentrations reaching seawater levels and expanding over 2 km inland. In the RCP4.5 scenario, chloride concentration trends closely mirror those observed under RCP8.5, displaying minimal differences in inland expansion. The simulations, derived from the bias-corrected 8.LMDLMDZ4NEMOMED8.v1 model, reveal a scenario of minimal seawater intrusion. Notably, chloride concentrations in the southern coastal strait remain diluted, ranging from 550 to 1000 mg/L for both scenarios, indicating consistent patterns of less severe impacts. From 1991 to 2018, chloride concentrations in the RCP8.5 scenario, modeled by 12.UNIBELGRADEEBU.v1*, aggregate predominantly in the southern coastal strait, ranging from 550 mg/L to the colored class of 3000 to 4000 mg/L. Between 2019 and 2050, there are significant increases along the northern coastline, peaking at 15,000 to 20,000 mg/L, leading to seawater salinization. By 2051–2080, chloride concentrations reach seawater levels, extending over approximately 1 km of the northern coastal area inland. In the final period (2081–2100), there is a notable intensification of seawater intrusion, with chloride concentrations expanding over 1.5 km inland.
The results indicate consistent chloride concentration patterns across RCP8.5 and RCP4.5 scenarios, affirming the models’ robustness and the sensitivity of the simulated results to emission scenarios. However, different models (namely 8.LMDLMDZ4NEMOMED8.v1* and 12.UNIBELGRADEEBU.v1*) demonstrate varied seawater intrusion levels, underscoring the critical role of model selection. Temporally, seawater intrusion exhibits a progressively worsening trend, particularly in the latter half of the century under RCP8.5, emphasizing the need for climate change mitigation. Spatially, variations in impact intensity, particularly in the northern, central, and southern coastal areas, underscore the localized vulnerability to seawater intrusion. One common limitation of climate models in general is their inherent uncertainty, due to the complexity of the Earth’s climate system and the numerous variables that influence it. Nevertheless, the consistent chloride concentration patterns observed provide valuable perspectives, despite the inherent uncertainties associated with climate modeling. The range of differences between simulations (for different climate models) is a key tool for understanding climate change dynamics under specific emission scenarios, highlights the challenges associated with climate modeling, and underscores the need for continuous improvement and validation processes to enhance the credibility of climate projections. Climate models are constantly being updated and refined as new data become available, so it is important to view their predictions as projections rather than definitive outcomes.
5. Conclusions
The present research highlights the significant impact of climate change on groundwater coastal aquifer systems, particularly in relation to seawater intrusion. The integrated modeling system was employed to simulate the ways in which climate change may affect water resources and seawater intrusion in the Almyros basin and its groundwater system. The incorporation of transient head boundary conditions allows for a dynamic representation of aquifer behavior, offering a more accurate depiction of the ever-changing coastal environment under climate change. The findings emphasize the crucial role of groundwater recharge and irrigation return flow in influencing the evolution of seawater intrusion under different climatic scenarios, with varying trends and uncertainty projected for the future. Sea level rise and climate change have a substantial impact on vulnerable coastal aquifers, and computational models are essential for evaluating how these factors alter the processes of seawater intrusion. Seawater intrusion was analyzed under two climate scenarios, RCP8.5 and RCP4.5, using 19 bias corrected climatic models. In RCP8.5, the model 4.CNRMALADIN52v1 (MED44) has the highest intrusion at 1.575 km, while the model 8.LMDLMDZ4NEMOMED8.v1 has the lowest at 0.099 km during the 2081–2100 period. Some models show no seawater intrusion, either historically or until 2080. In RCP4.5, the model 1.CNRMALADIN52v1 (MED11) has the highest intrusion at 1.450 km in the later period, while the model 8.LMDLMDZ4NEMOMED8.v1 has the lowest, at 0.131 km. Most models exhibit increasing trends in seawater intrusion, occurring on the northern coast and expanding to other coastal areas during the period from 1991 to 2100. The variations among the model results highlight the following: (i) the significance of model selection, (ii) the inherent uncertainties of climate modelling, (iii) the necessity for climate change mitigation actions, and (iv) the vulnerability of coastal aquifers to seawater intrusion. It is important to consider multiple models and scenarios, due to chloride concentration trends, the intensification of seawater intrusion in the second half of the century, and uncertainties in predicting the exact extent of seawater intrusion under climate change conditions.
This information is crucial for policymakers seeking to mitigate the impacts of sea level rise on coastal communities. Thus, action and measures should be taken to address the exacerbation of seawater intrusion now and in the future, such as the following: (i) groundwater management and monitoring, (ii) the use of managed aquifer recharge (MAR), (iii) land-use/crop cultivation planning, (iv) the application of agricultural best management practices (BMPs) for irrigation (e.g., deficit irrigation), (v) the application of climate change adaptation measures, (vi) the development of surface water storage (e.g., reservoirs) and/or the use of marginal water sources (e.g., treated wastewater and brackish water), (vi) the provision of incentives to adopt water-efficient technologies and practices, (vii) community and stakeholder involvement, (viii) emergency response plans to address sudden increases in salinity or other indicators of seawater intrusion, ensuring swift and effective actions, and, last but not least, (ix) research and modelling to account for the propagated uncertainties of climate change to the modelling simulations. Several of the aforementioned measures and actions have been simulated and showcased in the Ph.D. thesis authored by Lyra [38]. By integrating these measures into a comprehensive and adaptive management approach, coastal regions can better protect their freshwater resources from the threats of seawater intrusion.
Author Contributions
Conceptualization, methodology, writing—original draft, supervision, and writing—review and editing: A.L. (Athanasios Loukas); conceptualization, methodology, software, writing—original draft, writing—review, formal analysis, investigation, and data curation: A.L. (Aikaterini Lyra); writing—original draft preparation, formal analysis, writing—review and editing, and data curation: P.S.; writing—original draft and writing—review and editing: N.M. All authors have read and agreed to the published version of the manuscript.
Funding
This research was co-financed by Greece and the European Union (European Social Fund—ESF) through the Operational Programme (“Human Resources Development, Education and Lifelong Learning” in the context of the project “Strengthening Human Resources Research Potential via Doctorate Research” (MIS-5000432), implemented by the State Scholarships Foundation (IKΥ).
Data Availability Statement
The article encompasses the original contributions made in the study; for additional inquiries, please contact the corresponding authors.
Acknowledgments
The simulations employed in this study were obtained from the Med-CORDEX repository (www.medcordex.eu).
Conflicts of Interest
The authors declare no conflicts of interest. The funders had no involvement in the study’s design, data collection, analysis, interpretation, article writing, or publication decision.
Appendix A
Table A1.
Statistics of efficiency of bias correction of climate models for the historical period of 1970 to 2000 [32].
Table A1.
Statistics of efficiency of bias correction of climate models for the historical period of 1970 to 2000 [32].
| Climate | Model | Prec–NSE | Prec–VE | Temp–NSE |
|---|---|---|---|---|
| RCP 8.5 | 1.CNRMALADIN52v1 | 0.720 | 0.610 | 0.940 |
| 2.ICTPRegCM43v1* | 0.730 | 0.710 | 0.940 | |
| 3.CMCCCLM4819.v1 | 0.910 | 0.790 | 0.930 | |
| 4.CNRMALADIN52.v1 | 0.640 | 0.570 | 0.930 | |
| 5.ELURegCM43v1 | 0.880 | 0.780 | 0.940 | |
| 7.ICTPRegCM43.v7*(HadGEM2) | 0.960 | 0.870 | 0.940 | |
| 8.LMDLMDZ4NEMOMED8.v1 | 0.730 | 0.580 | 0.930 | |
| 9.GUFCCLM4818.v1 | 0.950 | 0.830 | 0.040 | |
| 10.ICTPRegCM4–3.v7* | 0.950 | 0.870 | 0.940 | |
| 12.UNIBELGRADEEBU.v1* | 0.940 | 0.850 | 0.940 | |
| 13.UNIBELGRADEEBUPOM2c.v1* | 0.970 | 0.900 | 0.940 | |
| RCP 4.5 | 1.CNRMALADIN52v1 | 0.750 | 0.640 | 0.940 |
| 3.CMCCCLM4819.v1 | 0.910 | 0.790 | 0.940 | |
| 4.CNRMALADIN52.v1 | 0.640 | 0.570 | 0.930 | |
| 5.ELURegCM43v1 | 0.880 | 0.780 | 0.940 | |
| 6.ICTPRegCM43.v4* | 0.900 | 0.810 | 0.940 | |
| 8.LMDLMDZ4NEMOMED8.v1 | 0.730 | 0.580 | 0.930 | |
| 9.GUFCCLM4-8-18.v1 | 0.950 | 0.830 | 0.740 | |
| 11.ENEAPROTHEUS.v2* | 0.920 | 0.820 | 0.780 |
* Available only for one RCP.
References
- Nemer, Z.; Khaldaoui, F.; Benaissa, Z.; Belaroui, A.; Tebbouche, M.Y.; Ydri, A. Hydrogeophysical investigation of aquifer parameters and seawater intrusion: A case study from Eastern Mitidja plain, Algeria. Geomech. Geophys. Geo-Energy Geo-Resour. 2023, 9, 60. [Google Scholar] [CrossRef]
- EL Hamidi, M.J.; Larabi, A.; Faouzi, M. Numerical Modeling of Saltwater Intrusion in the Rmel-Oulad Ogbane Coastal Aquifer (Larache, Morocco) in the Climate Change and Sea-Level Rise Context (2040). Water 2021, 13, 2167. [Google Scholar] [CrossRef]
- Zhao, J.; Lin, J.; Wu, J.; Wu, J. Impact of climate change on multi-objective management of seawater intrusion in coastal karst aquifers in Zhoushuizi district of Dalian City, China. Hydrogeol. J. 2021, 29, 2329–2346. [Google Scholar] [CrossRef]
- IPCC. Climate Change 2014—Impacts, Adaptation and Vulnerability: Part B: Regional Aspects: Working Group II Contribution to the IPCC Fifth Assessment Report: Volume 2: Regional Aspects; Cambridge University Press: Cambridge, UK, 2014; pp. 1787–1820. ISBN 9781107683860. Available online: https://www.ipcc.ch/report/ar5/wg2/ (accessed on 28 January 2024).
- Bear, J.J.; Cheng, H.D.A. Seawater Intrusion. In Theory and Applications of Transport in Porous Media; Bear, J., Cheng, A.H.D., Eds.; Springer: Dordrecht, The Netherlands, 2010; pp. 593–636. [Google Scholar] [CrossRef]
- Wang, X.; Geng, X.; Sadat-Noori, M.; Zhang, Y. Groundwater-Seawater Exchange and Environmental Impacts. Front. Water 2022, 4, 928615. [Google Scholar] [CrossRef]
- Hussain, M.S.; Abd-Elhamid, H.F.; Javadi, A.A.; Sherif, M.M. Management of Seawater Intrusion in Coastal Aquifers: A Review. Water 2019, 11, 2467. [Google Scholar] [CrossRef]
- Cao, T.; Han, D.; Song, X. Past, present, and future of global seawater intrusion research: A bibliometric analysis. J. Hydrol. 2021, 603, 126844. [Google Scholar] [CrossRef]
- Werner, A.D.; Bakker, M.; Post, V.E.A.; Vandenbohede, A.; Lu, C.; Ataie-Ashtiani, B.; Simmons, C.T.; Barry, D.A. Seawater intrusion processes, investigation and management: Recent advances and future challenges. Adv. Water Resour. 2013, 51, 3–26. [Google Scholar] [CrossRef]
- Lepuri, S.; Loukas, A.; Lyra, A. Seawater Intrusion Vulnerability Assessment Using the GALDIT and the Modified GALDIT–AHP Methods: Application in the Coastal Almyros Aquifer, Thessaly, Greece. Environ. Sci. Proc. 2023, 25, 15. [Google Scholar] [CrossRef]
- Mastrocicco, M.; Colombani, N. The Issue of Groundwater Salinization in Coastal Areas of the Mediterranean Region: A Review. Water 2021, 13, 90. [Google Scholar] [CrossRef]
- EU. Report from the Commission: In Accordance with Article 3.7 of the Groundwater Directive 2006/118/EC on the Establishment of Groundwater Threshold Values; European Commission: Brussels, Belgium, 2010. [Google Scholar]
- EU. Directive (EU) 2020/2184 of the European Parliament and of the Council of 16 December 2020 on the quality of water intended for human consumption (recast) (Text with EEA relevance). In Revised EU Drinking Water Directive (EU) 2020/2184; Official Journal of the European Union: Luxembourg, 2020; Available online: https://eur-lex.europa.eu/eli/dir/2020/2184/oj (accessed on 28 January 2024).
- WHO. Guidelines for Drinking-Water Quality: First Addendum to the Fourth Edition; World Health Organization: Geneva, Switzerland, 2017. [Google Scholar]
- EU. Directive 2000/60/EC of the European Parliament and of the Council establishing a framework for Community action in the field of water policy—European Environment Agency. Off. J. Eur. Union 2000, L327, 1–73. [Google Scholar]
- EC. Groundwater Directive (GWD) 2006/118/EC. Directive 2006/118/EC of the European Parliament and of the Council of 12 December 2006 on the Protection of Groundwater against Pollution and Deterioration. Off. J. Eur. Union 2006, L372, 19–31. Available online: http://eur-lex.europa.eu/LexUriServ/LexUriServ.do?uri=OJ:L:2006:372:0019:0031:EN:PDF (accessed on 28 January 2024).
- Yang, H.; Sun, H.; Liu, T.; Yang, X.; Yang, F.; Jiao, J. Characterization of seawater intrusion based on machine learning and implications for offshore management under shared socioeconomic paths. J. Hydrol. 2023, 623, 129862. [Google Scholar] [CrossRef]
- Halder, S. Development and Management of Coastal Aquifer System Through Seawater Intrusion Modelling. In Groundwater Development and Management: Issues and Challenges in South Asia; Sikdar, P.K., Ed.; Springer International Publishing: Cham, Switzerland, 2019; pp. 209–225. [Google Scholar] [CrossRef]
- Abd-Elaty, I.; Zeleňáková, M.; Krajníková, K.; Abd-Elhamid, H.F. Analytical Solution of Saltwater Intrusion in Costal Aquifers Considering Climate Changes and Different Boundary Conditions. Water 2021, 13, 995. [Google Scholar] [CrossRef]
- Akbarpour, S.; Niksokhan, M.H. Investigating effects of climate change, urbanization, and sea level changes on groundwater resources in a coastal aquifer: An integrated assessment. Environ. Monit. Assess. 2018, 190, 579. [Google Scholar] [CrossRef] [PubMed]
- Chun, J.A.; Lim, C.; Kim, D.; Kim, J.S. Assessing Impacts of Climate Change and Sea-Level Rise on Seawater Intrusion in a Coastal Aquifer. Water 2018, 10, 357. [Google Scholar] [CrossRef]
- Menten, G.; Melo, W.; Pinho, J.; Iglesias, I.; Antunes do Carmo, J. Simulation of Saltwater Intrusion in the Minho River Estuary under Sea Level Rise Scenarios. Water 2023, 15, 2313. [Google Scholar] [CrossRef]
- Adams, K.H.; Hamlington, B.; David, C.; Reager, J.; Sawyer, A.; Buzzanga, B.; Fredericks, J. Estimating Saltwater Intrusion Using Remote-Sensing Datasets and Analytical Approaches. Copernicus Meetings. 2023. Available online: https://meetingorganizer.copernicus.org/EGU23/EGU23-3641.html?pdf (accessed on 1 February 2024).
- Mini, P.; Singh, D.; Sarangi, A. Predictive Simulation of Seawater Intrusion Control Measures in a Coastal Aquifer. J. Sustain. Dev. Energy Water Environ. Syst. 2022, 10, 1090399. [Google Scholar] [CrossRef]
- Abd-Elhamid, H.F.; Abdel-Aal, G.M.; Fahmy, M.; Sherif, M.; Zeleňáková, M.; Abd-Elaty, I. Experimental and Numerical Study to Investigate the Impact of Changing the Boundary Water Levels on Saltwater Intrusion in Coastal Aquifers. Water 2022, 14, 631. [Google Scholar] [CrossRef]
- Cherubini, C.; Sathish, S.; Pastore, N. Dynamics of Coastal Aquifers: Conceptualization and Steady-State Calibration of Multilayer Aquifer System-Southern Coast of Emilia Romagna. Water 2023, 15, 2384. [Google Scholar] [CrossRef]
- Paldor, A.; Frederiks, R.S.; Michael, H.A. Dynamic Steady State in Coastal Aquifers Is Driven by Multi-Scale Cyclical Processes, Controlled by Aquifer Storativity. Geophys. Res. Lett. 2022, 49, e2022GL098599. [Google Scholar] [CrossRef]
- Abdoulhalik, A.; Ahmed, A.A.; Abdelgawad, A.M.; Hamill, G.A. Towards a Correlation between Long-Term Seawater Intrusion Response and Water Level Fluctuations. Water 2021, 13, 719. [Google Scholar] [CrossRef]
- Elshall, A.S.; Arik, A.D.; El-Kadi, A.I.; Pierce, S.; Ye, M.; Burnett, K.M.; Wada, C.A.; Bremer, L.L.; Chun, G. Groundwater sustainability: A review of the interactions between science and policy. Environ. Res. Lett. 2020, 15, 093004. [Google Scholar] [CrossRef]
- Felisa, G.; Panini, G.; Pedrazzoli, P.; Di Federico, V. Combined Management of Groundwater Resources and Water Supply Systems at Basin Scale Under Climate Change. Water Resour. Manag. 2022, 36, 915–930. [Google Scholar] [CrossRef]
- NCESD. Greece, State of the Environment Report, Summary; National Center of Environment and Sustainable Development: Athens, Greece, 2018; pp. 70–71. ISBN 978-960-99033-3-2. [Google Scholar]
- MEECC. River Basin Management Plans; Hellenic Democracy, Government Gazette: Thessaly, Greece, 2014. [Google Scholar]
- Metzger, M.J.; Bunce, R.G.H.; Jongman, R.H.G.; Sayre, R.; Trabucco, A.; Zomer, R. A high-resolution bioclimate map of the world: A unifying framework for global biodiversity research and monitoring. Glob. Ecol. Biogeogr. 2013, 22, 630–638. [Google Scholar] [CrossRef]
- Sayre, R.; Dangermond, J.; Frye, C.; Vaughan, R.; Aniello, P.; Breyer, S.P.; Cribbs, D.; Hopkins, D.; Nauman, R.; Derrenbacher, W.; et al. A New Map of Global Ecological Land Units—An Ecophysiographic Stratification Approach; Association of American Geographers, U. S. Geological Survey, GEO BON: Washington, DC, USA, 2014. Available online: https://pubs.usgs.gov/publication/70187380 (accessed on 28 January 2024).
- Lyra, A.; Loukas, A.; Sidiropoulos, P.; Tziatzios, G.; Mylopoulos, N. An Integrated Modeling System for the Evaluation of Water Resources in Coastal Agricultural Watersheds: Application in Almyros Basin, Thessaly, Greece. Water 2021, 13, 268. [Google Scholar] [CrossRef]
- Lyra, A.; Loukas, A.; Sidiropoulos, P.; Vasiliades, L. Climate Change Impacts on Nitrate Leaching and Groundwater Nitrate Dynamics Using a Holistic Approach and Med-CORDEX Climatic Models. Water 2024, 16, 465. [Google Scholar] [CrossRef]
- Lyra, A.; Loukas, A. Simulation and Evaluation of Water Resources Management Scenarios Under Climate Change for Adaptive Management of Coastal Agricultural Watersheds. Water Resour. Manag. 2022, 37, 2625–2642. [Google Scholar] [CrossRef]
- Lyra, A. Simulation and Management of Degraded Water Resources of Coastal Watersheds. Ph.D. Thesis, University of Thessaly, School of Engineering, Department of Civil Engineering, Thessaly, Greece, 2023. [Google Scholar] [CrossRef]
- Loukas, A.; Mylopoulos, N.; Vasiliades, L. A Modeling System for the Evaluation of Water Resources Management Strategies in Thessaly, Greece. Water Resour. Manag. 2007, 21, 1673–1702. [Google Scholar] [CrossRef]
- Harbaugh, A.W.; Banta, E.R.; Hill, M.C.; McDonald, M. Modflow-2000, The U. S. Geological Survey Modular Ground-Water Model-User Guide To Modularization Concepts and the Ground-Water Flow Process; USGS: Reston, VA, USA, 2000; p. 134.
- Guo, W.; Langevin, C.D. User’s Guide to SEAWAT; A Computer Program for Simulation of Three-Dimensional Variable-Density Ground-Water Flow; 06-A7; USGS: Reston, VA, USA, 2002. [CrossRef]
- US Soil Conservation Service. National Engineering Handbook, Section 4, Hydrology; US Soil Conservation Service: Washington, DC, USA, 1972.
- ESDAC. European Soil Data Centre, Joint Research Centre, European Commission. Available online: https://esdac.jrc.ec.europa.eu (accessed on 21 January 2021).
- Dastane, N. Effective Rainfall, FAO Irrigation and Drainage Paper No. 25; Food and Agriculture Organization of the United Nations: Rome, Italy, 1974. [Google Scholar]
- MEE-GSNEW. Ministry of Environment and Energy, Secretariat of Natural Environment and Water. Available online: http://lmt.ypeka.gr/public_view.html (accessed on 28 January 2024).
- Orlić, M.; Pasarić, M.; Pasarić, Z. Mediterranean Sea-Level Variability in the Second Half of the Twentieth Century: A Bayesian Approach to Closing the Budget. Pure Appl. Geophys. 2018, 175, 3973–3988. [Google Scholar] [CrossRef]
- Tsimplis, M.N.; Marcos, M.; Somot, S. 21st century Mediterranean sea level rise: Steric and atmospheric pressure contributions from a regional model. Glob. Planet Chang. 2008, 63, 105–111. [Google Scholar] [CrossRef]
- E.U. Copernicus-Marine-Service-Information. Sea Level Daily Gridded Data from Satellite Observations for the Mediterranean Sea from 1993 to 2020. Copernicus Climate Change Service (C3S). Available online: https://data.marine.copernicus.eu/product/SEALEVEL_EUR_PHY_L4_MY_008_068/description (accessed on 28 January 2024).
- EEA; CLS. Trend in Absolute Sea Level in European Seas Based on Satellite Measurements (1992–2013). In Ocean Monitoring and Forecasting (MyOcean). 2017. Available online: https://www.eea.europa.eu/data-and-maps/figures/sea-level-changes-in-europe-october-1992-may-1 (accessed on 28 January 2024).
- EEA; ICDC. RCP4.5 Total Sea Level Rise Projections. 2017. Available online: https://www.eea.europa.eu/data-and-maps/figures/projected-change-in-sea-level (accessed on 28 January 2024).
- EEA. Projected Change in Relative Sea Level, 2081–2100. 2019. Available online: https://www.eea.europa.eu/data-and-maps/figures/projected-change-in-relative-sea-level (accessed on 28 January 2024).
- Weisstein, E. Ternary Diagram. 2014. Available online: https://mathworld.wolfram.com (accessed on 28 January 2024).


Disclaimer/Publisher’s Note: The statements, opinions and data contained in all publications are solely those of the individual author(s) and contributor(s) and not of MDPI and/or the editor(s). MDPI and/or the editor(s) disclaim responsibility for any injury to people or property resulting from any ideas, methods, instructions or products referred to in the content. |
© 2024 by the authors. Licensee MDPI, Basel, Switzerland. This article is an open access article distributed under the terms and conditions of the Creative Commons Attribution (CC BY) license (https://creativecommons.org/licenses/by/4.0/).