Abstract
The sagebrush steppe ecosystem plays a critical role in water cycling in arid and semiarid landscapes of the western United States; yet, there is limited information regarding individual sagebrush plant water uptake. We used the stem heat balance (SHB) method to measure transpiration in mountain big sagebrush (Artemisia tridentata subsp. vaseyana) plants in a semiarid rangeland ecosystem in central Oregon, Pacific Northwest Region, USA. We evaluated the relationship between sagebrush transpiration and environmental factors from July 2022 to May 2023 for two individual plants representative of the average sagebrush stand height and crown width at the study site; transpiration rates varied by plant and by season. This study encompassed one below-average (2022; 278 mm) and one above-average (2023; 414 mm) precipitation years. Study results showed that the average water use during the entire period of study was 2.1 L d−1 for Plant 1 and 5.0 L d−1 for Plant 2. During the dry year, maximum transpiration was observed during the summer (Plant 1 = 4.8 L d−1; Plant 2 = 11.1 L d−1). For the wet year, both plants showed maximum transpiration levels at the end of the recording period in mid-May (Plant 1 = 9.6 L d−1; Plant 2 = 8.6 L d−1). The highest seasonal transpiration of both plants occurred in summer (2.87 L d−1), whereas the lowest transpiration was obtained in winter (0.21 L d−1). For all seasons but winter, soil moisture (SM), soil temperature (ST), and vapor pressure deficit (VPD) variables generally showed positive correlations with transpiration. Transpiration rates decreased in the summer of 2022 as the surface soil gradually dried. The two plants’ most significant water uptake differences were obtained during the dry year. It is possible that the larger stem diameter of plant 2 may have contributed to its higher transpiration rates during times of limited water availability. The study results add to the understanding of water use by sagebrush and its potential impact on the water balance of cool-climate rangeland ecosystems. The findings also highlight the sensitivity of sagebrush to variations in seasonal soil moisture availability, soil temperature, and vapor pressure deficit. Future research should involve studying the combined effects of water use by various dominant vegetation species and its effects on the water budget at the watershed scale.
1. Introduction
The sagebrush steppe ecosystem covers approximately 43 million ha in the arid and semiarid western United States [1]. It provides essential ecosystem services, including wildlife habitat, forage provisioning for wildlife and livestock [2,3,4], water provisioning [5,6], carbon sequestration [7,8], and a favorable environment for a diverse set of herbaceous plant species [9]. Sagebrush plants are known for their ability to survive in water-limited conditions by physiological adaptation [10]. Sagebrush carries out hydraulic redistribution, the movement of water upwards [11,12], upwards and downwards [10], and in both directions as well as laterally [13] through its roots. Redistributing water from deeper soil layers to shallower ones increases water availability for the sagebrush and may also positively affect nearby plants [14].
The sagebrush steppe is among the most threatened landscapes in North America [15]. The loss of sagebrush ecosystems is a significant concern, posing existential threats to biodiversity and land management in the western United States [16]. Over the past century, large areas of sagebrush have been removed, modified, or fragmented [16,17] due to multiple factors, including conversion of these native ecosystems to agriculture [18], energy extraction activities [19], and expansion of woody vegetation species [20]. Various studies have shown that reducing woody vegetation stands such as juniper (various species) can positively influence the recovery of impaired sagebrush-dominated landscapes. Studies conducted in rangeland ecosystems in Oregon, USA, show that juniper stand reduction significantly increased grass and sagebrush cover [21,22]. Compared to untreated sites, higher surface and subsurface water levels were obtained in landscapes where sagebrush became the dominant overstory species after juniper removal [23].
Water is a critical resource for plant growth in arid and semiarid environments [24]. Various environmental factors influence the amount of water available for plants to use. Vapor pressure deficit (VPD), indicative of atmospheric water demand, has been identified as a significant driver of vegetation water use in semiarid sagebrush ecosystems [25,26]. Other factors, such as antecedent soil moisture and precipitation timing and intensity, can affect the capacity of the system to capture and redistribute water throughout the landscape [23].
Due to the typical dry environment where sagebrush plants grow, evapotranspiration losses can be substantially high, accounting for most or all of the moisture available. A study conducted by Missik et al. [27], conducted on an upland sagebrush ecosystem in central Washington, USA, showed that total annual evapotranspiration (250 mm) exceeded precipitation (224 mm). Durfee and Ochoa [6] estimated evapotranspiration to range between 210 and 260 mm yr−1 (mean of 242 mm yr−1), accounting for the most significant portion (83%) of the annual water budget in a sagebrush-dominated watershed in central Oregon, USA. However, these studies did not account for the portioning of plant water use (transpiration) and direct evaporation losses.
Different sagebrush subspecies can exhibit substantial differences in water uptake. A study by Sharma et al. [5] showed that Artemisia tridentata subsp. vaseyana transpired nearly four times more water than Artemisia tridentata subsp. wyomingensis. Mountain big sagebrush (Artemisia tridentata subsp. vaseyana) is the most widespread sagebrush subspecies in Oregon and the surrounding region [28], and it is the subspecies present at our study site.
Despite the importance of sagebrush plant communities in regulating water cycling and consequently on the ecological function of water-limited regions, the body of literature on water use by sagebrush plants is limited. Moreover, studies considering the interactions between the environment and individual sagebrush plant water uptake throughout the year are practically non-existent. This study evaluated the seasonal dynamics of sagebrush plant transpiration and various environmental factors of interest in a cool-climate rangeland ecosystem in central Oregon, USA. The study objectives were to (1) determine the amount of water uptake by mountain big sagebrush and (2) assess the relationship among mountain big sagebrush transpiration, soil moisture, soil temperature, and vapor pressure deficit.
2. Materials and Methods
2.1. Study Site
This study was conducted at the Camp Creek Paired Watershed Study (CCPWS) site (43.96° lat.; −120.34° W long.) established in 1994 to evaluate vegetation and hydrology changes following the cutting of western juniper [23]. The CCPWS is located in the semiarid rangelands of central Oregon, USA, and comprises an area of approximately 500 ha, including a 116 ha watershed where mountain big sagebrush is now the dominant overstory vegetation following the removal of approximately 90% of juniper trees in 2005 (Figure 1). Herbaceous vegetation is dominated by Idaho fescue (Festuca idahoensis), bluebunch wheatgrass (Pseudoroegneria spicata), and Sandberg bluegrass (Poa secunda). Based on data collected in 2014 [22] from 143 ten-meter transects (n = 1430) distributed throughout the treated watershed, sagebrush canopy covered 9.9% of the total area. Sagebrush cover was much lower (3.4%; n = 1450) in the adjacent 96 ha, juniper-dominated watershed used as the control. The elevation at CCPWS ranges from 1370 m to 1524 m. The mean annual precipitation based on onsite data collected from 2005 to 2023 is 312 mm. Most precipitation in the study site occurs as a mix of rain and snow during fall and winter, with few rainfall events in spring and summer.

Figure 1.
The location of the study site in Crook County, central Oregon, is indicated in the outline map (not to scale) of the state of Oregon, USA. Images taken in 2023 show the distribution of sagebrush throughout the study site. In (a), sagebrush now occupies the landscape where juniper trees were removed in 2005. The study site’s monitoring station for soil moisture, temperature, precipitation, and plant transpiration variables is shown in (b). The presence of sagebrush plants next to the stream near the monitoring station is illustrated in (c). The depth of the root zone for a 1.2 m tall sagebrush plant at the study site is shown in (d).
Seasonal streamflow and augmented springflow levels in response to snowmelt runoff are observed in the spring season in years where enough snowpack accumulation (>15 cm) allows for soil saturation and percolation past the root zone that ends in lateral flow into the streams (Figure 1). Following the snowmelt runoff season, the stream network is considered ephemeral for the rest of the year, responding to infrequent convective storms occurring primarily in the summer. Soil texture determined from samples collected during soil moisture sensor installation was classified as sandy loam for all sampling depths [29]. Previous work by Abdallah et al. [8] shows that topsoil (0.25 m) soil carbon content at the study site is about 2%.
2.2. Sap Flow Measurements and Estimation of Transpiration
The stem heat balance (SHB) method was used in collecting sap flow data to determine transpiration values from two sagebrush plants between July 2022 and May 2023. The two plants were selected based on an average representation of mature sagebrush plants found at the study site. The plants are located in a hillslope near the outlet of the watershed and at 23 m distance, 10 m higher, from the nearest stream.
One branch in the two sagebrush plants was equipped with an SHB gauge (models SGB19 and SGB25, Dynamax Inc., Houston, TX, USA) to monitor sap flow. Sap flow measurements were recorded every 15 min using SapIP dataloggers (Dynamax Inc., Houston, TX, USA). These sap flow data were computed to obtain daily transpiration values (L d−1) for each equipped branch.
The ratio of sap flow to branch diameter was calculated. To calculate the transpiration of the whole plant, we used the branch daily estimates and the diameter of all branches coming out of the main stem close to the soil surface. For plant 1, the mean diameter for 18 measured branches was 21 mm, ranging from 10 to 33 mm. For plant 2, the mean diameter for 15 measured branches was 28 mm, ranging from 18 to 41 mm. Other morphological features such as plant height, crown width, and branch length were measured for each equipped plant (Plant 1 and Plant 2). The two equipped plants were harvested at the end of the experiment in the fall of 2023. All leaves were removed, oven-dried at 40 °C for 24 h, and weighed. Leaf area cover was calculated using a 2500 mm2 grid. This process was replicated ten times to get average leaf area and dry weight estimates used to estimate sagebrush leaf biomass (g m−2). The obtained mean leaf biomass value and the total weight of the dried leaves for each branch were used to calculate the leaf area for each equipped branch (Table 1).

Table 1.
Sensor information and characteristics of sagebrush plants.
2.3. Environmental Variables
Environmental data used in this experiment were obtained from onsite instrumentation (Campbell Scientific, Inc., Logan, UT, USA), including a weather station and a soil moisture (SM) and soil temperature (ST) station. The weather station is 77 m to the west and slightly south of the SM and ST station, which is installed next to the monitored sagebrush plants. An additional rain gauge (Model RG3, Onset Computer, Corp., Bourne, MA, USA) was installed next to the SM and ST station. Precipitation (Pr) was obtained from the RG3 rain gauge. Relative humidity (RH), air temperature (AT), and solar radiation (SR) data were obtained from the nearby weather station. The SM and ST data were collected using sensors (Model CS655, Campbell Scientific, Inc., Logan, UT, USA) installed at 0.2, 0.5, and 0.8 m depths. The values of SM and ST across soil depths (0.2, 0.5, and 0.8 m) were used to obtain an average SM and ST (SMtot and STtot) for each monitoring station’s 0 to 0.8 m soil profile. All data were collected hourly and then used to obtain daily average values. We calculated vapor pressure deficit (VPD) based on daily averaged values of AT and RH, as described in Ochoa and Abdallah [26].
2.4. Statistical Analysis
A one-way analysis of variance (ANOVA) was performed to assess SM and ST variability by soil depth. The ANOVA test was also used to compare mean transpiration by sagebrush plant (Plant 1 vs. Plant 2) and by seasonal period (summer, autumn, winter, and spring). A Spearman rank order correlation test was conducted to evaluate the relationships between sagebrush transpiration and the environmental variables. All statistical analyses were performed using SigmaPlot® version 15.0 (Systat Software, Inc., San Jose, CA, USA).
3. Results
3.1. Diurnal Courses of Environmental Variables and Transpiration
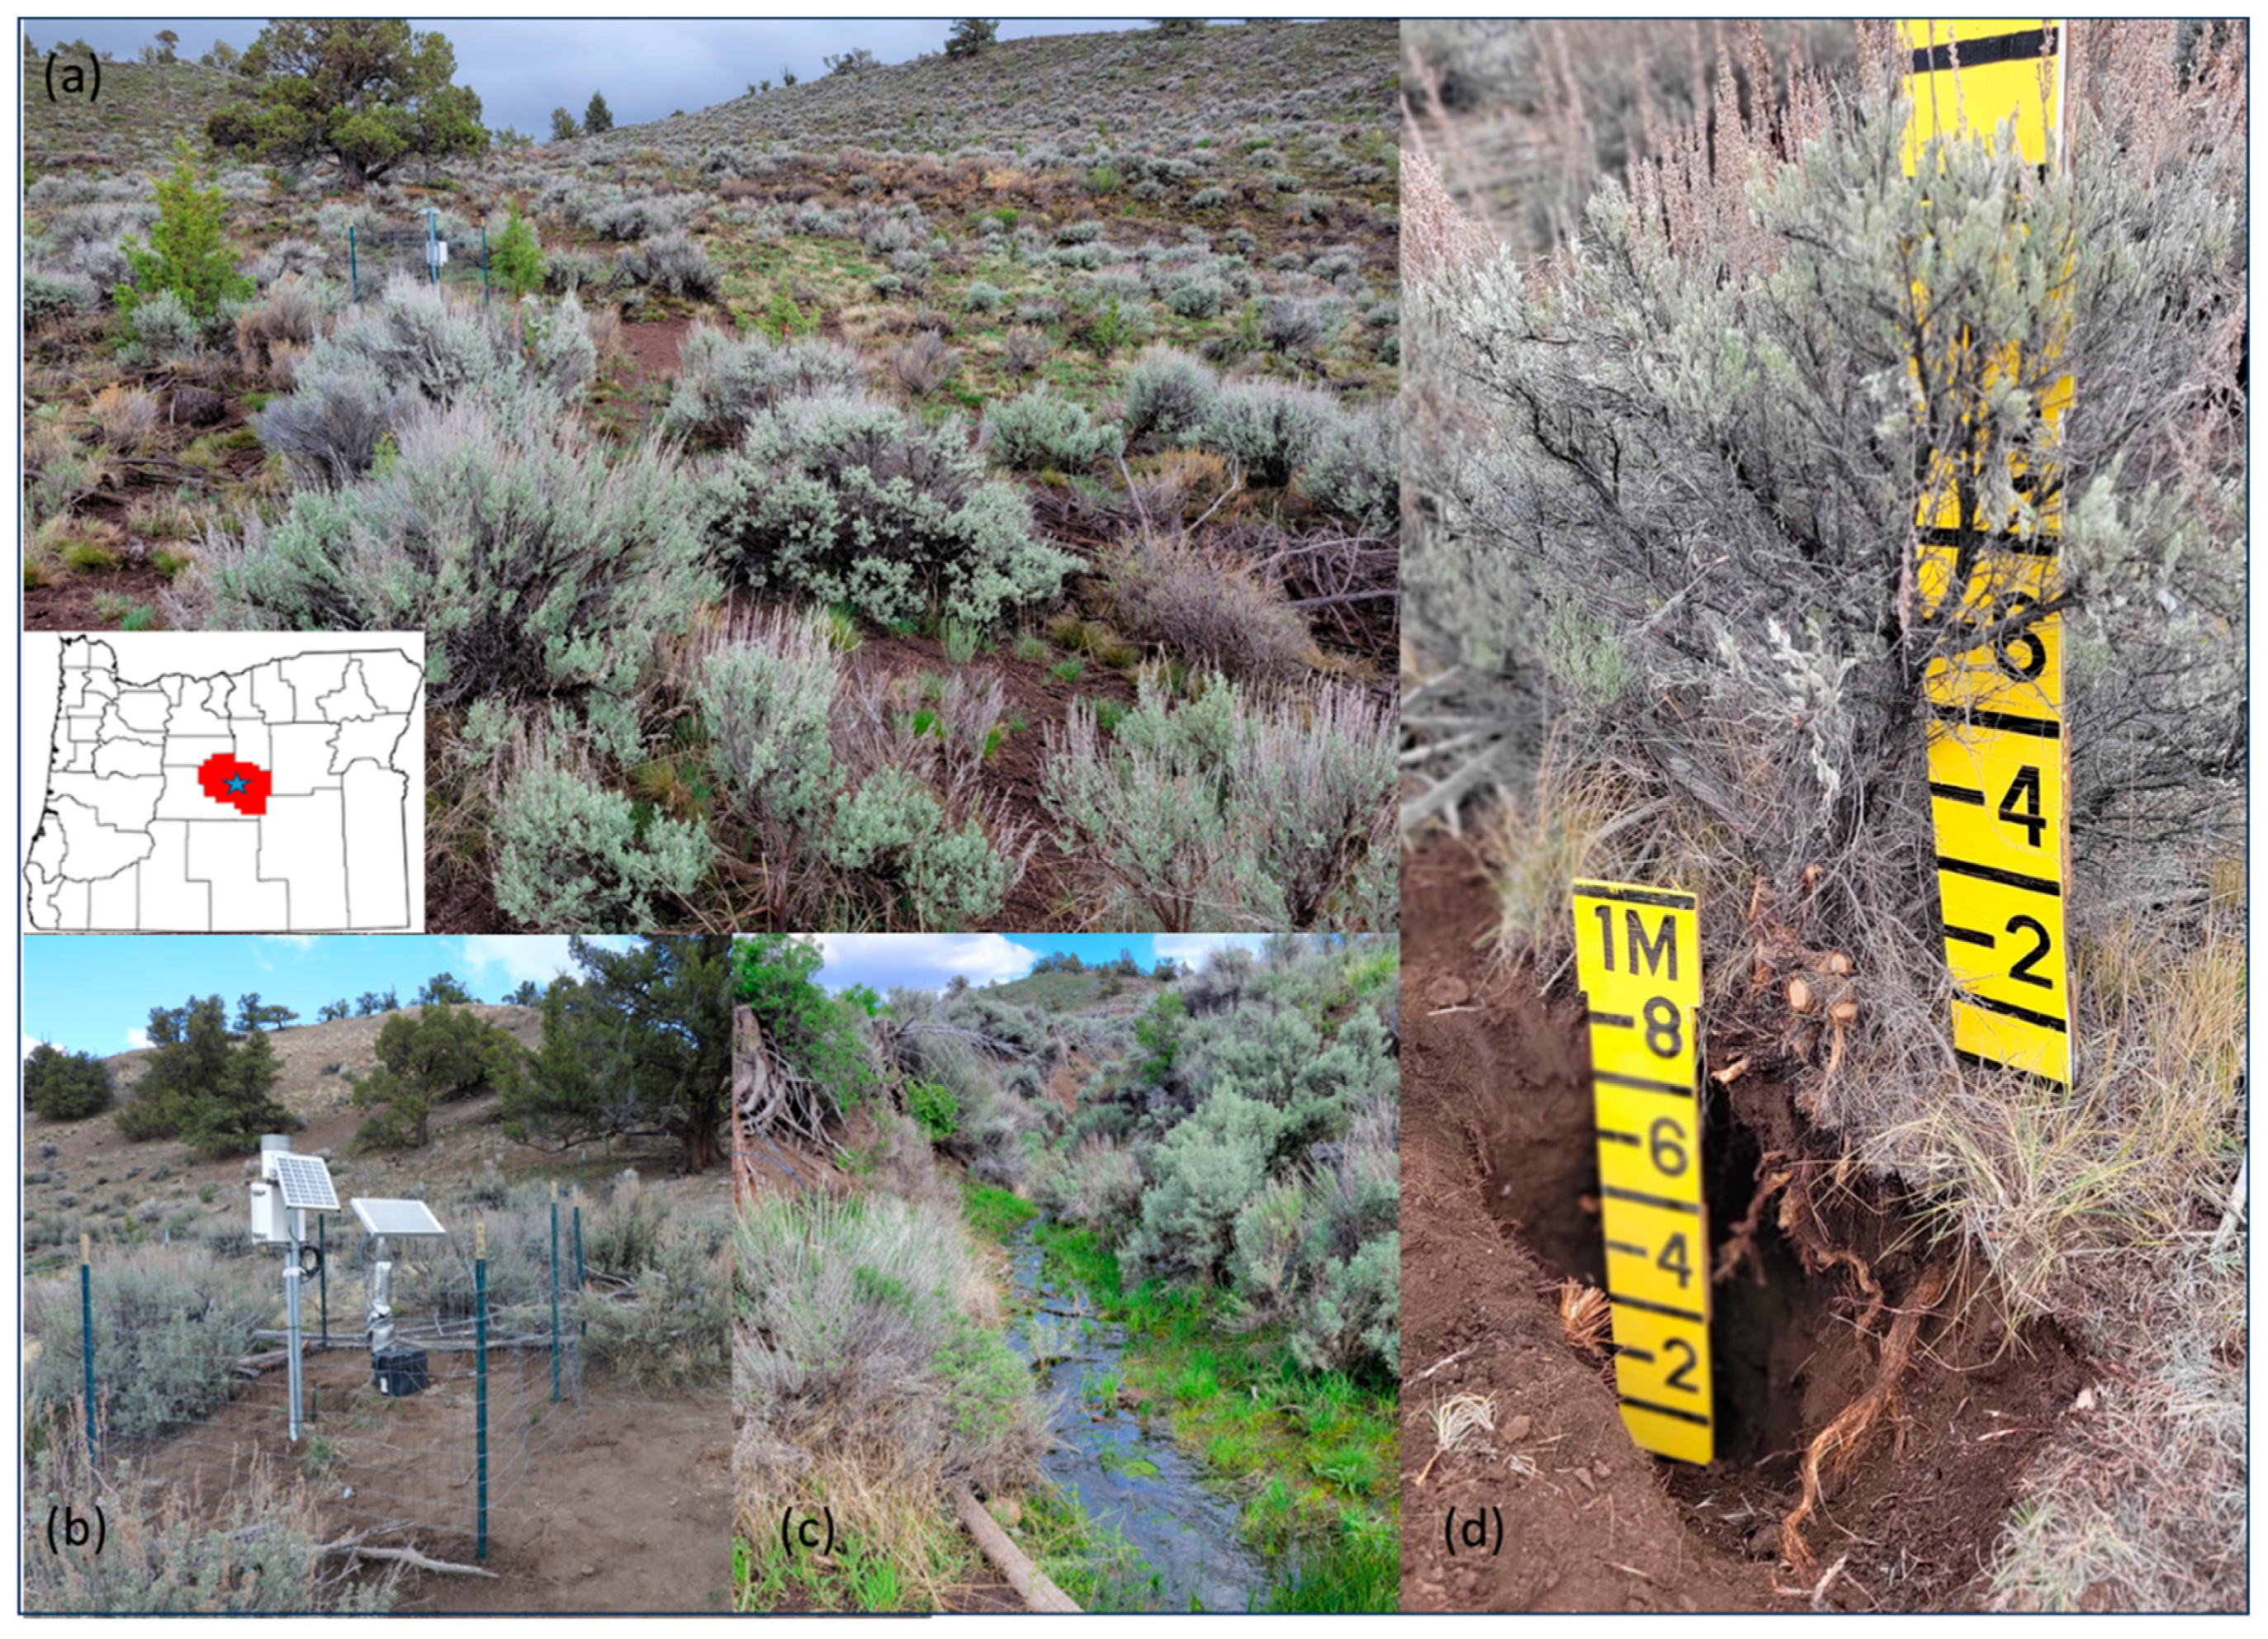
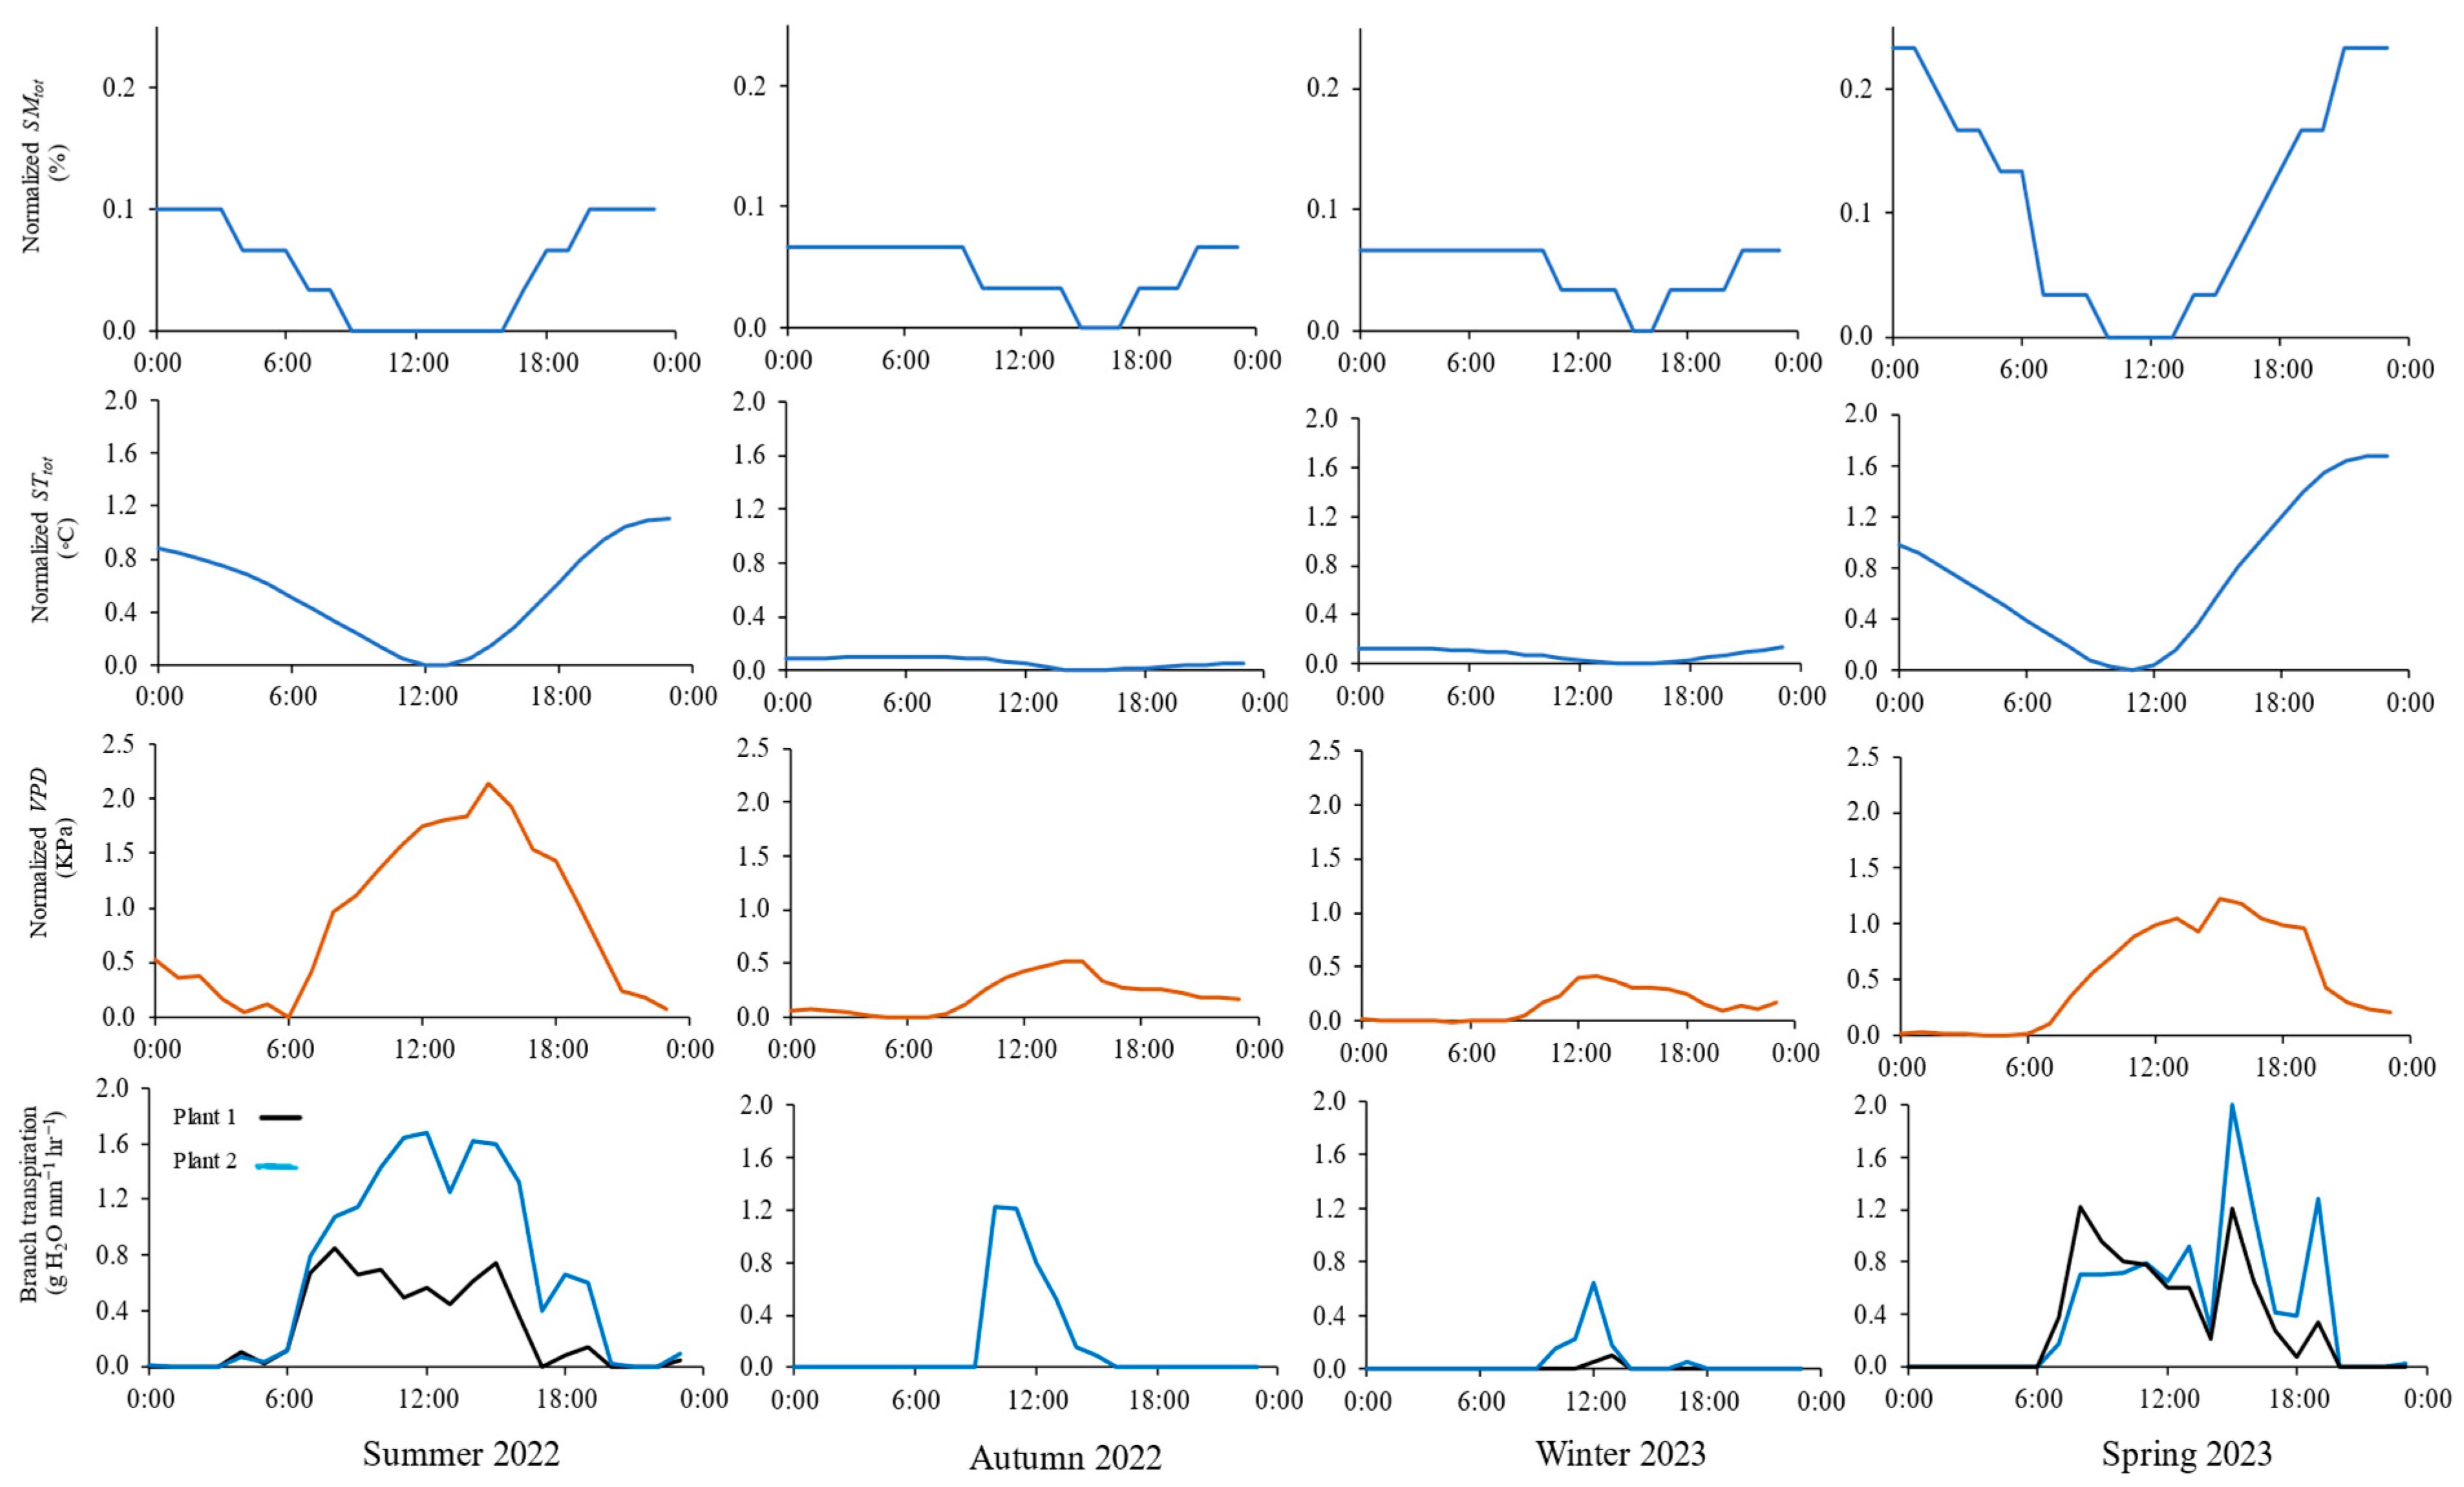
Figure 2 shows the diurnal variation in normalized SMtot, STtot, VPD, and branch-level transpiration on four days (19 August, 24 November, 19 February, and 11 May), representative of environmental conditions in summer 2022, autumn 2022, winter 2023, and spring 2023, respectively. Generally, SMtot and STtot peaked in the morning and tapered off throughout the day. Compared to the average environmental conditions of autumn 2022 and winter 2023, greater diurnal normalized SMtot and STtot variations occurred in summer 2022 and spring 2023, indicating relatively higher transpiration rates in those seasons. The VPD increased rapidly in the early morning (between 6:00 and 8:00), peaked at noon (13:00 for winter 2023 and 15:00 for summer 2022, autumn 2022, and spring 2023), then dropped until midnight. Dynamics of transpiration reflected VPD values, but they were not necessarily synchronized. Transpiration increased rapidly in the early morning, reaching peak values (1.7, 1.2, 0.6, and 2.0 g mm−1 h−1) between 10:00 and 15:00 for summer 2022, autumn 2022, winter 2023, and spring 2023 average environmental conditions, respectively. Then, it declined significantly, reaching minimum values of <0.1 g mm−1 h−1 at night. The relatively lowest transpiration rates recorded for autumn 2022 and winter 2023 were attributed to the low atmospheric evaporative demand represented by lower normalized STtot and VPD.
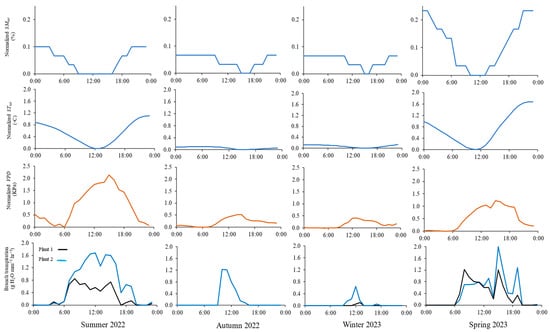
Figure 2.
Diurnal courses of normalized soil moisture and soil temperature averaged over the upper 0.8 m soil profile (SMtot and STtot, respectively), vapor pressure deficit (VPD), and branch-level transpiration (from sap flux) for sagebrush plants for the average environmental condition of summer 2022, autumn 2022, winter 2023, and spring 2023.
3.2. Daily Fluctuation of Sagebrush Transpiration and Environmental Variables
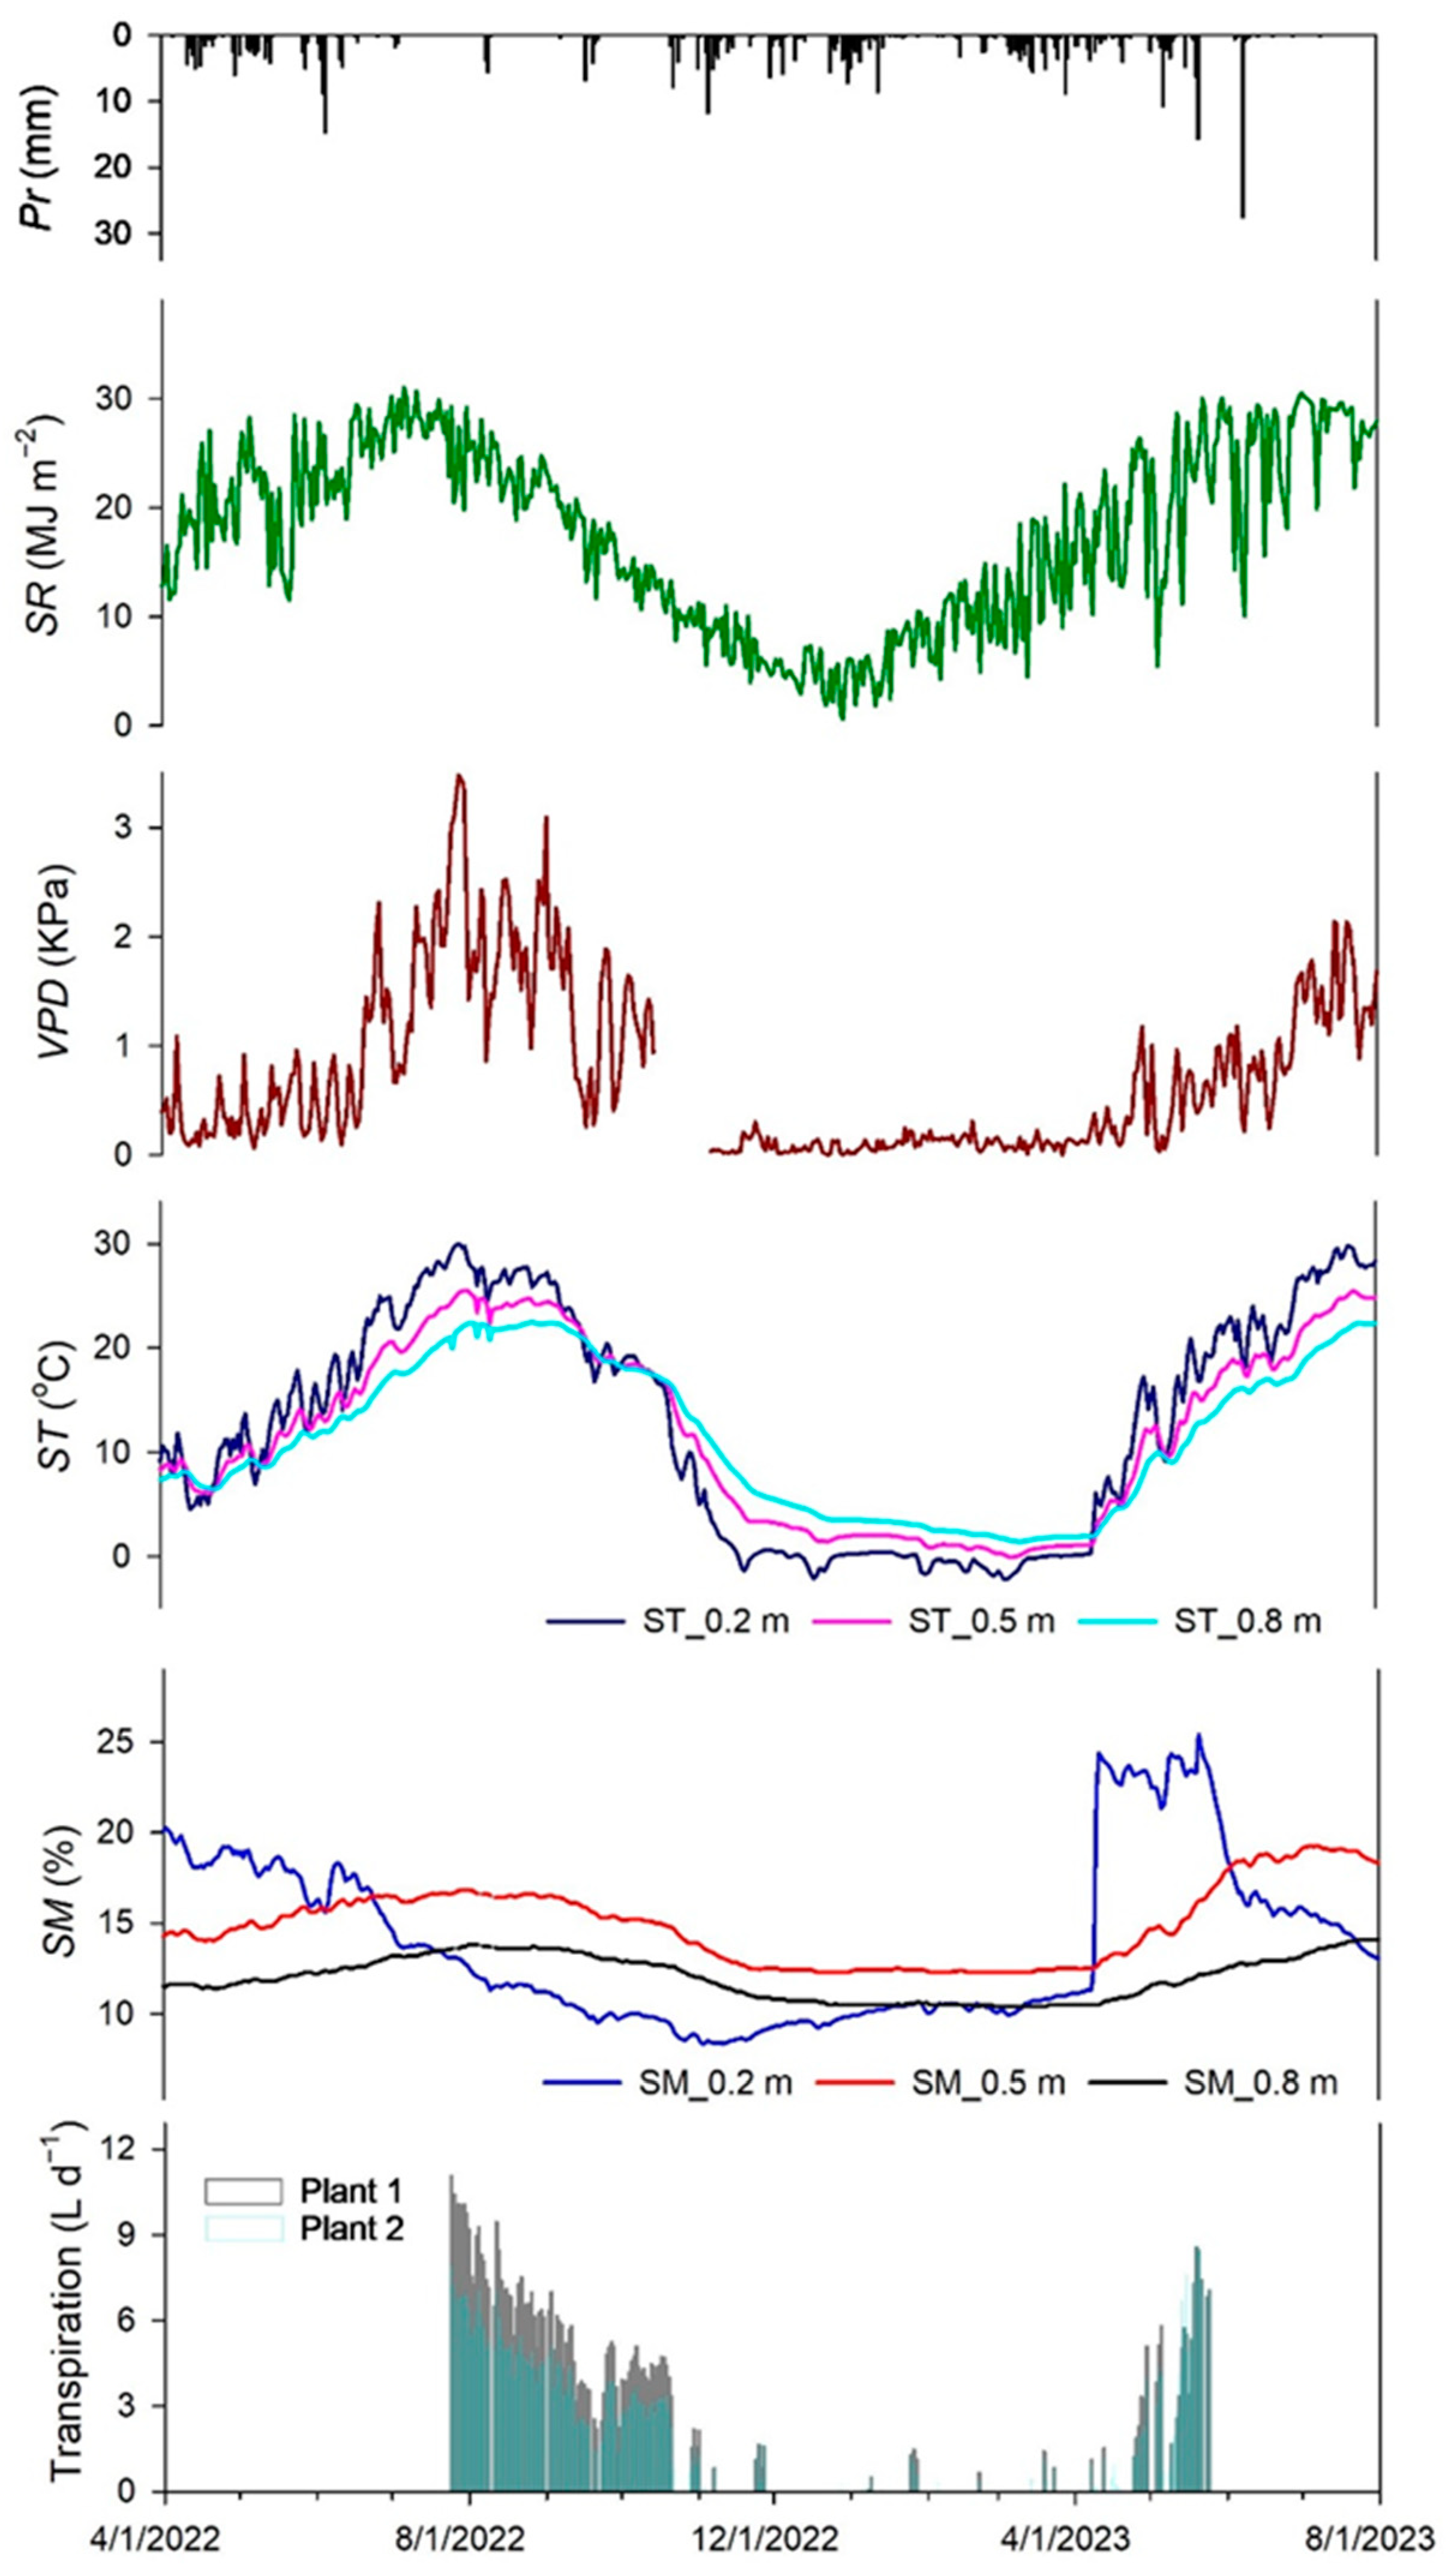
Figure 3 illustrates the daily averaged fluctuations of Pr, SR, VPD, SM, and ST levels between 1 April 2022 and 31 August 2023. Also, it shows the transpiration data collected from 24 July 2022 to 23 May 2023. Total annual precipitation for the two years (2022 and 2023) encompassing this study was highly variable. Below-average precipitation records (278 mm) were obtained in 2022, following five other years of severe drought in the region.

Figure 3.
Daily fluctuation of several environmental variables and sagebrush transpiration rates measured for 2022 and 2023. Environmental variables are precipitation (Pr), solar radiation (SR), vapor pressure deficit (VPD), and soil moisture (SM) and soil temperature (ST) at different soil depths (0.2, 0.5, and 0.8 m).
Conversely, 2023 was an above-average precipitation (414 mm) year characterized by a winter mix of rain and snow that provided early spring moisture.
Overall, mean transpiration values for the evaluation period were higher for plant 2 (5.0 L d−1) than for plant 1 (2.1 L d−1). During the dry year, the maximum transpiration values were obtained at the beginning of this study in July (11.1 L d−1 for plant 2 and 4.8 L d−1 for plant 1). For the wet year, both plants showed maximum transpiration levels at the end of the recording period in mid-May (Plant 1 = 9.6 L d−1; Plant 2 = 8.6 L d−1). A transpiration sensor malfunction prevented data recording through the rest of the summer. Transpiration largely followed the seasonal soil and air moisture availability. The highest transpiration rates corresponded to the highest VPD values observed in the summer of 2022.
Similarly, the higher winter precipitation resulting in increased SM levels in the spring of 2023 corresponded to the higher transpiration levels observed that year. The ANOVA results showed significant SM differences (p < 0.001) among SM sensor depths, with greater SM values at 0.5 m depth (SM0.5) and lower SM values at 0.8 m depth (SM0.8). Transpiration levels began a steady decline through late summer and autumn following the drying of the soil, particularly at SM at 0.2 m depth (SM0.2), indicating the potential time at which SM became a limiting factor for transpiration. The VPD levels peaked in July with an average of 1.92 and 1.51 KPa in 2022 and 2023, respectively.
Throughout this study, SR and ST exhibited a similar trend; both were lower in the cold months and gradually rose to the maximum in the warm months. There were significant ST differences (p ≤ 0.05) by sensor depth during the observation period, with ST at 0.2 m depth (ST0.2), generally showing higher values during the spring and summer, followed by ST at 0.5 m depth (ST0.5) and ST at 0.8 m depth (ST0.8). This condition was the opposite during late fall and winter.
3.3. Seasonal Transpiration and Its Response to Environmental Variables
Table 2 shows seasonal transpiration estimates based on sagebrush sap flow data recorded between 24 July 2022 and 23 May 2023. The highest seasonal mean transpiration values for plants 1 (2.87 L d−1) and 2 (6.71 L d−1) were obtained during the summer of 2022. Transpiration rates for both plants decreased to a mean value of 2.46 L d−1 in autumn 2022, corresponding with the expected reduction in evaporative demand toward the end of the year. A sharp decline in transpiration rates occurred for both shrubs during winter 2023, with a mean value of 0.58 L d−1. In the spring of 2023, plants became more active, and transpiration was significantly higher (p ≤ 0.05) than during the winter and autumn seasons, with an average of 3.25 L d−1. The results from the ANOVA test showed that plant 2 had a higher transpiration rate than plant 1 for all seasonal periods. Across seasonal periods, the highest transpiration values were observed in summer 2022, followed by spring 2023, autumn 2022, and winter 2023.
Table 2.
Mean value ± standard error of transpiration rates of sagebrush, averaged by individual plant and by all plants for summer 2022 (24 July to September 20), autumn 2022 (21 September to 20 December), winter 2023 (21 December to 20 March), and spring 2023 (21 March to 23 May). Different lowercase letters (a, b) along rows indicate significant differences (p ≤ 0.05) in mean transpiration rate by plant for each season. Different uppercase letters (A, B, C, D) along columns indicate mean transpiration differences (p ≤ 0.05) by season for all plants. Numbers in parentheses in plant 1 and plant 2 represent the number of days when sap flow data were collected for each individual plant. Numbers in parentheses for both plants represent the number of averaged days using data from at least one plant.
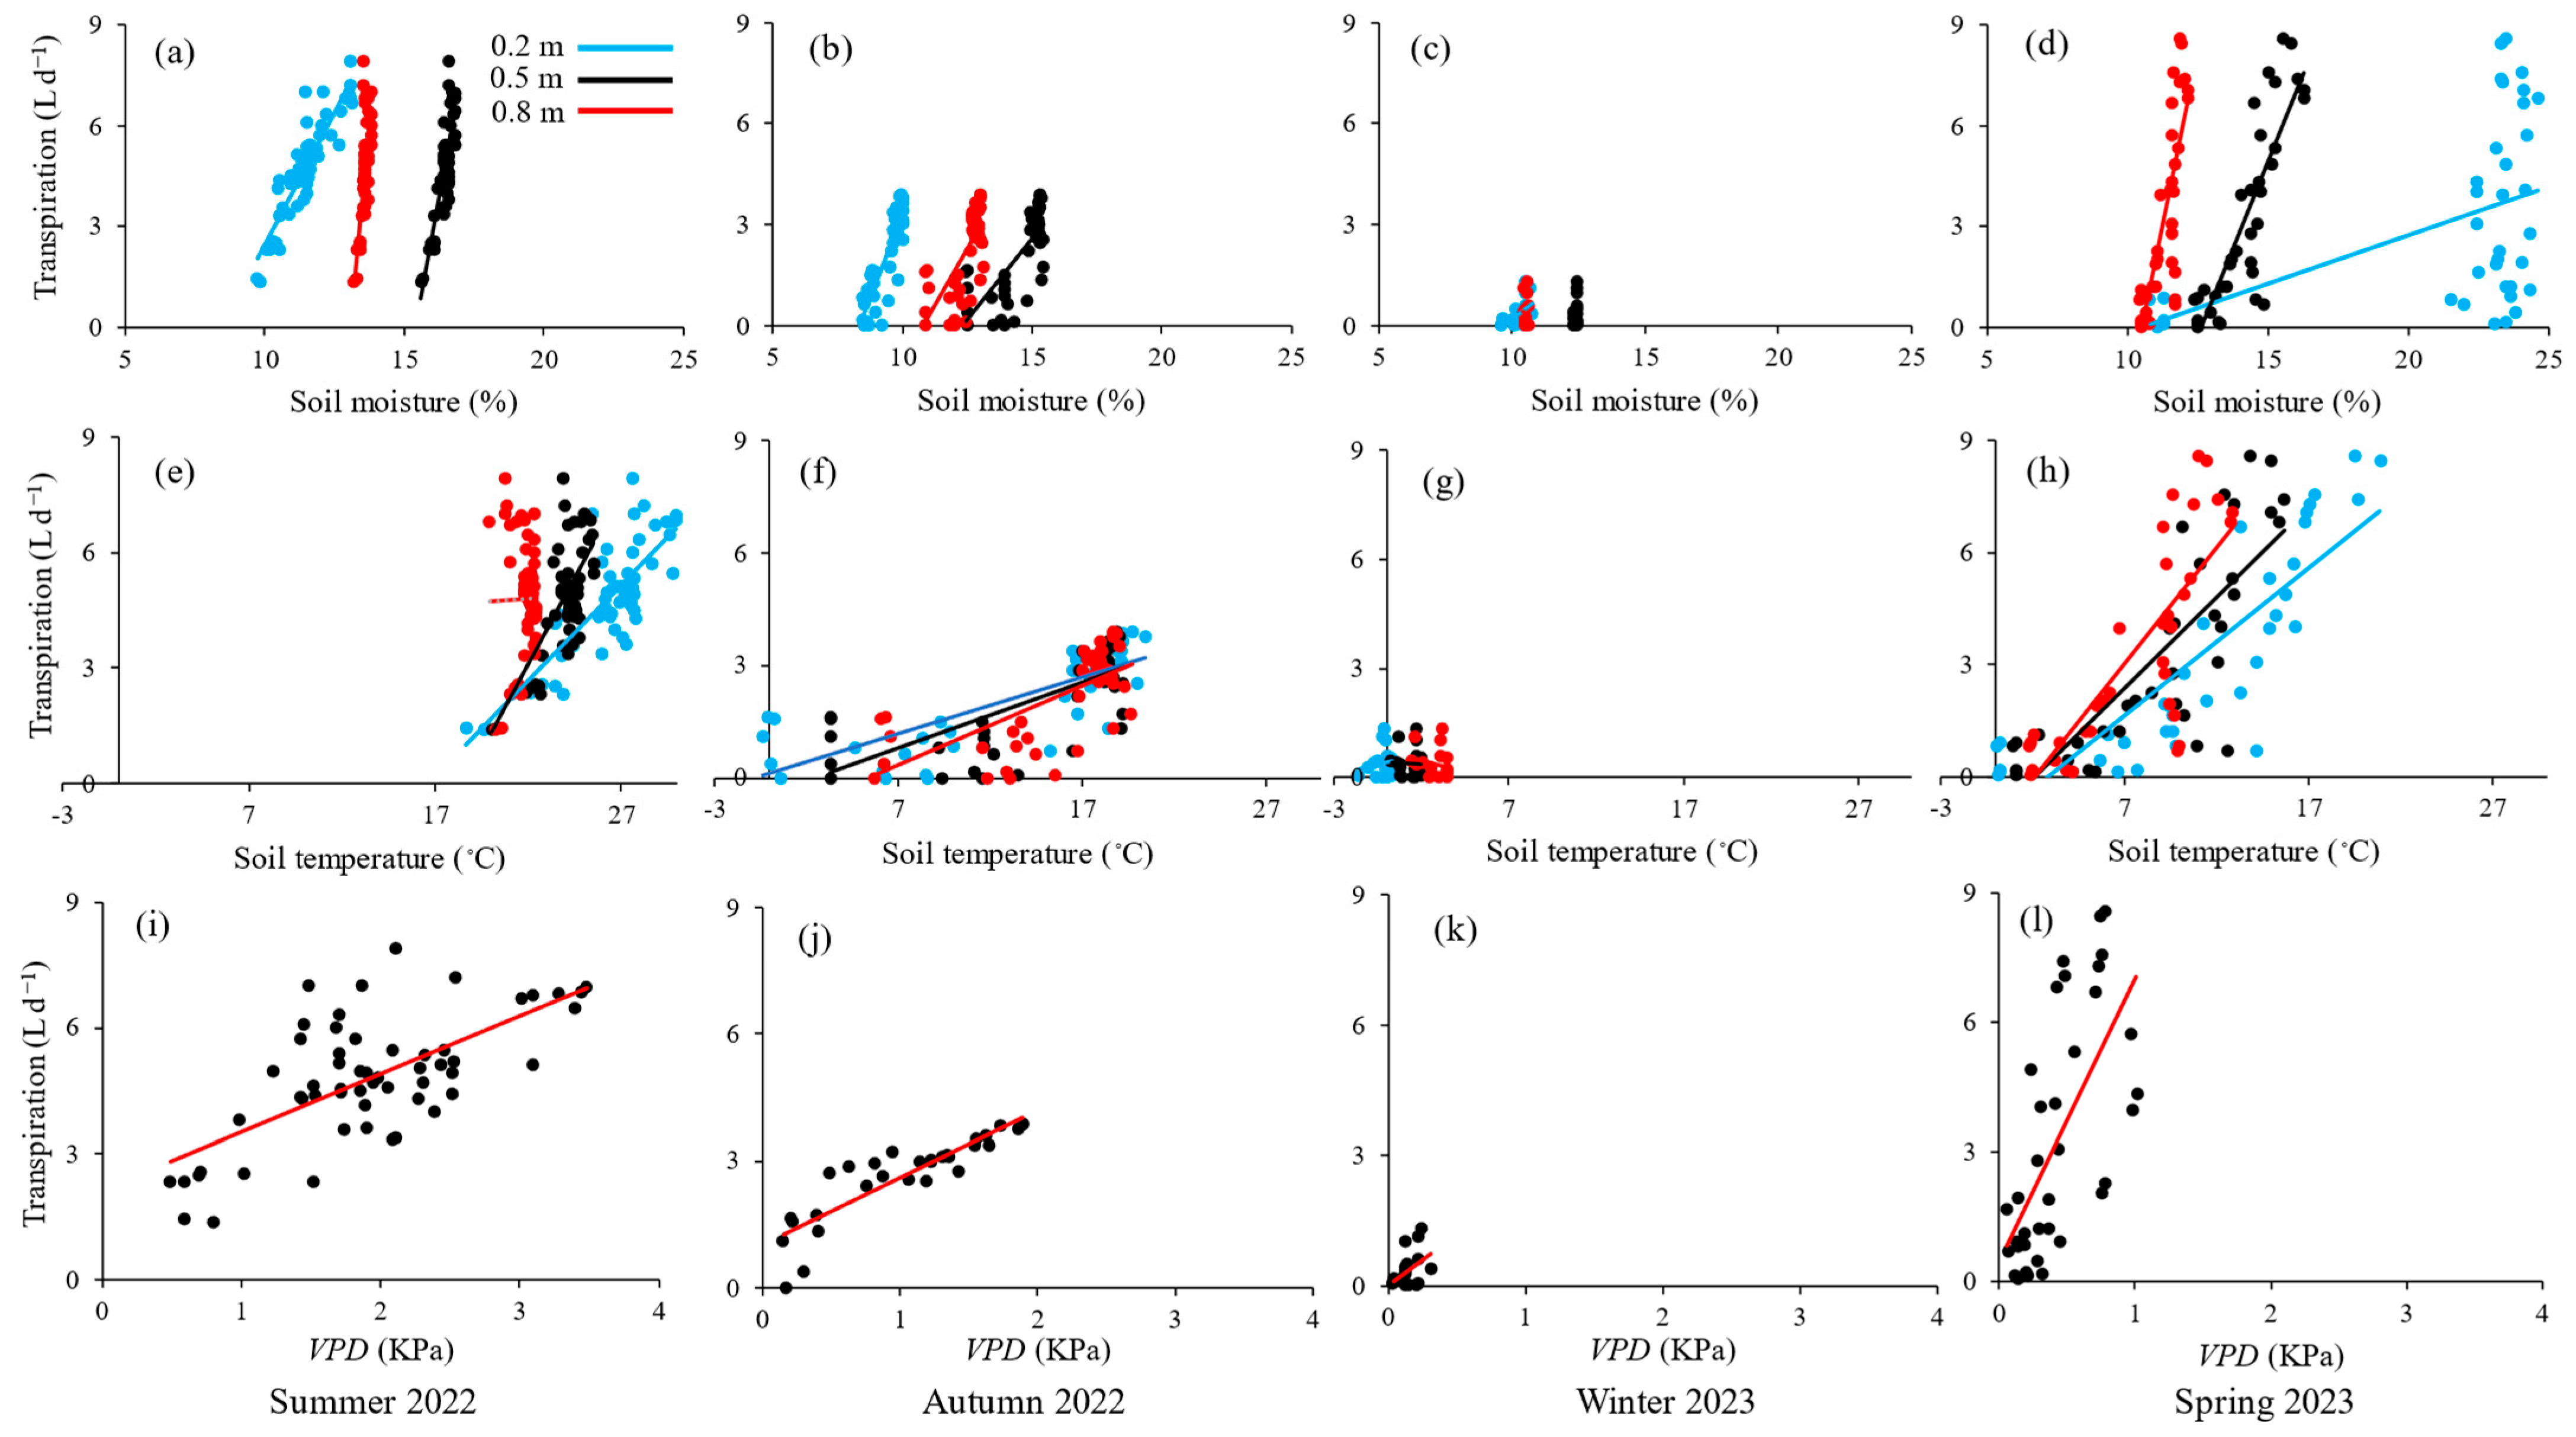
Stronger relationships between sagebrush’s transpiration and the environmental variables SM, ST, and VPD were observed in spring, summer, and autumn, whereas a more muted response was noted in the winter (Figure 4). A positive correlation between transpiration and SM at all depths was noted. The greatest rate of change between SM and transpiration was obtained for SM0.2 during the spring and summer. The highest variability, with SM0.2 levels ranging from 11% to 25% and corresponding transpiration values ranging from 0.05 to 9 L d−1, was observed in the spring. The relationships between transpiration and SM0.2 was stronger than with SM at deeper soil layers for summer, autumn, and winter. In spring, sagebrush’s transpiration was more influenced by the SM0.5 compared to other soil depths, indicating that the transpiration process relied heavily on the moisture available at this depth.
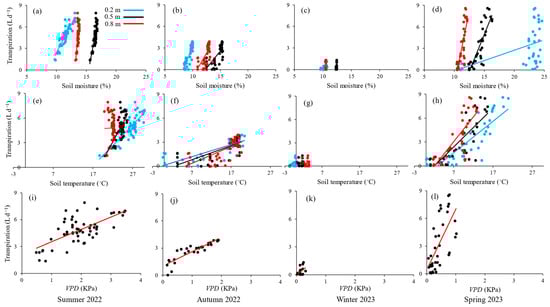
Figure 4.
Relationships of transpiration to soil moisture (a–d) and soil temperature (e–h) at various depths, and vapor pressure deficit, VPD (i–l), in summer 2022, autumn 2022, winter 2023, and spring 2023.
A positive correlation between transpiration and ST at all depths was also obtained. The ST0.2 has a more significant relationship with transpiration than ST at deeper depths. The greatest rate of change was observed during the autumn, with ST0.2 levels ranging from −0.4 °C to 20.5 °C and transpiration values ranging from near zero to 3.9 L d−1. As expected, the greatest rate of change in the relationship between transpiration and VPD was obtained for the drier months in the summer, followed by autumn, spring, and winter (Figure 4).
The Spearman rank order correlation test showed that SM at all depths showed great explanatory power for transpiration variability for summer 2022, autumn 2022, and spring 2023 seasons, with a stronger effect recorded for SMtot (ρ = 0.93, p < 0.001, n = 36) in spring 2023 (Table 3). Except for the relationship between transpiration and ST0.8 in summer 2022 (ρ = −0.10, p > 0.05, n = 56), ST also had a positive correlation with transpiration at all depths, which was most significant at ST0.2 (ρ = 0.91, p < 0.001, n = 36) in spring 2023. In winter 2023, the dependence of transpiration on SM and ST became either negative or not detectable, except for the positive correlation between transpiration and SM0.2 (ρ = 0.52, p ≤ 0.05, n = 17).
Table 3.
Spearman’s rank correlation coefficients between sagebrush’s transpiration and SM, and ST at different soil depths, SMtot, and STtot, and VPD for summer 2022, autumn 2022, winter 2023, and spring 2023.
Transpiration and VPD were moderately correlated in summer 2022 (ρ = 0.54, p < 0.001, n = 56), very strongly correlated in autumn 2022 (ρ = 0.92, p < 0.001, n = 29), and strongly correlated in spring 2023 (ρ = 0.72, p < 0.001, n = 36). No significant correlation between transpiration and VPD was observed in winter 2023 (ρ = 0.31, p > 0.05, n = 17). The best predictor for transpiration variability was SM0.2 in summer 2022 and winter 2023, SMtot in spring 2023, and VPD in autumn 2022.
4. Discussion
This study quantified water uptake by mountain big sagebrush plants and evaluated its correlation with several environmental variables of interest (i.e., SM, ST, and VPD). Plant transpiration varied daily and seasonally, with maximum values obtained during the warm months and acute reductions during the cold months corresponding with decreasing SM, ST, SR, and VPD. Various other studies have reported similar patterns of seasonal water use in shrubs [30,31,32].
Even though the range of transpiration levels for the period of study was similar for both plants (0.01 to 9.6 L d−1 for plant 1 and 0.1 to 11.1 L d−1 for plant 2), their annual mean transpiration (2.1 vs. 5.0 L d−1) and seasonal transpiration levels were different. The much greater seasonal transpiration levels for plant 2 compared to plant 1 were partly attributed to the larger total branch diameter obtained for this plant. The difference in transpiration levels between the two plants was exacerbated during the drier 2022 year, which resulted in higher air and soil moisture deficits. In the spring of the wetter 2023 year, the close peak transpiration values of 9.6 and 8.6 L d−1 for plant 1 and plant 2, respectively, were attributed to the abundance of moisture available. Sagebrush plants have extensive root systems reaching depths up to 2 m [33,34]. Some studies have shown that sagebrush plants’ productivity is strongly associated with shallow soil moisture [35,36]. Overall, water uptake by sagebrush plants in this study closely followed the pattern of SM0.2 availability, with sagebrush water use declining as SM0.2 levels depleted through the summer and increasing in response to an SM0.2 rise during the spring snowmelt runoff season. The positive relationship between transpiration and SM0.2 observed during winter suggested that sagebrush primarily used water from the surface soil layer in cold weather rather than penetrating deeper with its roots.
In response to cold temperatures, many plants, including shrubs, reduce their metabolic activities, including root growth and water uptake [37,38]. This is a survival strategy to conserve energy and resources during the harsh winter conditions. Therefore, in cold conditions, plants rely more on the water available in the surface soil layers, which are more easily accessible and require less energy to extract water from [39]. In the spring, when SM was abundant, the SMtot was a strong predictor of water uptake by sagebrush. That means sagebrush could utilize water from the entire soil profile, which can contribute to their growth and survival.
The rise in ST in the spring, particularly near the surface (ST0.2), stimulated increased transpiration rates by the sagebrush plants. The lower transpiration and ST levels observed in autumn and winter are consistent with reports by Onwuka and Mang [40], who found that low ST during winter can hinder plants’ water uptake by reducing the transpiration rate. Overall, results from this study are similar to other research showing that plant transpiration positively relates to ST [26,41,42].
Similar to SM and ST, transpiration sensitivity to the VPD explanatory parameter was positive in all seasons except winter. The association between VPD and transpiration became more evident in conditions where SM was low, such as in the autumn season. Under low SM conditions, a decrease in VPD likely led to a decrease in stomatal conductance, thereby reducing sagebrush transpiration. This aligns with various studies investigating vegetation water use in response to low VPD and water availability [43,44,45]. Stomatal conductance helps minimize plant water loss [46]. Under high SM conditions in spring, VPD was also an important environmental factor affecting the transpiration rate of sagebrush. Daily increases in VPD, co-occurring with ST, enhanced transpiration throughout the spring season. When VPD increases, it creates a more significant gradient for water to move from the plant to the atmosphere, which can increase the transpiration rate [47]. As ST rises, it can enhance plant roots’ activity and cell membrane permeability, promoting water absorption [48].
The limitations of this study included the fact that the transpiration data collected were from only two plants. Caution should be exercised when extrapolating plant scale findings to the larger landscape scale. Also, some transpiration data were lost during early summer due to sensor malfunctioning. We may have missed the peak transpiration values during the warmest month in June in both years. Even though the data comprised nearly one year, and the data followed the expected distribution of seasonal weather: the first part (summer and fall) of the data was collected during a below-average precipitation year (2022; 278 mm), whereas the other part (most winter and spring) was collected in an above-average precipitation year (2023; 414 mm). This can lead to a less-accurate interpretation of seasonal transpiration and environmental relationships during average conditions. Other environmental factors not considered in this study may influence the sagebrush plant water dynamics observed. For example, studies indicate that reductions in leaf stomatal conductance under rising atmospheric carbon dioxide concentration (CO2) may promote water use efficiency (WUE) to benefit plant growth, especially in water-limited ecosystems [49,50,51].
Results from this study provide essential information regarding mountain big sagebrush water use and its relations with various environmental drivers critical for the sustainability of arid and semiarid ecosystems. The project outcomes contribute to an enhanced understanding of soil–plant–water interactions in cool-climate rangeland ecosystems where restoration practices such as juniper stand reduction have been implemented. Similar efforts to control woody vegetation expansion and invasive grass species can be found in many other landscapes in the Pacific Northwest region, USA, and arid and semiarid landscapes worldwide. Future research involves studying the combined effects of water use by various dominant vegetation species, such as sagebrush and juniper, and the effects of vegetation water uptake on the water budget at the watershed scale.
Author Contributions
C.G.O. and M.A.B.A. developed the study design and conducted field data collection. C.G.O., M.A.B.A. and D.G.G. conducted the analyses and contributed to the writing of the manuscript. All authors have read and agreed to the published version of the manuscript.
Funding
This research was partially funded by the Oregon Watershed Enhancement Board (Grant #223-4030-23034).
Data Availability Statement
Most of the data presented in this study are available in the article. Additional information is available upon request.
Acknowledgments
The authors gratefully acknowledge the continuous support of the Hatfield Hyde Land Trust, the U.S. Department of Interior Bureau of Land Management—Prineville Office, and the OSU’s Extension Service. We also want to thank the multiple students and volunteers from Oregon State University who participated in various field data collection activities related to this research. Our thanks go to Tim Deboodt, Michael Fisher, and John Buckhouse, who pioneered the establishment of the long-term CCPWS site in 1993.
Conflicts of Interest
The authors declare no conflicts of interest.
References
- Wisdom, M.J.; Rowland, M.M.; Suring, L.H.; Schueck, L.; Meinke, C.W.; Knick, S.T. Evaluating species of conservation concern at regional scales. In Habitat Threats in the Sagebrush Ecosystem—Methods of Regional Assessment and Applications in the Great Basin; Wisdom, M.J., Rowland, M.M., Suring, L.H., Eds.; Alliance Communications Group: Lawrence, KS, USA, 2005; pp. 5–24. [Google Scholar]
- Hanser, S.E.; Leu, M.; Knick, S.T.; Aldridge, C.L. (Eds.) Sagebrush Ecosystem Conservation and Management: Ecoregional Assessment Tools and Models for the Wyoming Basin; Allen Press: Lawrence, KS, USA, 2011; 409p. [Google Scholar]
- Schlaepfer, D.R.; Lauenroth, W.K.; Bradford, J.B. Ecohydrological niche of sagebrush ecosystems. Ecohydrology 2012, 5, 453–466. [Google Scholar] [CrossRef]
- Davies, K.W.; Bates, J.D. Restoring big sagebrush after controlling encroaching western juniper with fire: Aspect and subspecies effects. Restor. Ecol. 2017, 25, 33–41. [Google Scholar] [CrossRef]
- Sharma, H.; Reinhardt, K.; Lohse, K.A. Fundamental intra-specific differences in plant–water relations in a widespread desert shrub (Artemisia tridentata). Plant Ecol. 2020, 221, 925–938. [Google Scholar] [CrossRef]
- Durfee, N.; Ochoa, C.G. The seasonal water balance of western-juniper-dominated and big-sagebrush-dominated watersheds. Hydrology 2021, 8, 156. [Google Scholar] [CrossRef]
- Jackson, R.B.; Banner, J.L.; Jobbágy, E.G.; Pockman, W.T.; Wall, D.H. Ecosystem carbon loss with woody plant invasion of grasslands. Nature 2002, 418, 623–626. [Google Scholar] [CrossRef]
- Abdallah, M.A.; Mata-González, R.; Noller, J.S.; Ochoa, C.G. Ecosystem carbon in relation to woody plant encroachment and control: Juniper systems in Oregon, USA. Agric. Ecosyst. Environ. 2020, 290, 106762. [Google Scholar] [CrossRef]
- West, N.E.; Young, J.A. Intermountain valleys and lower mountain slopes. In North American Terrestrial Vegetation; Barbour, M.G., Billings, W.D., Eds.; Cambridge University Press: New York, NY, USA, 1999; pp. 255–284. [Google Scholar]
- Naithani, K.J.; Ewers, B.E.; Pendall, E. Sap flux-scaled transpiration and stomatal conductance response to soil and atmospheric drought in a semi-arid sagebrush ecosystem. J. Hydrol. 2012, 464, 176–185. [Google Scholar] [CrossRef]
- Richards, J.H.; Caldwell, M.M. Hydraulic lift: Substantial nocturnal water transport between soil layers by Artemisia tridentata roots. Oecologia 1987, 73, 486–489. [Google Scholar] [CrossRef]
- Cardon, Z.G.; Stark, J.M.; Herron, P.M.; Rasmussen, J.A. Sagebrush carrying out hydraulic lift enhances surface soil nitrogen cycling and nitrogen uptake into inflorescences. Proc. Natl. Acad. Sci. USA 2013, 110, 18988–18993. [Google Scholar] [CrossRef]
- Caldwell, M.M.; Dawson, T.E.; Richards, J.H. Hydraulic lift: Consequences of water efflux from the roots of plants. Oecologia 1998, 113, 151–161. [Google Scholar] [CrossRef]
- Caldwell, M.M.; Richards, J.H. Hydraulic lift: Water efflux from upper roots improves effectiveness of water uptake by deep roots. Oecologia 1989, 79, 1–5. [Google Scholar] [CrossRef]
- Finch, D.M.; Boyce, D.A.; Chambers, J.C.; Colt, C.J.; Dumroese, K.; Kitchen, S.G.; McCarthy, C.; Meyer, S.E.; Richardson, B.A.; Rowland, M.M.; et al. Conservation and Restoration of Sagebrush Ecosystems and Sage-Grouse: An Assessment of USDA Forest Service Science. In General Technical Report; RMRS-GTR-348; US Department of Agriculture, Forest Service, Rocky Mountain Research Station: Fort Collins, CO, USA, 2016; 54p. [Google Scholar]
- Manier, D.J.; Wood, D.J.; Bowen, Z.H.; Donovan, R.M.; Holloran, M.J.; Juliusson, L.M.; Mayne, K.S.; Oyler-McCance, S.J.; Quamen, F.R.; Saher, D.J.; et al. Summary of Science, Activities, Programs, and Policies That Influence the Rangewide Conservation of Greater Sage-Grouse (Centrocercus urophasianus); (No. 2013-1098); US Geological Survey: Reston, VA, USA, 2013.
- Knick, S.; Connelly, J.W. (Eds.) Greater Sage-Grouse: Ecology and Conservation of a Landscape Species and Its Habitats; University of California Press: Berkeley, CA, USA, 2011; Volume 38. [Google Scholar]
- Smith, J.T.; Evans, J.S.; Martin, B.H.; Baruch-Mordo, S.; Kiesecker, J.M.; Naugle, D.E. Reducing cultivation risk for at-risk species: Predicting outcomes of conservation easements for sage-grouse. Biol. Conserv. 2016, 201, 10–19. [Google Scholar] [CrossRef]
- Walston, L.J.; Cantwell, B.L.; Krummel, J.R. Quantifying spatiotemporal changes in a sagebrush ecosystem in relation to energy development. Ecography 2009, 32, 943–952. [Google Scholar] [CrossRef]
- Williams, R.E.; Roundy, B.A.; Hulet, A.; Miller, R.F.; Tausch, R.J.; Chambers, J.C.; Matthews, J.; Schooley, R.; Eggett, D. Pretreatment tree dominance and conifer removal treatments affect plant succession in sagebrush communities. Rangel. Ecol. Manag. 2017, 70, 759–773. [Google Scholar] [CrossRef]
- Bates, J.D.; Svejcar, T.; Miller, R.; Davies, K.W. Plant community dynamics 25 years after juniper control. Rangel. Ecol. Manag. 2017, 70, 356–362. [Google Scholar] [CrossRef]
- Ray, G.; Ochoa, C.G.; Deboodt, T.; Mata-Gonzalez, R. Overstory–understory vegetation cover and soil water content observations in western juniper woodlands: A paired watershed study in Central Oregon, USA. Forests 2019, 10, 151. [Google Scholar] [CrossRef]
- Ochoa, C.G.; Caruso, P.; Ray, G.; Deboodt, T.; Jarvis, W.T.; Guldan, S.J. Ecohydrologic connections in semiarid watershed systems of central Oregon USA. Water 2018, 10, 181. [Google Scholar] [CrossRef]
- Robinson, T.M.; La Pierre, K.J.; Vadeboncoeur, M.A.; Byrne, K.M.; Thomey, M.L.; Colby, S.E. Seasonal, not annual precipitation drives community productivity across ecosystems. Oikos 2013, 122, 727–738. [Google Scholar] [CrossRef]
- Reed, D.E.; Ewers, B.E.; Pendall, E.; Naithani, K.J.; Kwon, H.; Kelly, R.D. Biophysical factors and canopy coupling control ecosystem water and carbon fluxes of semiarid sagebrush ecosystems. Rangel. Ecol. Manag. 2018, 71, 309–317. [Google Scholar] [CrossRef]
- Ochoa, C.G.; Abdallah, M.A. The Seasonal Variability and Environmental Factors Influencing the Transpiration of Western Juniper (Juniperus occidentalis) Saplings. Hydrology 2023, 10, 232. [Google Scholar] [CrossRef]
- Missik, J.E.; Liu, H.; Gao, Z.; Huang, M.; Chen, X.; Arntzen, E.; Mcfarland, D.P.; Ren, H.; Titzler, P.S.; Thomle, J.N.; et al. Groundwater-river water exchange enhances growing season evapotranspiration and carbon uptake in a semiarid riparian ecosystem. J. Geophys. Res. Biogeosci. 2019, 124, 99–114. [Google Scholar] [CrossRef]
- Rose, R.; Chachulski, C.E.C.; Haase, D.L. Propagation of Pacific Northwest Native Plants; Oregon State University Press: Corvallis, OR, USA, 1998; ISBN 0-87071-428-7. [Google Scholar]
- Abdallah, M.A.; Durfee, N.; Mata-Gonzalez, R.; Ochoa, C.G.; Noller, J.S. Water use and soil moisture relationships on western juniper trees at different growth stages. Water 2020, 12, 1596. [Google Scholar] [CrossRef]
- Zhang, S.Y.; Li, X.Y.; Ma, Y.J.; Zhao, G.Q.; Li, L.; Chen, J.; Jiang, Z.Y.; Huang, Y.M. Interannual and seasonal variability in evapotranspiration and energy partitioning over the alpine riparian shrub Myricaria squamosa Desv. on Qinghai–Tibet Plateau. Cold Reg. Sci. Technol. 2014, 102, 8–20. [Google Scholar] [CrossRef]
- Wang, P.; Li, X.Y.; Wang, L.; Wu, X.; Hu, X.; Fan, Y.; Tong, Y. Divergent evapotranspiration partition dynamics between shrubs and grasses in a shrub-encroached steppe ecosystem. New Phytol. 2018, 219, 1325–1337. [Google Scholar] [CrossRef]
- Szutu, D.J.; Papuga, S.A. Year-round transpiration dynamics linked with deep soil moisture in a warm desert shrubland. Water Resour. Res. 2019, 55, 5679–5695. [Google Scholar] [CrossRef]
- Seyfried, M.S.; Wilcox, B.P. Soil water storage and rooting depth: Key factors controlling recharge on rangelands. Hydrol. Process. 2006, 20, 3261–3275. [Google Scholar] [CrossRef]
- Cleary, M.B.; Pendall, E.; Ewers, B.E. Aboveground and belowground Carbon pools after fire in Mountain big sagebrush steppe. Rangel. Ecol. Manag. 2010, 63, 187–196. [Google Scholar] [CrossRef]
- Germino, J.M.; Reinhardt, K. Desert shrub responses to experimental modification of precipitation seasonality and soil depth: Relationship to the two-layer hypothesis and ecohydrological niche. J. Ecol. 2014, 102, 989–997. [Google Scholar] [CrossRef]
- Sharma, H.; Reinhardt, K.; Lohse, K.A.; Aho, K. Summer-time carbon and water fluxes in sagebrush ecosystems spanning rain-to snow-dominated precipitation regimes. Rangel. Ecol. Manag. 2020, 73, 265–275. [Google Scholar] [CrossRef]
- Graefe, S.; Leuschner, C.; Coners, H.; Hertel, D. Root functioning in tropical high-elevation forests: Environmental vs. biological control of root water absorption. Environ. Exp. Bot. 2011, 71, 329–336. [Google Scholar] [CrossRef]
- Scholz, F.G.; Bucci, S.J.; Arias, N.; Meinzer, F.C.; Goldstein, G. Osmotic and elastic adjustments in cold desert shrubs differing in rooting depth: Coping with drought and subzero temperatures. Oecologia 2012, 170, 885–897. [Google Scholar] [CrossRef]
- Barbeta, A.; Mejía-Chang, M.; Ogaya, R.; Voltas, J.; Dawson, T.E.; Peñuelas, J. The combined effects of a long-term experimental drought and an extreme drought on the use of plant-water sources in a Mediterranean forest. Glob. Change Biol. 2015, 21, 1213–1225. [Google Scholar] [CrossRef]
- Onwuka, B.; Mang, B. Effects of soil temperature on some soil properties and plant growth. Adv. Plants Agric. Res. 2018, 8, 34–37. [Google Scholar] [CrossRef]
- Liu, X.; Nie, Y.; Luo, T.; Yu, J.; Shen, W.; Zhang, L. Seasonal shift in climatic limiting factors on tree transpiration: Evidence from sap flow observations at alpine treelines in southeast Tibet. Front. Plant Sci. 2016, 7, 1018. [Google Scholar] [CrossRef]
- Zhang, Z.; Chen, X.; Pan, Z.; Zhao, P.; Zhang, J.; Jiang, K.; Wang, J.; Han, G.; Song, Y.; Huang, N.; et al. Quantitative estimation of the effects of soil moisture on temperature using a soil water and heat coupling model. Agriculture 2022, 12, 1371. [Google Scholar] [CrossRef]
- Liu, Y.; Kumar, M.; Katul, G.G.; Feng, X.; Konings, A.G. Plant hydraulics accentuates the effect of atmospheric moisture stress on transpiration. Nat. Clim. Change 2020, 10, 691–695. [Google Scholar] [CrossRef]
- Cai, G.; König, M.; Carminati, A.; Abdalla, M.; Javaux, M.; Wankmüller, F.; Ahmed, M.A. Transpiration response to soil drying and vapor pressure deficit is soil texture specific. Plant Soil 2022, 45, 650–663. [Google Scholar] [CrossRef]
- Koehler, T.; Wankmüller, F.J.; Sadok, W.; Carminati, A. Transpiration response to soil drying vs. increasing vapor pressure deficit in crops–physical and physiological mechanisms and key plant traits. J. Exp. Bot. 2023, 74, 4789–4807. [Google Scholar] [CrossRef]
- Lawson, T.; Blatt, M.R. Stomatal size, speed, and responsiveness impact on photosynthesis and water use efficiency. Plant Physiol. 2014, 164, 1556–1570. [Google Scholar] [CrossRef]
- Chen, L.; Zhang, Z.; Zha, T.; Mo, K.; Zhang, Y.; Fang, X. Soil water affects transpiration response to rainfall and vapor pressure deficit in poplar plantation. New For. 2014, 45, 235–250. [Google Scholar] [CrossRef]
- Song, X.; Miao, L.; Jiao, X.; Ibrahim, M.; Li, J. Regulating Vapor Pressure Deficit and Soil Moisture Improves Tomato and Cucumber Plant Growth and Water Productivity in the Greenhouse. Horticulturae 2022, 8, 147. [Google Scholar] [CrossRef]
- Sreeharsha, R.V.; Sekhar, K.M.; Reddy, A.R. Delayed flowering is associated with lack of photosynthetic acclimation in Pigeon pea (Cajanus cajan L.) grown under elevated CO2. Plant Sci. 2015, 231, 82–93. [Google Scholar] [CrossRef]
- Knauer, J.; Zaehle, S.; Reichstein, M.; Medlyn, B.E.; Forkel, M.; Hagemann, S.; Werner, C. The response of ecosystem water-use efficiency to rising atmospheric CO2 concentrations: Sensitivity and large-scale biogeochemical implications. New Phytol. 2017, 213, 1654–1666. [Google Scholar] [CrossRef]
- Li, B.; Feng, Y.; Zong, Y.; Zhang, D.; Hao, X.; Li, P. Elevated CO2-induced changes in photosynthesis, antioxidant enzymes and signal transduction enzyme of soybean under drought stress. Plant Physiol. Biochem. 2020, 154, 105–114. [Google Scholar] [CrossRef]
Disclaimer/Publisher’s Note: The statements, opinions and data contained in all publications are solely those of the individual author(s) and contributor(s) and not of MDPI and/or the editor(s). MDPI and/or the editor(s) disclaim responsibility for any injury to people or property resulting from any ideas, methods, instructions or products referred to in the content. |
© 2024 by the authors. Licensee MDPI, Basel, Switzerland. This article is an open access article distributed under the terms and conditions of the Creative Commons Attribution (CC BY) license (https://creativecommons.org/licenses/by/4.0/).