


A Field Study to Assess the Impacts of Biochar Amendment on Runoff Quality from Newly Established Green Roofs


Abstract
1. Introduction
2. Materials and Methods
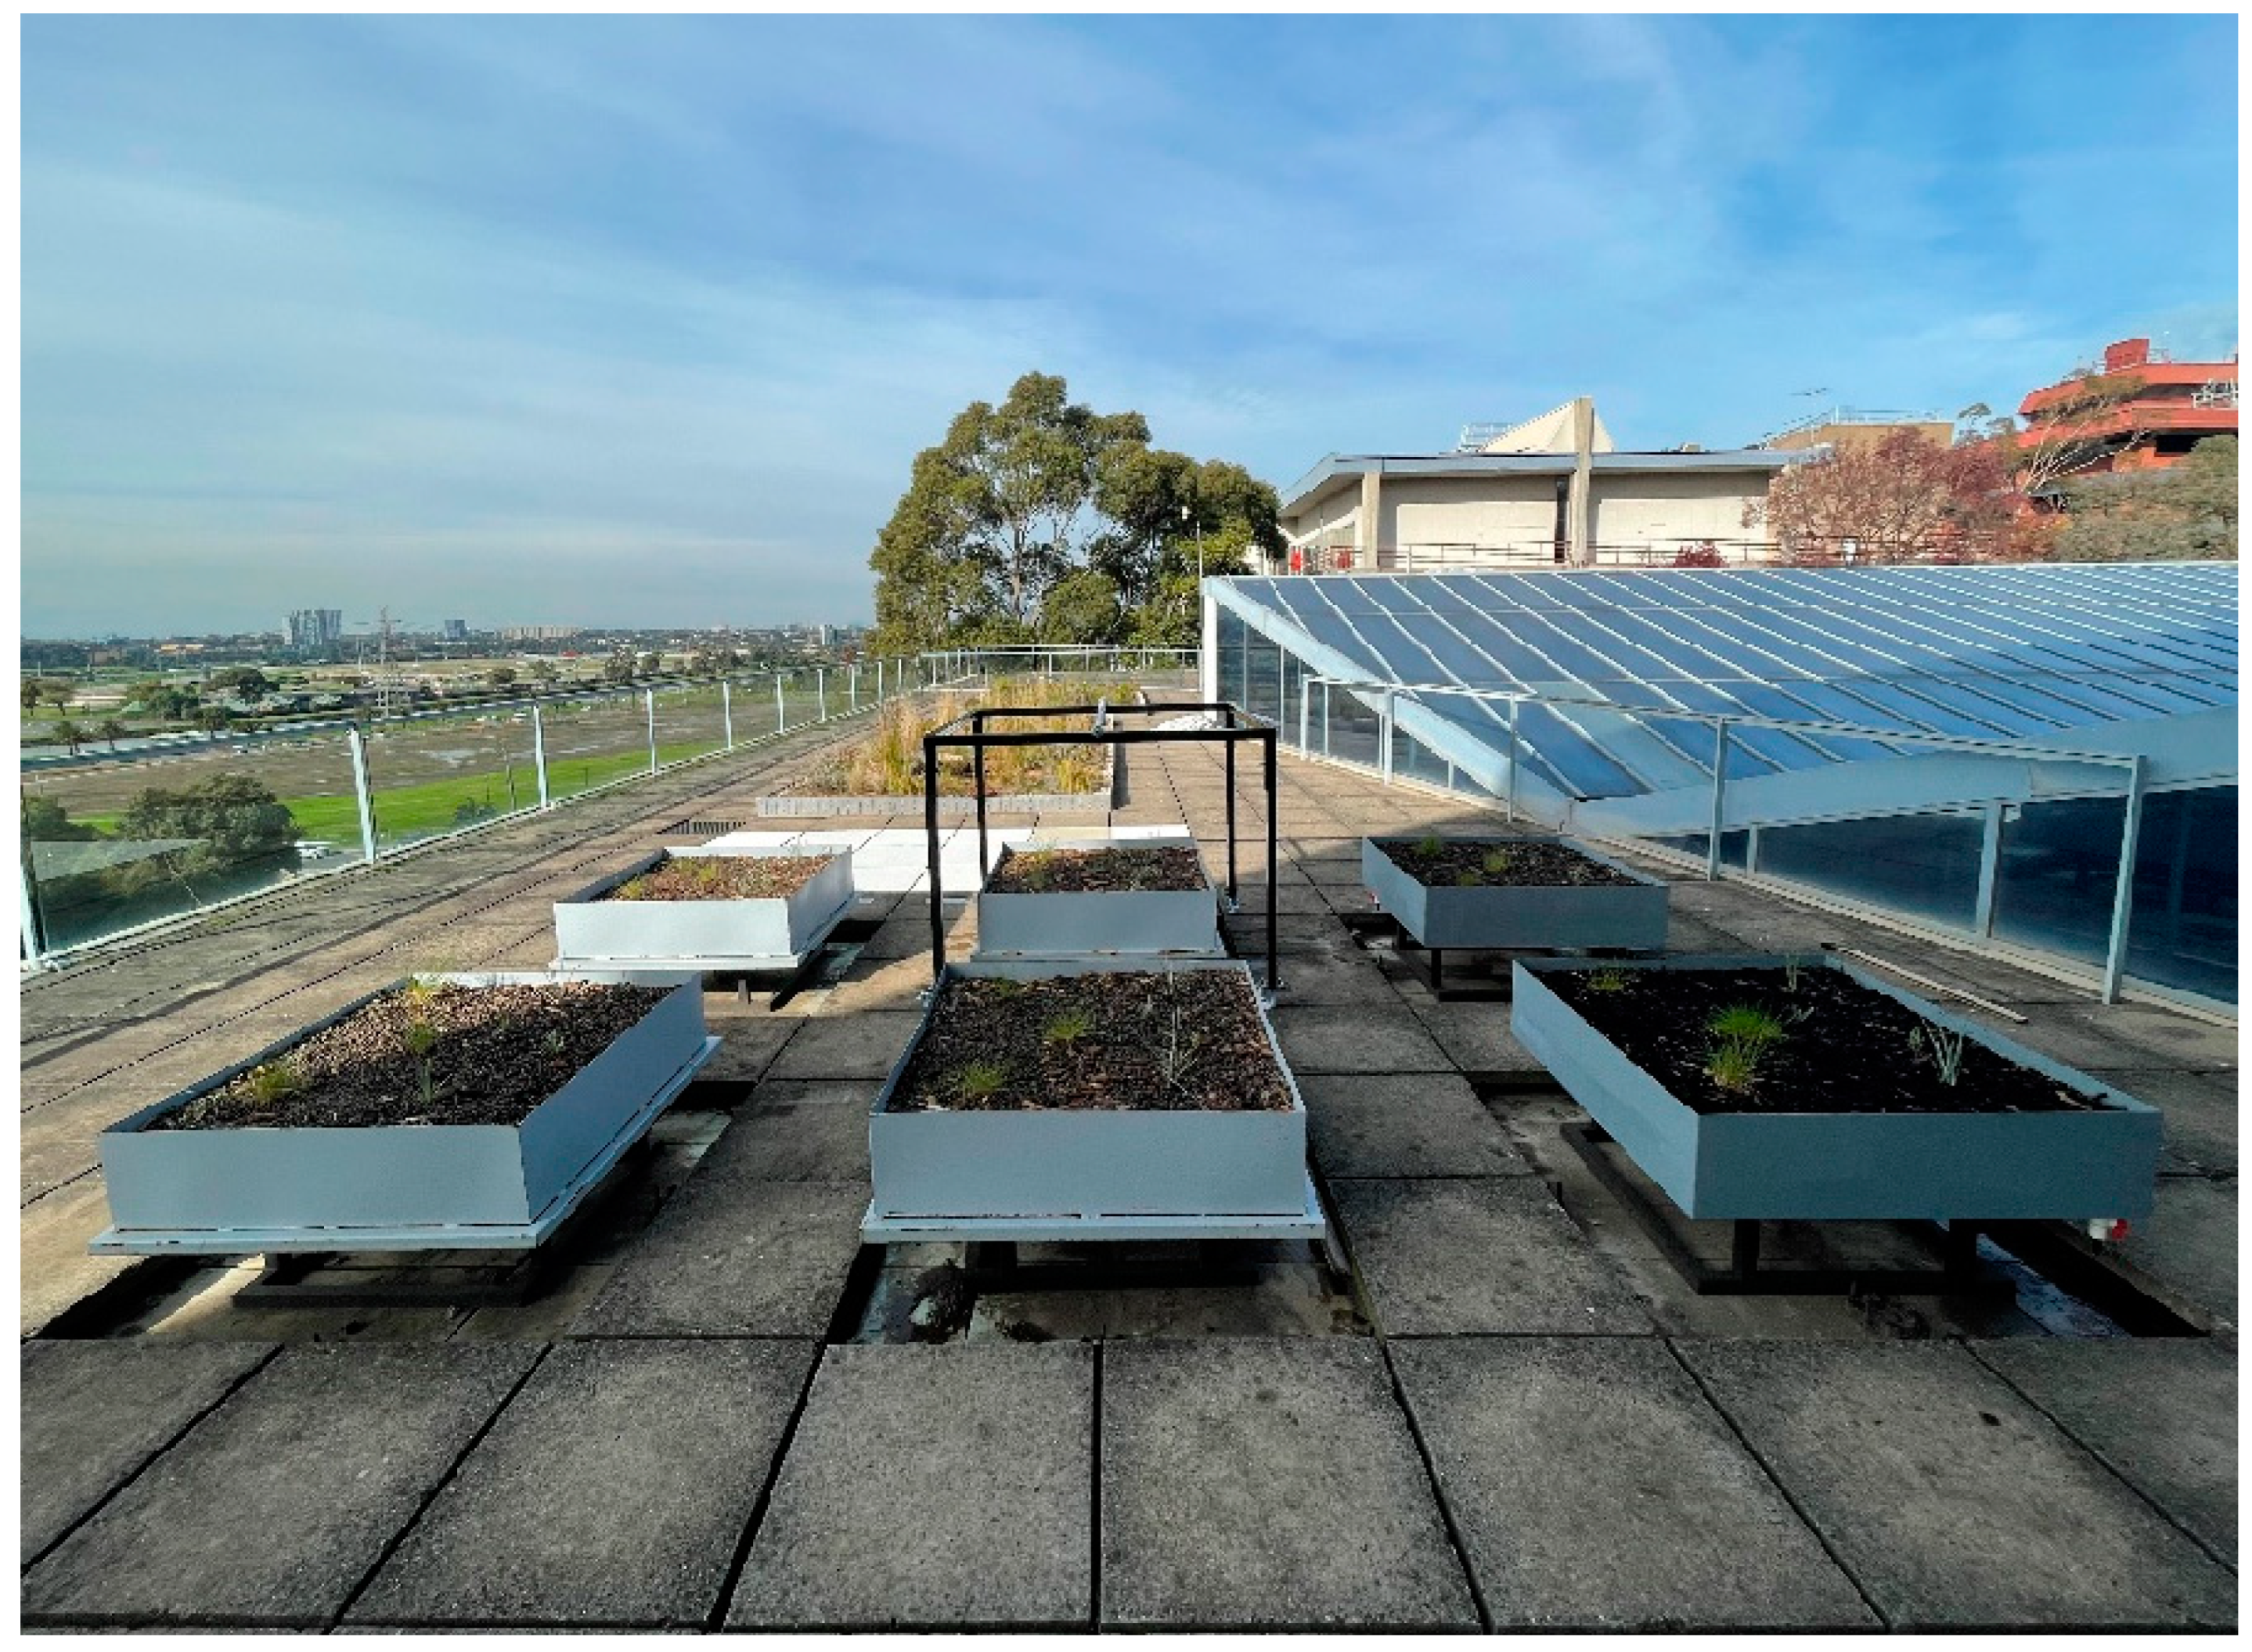
2.1. Experimental Setup
2.2. Data Collection and Analysis
3. Results
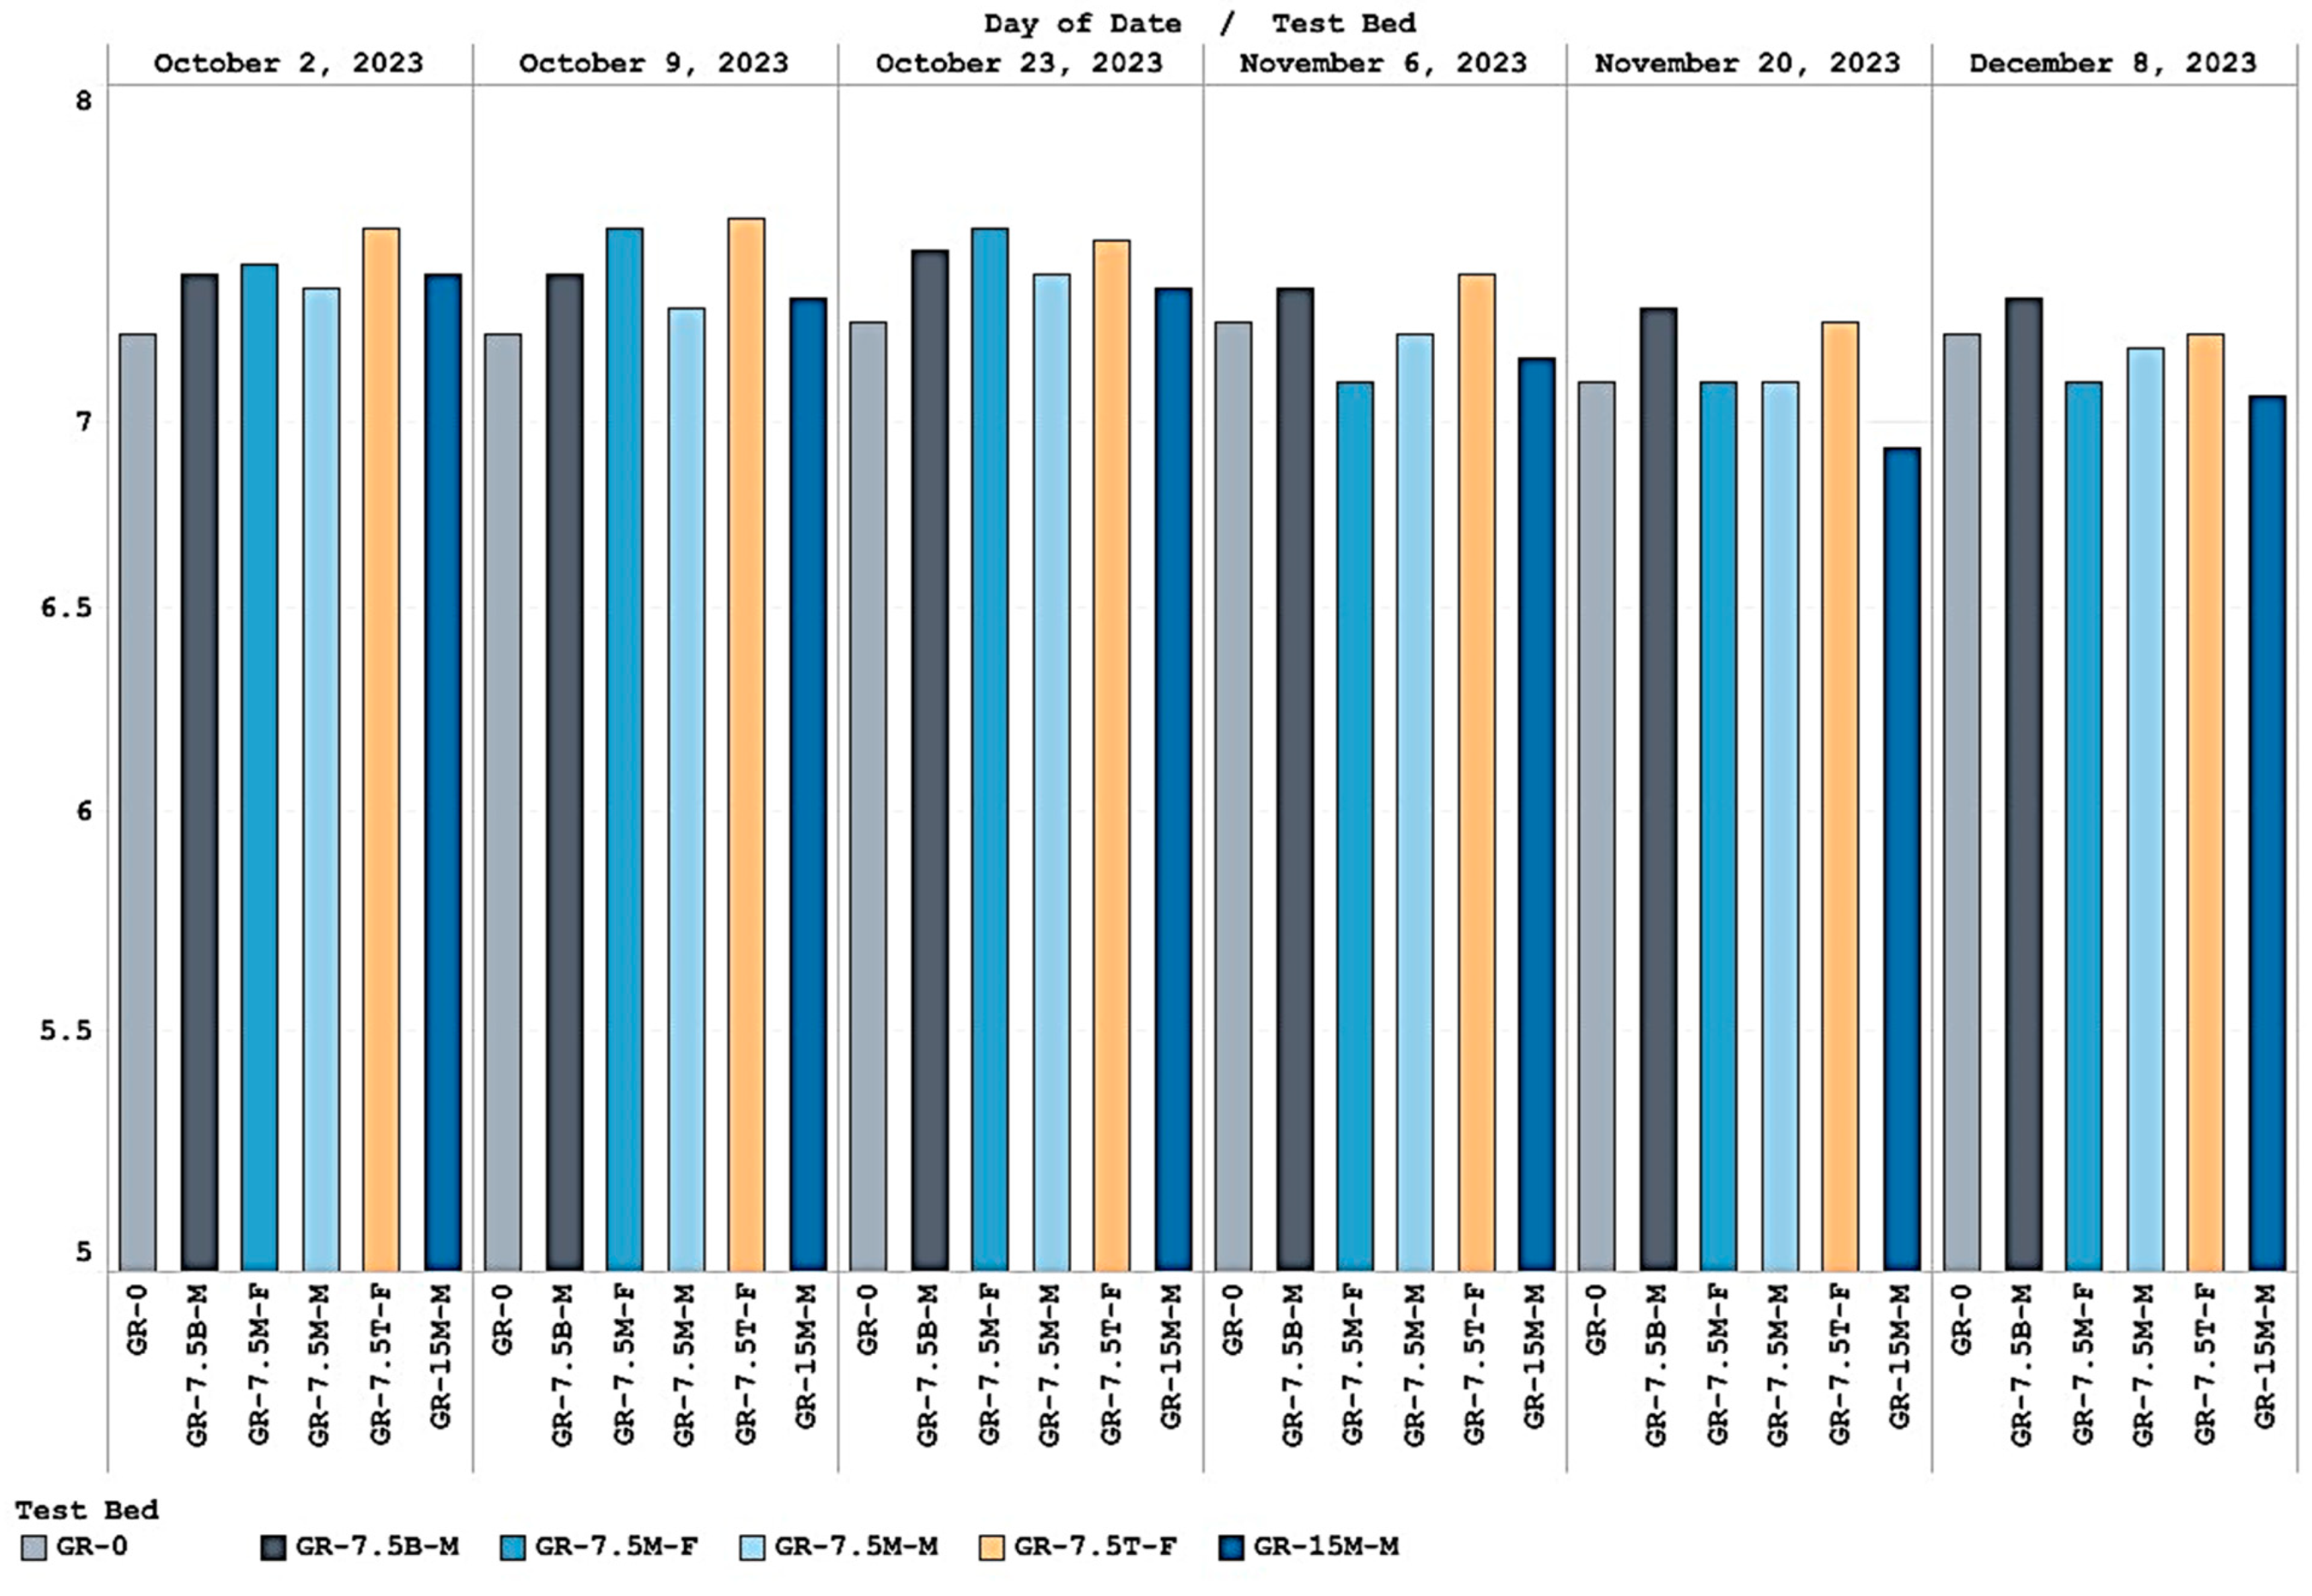
3.1. pH
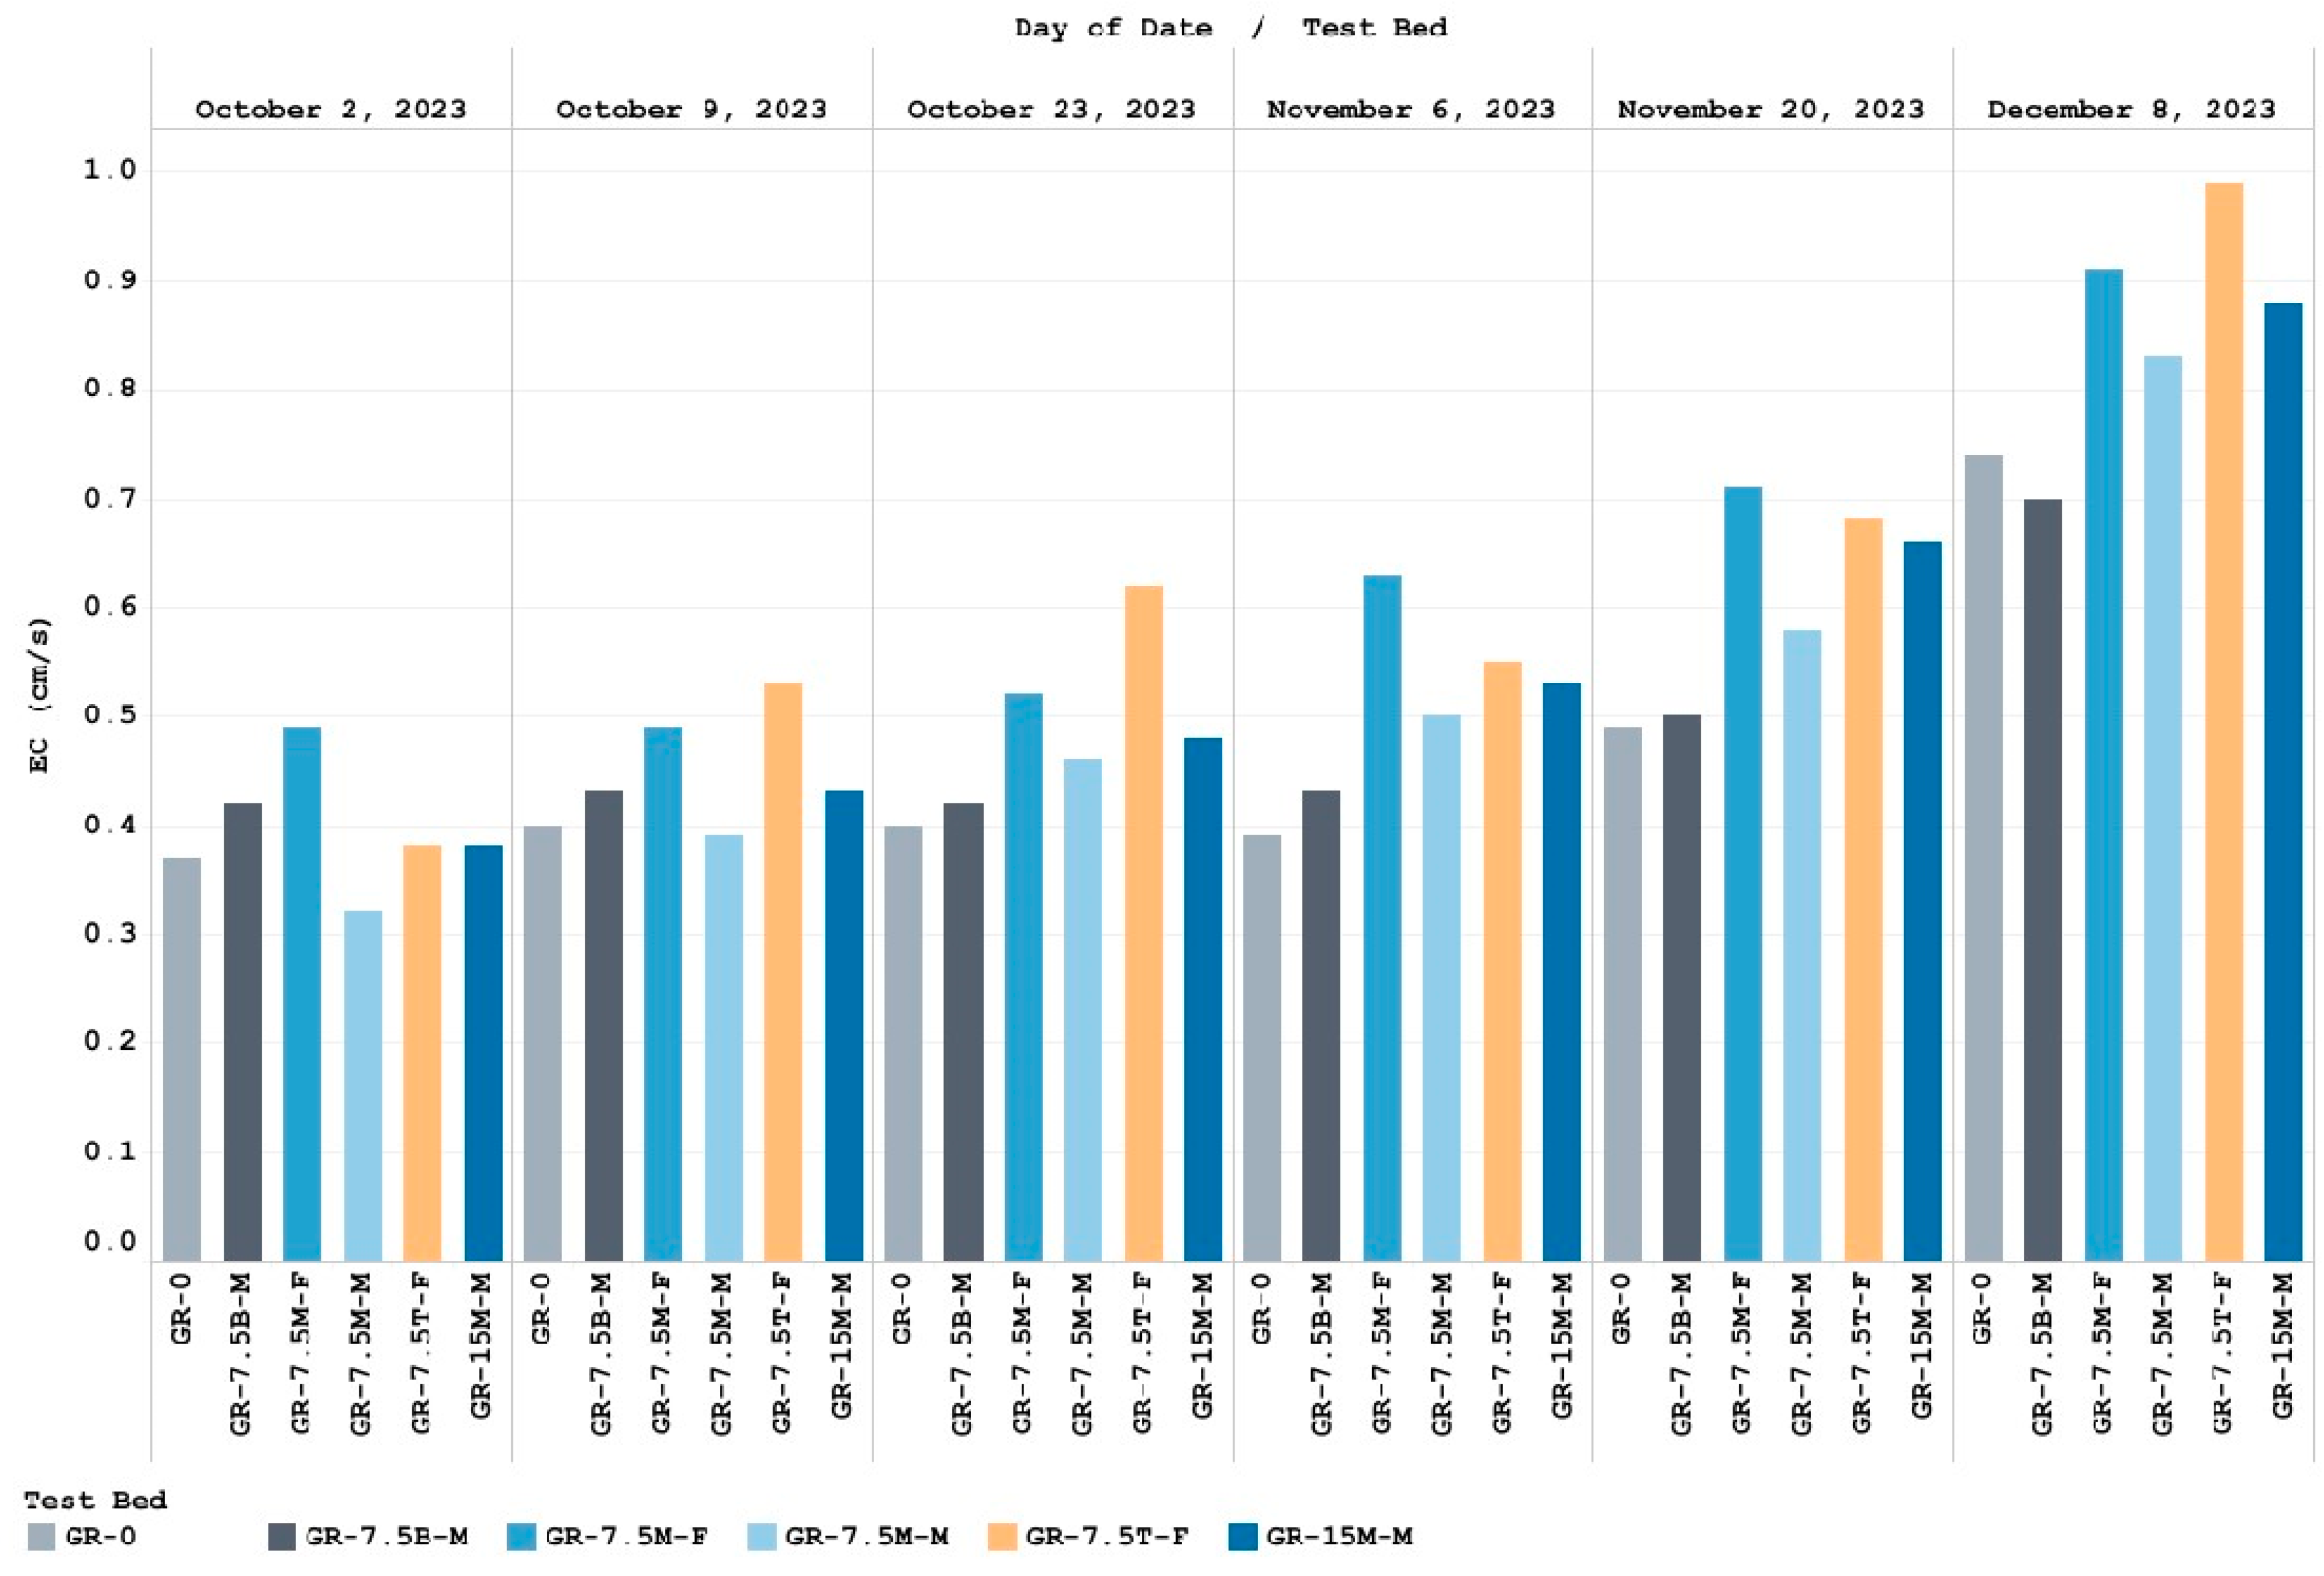
3.2. Electrical Conductivity (EC)
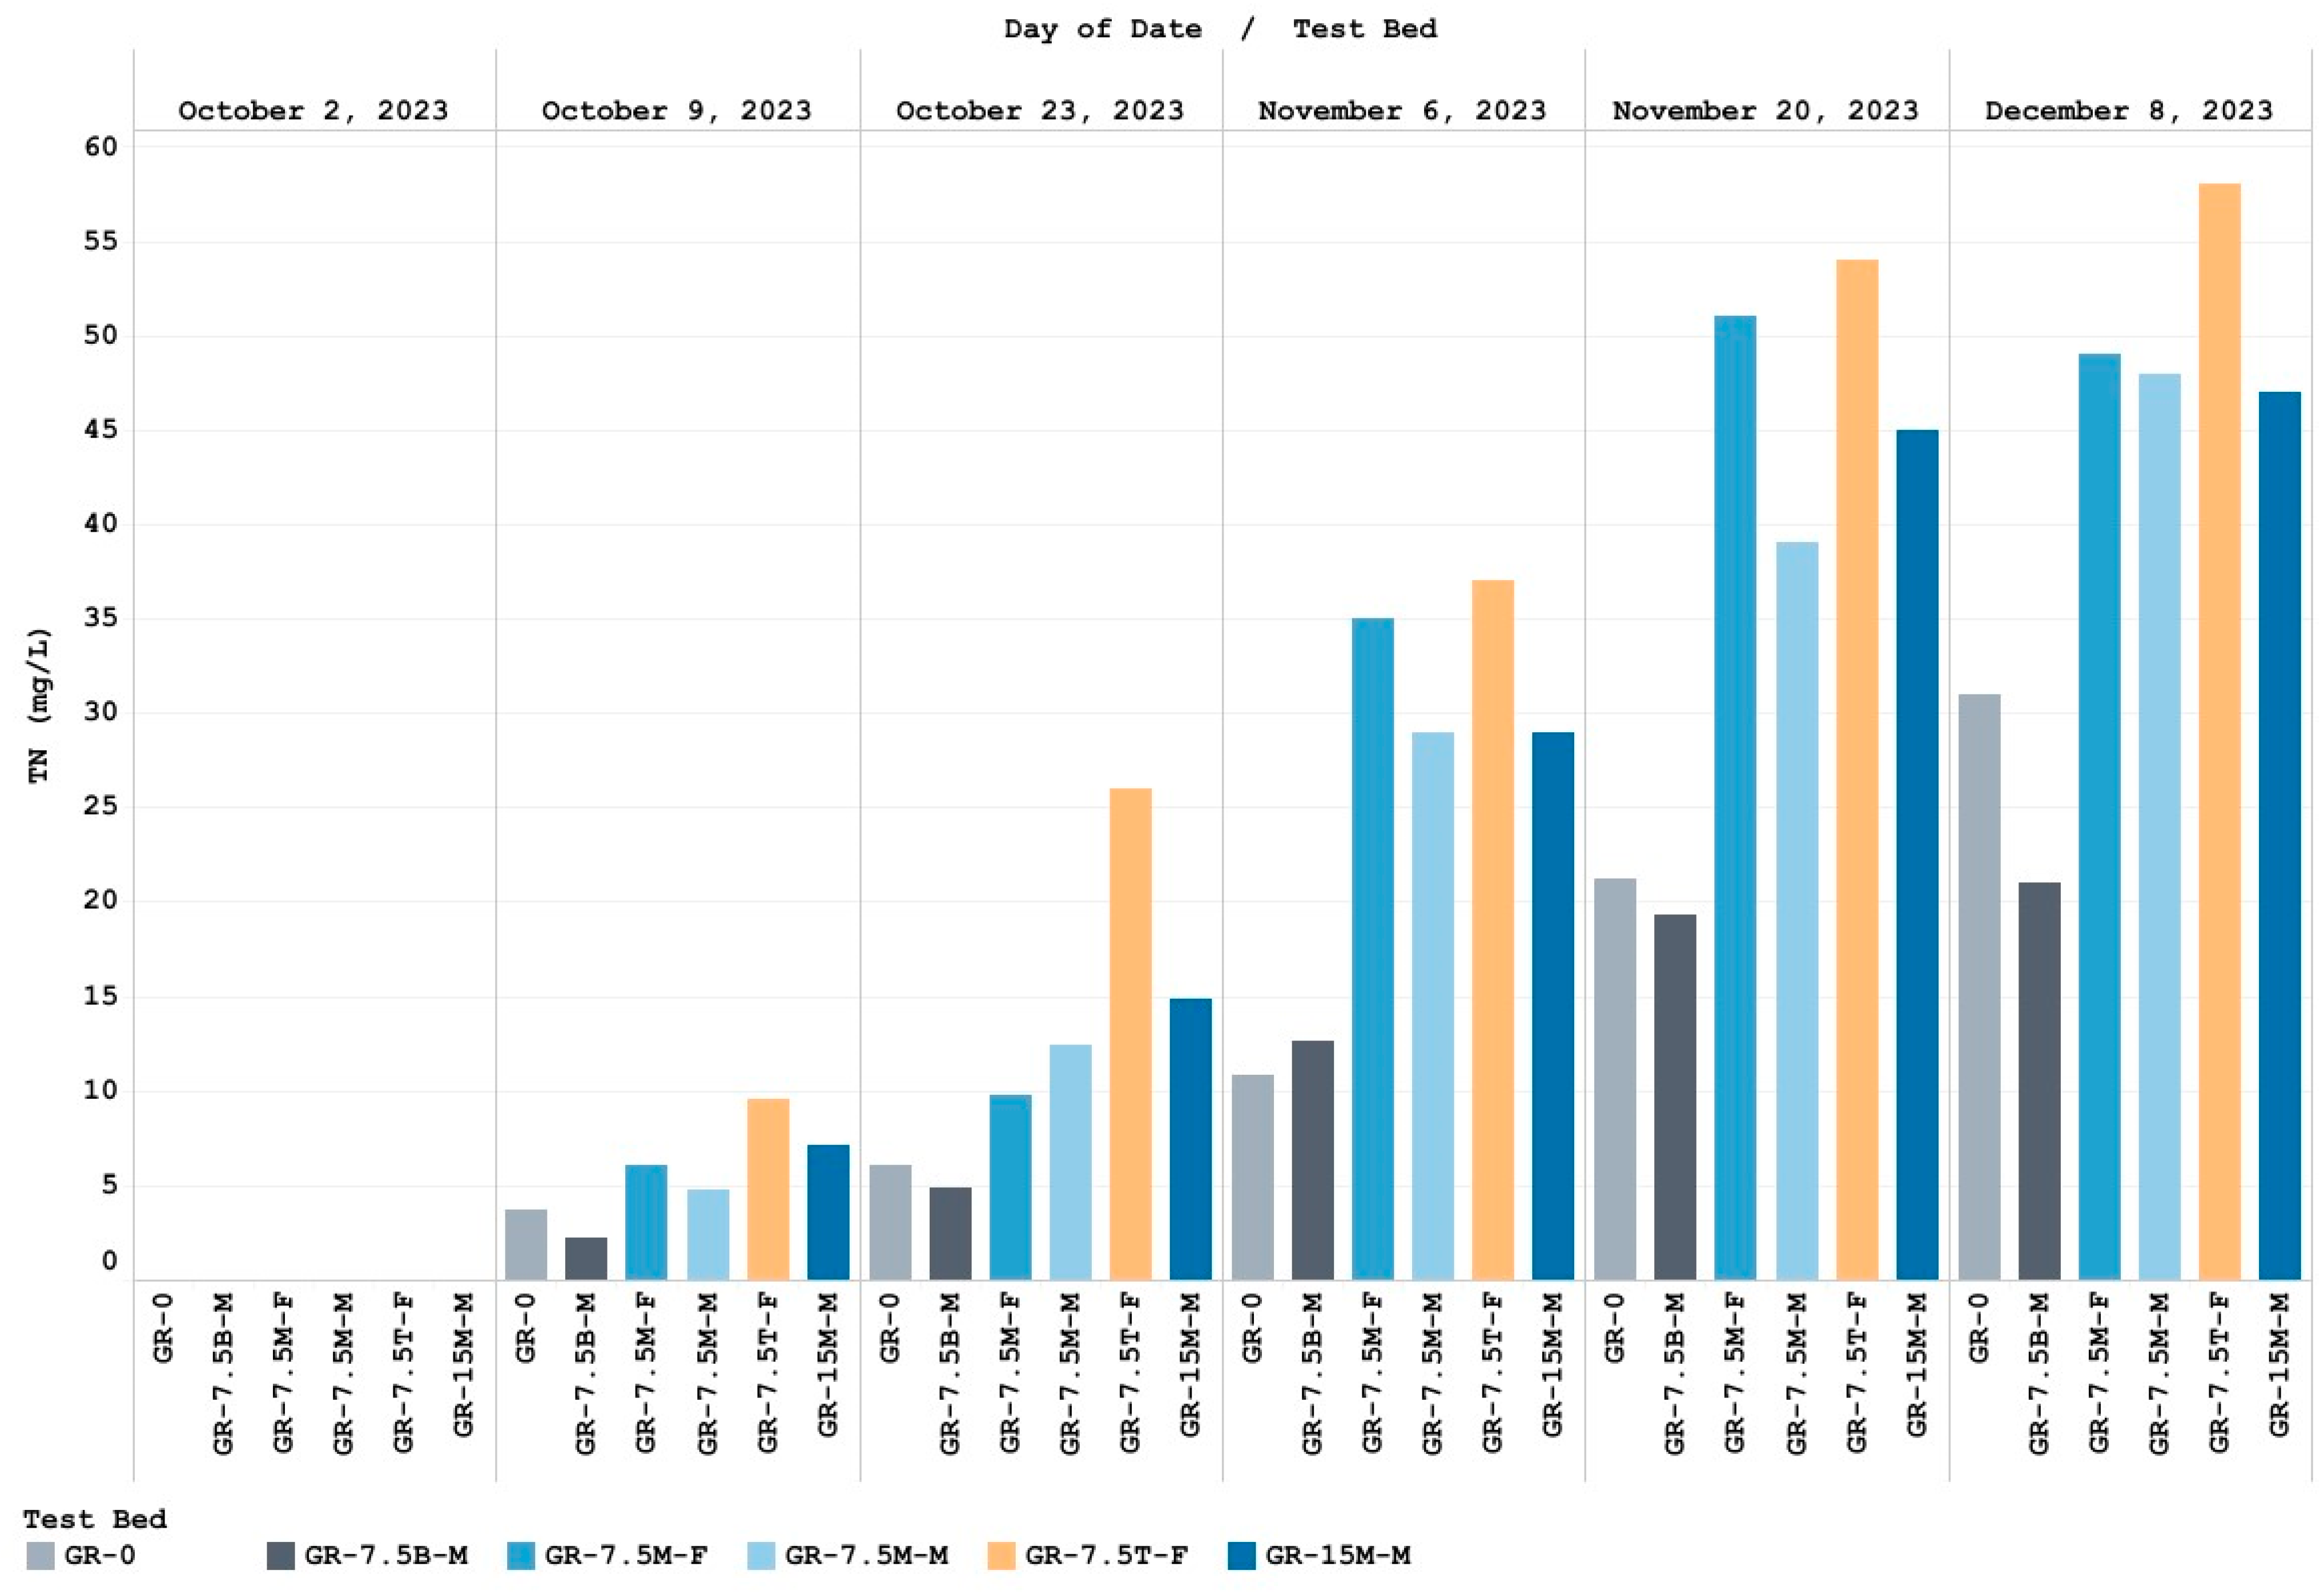
3.3. Concentration of Total Nitrogen (TN)
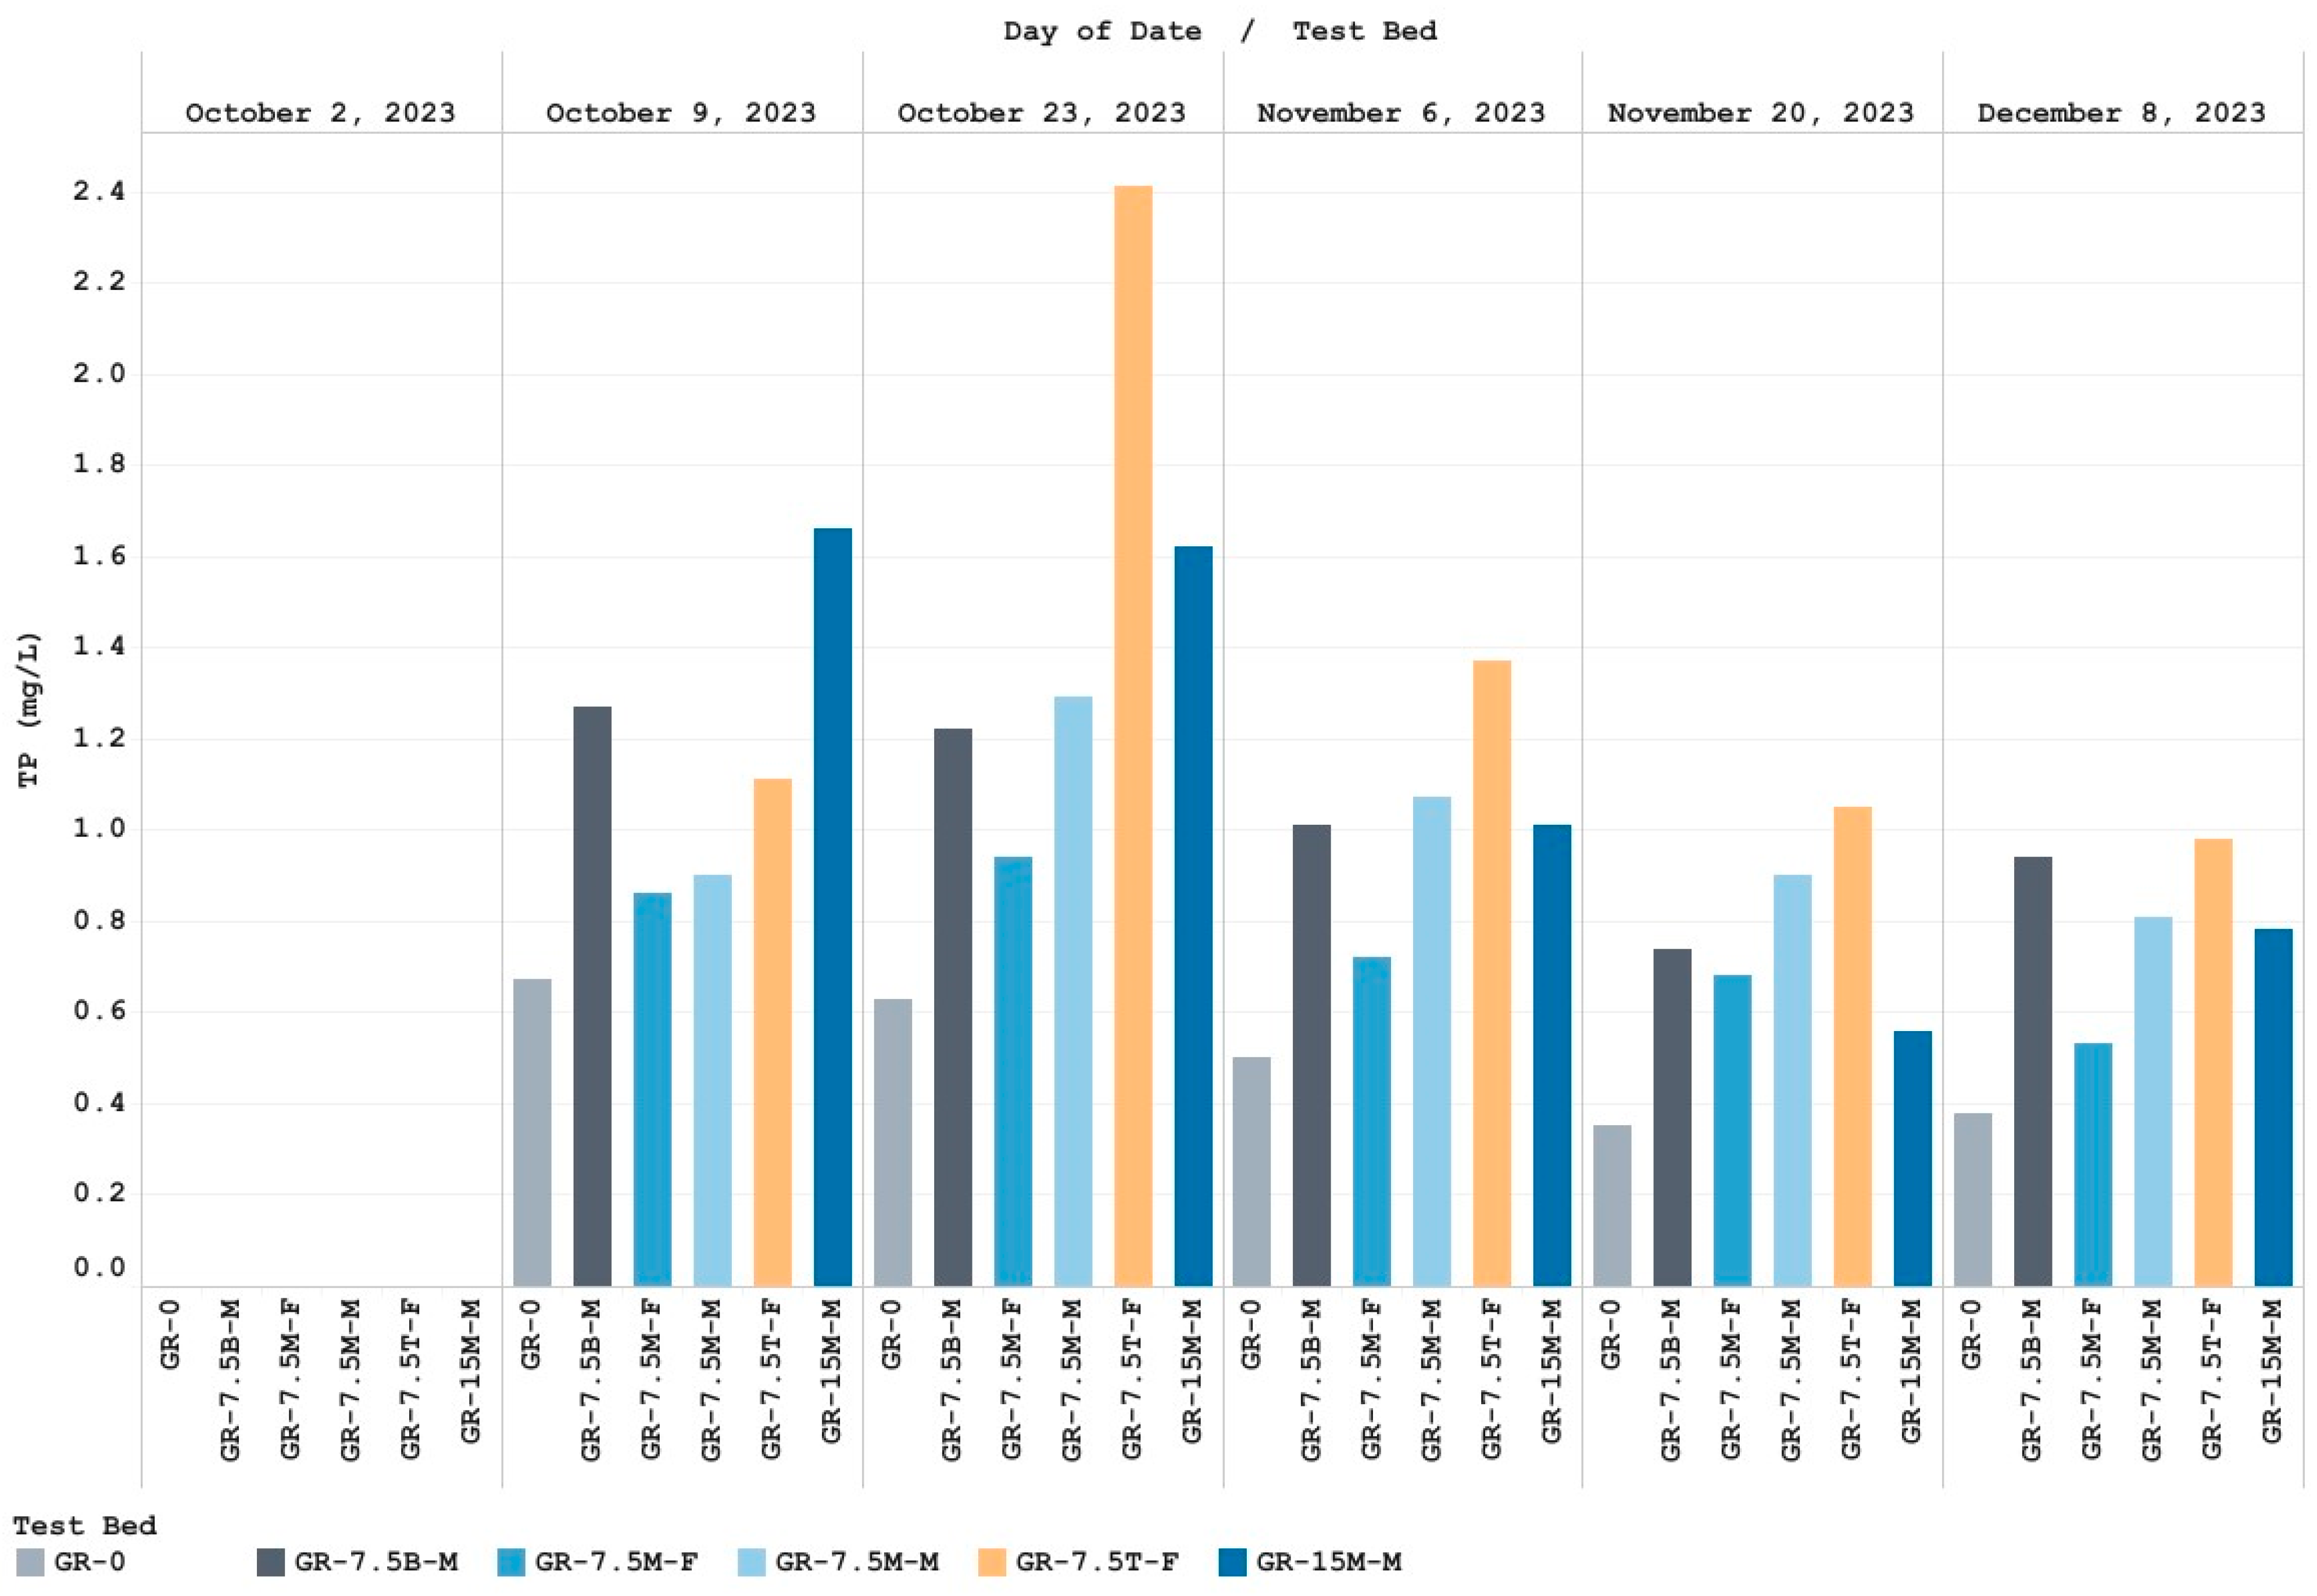
3.4. Concentration of Total Phosphorus (TP)
4. Discussion
4.1. pH
4.2. Electrical Conductivity (EC)
4.3. Concentration of Total Nitrogen (TN)
4.4. Concentration of Total Phosphorus (TP)
4.5. Long-Term Impacts of Biochar on Green Roof Runoff Quality
5. Conclusions
- (a)
- GRs tended to neutralize rainwater by producing alkaline runoff (pH ranging from 6.93 to 7.59). The impacts of biochar on runoff pH were insignificant and more pronounced at the beginning of the experiment.
- (b)
- All GR substrates were a source of EC, and runoff EC was higher with biochar-amended substrates. Small biochar particles tended to produce runoff with higher EC. Among the biochar-amended test beds, the EC in runoff from the test bed with medium biochar particles applied at the bottom of the substrate was the lowest.
- (c)
- TN concentrations of runoff from most biochar GRs were significantly higher than from non-biochar GR. The only exception was the test bed with medium biochar particles applied at the bottom of the substrate. Compared to medium biochar particles, fine particles exhibited a slightly weaker capacity to reduce TN in GR runoff.
- (d)
- The addition of biochar resulted in an increase in TP concentration in GR runoff due to a higher P content in substrates, which is also consistent with previous findings. In contrast to TN retention, fine biochar particles were observed to be more effective for TP retention than medium biochar particles.
- (e)
- When compared to the other biochar test beds, the test bed with biochar applied to the surface of the substrate (GR-7.5T-F) exhibited the poorest performance in terms of runoff quality.
- (f)
- Despite mixed findings regarding nutrient concentrations, biochar still holds huge potential to enhance runoff quality, due to the considerable reduction in runoff volume that it can achieve.
- (g)
- A pronounced relationship between runoff quality and GR aging was also recognized. The availability of nutrients in GR substrates tends to decrease over time and long-term observations are necessary to understand the performance of biochar as GRs age.
- (h)
- The compatibility of biochar with a GR system significantly influences the effectiveness of biochar in improving GR runoff quality.
Author Contributions
Funding
Institutional Review Board Statement
Informed Consent Statement
Data Availability Statement
Acknowledgments
Conflicts of Interest
References
- Zhang, Q.; Miao, L.; Wang, H.; Wang, L. Analysis of the effect of green roof substrate amended with biochar on water quality and quantity of rainfall runoff. Environ. Monit. Assess. 2019, 191, 304. [Google Scholar]
- Qiu, D.; Peng, H.; Li, T.; Qi, Y. Application of stabilized sludge to extensive green roofs in Shanghai: Feasibility and nitrogen leaching control. Sci. Total Environ. 2020, 732, 138898. [Google Scholar] [CrossRef]
- Vijayaraghavan, K.; Raja, F.D. Pilot-scale evaluation of green roofs with Sargassum biomass as an additive to improve runoff quality. Ecol. Eng. 2015, 75, 70–78. [Google Scholar] [CrossRef]
- Beecham, S.; Razzaghmanesh, M. Water quality and quantity investigation of green roofs in a dry climate. Water Res. 2015, 70, 370–384. [Google Scholar] [CrossRef]
- Gong, Y.; Yin, D.; Li, J.; Zhang, X.; Wang, W.; Fang, X.; Shi, H.; Wang, Q. Performance assessment of extensive green roof runoff flow and quality control capacity based on pilot experiments. Sci. Total Environ. 2019, 687, 505–515. [Google Scholar] [CrossRef]
- Ferrans, P.; Rey, C.V.; Pérez, G.; Rodríguez, J.P.; Díaz-Granados, M. Effect of green roof configuration and hydrological variables on runoff water quantity and quality. Water 2018, 10, 960. [Google Scholar] [CrossRef]
- Shafique, M.; Kim, R.; Rafiq, M. Green roof benefits, opportunities and challenges–A review. Renew. Sustain. Energy Rev. 2018, 90, 757–773. [Google Scholar] [CrossRef]
- Vijayaraghavan, K. Green roofs: A critical review on the role of components, benefits, limitations and trends. Renew. Sustain. Energy Rev. 2016, 57, 740–752. [Google Scholar] [CrossRef]
- Zhang, Q.; Miao, L.; Wang, X.; Liu, D.; Zhu, L.; Zhou, B.; Sun, J.; Liu, J. The capacity of greening roof to reduce stormwater runoff and pollution. Landsc. Urban Plan. 2015, 144, 142–150. [Google Scholar] [CrossRef]
- Gregoire, B.G.; Clausen, J.C. Effect of a modular extensive green roof on stormwater runoff and water quality. Ecol. Eng. 2011, 37, 963–969. [Google Scholar] [CrossRef]
- Buffam, I.; Mitchell, M.E.; Durtsche, R.D. Environmental drivers of seasonal variation in green roof runoff water quality. Ecol. Eng. 2016, 91, 506–514. [Google Scholar] [CrossRef]
- Carpenter, C.M.; Todorov, D.; Driscoll, C.T.; Montesdeoca, M. Water quantity and quality response of a green roof to storm events: Experimental and monitoring observations. Environ. Pollut. 2016, 218, 664–672. [Google Scholar] [CrossRef]
- Razzaghmanesh, M.; Beecham, S.; Kazemi, F. Impact of green roofs on stormwater quality in a South Australian urban environment. Sci. Total Environ. 2014, 470, 651–659. [Google Scholar] [CrossRef]
- Harper, G.E.; Limmer, M.A.; Showalter, W.E.; Burken, J.G. Nine-month evaluation of runoff quality and quantity from an experiential green roof in Missouri, USA. Ecol. Eng. 2015, 78, 127–133. [Google Scholar] [CrossRef]
- Hussain, R.; Ravi, K.; Garg, A. Influence of biochar on the soil water retention characteristics (SWRC): Potential application in geotechnical engineering structures. Soil Tillage Res. 2020, 204, 104713. [Google Scholar] [CrossRef]
- Kwapinski, W.; Byrne, C.M.; Kryachko, E.; Wolfram, P.; Adley, C.; Leahy, J.J.; Novotny, E.H.; Hayes, M.H. Biochar from biomass and waste. Waste Biomass Valorization 2010, 1, 177–189. [Google Scholar] [CrossRef]
- Wang, J.; Wang, S. Preparation, modification and environmental application of biochar: A review. J. Clean. Prod. 2019, 227, 1002–1022. [Google Scholar] [CrossRef]
- Shaaban, A.; Se, S.-M.; Mitan, N.M.M.; Dimin, M. Characterization of biochar derived from rubber wood sawdust through slow pyrolysis on surface porosities and functional groups. Procedia Eng. 2013, 68, 365–371. [Google Scholar] [CrossRef]
- Narzari, R.; Bordoloi, N.; Chutia, R.S.; Borkotoki, B.; Gogoi, N.; Bora, A.; Kataki, R. Biochar: An overview on its production, properties and potential benefits. Biol. Biotechnol. Sustain. Dev. 2015, 1, 13–40. [Google Scholar]
- Berek, A.K.; Hue, N.; Ahmad, A. Beneficial Use of Biochar to Correct Soil Acidity. The Food Provider. 2011. Available online: https://www.ctahr.hawaii.edu/huen/nvh/biochar.pdf (accessed on 1 July 2023).
- Smebye, A.; Alling, V.; Vogt, R.D.; Gadmar, T.C.; Mulder, J.; Cornelissen, G.; Hale, S.E. Biochar amendment to soil changes dissolved organic matter content and composition. Chemosphere 2016, 142, 100–105. [Google Scholar] [CrossRef]
- Rasa, K.; Heikkinen, J.; Hannula, M.; Arstila, K.; Kulju, S.; Hyväluoma, J. How and why does willow biochar increase a clay soil water retention capacity? Biomass Bioenergy 2018, 119, 346–353. [Google Scholar] [CrossRef]
- Blanco-Canqui, H. Biochar and water quality. J. Environ. Qual. 2019, 48, 2–15. [Google Scholar] [CrossRef] [PubMed]
- Kuoppamäki, K.; Hagner, M.; Lehvävirta, S.; Setälä, H. Biochar amendment in the green roof substrate affects runoff quality and quantity. Ecol. Eng. 2016, 88, 1–9. [Google Scholar] [CrossRef]
- D’Ambrosio, R.; Mobilia, M.; Khamidullin, I.F.; Longobardi, A.; Elizaryev, A.N. How substrate and drainage layer materials affect the hydrological performance of Green Roofs: CHEMFLO-2000 numerical investigation. In Proceedings of the International Conference on Computational Science and Its Applications, Cagliari, Italy, 13–16 September 2021; pp. 254–263. [Google Scholar]
- Huang, S.; Garg, A.; Mei, G.; Huang, D.; Chandra, R.B.; Sadasiv, S.G. Experimental study on the hydrological performance of green roofs in the application of novel biochar. Hydrol. Process. 2020, 34, 4512–4525. [Google Scholar] [CrossRef]
- Liao, W.; Drake, J.; Thomas, S.C. Biochar granulation, particle size, and vegetation effects on leachate water quality from a green roof substrate. J. Environ. Manag. 2022, 318, 115506. [Google Scholar] [CrossRef] [PubMed]
- Nguyen, C.N.; Muttil, N.; Tariq, M.A.U.R.; Ng, A.W. Quantifying the benefits and ecosystem services provided by green roofs—A review. Water 2021, 14, 68. [Google Scholar] [CrossRef]
- Cheng, Y.; Vaccari, D.A.; Johannesson, B.G.; Fassman-Beck, E. Multiyear Study on Phosphorus Discharge from Extensive Sedum Green Roofs with Substrate Amendments. J. Sustain. Water Built Environ. 2022, 8, 04022014. [Google Scholar] [CrossRef]
- Beck, D.A.; Johnson, G.R.; Spolek, G.A. Amending greenroof soil with biochar to affect runoff water quantity and quality. Environ. Pollut. 2011, 159, 2111–2118. [Google Scholar] [CrossRef] [PubMed]
- Kuoppamäki, K.; Lehvävirta, S. Mitigating nutrient leaching from green roofs with biochar. Landsc. Urban Plan. 2016, 152, 39–48. [Google Scholar] [CrossRef]
- Meng, R.; Zhang, Q.; Li, D.; Wang, H. Influence of Substrate Layer Thickness and Biochar on the Green Roof Capacity to Intercept Rainfall and Reduce Pollution in Runoff. Pol. J. Environ. Stud. 2021, 30, 4085–4103. [Google Scholar] [CrossRef]
- Xiong, W.; Li, J.; Wang, H.; Wu, Y.; Li, D.; Xue, J. Biochar Addition and the Runoff Quality of Newly Constructed Green Roofs: A Field Study. Sustainability 2023, 15, 4081. [Google Scholar] [CrossRef]
- Xu, C.; Liu, Z.; Cai, G.; Zhan, J. Nutrient leaching in extensive green roof substrate layers with different configurations. Environ. Sci. Pollut. Res. 2022, 29, 34278–34287. [Google Scholar] [CrossRef]
- Piscitelli, L.; Rivier, P.-A.; Mondelli, D.; Miano, T.; Joner, E.J. Assessment of addition of biochar to filtering mixtures for potential water pollutant removal. Environ. Sci. Pollut. Res. 2018, 25, 2167–2174. [Google Scholar] [CrossRef]
- Petreje, M.; Sněhota, M.; Chorazy, T.; Novotný, M.; Rybová, B.; Hečková, P. Performance study of an innovative concept of hybrid constructed wetland-extensive green roof with growing media amended with recycled materials. J. Environ. Manag. 2023, 331, 117151. [Google Scholar] [CrossRef]
- Nguyen, C.N.; Chau, H.-W.; Muttil, N. A Field Study to Investigate the Hydrological Characteristics of Newly Established Biochar-Amended Green Roofs. Water 2024, 16, 482. [Google Scholar] [CrossRef]
- Goldschmidt, A.M. Biochar Amendment of Green Roof Substrate: Effect on Vegetation, Nutrient Retention, and Hydrologic Performance; University of Cincinnati: Cincinnati, OH, USA, 2018. [Google Scholar]
- Werdin, J.; Conn, R.; Fletcher, T.D.; Rayner, J.P.; Williams, N.S.; Farrell, C. Biochar particle size and amendment rate are more important for water retention and weight of green roof substrates than differences in feedstock type. Ecol. Eng. 2021, 171, 106391. [Google Scholar] [CrossRef]
- Liao, W.; Drake, J.; Thomas, S.C. Biochar granulation enhances plant performance on a green roof substrate. Sci. Total Environ. 2022, 813, 152638. [Google Scholar] [CrossRef]
- Liao, W.; Sifton, M.A.; Thomas, S.C. Biochar granulation reduces substrate erosion on green roofs. Biochar 2022, 4, 61. [Google Scholar] [CrossRef]
- Lee, E.; Han, S.; Kim, H. Development of software sensors for determining total phosphorus and total nitrogen in waters. Int. J. Environ. Res. Public Health 2013, 10, 219–236. [Google Scholar] [CrossRef] [PubMed]
- Drapper, D.; Olive, K.; McAlister, T.; Coleman, R.; Lampard, J.-L. A Review of Pollutant Concentrations in Urban Stormwater Across Eastern Australia, After 20 Years. Front. Environ. Chem. 2022, 3, 853764. [Google Scholar] [CrossRef]
- Carvalho, S.C.; de Lima, J.L.; de Lima, M.I.P. Increasing the rainfall kinetic energy of spray nozzles by using meshes. Land Degrad. Dev. 2016, 27, 1295–1302. [Google Scholar] [CrossRef]
- Ricks, M.D.; Horne, M.A.; Faulkner, B.; Zech, W.C.; Fang, X.; Donald, W.N.; Perez, M.A. Design of a pressurized rainfall simulator for evaluating performance of erosion control practices. Water 2019, 11, 2386. [Google Scholar] [CrossRef]
- Blanquies, J.; Scharff, M.; Hallock, B. The Design and Construction of a Rainfall Simulator. 2003. Available online: https://www.owp.csus.edu/research/papers/papers/PP044.pdf (accessed on 1 May 2023).
- Zhang, Y.; Li, J.; Tan, J.; Li, W.; Singh, B.P.; Yang, X.; Bolan, N.; Chen, X.; Xu, S.; Bao, Y. An overview of the direct and indirect effects of acid rain on plants: Relationships among acid rain, soil, microorganisms, and plants. Sci. Total Environ. 2023, 873, 162388. [Google Scholar] [CrossRef]
- Ren, J.; Zhu, L.; Zhang, X.; Luo, Y.; Zhong, X.; Li, B.; Wang, Y.; Zhang, K. Variation characteristics of acid rain in Zhuzhou, Central China over the period 2011–2020. J. Environ. Sci. 2024, 138, 496–505. [Google Scholar] [CrossRef]
- Rusydi, A.F. Correlation between conductivity and total dissolved solid in various type of water: A review. IOP Conf. Ser. Earth Environ. Sci. 2018, 118, 012019. [Google Scholar] [CrossRef]
- Makineci, E.; Demir, M.; Kartaloglu, M. Acidity (pH) and electrical conductivity changes in runoff water from ditches of paved and unpaved forest roads. Balt. For. 2015, 21, 170–175. [Google Scholar]
- Novotný, M.; Šipka, M.; Miino, M.C.; Raček, J.; Chorazy, T.; Petreje, M.; Tošić, I.; Hlavínek, P.; Marković, M. Influence of different alternative organic substrates as fillings for green roofs on the quality of rainfall runoff. Sustain. Chem. Pharm. 2024, 38, 101465. [Google Scholar] [CrossRef]
- Peng, H.-Y.; Li, T.; Qi, Y.; He, Y.-P.; Huang, C.-Y.; Zhang, Z.-R. Control measure effects on the effluent quality from extensive green roofs based on stabilized sludge recycling. Huan Jing Ke Xue 2019, 40, 3612–3617. [Google Scholar]
- Li, F.; Liang, X.; Niyungeko, C.; Sun, T.; Liu, F.; Arai, Y. Effects of biochar amendments on soil phosphorus transformation in agricultural soils. Adv. Agron. 2019, 158, 131–172. [Google Scholar]
- Gao, S.; DeLuca, T.H.; Cleveland, C.C. Biochar additions alter phosphorus and nitrogen availability in agricultural ecosystems: A meta-analysis. Sci. Total Environ. 2019, 654, 463–472. [Google Scholar] [CrossRef] [PubMed]
- Malcolm, E.G.; Reese, M.L.; Schaus, M.H.; Ozmon, I.M.; Tran, L.M. Measurements of nutrients and mercury in green roof and gravel roof runoff. Ecol. Eng. 2014, 73, 705–712. [Google Scholar] [CrossRef]


| GR Test Bed | Biochar Amendment Rate (% v/v) | Biochar Application Method | Biochar Particle Size |
|---|---|---|---|
| GR-0 | 0 | NA | NA |
| GR-7.5M-M | 7.5 | Mixed | Medium |
| GR-7.5B-M | 7.5 | Bottom Layer | Medium |
| GR-15M-M | 15 | Mixed | Medium |
| GR-7.5M-F | 7.5 | Mixed | Fine |
| GR-7.5T-F | 7.5 | Top Dressing with Water | Fine |
Disclaimer/Publisher’s Note: The statements, opinions and data contained in all publications are solely those of the individual author(s) and contributor(s) and not of MDPI and/or the editor(s). MDPI and/or the editor(s) disclaim responsibility for any injury to people or property resulting from any ideas, methods, instructions or products referred to in the content. |
© 2024 by the authors. Licensee MDPI, Basel, Switzerland. This article is an open access article distributed under the terms and conditions of the Creative Commons Attribution (CC BY) license (https://creativecommons.org/licenses/by/4.0/).
Share and Cite
Nguyen, C.N.; Chau, H.-W.; Muttil, N. A Field Study to Assess the Impacts of Biochar Amendment on Runoff Quality from Newly Established Green Roofs. Hydrology 2024, 11, 112. https://doi.org/10.3390/hydrology11080112
Nguyen CN, Chau H-W, Muttil N. A Field Study to Assess the Impacts of Biochar Amendment on Runoff Quality from Newly Established Green Roofs. Hydrology. 2024; 11(8):112. https://doi.org/10.3390/hydrology11080112
Chicago/Turabian StyleNguyen, Cuong Ngoc, Hing-Wah Chau, and Nitin Muttil. 2024. "A Field Study to Assess the Impacts of Biochar Amendment on Runoff Quality from Newly Established Green Roofs" Hydrology 11, no. 8: 112. https://doi.org/10.3390/hydrology11080112
APA StyleNguyen, C. N., Chau, H.-W., & Muttil, N. (2024). A Field Study to Assess the Impacts of Biochar Amendment on Runoff Quality from Newly Established Green Roofs. Hydrology, 11(8), 112. https://doi.org/10.3390/hydrology11080112