Abstract
Surface runoff is a key component of the hydrological cycle and is essential for water resource management and water ecological balance in river basins. It is important to accurately reveal the spatial and temporal dynamics of regional surface runoff over long time scales and to quantify the impacts of climate change and human activities on surface runoff changes for sustainable water resources management and utilization. In this study, the Minjiang River Basin (Chengdu section) was selected, which has significant natural and anthropogenic variations, and a comprehensive analysis of runoff and its drivers will help to formulate an effective regional water resource management strategy. We mainly used SWAT to simulate the monthly-scale runoff in the Chengdu section of the Minjiang River Basin from 1990 to 2019 and combined SWAT-CUP to perform sensitivity analysis on the model parameters and Partial Least Squares Structural Equation Modeling (PLS-SEM) to quantitatively analyze the main drivers of the changes in surface runoff. The results show that the average multi-year runoff in the Minjiang River Basin (Chengdu section) ranges from 628.96 to 1088.46 mm, with an average value of 834.13 mm, and that the overall annual runoff in the past 30 years shows a fluctuating tendency. The goodness-of-fit of the PLS-SEM model is 0.507; the validity and reliability assessment indicated that the model was reasonable, and its results showed that economic and landscape factors had significant negative impacts on runoff changes, while natural factors had positive impacts on runoff changes, with path coefficients of −0.210, −0.131, and 0.367, respectively. Meanwhile, this study also identified two potential indirect impact pathways, i.e., the economic factors had an indirect negative impact on runoff by changing the distribution of landscapes, and the natural factors had indirect negative impacts on runoff by influencing economic activities, reflecting the complex interactions among economic activities, landscape distribution, and natural factors in influencing surface runoff. This study provides a research framework and methodology for quantitatively modeling surface runoff and the analysis of influencing factors in watersheds, contributing to a deeper scientific understanding of long-term runoff changes and the contribution of their drivers.
1. Introduction
Surface runoff, as a key element of the natural water cycle, plays an indispensable role in maintaining the stability of the global ecosystem, not only carrying the water and nutrients necessary for the functioning of the ecosystem but also profoundly affecting the overall health of the ecosystem [1,2]. As a core link in the water cycle, surface water flows through the precipitation transformation mechanism, nourishing freshwater ecosystems such as rivers and lakes and constituting a basic resource to support irrigated agriculture, industrial production, and urban water supply [3]. However, in the macro context of global climate change, the dynamic characteristics of surface runoff are undergoing significant and complex changes, which are impacting ecological security, water resources management strategies, and sustainable development pathways in multiple dimensions [4]. Specifically, a reduction in surface runoff or a change in its pattern could exacerbate the drought stress on ecosystems and affect biodiversity, while threatening the security of human society’s water supply and causing knock-on effects on agricultural production, economic development, and the lives of residents [5]. In order to respond effectively to these challenges, China is systematically addressing water resources, water ecology, water environment, and water disasters on the basis of river basins as a whole, with the aim of realizing harmonious coexistence between human beings and water [6,7].
Climate change and human activities, as important components of the changing environment, have significant impacts on hydrological processes, the spatial and temporal distribution of water resources quantity and quality, and bring about hydrological effects that are of deep concern [8]. The hydrological processes in the watershed are complex and variable, resulting in surface runoff with obvious spatial and temporal distribution characteristics, which are jointly influenced by natural and social factors [9,10,11]. On the one hand, climate change climates alter the amount, frequency, and pattern of rainfall, increase extreme weather events, and affect vegetation, water evapotranspiration, and soil moisture, thereby altering surface runoff volume, peaks, and fluctuation rates [12,13,14]. On the other hand, human activities such as urbanization that change the type and structure of the landscape also affect the distribution and use of surface precipitation; especially the increase in impermeable surfaces promotes evapotranspiration of precipitation and surface runoff and reduces infiltration [15], which is more pronounced in agricultural and urban watersheds [9]. This also leads to an increase in the conflict between water supply and demand, which should be given adequate attention by the management of watershed resources. Therefore, identifying the main drivers of runoff change is key to understanding changes in available water resources.
Current hydrologic simulation methods: commonly used models to simulate surface runoff include the Soil and Water Conservation Service Curve Numbers (SCS-CN) model, the Stormwater Management Model (SWMM), and the SWAT model. Among them, the SCS-CN model is simple in structure and easy to operate but lacks physical significance and is difficult to reflect the spatial heterogeneity of surface runoff [16,17,18]. The SWMM model is powerful and flexible but requires a large number of parameters and measurements to be calibrated and validated [19]. The SWAT model is suitable for simulating hydrologic events of hydrologic events and long time series at the basin scale. It is widely used in different regions of the basin and complex environments [20,21,22]. Therefore, the use of the SWAT model can provide an important source of data on water resources and the hydrological cycle in watersheds in regions where hydrological observation data are lacking. However, some studies have also argued that high input data requirements such as those of the SWAT model and large uncertainties in the model (e.g., input uncertainty, parameter uncertainty, and structural uncertainty) can lead to large errors or even distortions [23]. These factors limit the applicability of hydrologic modeling methods for assessing the impacts of climate and land use or cover change on the hydrologic cycle [24]. The PLS-SEM method is a structural equation modeling approach that allows for the consideration of relationships between observed and latent variables, as well as causal relationships between latent variables [25,26], and is an important method for identifying the impacts of climate change and human activities on runoff.
The Minjiang River is a first-class tributary of the Yangtze River and the main water system of the Chengdu Plain, sustaining the regional water supply and the health of the water environment. The Minjiang River Basin (Chengdu section) has been greatly affected by climate change, landscape changes, and urbanization in recent years, which has led to an imbalance between the supply and demand of water resources, as well as the unfair distribution and inefficient utilization of water resources. This has, in turn, decreased the security and restricted the sustainable development of the region. The main objectives of this study were (1) to reveal the spatial and temporal distribution characteristics of runoff in the watershed by simulating accurate surface runoff data with the SWAT model and (2) to reveal the main driving factors affecting runoff and the interrelationships among the factors using the PLS-SEM model. The results of the study will help to optimize water management strategies in the basin, improve the efficiency of water resource use, and protect the water environment.
2. Materials and Methods
2.1. Study Site
The Minjiang River Basin is a first-class tributary of the upper reaches of the Yangtze River. The territory of Chengdu City enters the basin from the Waijiang Gate of Dujiangyan City in the northwest and flows out from Dongheba of Dengshuang Township in Xinjin County in the southeast (Figure 1). This area of the basin has a total length of 81 km and a watershed area of 5462.69 km2. The upstream to downstream of the Longxi River, Baisha River, West River, and South River are rich in water resources. It is at a latitude of 30°05′–31°15′ North and a longitude of 103°00′–104°00′ East, located in the western Sichuan Plateau to the Sichuan Basin Transitional Interchange Zone, with a subtropical humid monsoon climate [27]; the terrain is high in the west and low in the east, with medium-high mountainous areas in the west, and plains in the east. The elevation is between 341 and 4020 m, and with the increase in altitude the heat is reduced; the emergence of warm winter and cool west of the two climate types coexist in the pattern. The basin has four distinct seasons and abundant heat, with an annual average temperature of 16–17.5 °C, and an annual average active cumulative temperature of ≥10 °C of 4700–5300 °C; the summers are hot and rainy, with abundant rainfall, and the annual average precipitation is about 975.89–1124.5 mm, which mainly concentrates in June–September, accounting for about 60% of the total precipitation of the year [28,29]. Soil types in the watershed are diverse, mainly including purple soil, yellow-brown soil, and rice soil [30]. In terms of land use types, the main land use types in the west are forest land and grassland, while cultivated land dominates in the east.
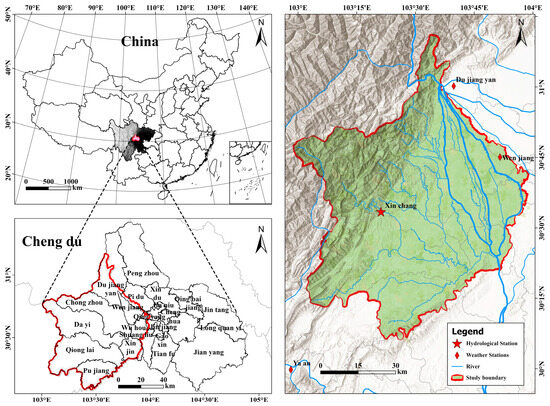
Figure 1.
Location of the study area.
2.2. Data Sources
The study data included land use, topographic, climatic, soil, hydrological, and socio-economic data (Table 1). Land use data were classified into cropland, forest, grassland, watershed, construction land, and bare land. The watershed soil database was constructed from soil data that used the FAO-90 classification standard in the World Soil Database (HWSD). Meteorological data included day-by-day rainfall, air temperature, evaporation, relative humidity, and wind speed, which were measured by the three meteorological stations in the study area from 1979 to 2019 and simulated using the weather generator simulation to construct the meteorological database. Hydrological data included the measured monthly runoff data from Chengdu Xinchang Station as the evaluation and validation data of the model.

Table 1.
Data types and sources.
2.3. Study Framework
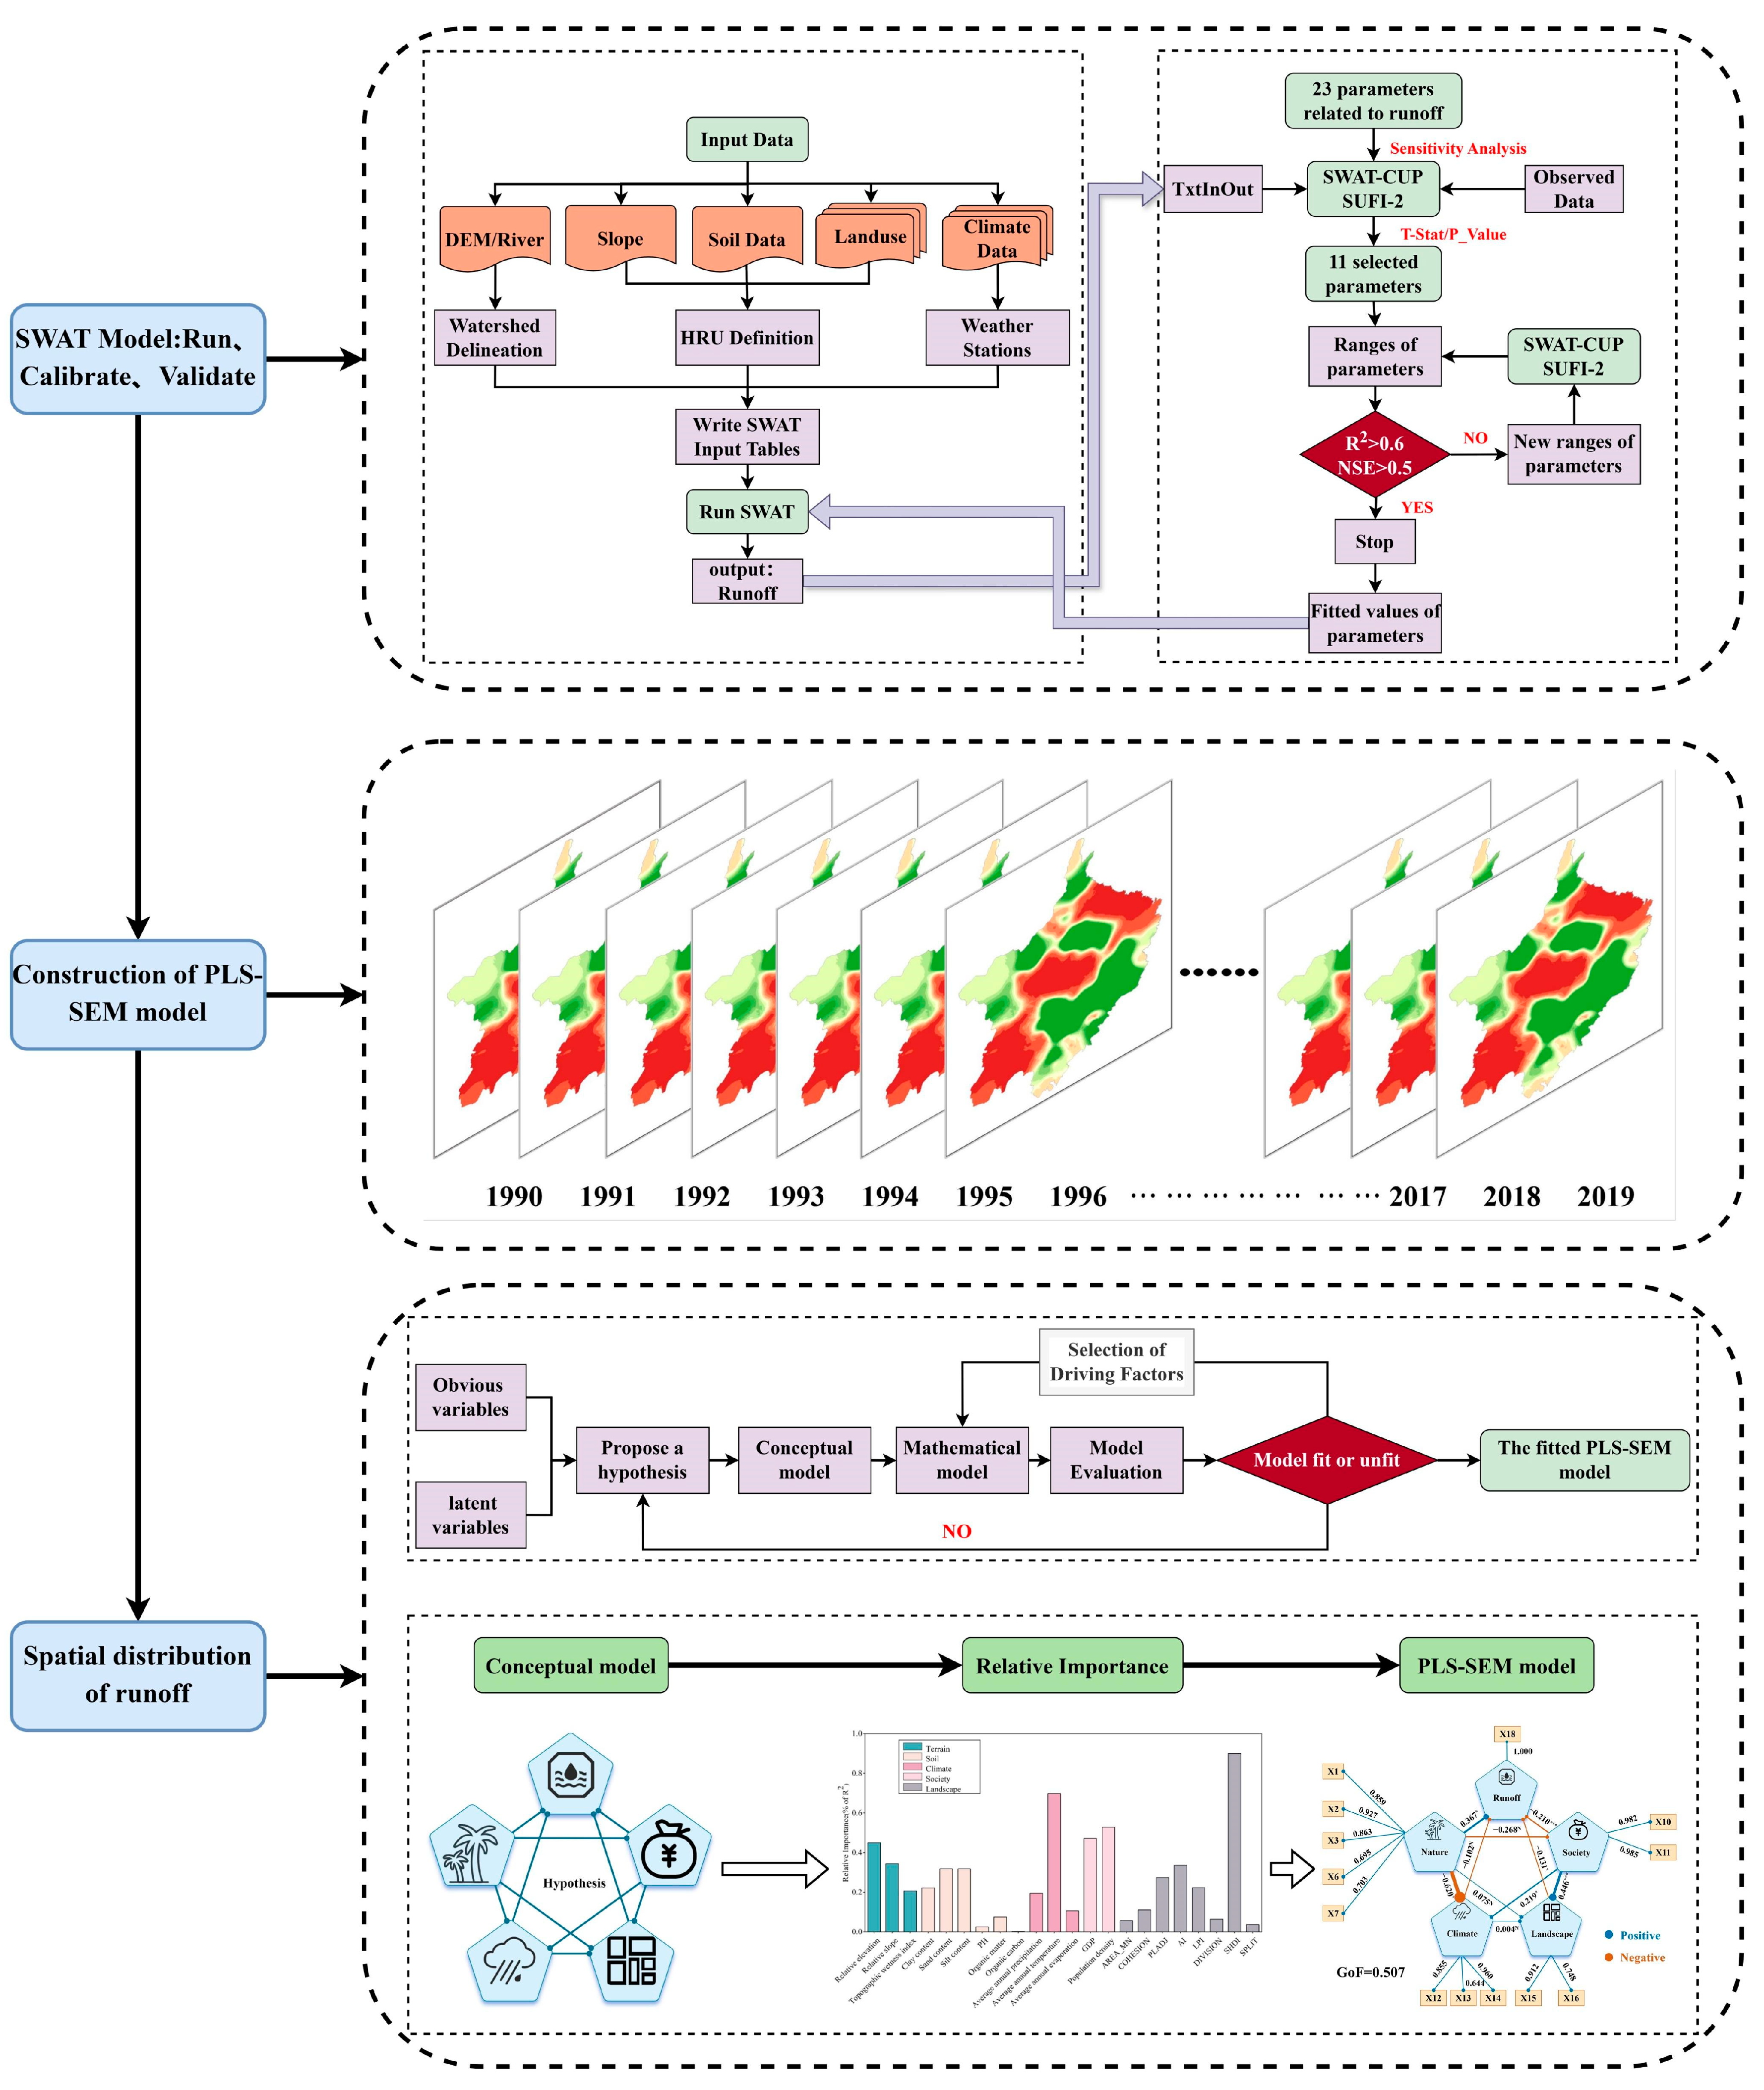
In this study, the SWAT model was used to simulate and analyze the runoff data of the study area over the last 30 years to reveal its spatial and temporal distribution characteristics. Additionally, these natural, climatic, social, and landscape factors were selected, and the PLS-SEM model was used to quantitatively assess the relationship between each driver and runoff changes. The specific research framework is shown in Figure 2.
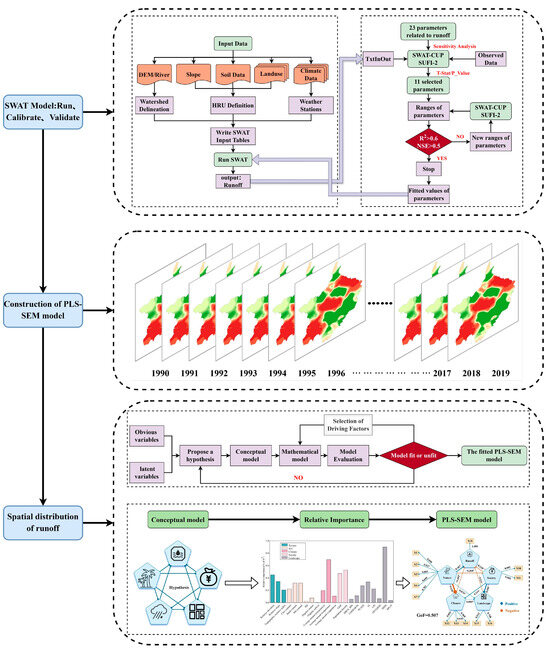
Figure 2.
Study framework. Notes: * indicates that the test of significance passed 90 percent; *** indicates that the test of significance passed 99 percent; N indicates that the test of significance was not passed.
2.4. Study Methods
2.4.1. SWAT Model Construction and SUFI-2 Algorithm
The SWAT (Soil and Water Assessment Tool) model is a distributed hydrological model based on process and physical principles that is capable of simulating hydrological changes over a long time series in a watershed [31,32,33]. In this study, the ArcSWAT2012 extension module was used for the simulation of hydrological processes in the study basin [34]. Based on the hydrological and DEM data, the optimal threshold of the catchment area was determined to be 150 hm2 after several experiments, which divided the study area into 89 sub-catchments. The study area was divided into 826 hydrological response units (HRUs) by setting the thresholds for land use area, soil area, and slope at 10%, 15%, and 10%, respectively.
The SUFI-2 uncertainty analysis algorithm in SWAT-CUP was used for model parameter estimation and uncertainty analysis. The algorithm uses the Nash efficiency coefficient (NES) and the coefficient of determination (R2) to evaluate the fit of the model [35,36]; that is, the model simulation results are better when R2 ≥ 0.6 and NSE > 0.5.
In this study, the model rate period was set as 1978–1981, of which 1978 was the warm-up period to reduce the effect of the initial conditions on model accuracy. The model validation period was 1982–1985, of which 1982 was the warm-up period. The SWAT-CUP software was chosen to evaluate and validate the model with six runs of 500 iterations each to obtain the best fit.
2.4.2. Mann–Kendall Test and Theil–Sen Slope
Both parametric and non-parametric trend tests can be used to test for significant trends in time series. The parametric trend test requires that the data are independent and follow a normal distribution, while the non-parametric trend test only requires that the data are independent [37]. The Theil–Sen median trend analysis was combined with the Mann–Kendall test to detect trends in long time-series data [38]. The Mann–Kendall test statistic S is calculated as follows:
Note that if S > 0, later observations in the time series tend to be larger than those that occur earlier in the time series, while the opposite is true if S < 0.
sgn (xi − xj) is the sign function as follows:
The variance of S is expressed as:
where n is the number of samples. When n > 10, the standard normal statistical variable Z is expressed as follows:
where for a given significance level α, if , then the original hypothesis is unacceptable, i.e., there is a significant upward or downward trend in the time series data at the significance test level. A positive value of Z indicates an upward trend, a negative value indicates a downward trend, and the absolute value of Z is greater than or equal to 1.65, 1.96, and 2.58, which means that it passes the significance test with confidence level of 90%, 95%, and 99%, respectively.
The Theil–Sen slope is calculated as follows:
Here, 1 < j < i < n; when slope > 0, the time-series data shows an upward trend; when slope < 0, the time-series data show a downward trend.
In this study, linear trend regression analyses were performed on the average runoff volume from 1990–2019, as well as on precipitation, air temperature, and evaporation. The Theil–Sen median trend analysis and Mann–Kendall test were used to analyze the mean annual runoff in 89 sub-basins, and spatial interpolation was used to obtain the trend in the mean annual runoff at the image metric scale for the whole region from 1990 to 2019. According to the calculation of the Theil–Sen median trend analysis slope value, the trend was divided into two categories: upward trend (slope > 0) and downward trend (slope < 0). The confidence level of the significance test in the Mann–Kendall test was selected to be 95%, and the result was finally classified into significant change (|Z| > 1.96) and non-significant change (|Z| < 1.96).
2.4.3. Relative Importance Analysis
Relative importance analysis is a method used to assess the extent to which multiple explanatory variables influence the response variable, helping us to understand the contribution of each variable in the model. In order to determine the relative contribution of drivers such as topography and geomorphology, soil, climate, economy, and landscape to changes in surface runoff, we used a generalized linear model to fit surface runoff and the associated drivers and chose “lmg” to quantify the relative contribution of each driver to surface runoff in order to quantify the relative importance of these drivers [39].
Among the landscape factors, two types, connectivity indicators and fragmentation, were selected to reflect the changes in landscape structure, of which the connectivity indicators include AREA_MN (Patch Area_Mean), COHESION (Patch Cohesion Index), PLADJ (Percentage of Landscape), AI (Aggregation Index), and LPI (Largest Patch Index), and the fragmentation indicators include DIVISION (Landscape Division Index), SHDI (Shannon’s Diversity Index), and SPLIT (Splitting Index). Fragstats 4.2 software was used to calculate the values of each landscape indicator (https://fragstats.org/index.php/documentation, accessed on 26 June 2024), and then the relative importance analysis was carried out using the “relaimpo” package in R language (https://cran.r-project.org/web/packages/relaimpo/index.html, accessed on 26 June 2024).
2.4.4. The Partial Least Squares Structural Equation Modeling (PLS-SEM) Construction
The PLS-SEM model uses partial least squares regression to estimate the parameters and is not constrained by data normality, sample size, model complexity, or the type of measurement. Variables in the PLS-SEM model were categorized into latent and observed variables. Variables that cannot be directly measured are called latent variables, and observed variables are variables that can be directly measured. The model consists of two parts: the measurement model and the structural model, where the measurement model describes the relationship between latent and observed variables. The structural model describes the relationship between the latent variables. To ensure the reliability and validity of the model, a series of evaluation metrics is usually adopted to assess the reliability, validity, and predictive ability of the PLS-SEM model. The unidimensionality of the observed variables was evaluated using Dillon–Goldstein’s rho, with values > 0.7 indicating that the unidimensionality test was passed. The internal consistency reliability was assessed using composite reliability (CR), which usually has a value > 0.7. The average variance extracted (AVE) was used to verify convergent validity and was required to be greater than 0.5. The loading represented the correlation between the latent variable and its observed variable, with values > 0.6 considered to be acceptable. The overall fit integrates the fit of the measurement model and the structure, and greater than 0.5 indicates that the model is fitted with high precision [40,41,42].
In this study, the PLS-SEM model was used to analyze the complex relationships between the drivers and to evaluate the intrinsic factors affecting changes in surface runoff. The establishment of the PLS-SEM model consisted of the following steps: (1) identifying obvious and potential variables, making assumptions about the relationships between variables based on a priori knowledge or literature inquiries, and constructing a conceptual model based on these assumptions; (2) converting the conceptual model into a mathematical model using the PLS-SEM model; and (3) fitting the model, checking the effect of the fit, and—if the model was not well fitted—eliminating variables based on the results and re-correcting the model until the model results reached the optimal level. In this study, natural factors, climatic factors, economic factors, and landscape factors were selected as four latent variables in the model, including seventeen apparent variable factors. The description of each variable is shown in Table 2.
Table 2.
Description of latent variables driving runoff variability.
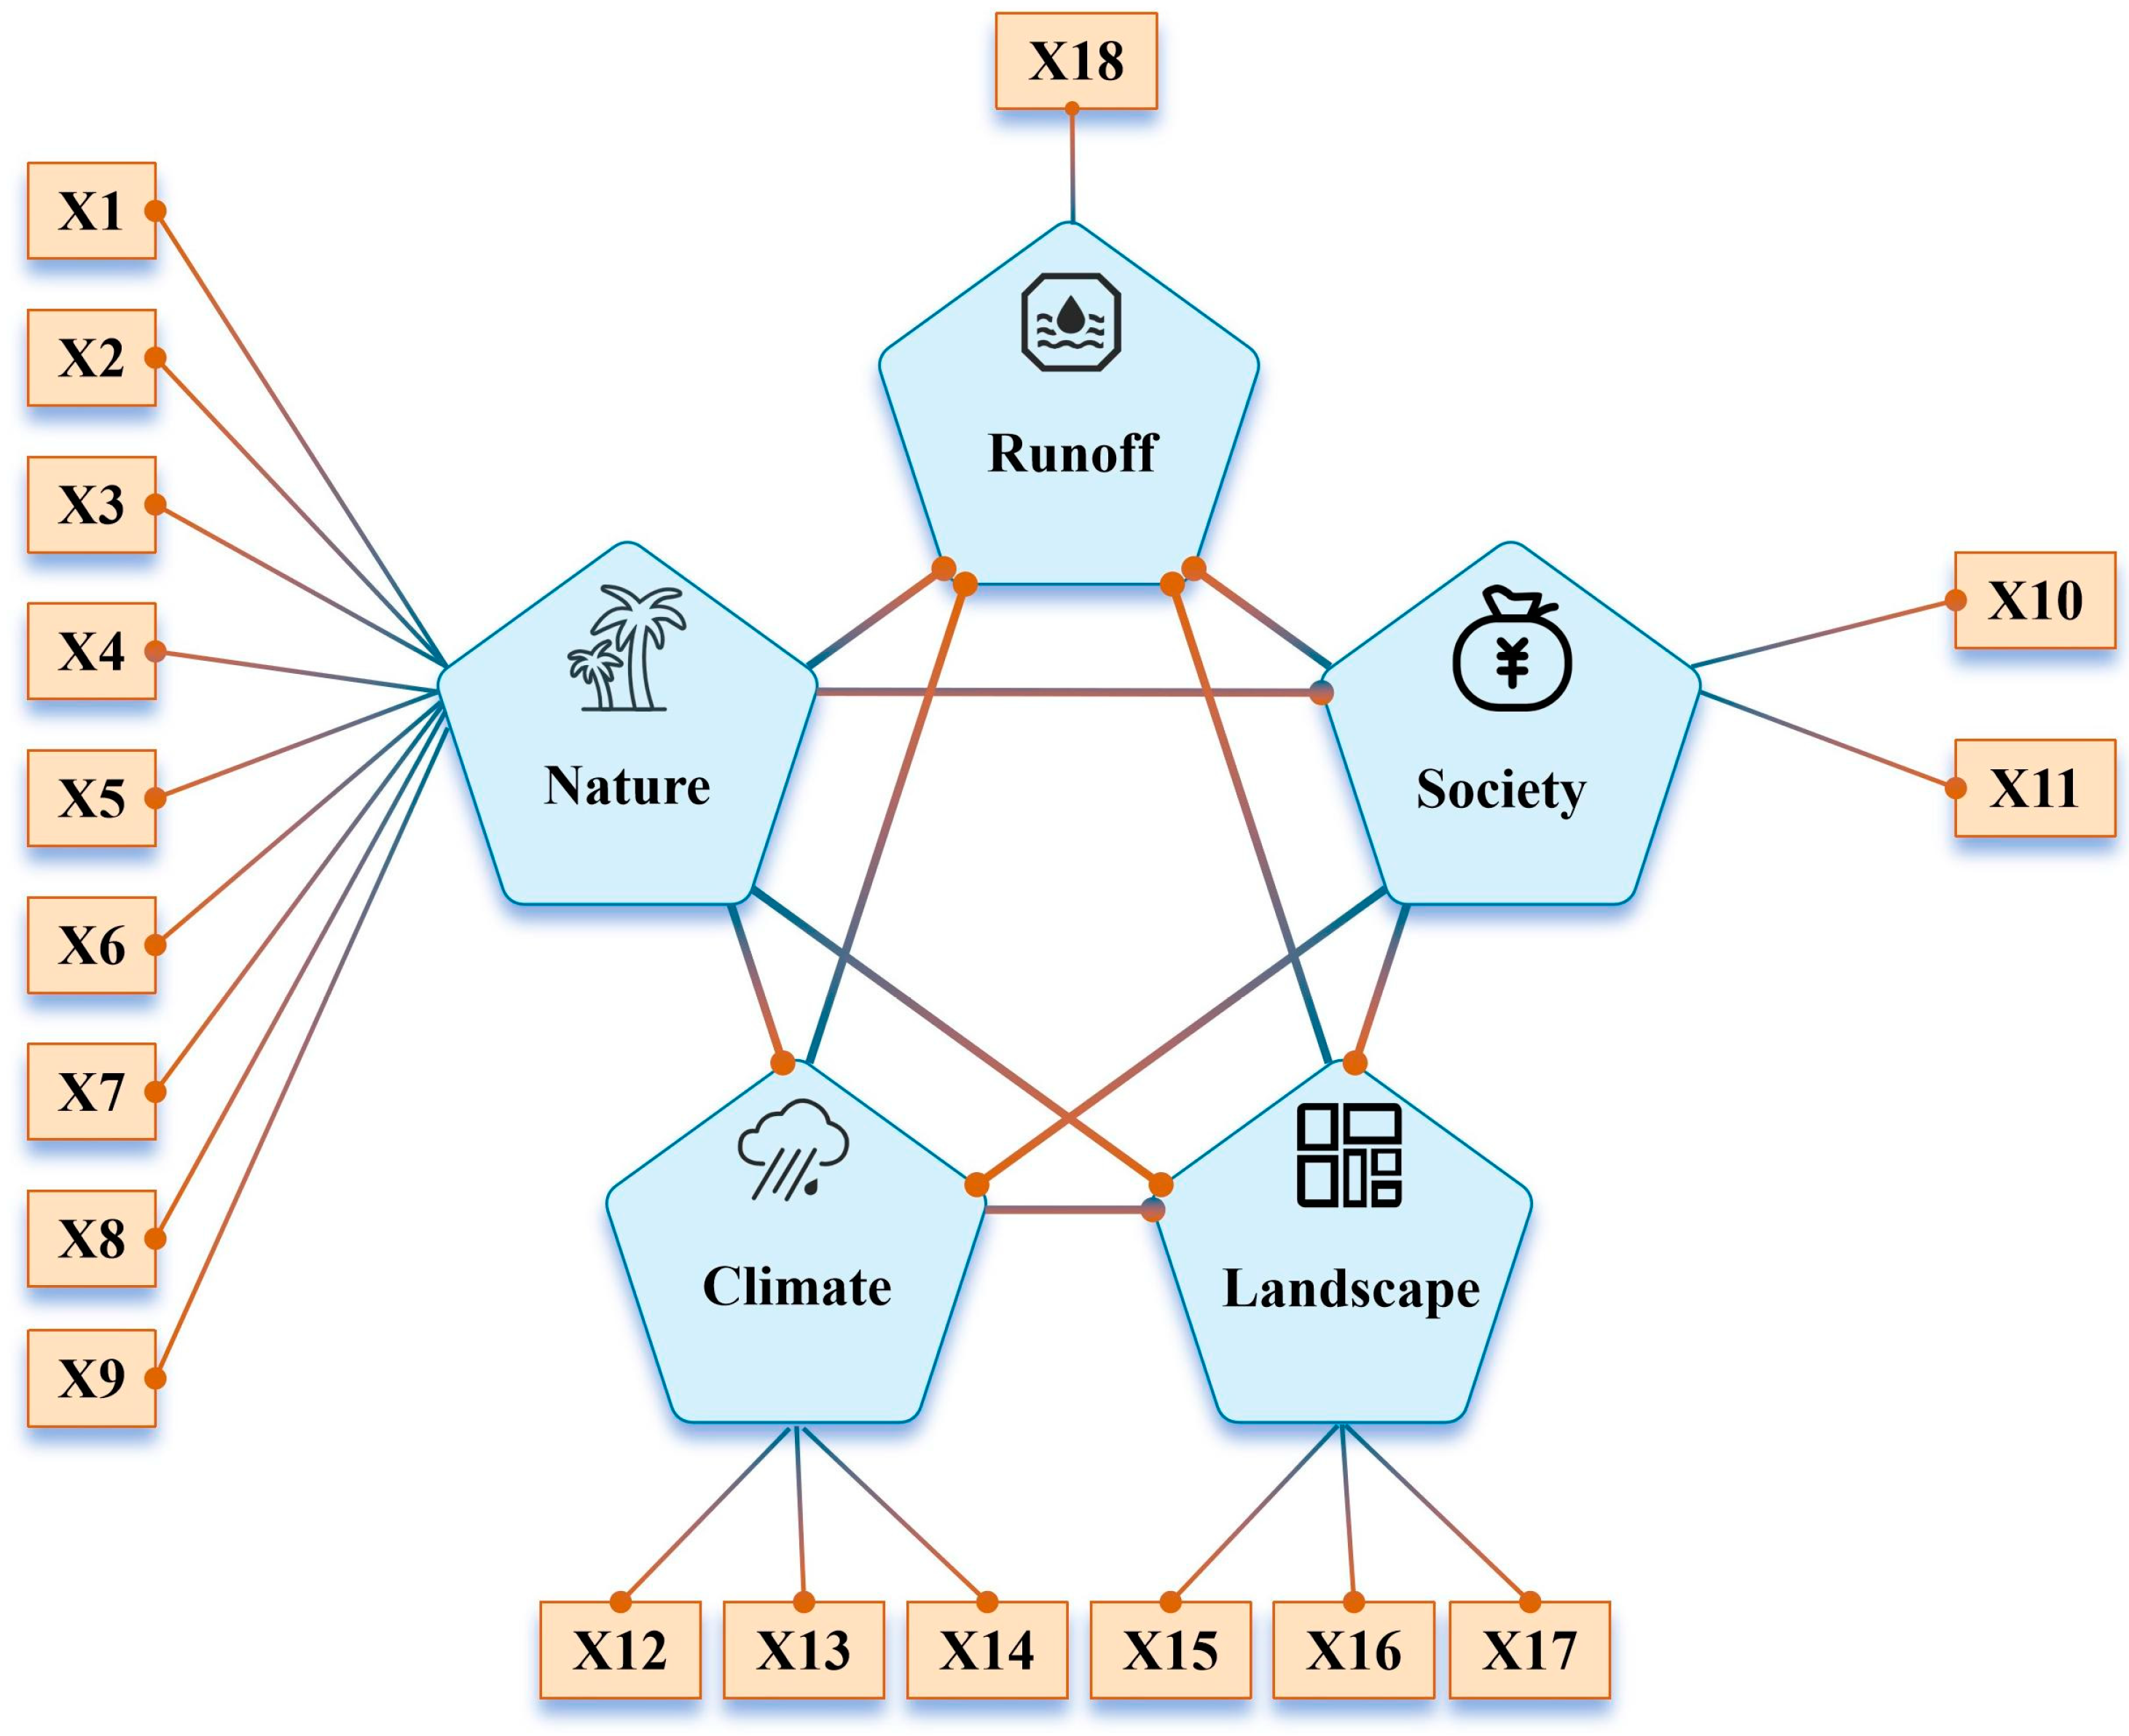
The following hypotheses were formulated, considering the characteristics of the region’s natural and social environment: 1. Surface runoff is directly or indirectly influenced by several natural, climatic, economic, and landscape factors. 2. Natural conditions determine the level of the economy, which in turn has a feedback effect on climate change and thus influences changes in surface runoff. 3. Topographic and climatic factors are the main factors influencing the level of economy, and they further influence the amount of surface runoff through the mediating effect of the level of economy. 4. The landscape factor is a combination of natural, climatic, and economic factors, which reflects the degree of human use and modification of the natural environment and also impacts surface runoff. To test these hypotheses, a conceptual model was constructed and the relationship between the factors was graphically presented, as shown in the model framework in Figure 3.
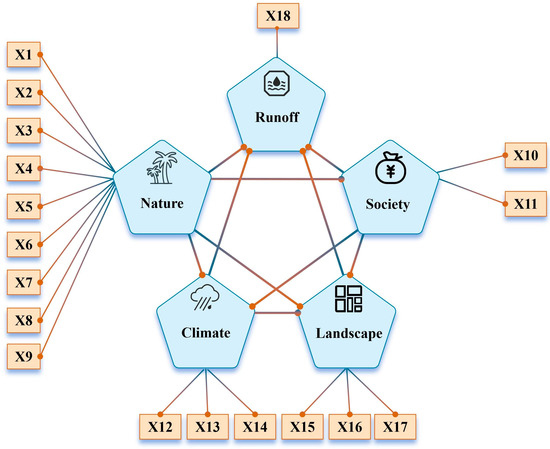
Figure 3.
Conceptual model of the PLS-SEM model. Note: X1-Relative elevation; X2-Relative slope; X3-Topographic humidity index; X4-Soil PH; X5-Clay contents; X6-Sand contents; X7-Silt contents; X8-Organic matter contents; X9-Organic carbon contents; X10-Population density; X11-GDP; X12-Average annual precipitation; X13-Average annual temperature; X14-Average annual evaporation; X15-Landscape change; X16-Landscape connectivity; X17-Landscape fragmentation; X18-Runoff.
In this study, each hydrological response unit was taken as a sample set and its sample value was taken as the raster mean value of each hydrological response unit. Invalid or missing samples were excluded, and a total of 349 valid samples were obtained. Based on these samples, a PLS-SEM model of the Minjiang River Basin (Chengdu section) was constructed using the ‘plspm’ package in R language.
3. Results
3.1. The Construction of the SWAT Model
In this study, a t-test was used to determine the sensitivity of each parameter, 23 parameters related to runoff were selected, and the results of the sensitivity analysis are shown in Table 3. The results show that different parameters have different sensitivities to runoff, with the top three sensitivities being GWQMN, RCHRG_DP, and CN2, sequentially. The parameters SURLAG, SLSUBBSN, OV_N, BIOMIX, GW_DELAY, and SOL_AWC were also more sensitive to runoff, while the other parameters were not.
Table 3.
Parameter sensitivity analysis results.
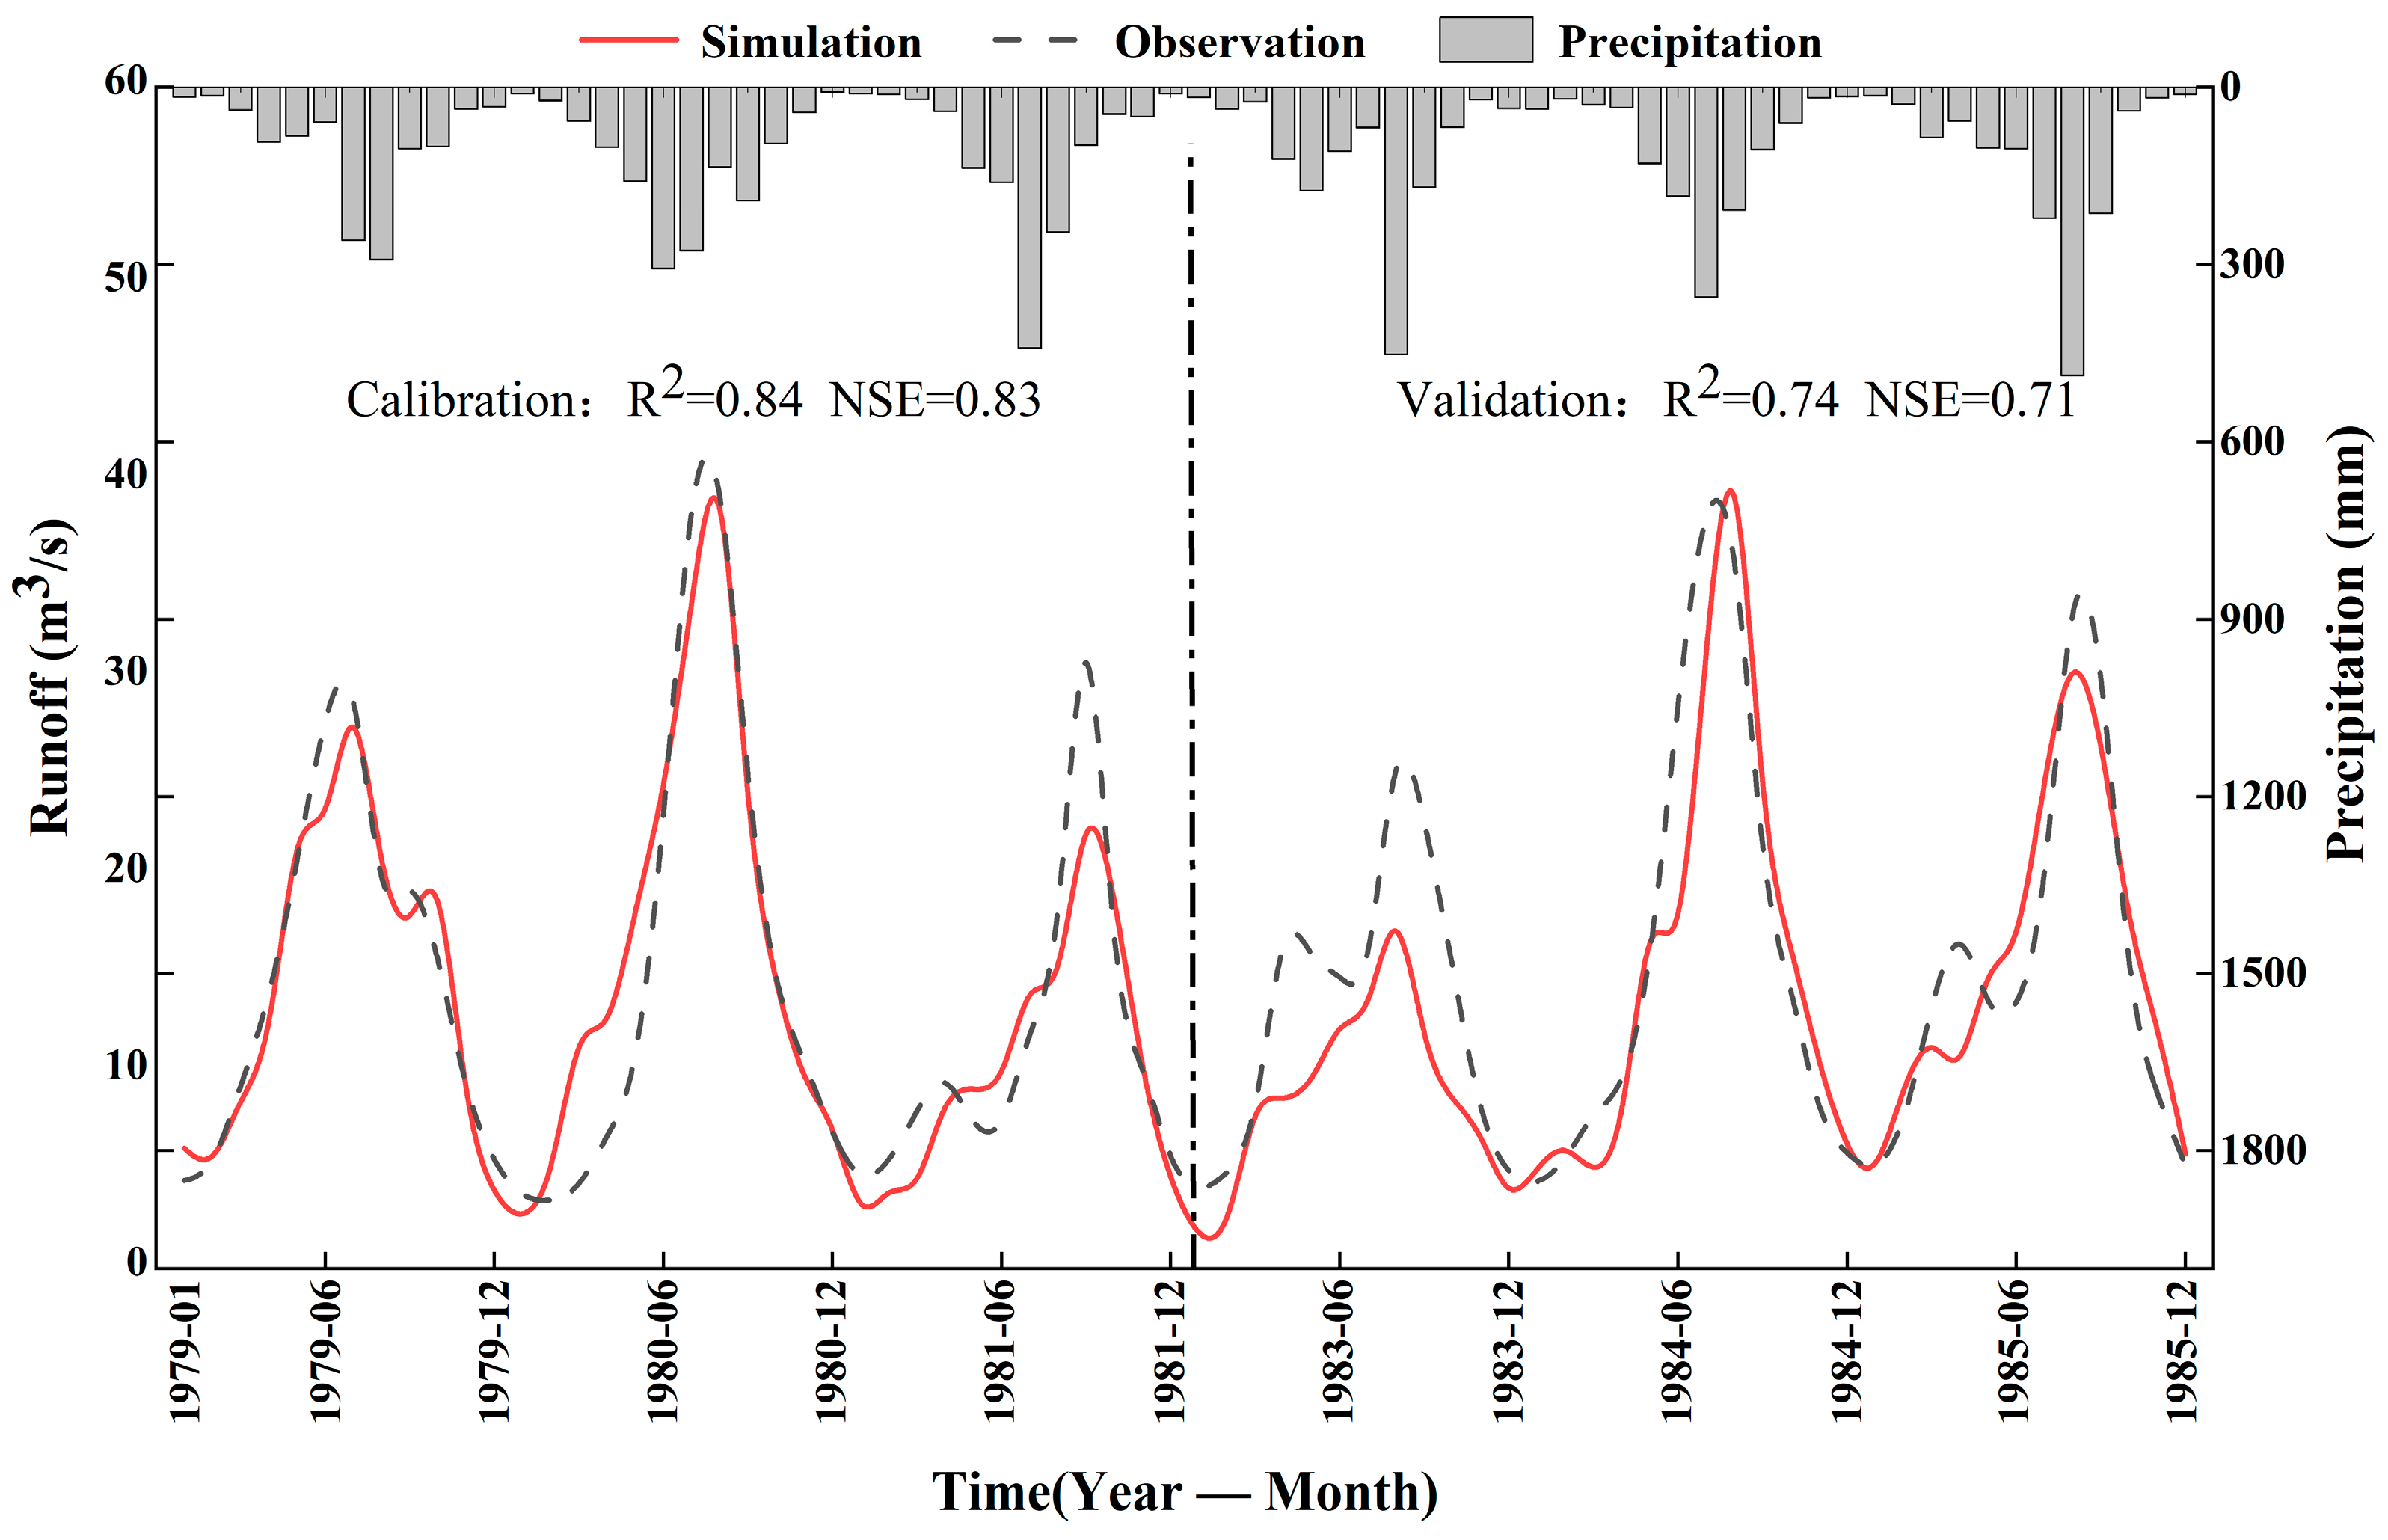
The rate and validation of the month-by-month runoff from the Xinchang hydrological station were investigated according to the 11 parameters with the highest sensitivity, including GWQMN, RCHRG_DP, CN2, etc. The results of the fitting results show that (Figure 4) the NSE in the validation period was 0.71 and the R2 was 0.74; the rating period was 0.83 and the R2 was 0.84. This indicates that the SWAT model effectively simulated the monthly runoff of the Minjiang River Basin, Chengdu.
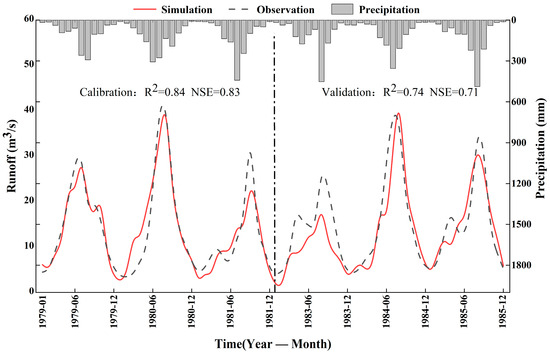
Figure 4.
Comparison of SWAT modeled and measured values of monthly runoff from new field stations for the calibration and validation period.
3.2. Runoff Simulation Analysis
3.2.1. Inter-Annual Variability of Runoff
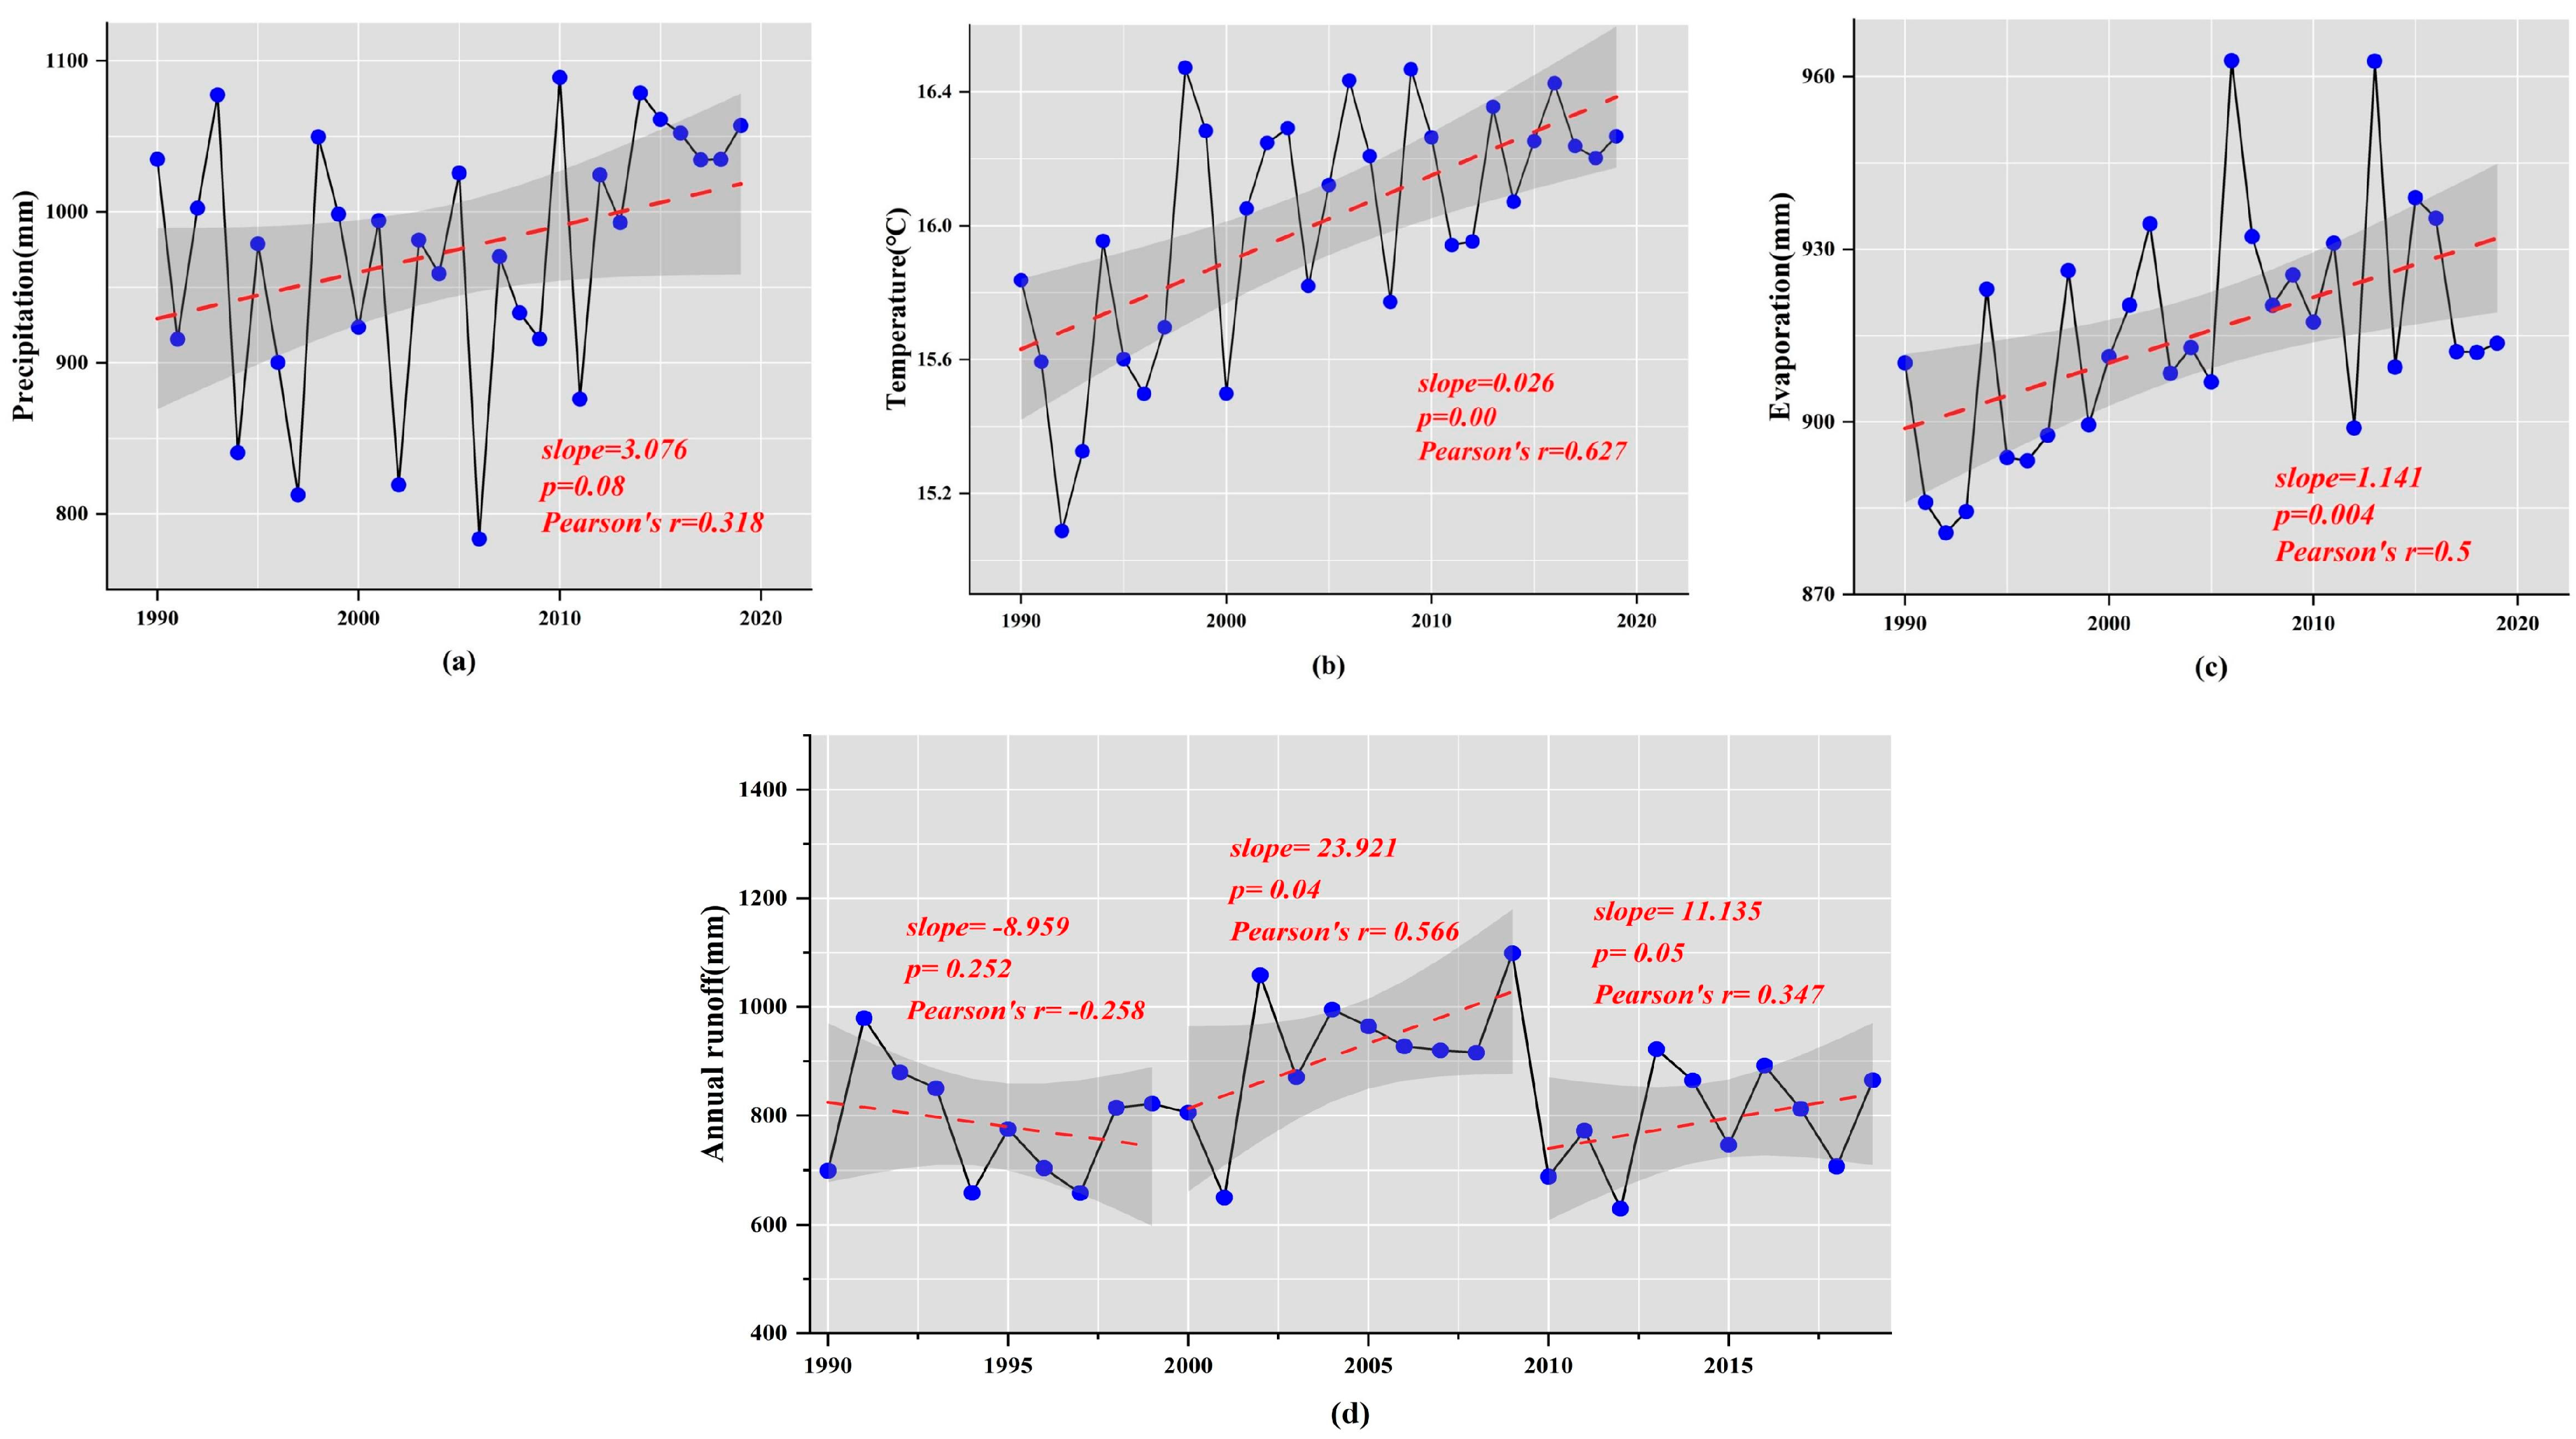
The average runoff in the Minjiang River Basin (Chengdu section) from 1990 to 2019 was 628.96–1088.46 mm, with a multi-year average of 834.13 mm. The inter-annual fluctuation of runoff is obvious, in which the runoff showed a non-significant decreasing trend with a rate of change of −8.959 mm·a−1 from 1990 to 1999, and a significant increasing trend with a rate of change of 23.921 mm·a−1 and 11.135 mm·a−1 from 2000 to 2009 and from 2010 to 2019. The mean annual temperature and mean annual evaporation in the watershed showed a significant upward trend, with mean linear rates of increase of 0.026°C·a−1 and 1.141 mm·a−1, respectively; the trend of mean annual precipitation was not significant, with a mean linear rate of increase of 2.172 mm·a−1. Meanwhile, the trends of runoff volume changes in different seasons were not different, in which the abundant and dry water periods showed an increasing trend, with an average linear growth rate of 0.804 mm·a−1 and 0.539 mm·a−1, respectively; the flat water period showed a decreasing trend, with an average linear decreasing rate of 0.126 mm·a−1 (Figure 5).
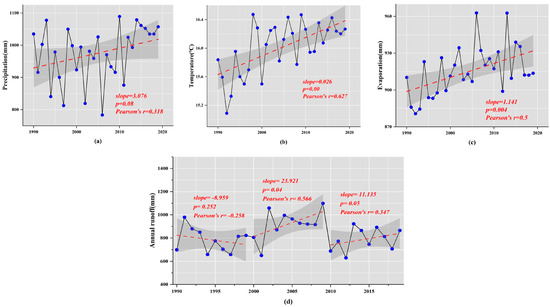
Figure 5.
Inter-annual changes in mean annual precipitation (a), mean annual temperature (b), mean annual evaporation (c), and runoff (d); 1990–2019. Notes: The dotted red line is a linear trend line.
3.2.2. Characteristics of the Spatial Distribution of Runoff
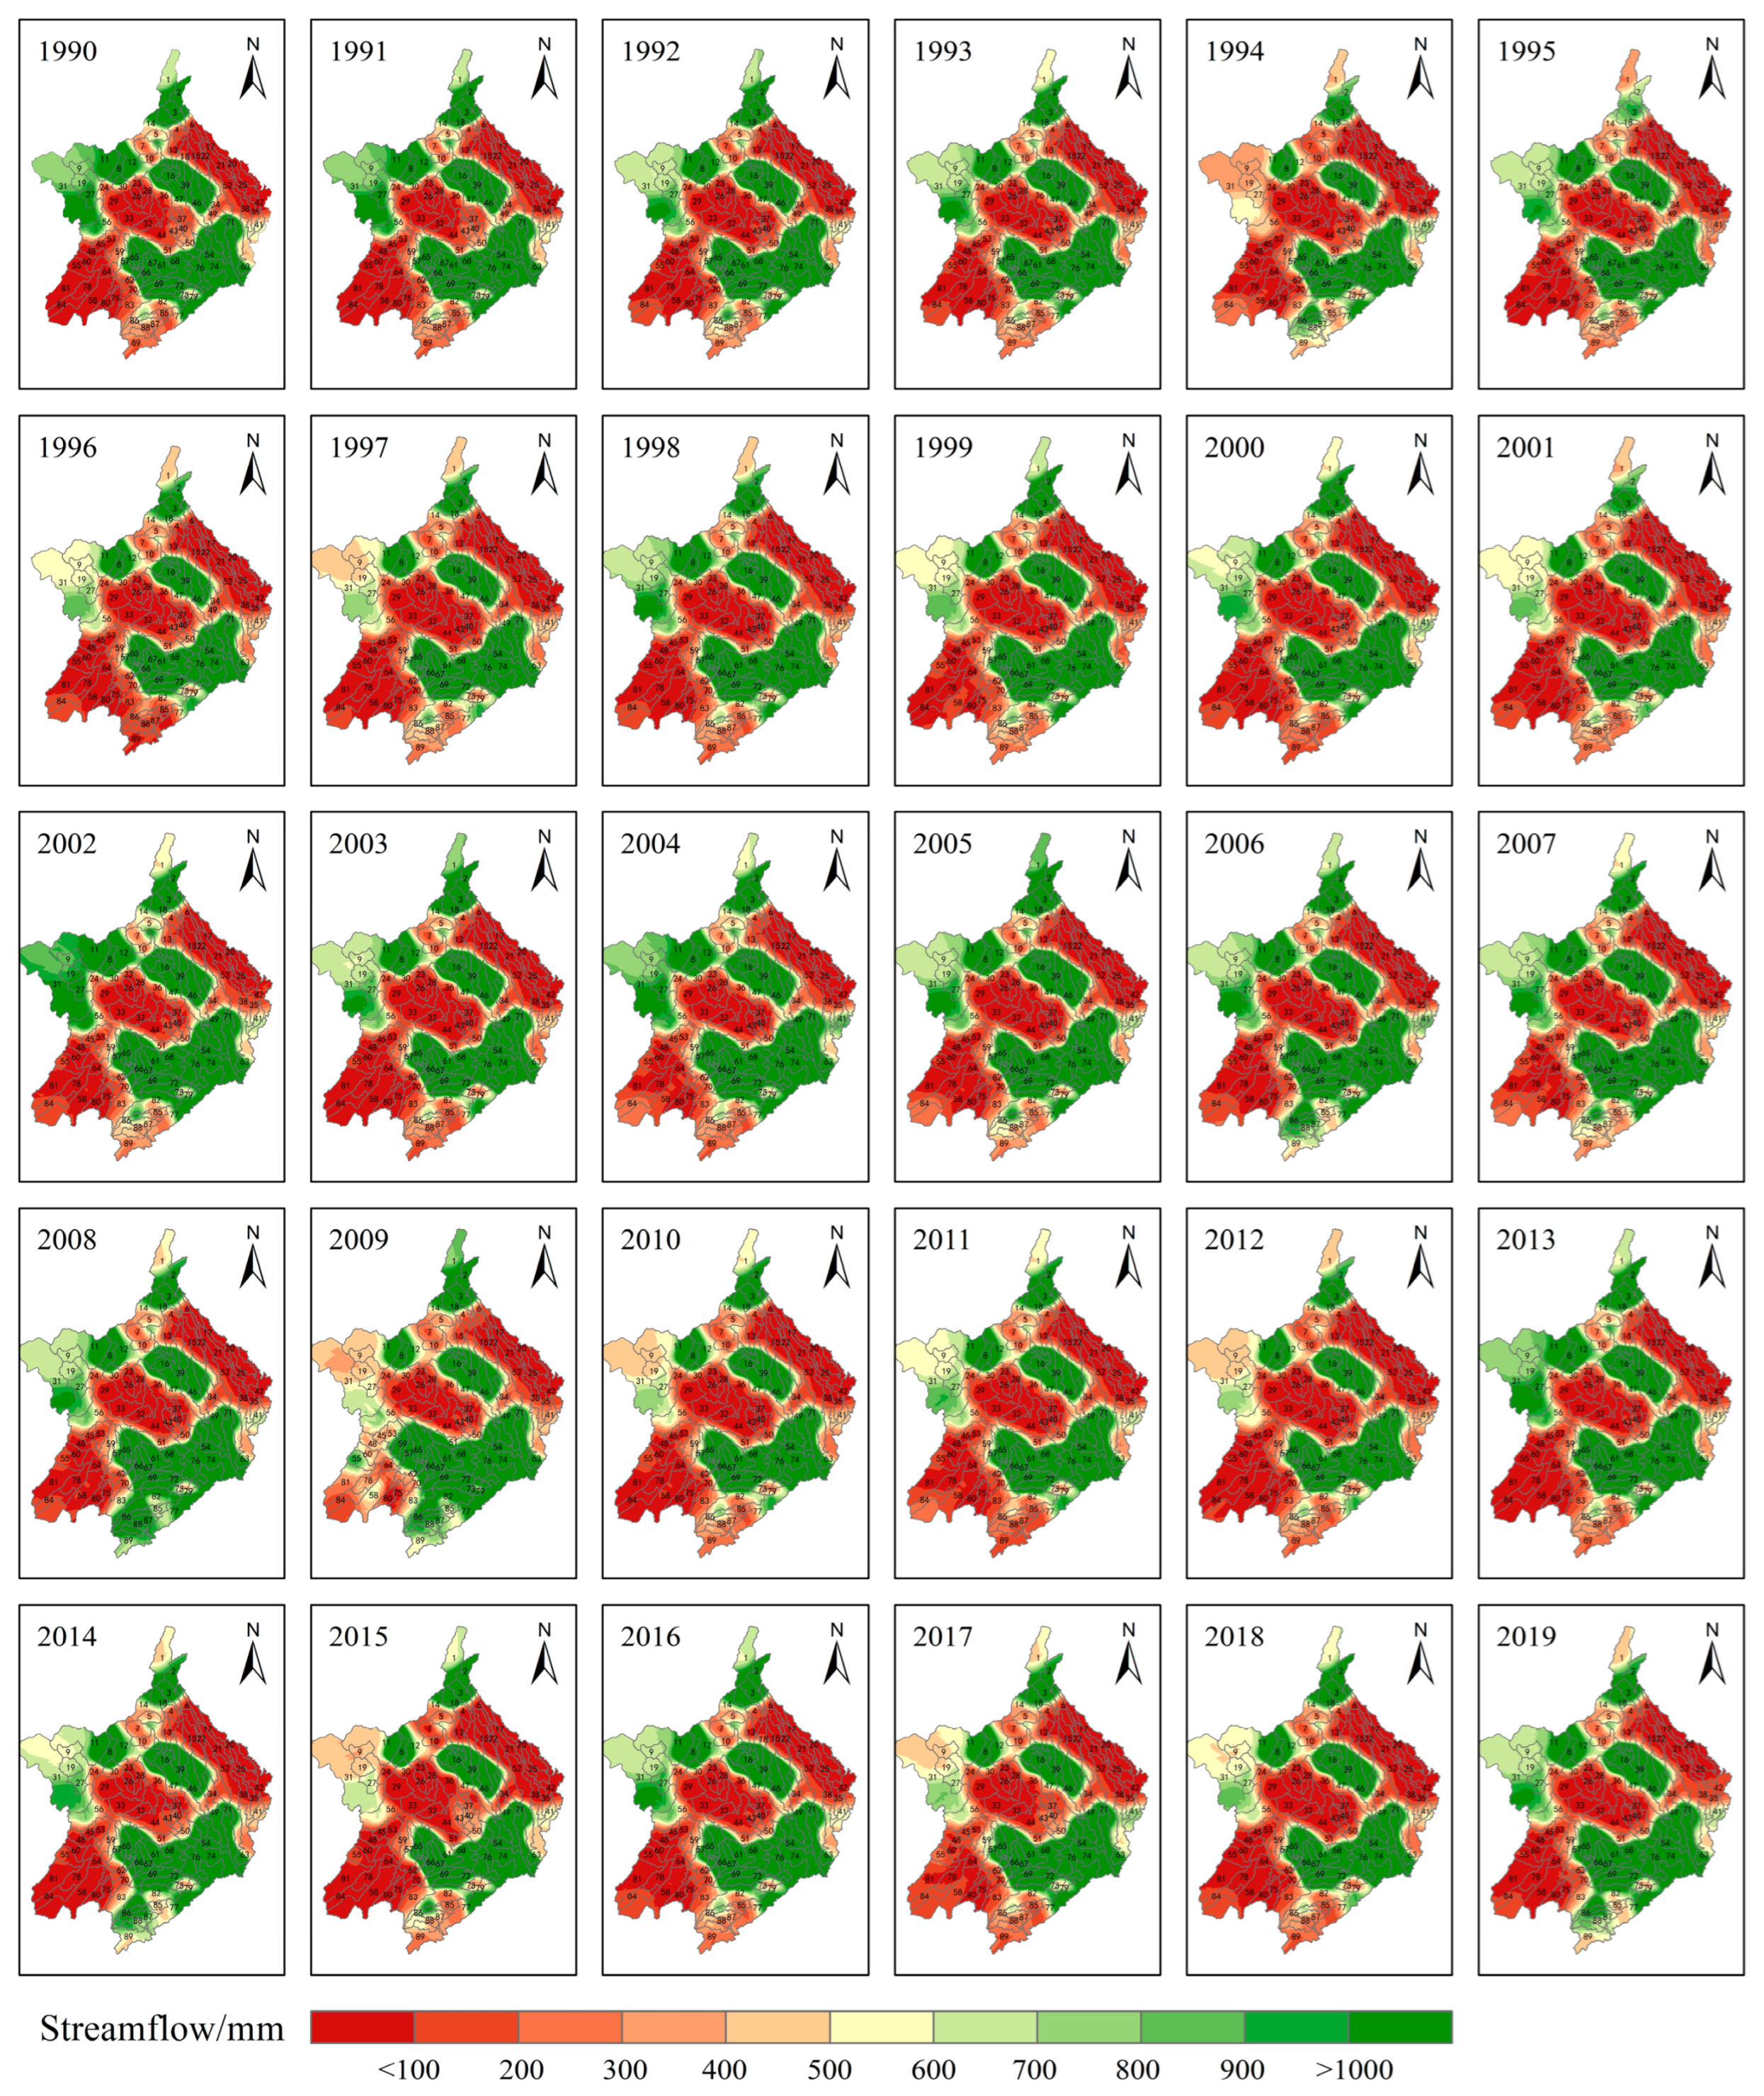
The results showed that the spatial distribution of runoff in the Minjiang River Basin (Chengdu section) is differentiated (Figure 6), There was a general trend of “high–low–high” in the northwest–southeast direction. Sub-catchments 2, 18, and 74 are located close to the river and have high runoff; in contrast, sub-catchments 24, 32, and 50 are in the gently sloping area of the agricultural land, where agricultural irrigation is the main mode of water use, and their runoff is relatively low.
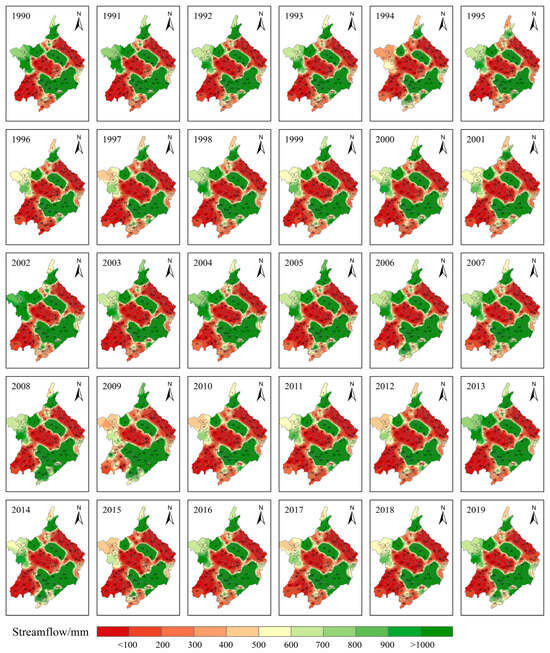
Figure 6.
Spatial variation of runoff volume in Minjiang River Basin (Chengdu section).
In terms of runoff trends (Figure 7), runoff in the southern and northern parts of the basin showed an increasing trend, and runoff in the central part of the basin showed a decreasing trend, but none of the changes were significant. As can be seen in Table 4, the largest proportion of area in the basin is occupied by areas of non-significant increase, followed by areas of non-significant decrease, and a smaller proportion of area is occupied by areas of significant increase and significant decrease.
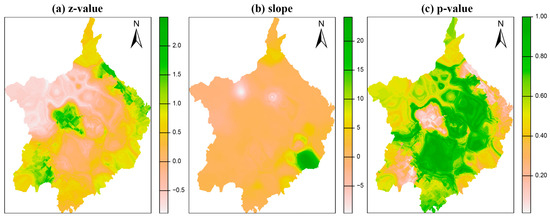
Figure 7.
Spatial distribution of runoff trends in the Minjiang River Basin (Chengdu section) (a) Z_Value; (b) slope value; (c) classification of significance.
Table 4.
Minjiang River Basin (Chengdu section) runoff trend statistics.
3.3. Relative Importance of Drivers
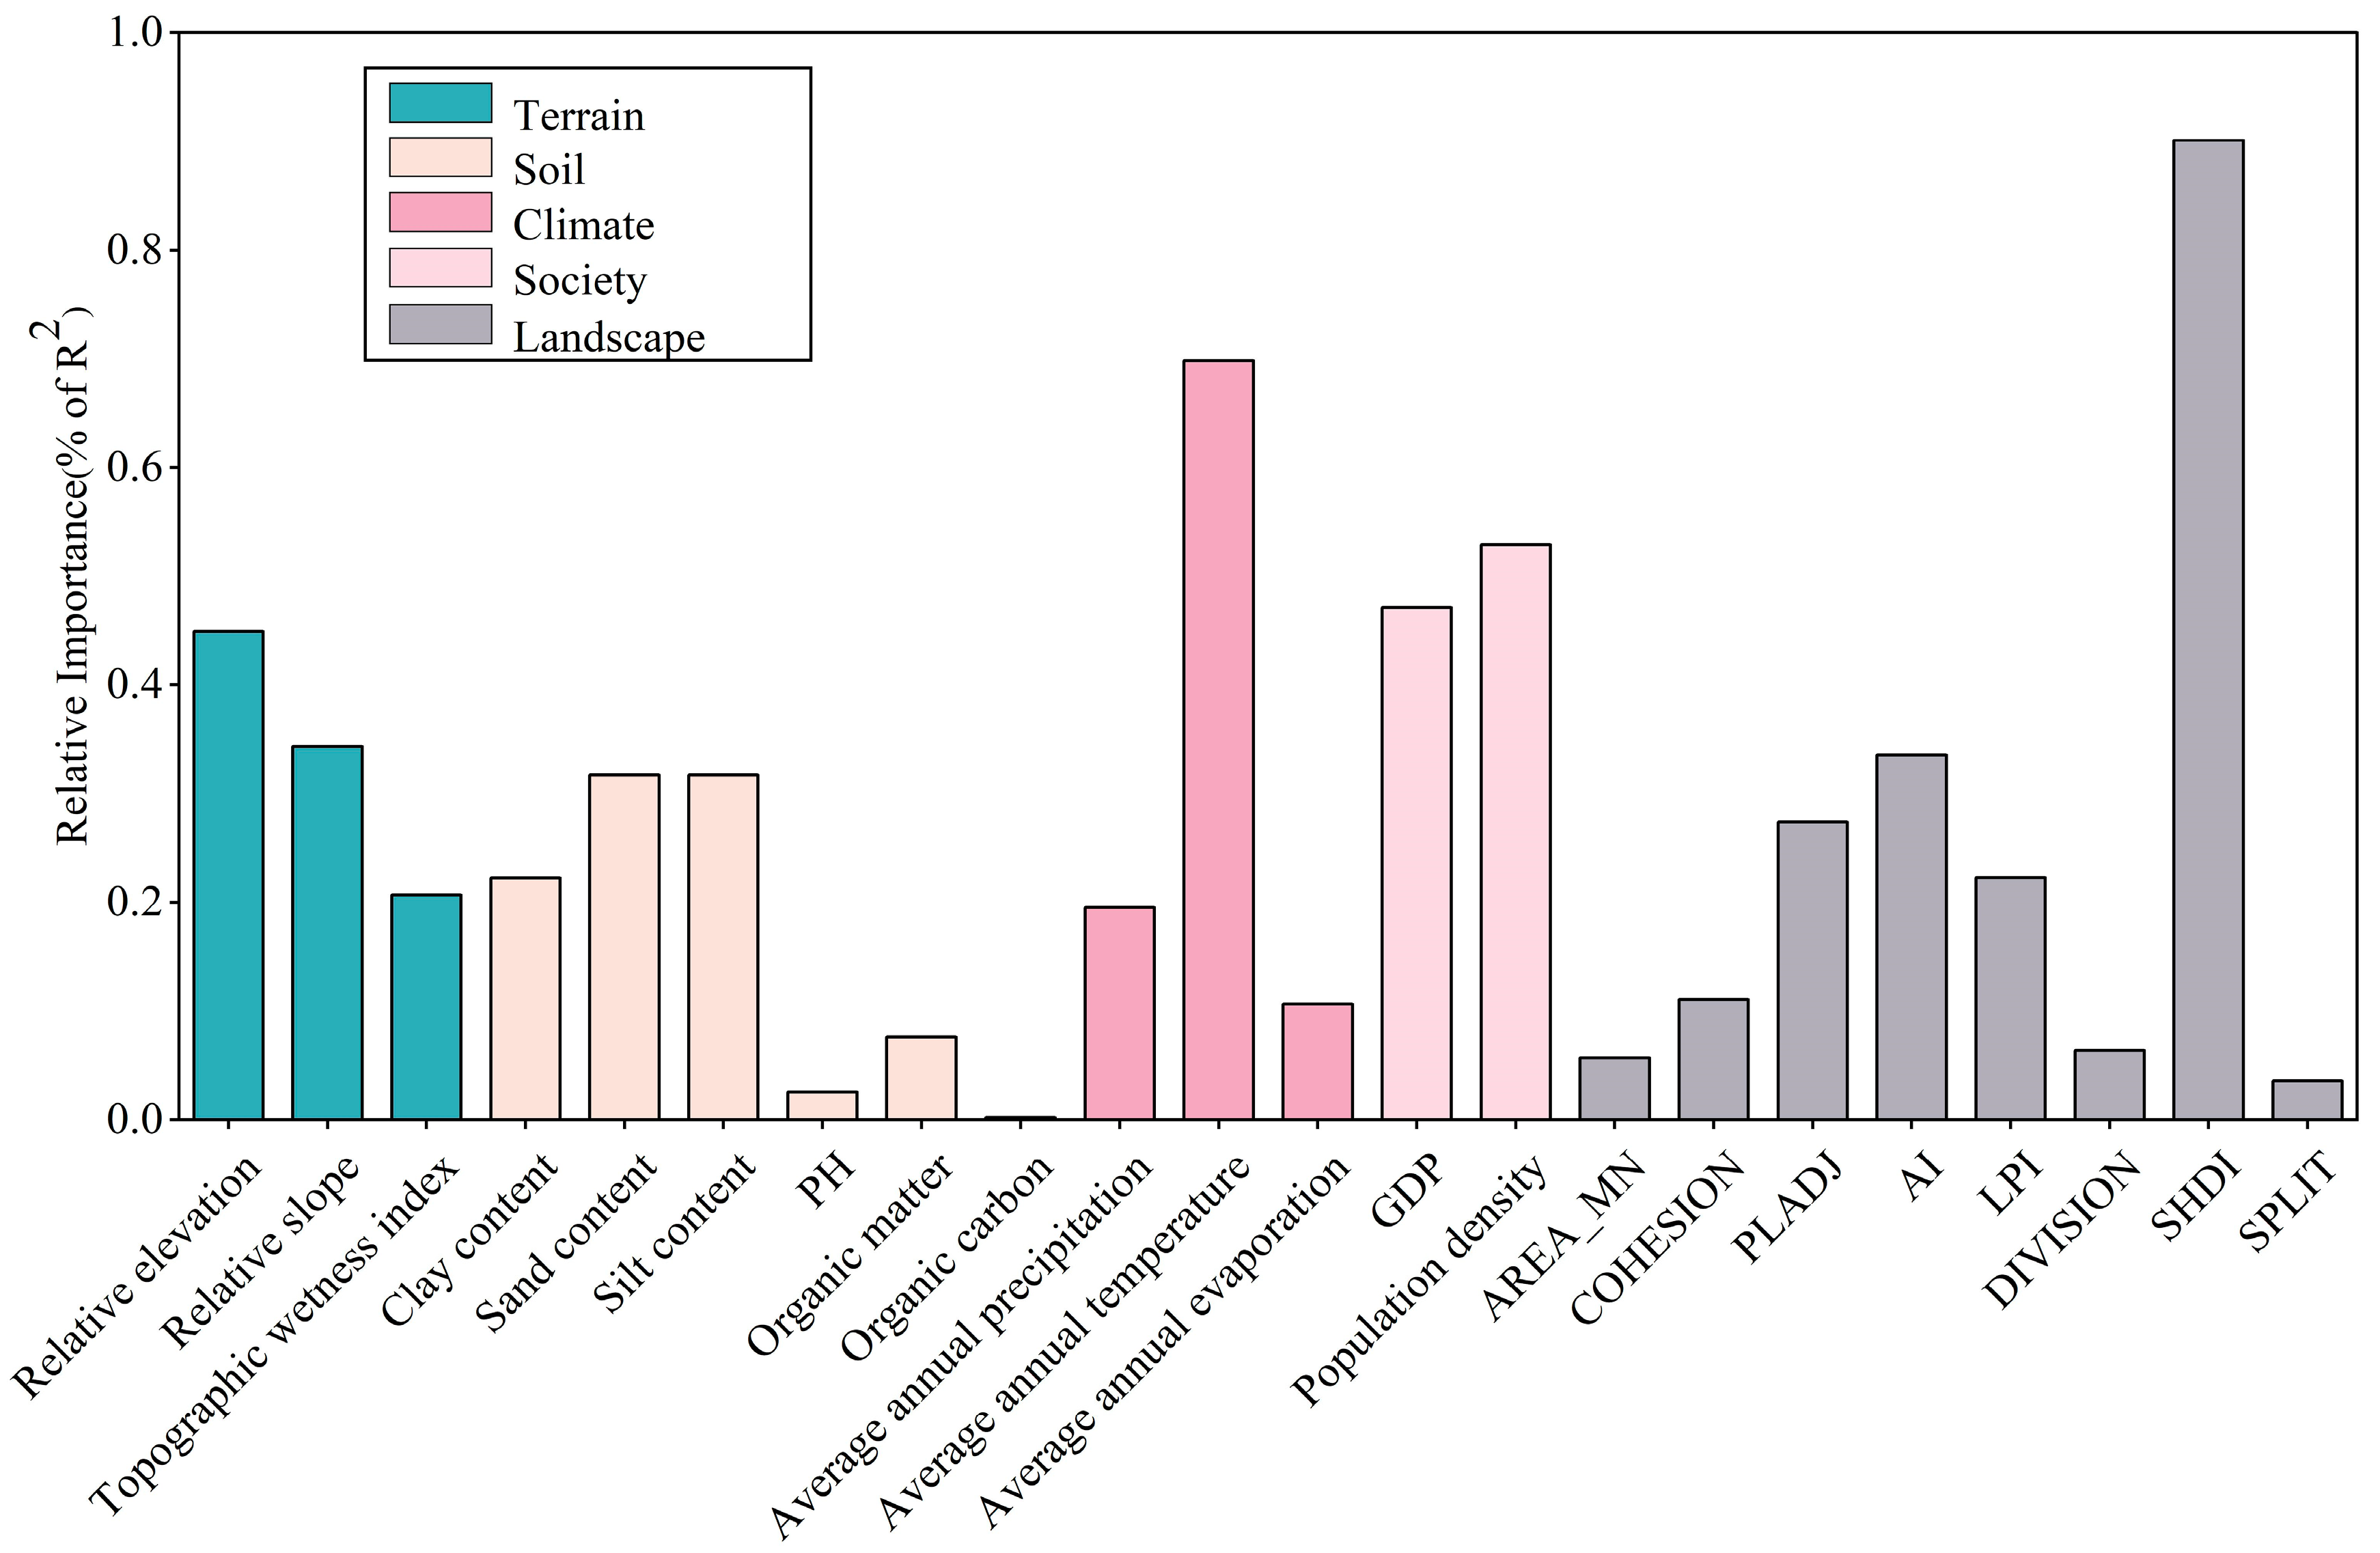
An analysis of the relative importance of the driving factors shows (Figure 8) that each factor contributes to surface runoff to varying degrees. Among the topographic factors, relative elevation is the most important factor, with a relative importance of 44.92%. The relative importance of the soil factors, chalk content, gravel content, and clay content were 31.75%, 31.47%, and 20.78%, respectively. Among the climatic factors, mean annual temperature has the greatest influence on surface runoff changes, with a high relative importance of 69.85%; among the socio-economic factors, population density and GDP contribute more, with a relative importance of 52.87% and 47.13%, respectively; and among the landscape factors, AI and SHDI are the most important indicators, with a relative importance of 33.57% and 90.08%, respectively.
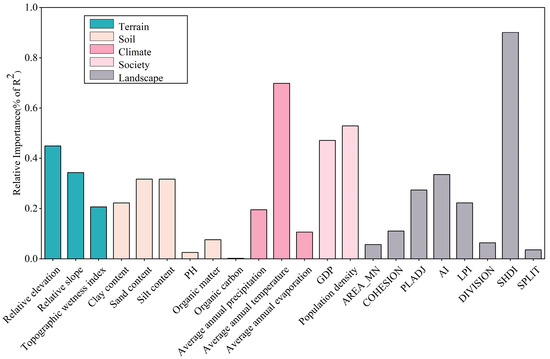
Figure 8.
Results of the relative importance analysis.
3.4. The PLS-SEM Model Assessment
3.4.1. Assessment of Measurement Models
The PLS-SEM model needed to be evaluated for both the measurement model and the structural model. Measurement models provide relationships between latent variables and the indicators they define. To ensure the accuracy of the model results, the measurement model needed to be assessed using a range of parameters: the unidimensionality test of indicators, and the confidence and validity of the model. The variance inflation factor (VIF) was used to detect multicollinearity among the apparent variables. In the present study, VIF < 10 was used to indicate that there was no serious covariance among the variables and, therefore, VIF > 10 indicated serious multicollinearity among the variables. The results of the measurement model evaluation are shown in Table 5. Five observed variables—pH, organic matter content in the soil, organic carbon content, clay content, and landscape fragmentation—were excluded and significance tests were passed between the remaining latent and observed variables.
Table 5.
PLS-SEM measurement model assessment results.
3.4.2. Assessment of Structural Models
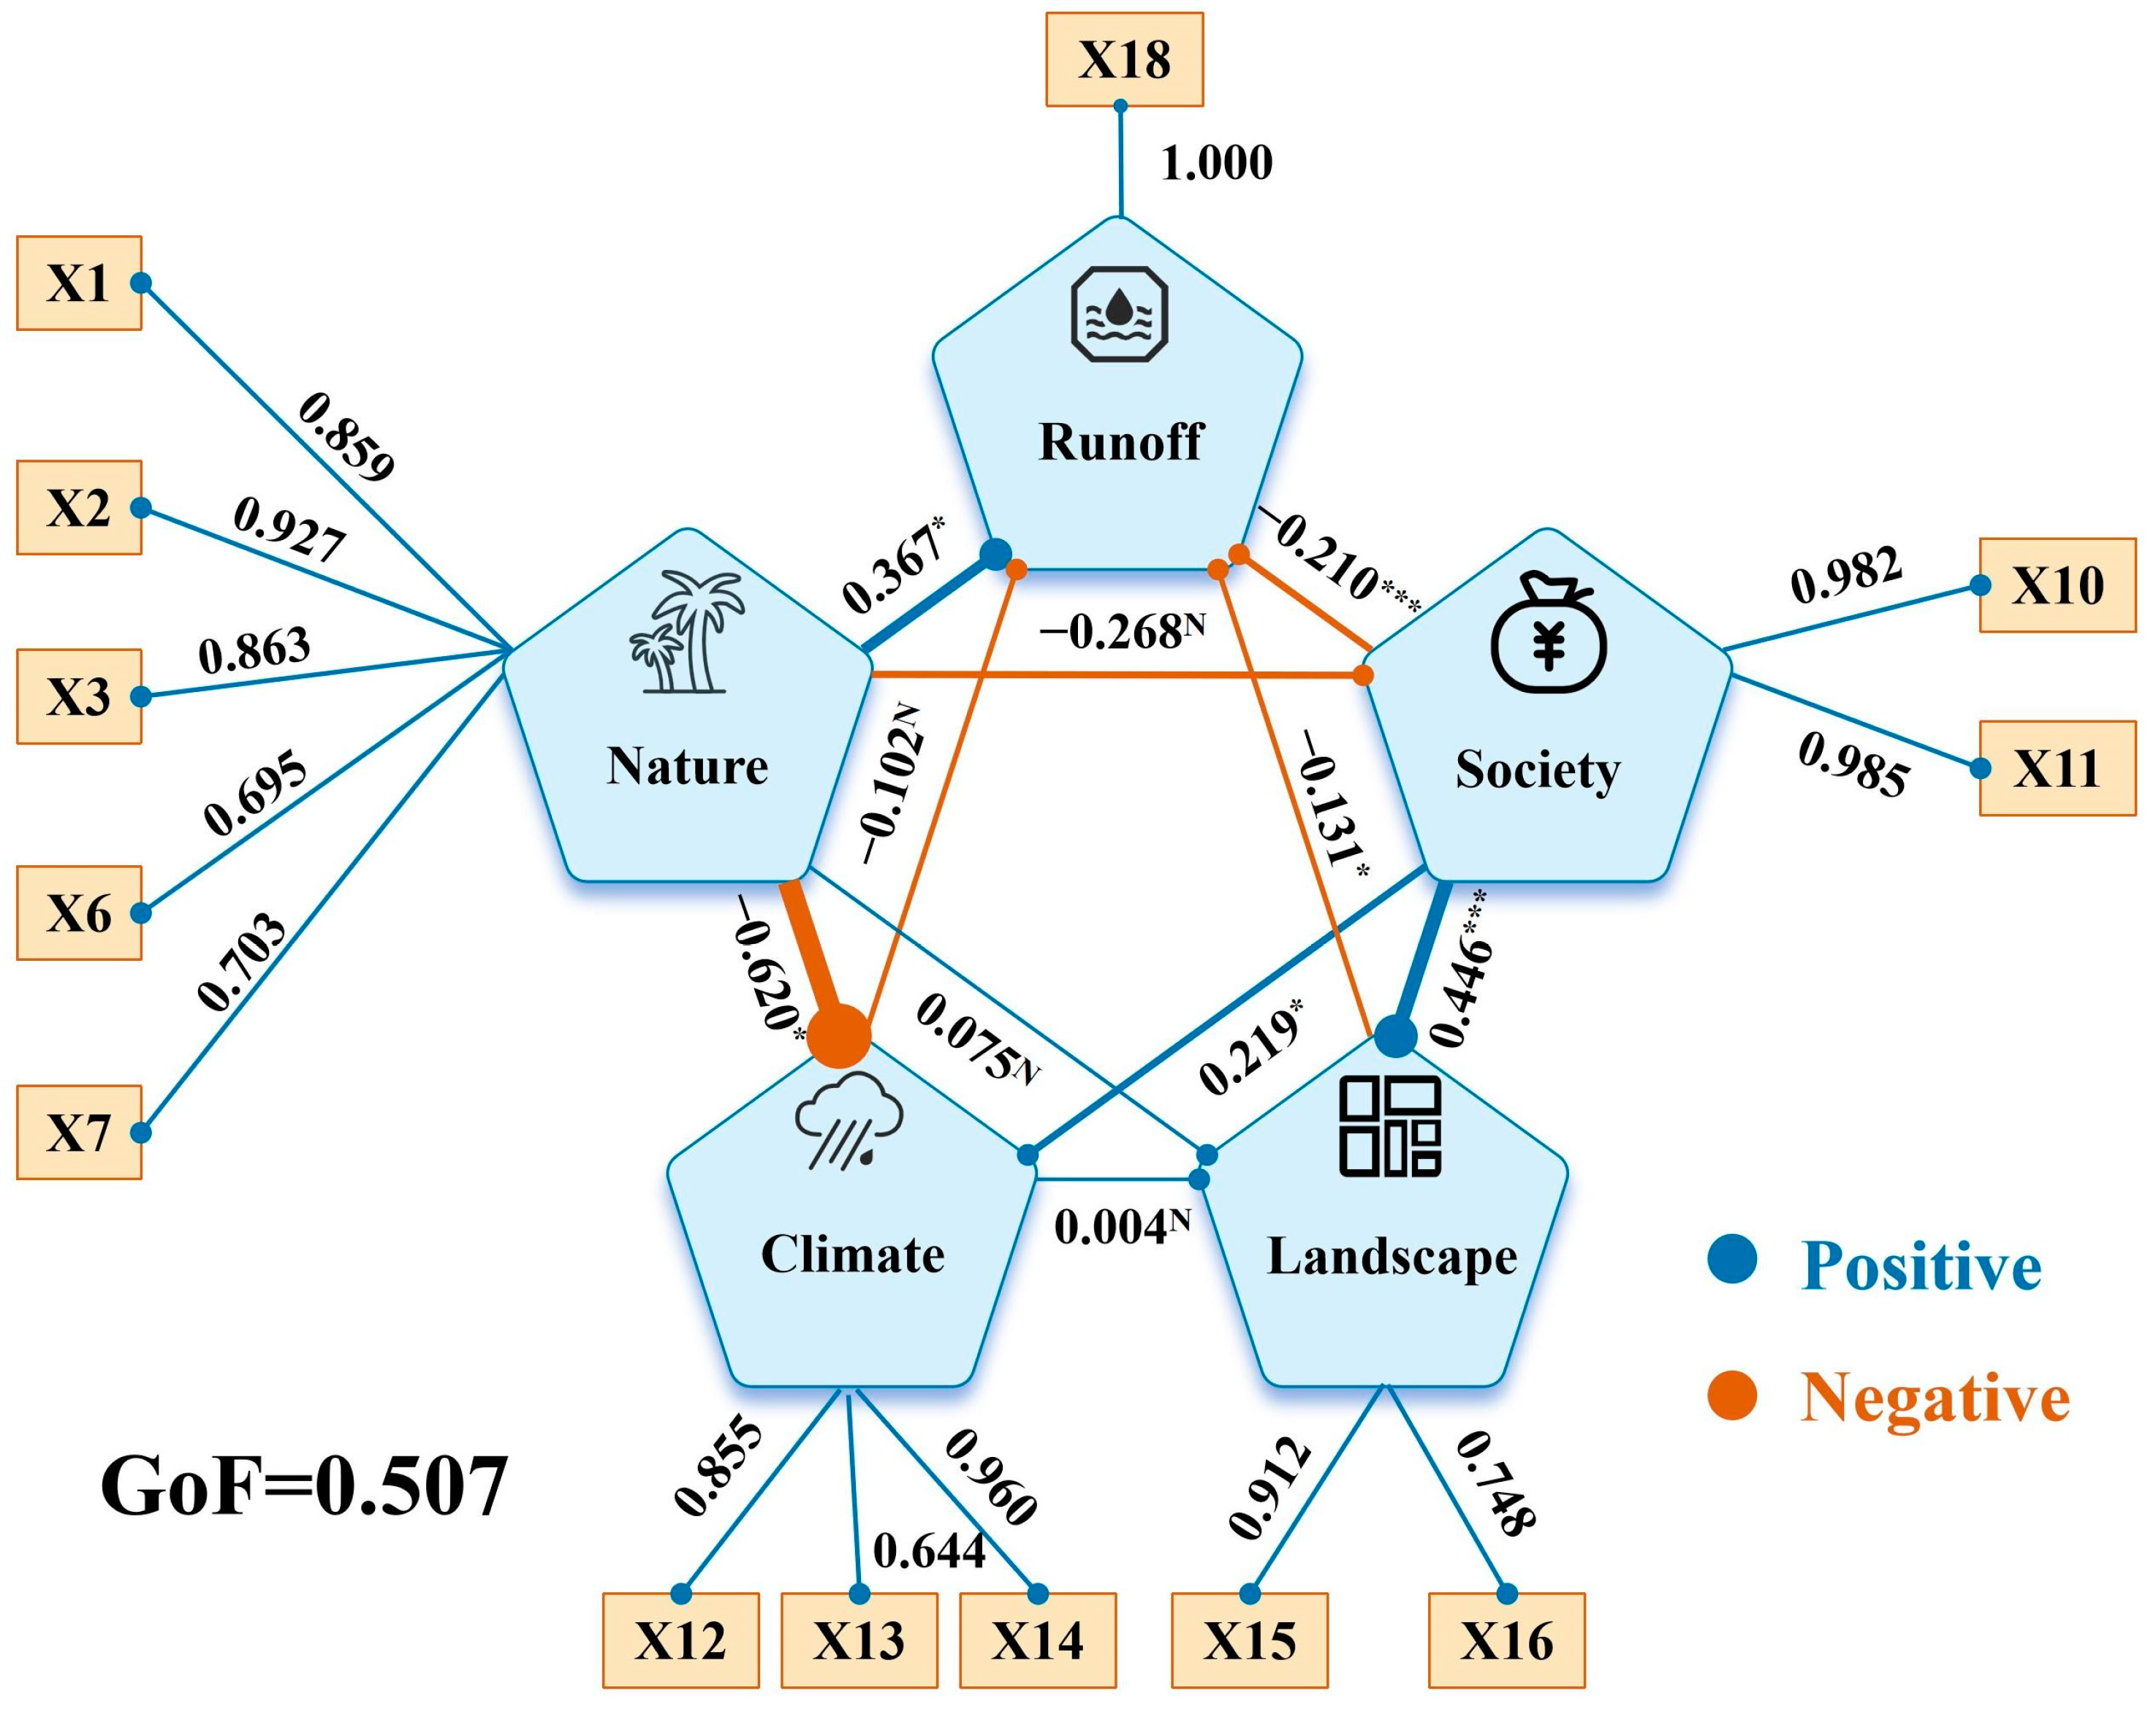
The interactions between latent variables were analyzed using a structural model, and the degree of association between them was indicated by path coefficients. Ten direct pathways, such as nature → climate and climate → surface runoff, were defined in the initial stage of modeling (Table 6). According to the results of the model (Figure 8), economic and landscape factors had significant negative effects on surface runoff changes, with path coefficients of −0.210 (p = 0.000) and −0.131 (p = 0.03), respectively. Natural factors had positive effects on surface runoff changes, with a path coefficient of 0.367 (p = 0.037). Although climatic factors had a negative effect on surface runoff changes, their path coefficient was only −0.102 (p = 0.205), which was not significant.
Table 6.
Results of hypothetical path test for the PLS-SEM model.
In addition to the direct pathways, several indirect pathways were identified; these reflect the transmission of impacts between different factors. Economic factors can have an indirect negative effect on runoff changes by changing landscape distribution, while natural factors could have an indirect negative effect on surface runoff by influencing economic activities (Figure 9).
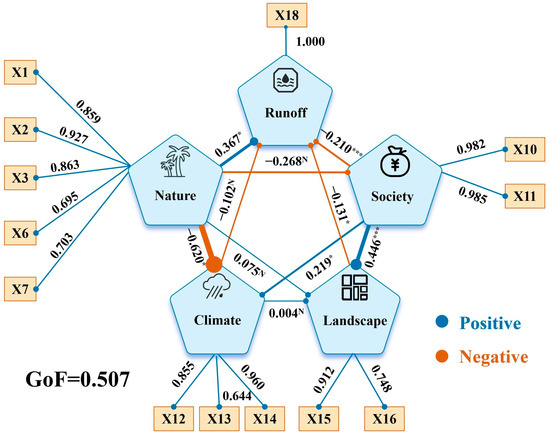
Figure 9.
Final PLS-SEM model. Note: X1-Relative elevation; X2-Relative slope; X3-Topographic humidity index; X4-Soil PH; X5-Clay contents; X6-Sand contents; X7-Silt contents; X8-Organic matter contents; X9-Organic carbon contents; X10-Population density; X11-GDP; X12-Average annual precipitation; X13-Average annual temperature; X14-Average annual evaporation; X15-Landscape change; X16-Landscape connectivity; X17-Landscape fragmentation; X18-Runoff. * indicates that the test of significance passed 90 percent; *** indicates that the test of significance passed 99 percent; N indicates that the test of significance was not passed.
4. Discussion
Surface runoff is an important part of the hydrological cycle, and it is important to analyze the change in surface runoff and its main driving factors to elucidate the hydrological response mechanism. Compared with previous studies, which mostly focused on global [43], China [44,45], or large catchment scales [46,47,48,49], this study focuses on the catchment intervals with greater intensity of human activities. By simulating the dynamic change of surface runoff, factors such as surface, climate, human activities, and landscape are taken into account, and quantitative methods are adopted. The complex causal relationship between surface runoff change and its driving factors was discussed, and some indirect ways of influencing surface runoff change were revealed to provide a new perspective for understanding and predicting surface runoff change.
4.1. Spatial and Temporal Variability of Runoff
The average annual runoff in the Minjiang River Basin (Chengdu section) varied from 628.96 to 1088.46 mm, with a multi-year average of 834.13 mm. This was essentially consistent with the results of Zhang [50] and Zhai [51]. The ‘high–low–high’ pattern of runoff from the northwest to the southeast of the basin was mainly influenced by the following factors: the upstream confluence area being a mountainous area, with a large channel slope drop and a high proportion of surface runoff, leading to an increase in runoff; the midstream area having a small channel slope drop and a low proportion of surface runoff, resulting in a decrease in runoff; and the confluence of several tributaries, such as the Xijiang River and the Linxi River, leading to a further increase in runoff [52]. Simultaneously, subject to the combined constraints of natural and social factors, the areas usually distributed along the river channels were doubly recharged by incoming water and precipitation and their runoff was larger, while the areas with flat topography and well-developed agriculture were depleted by factors such as evaporation and artificial water abstraction, which led to less runoff.
4.2. Analysis of the Drivers of Runoff Change
4.2.1. Significant Positive Impact of Natural Factors
The Minjiang River Basin (Chengdu section) has a wide range of elevation changes (341–4020 m) and a significant difference in topography between the east and west, leading to a significant positive relationship between surface factors and surface runoff. The higher the relative elevation and slope, and the more undulating the terrain, the more likely it was for precipitation and flowing water to form runoff rather than infiltrate the soil [53,54]. The topographic moisture index reflects the degree of wetness and runoff potential of a surface, with a larger index indicating that the point is more likely to accumulate moisture and precipitation is more likely to be converted to runoff than evaporated [55]. In the study area, anthropogenic soils are present in the highest proportion, especially at low altitudes where the scale of agricultural land is large and long-term operations such as ploughing and irrigation have impacted the physical properties of the soils and led to loose, sparse and chalky soils. This in turn has reduced soil porosity, pore connectivity and—consequently—has led to decreased water containment capacity. Therefore, more precipitation results in surface runoff.
4.2.2. Significant Negative Impacts of Human Activities
This study showed that population density and GDP were important drivers of changes in surface runoff. The resident population of Chengdu City increased by 3.5 times between 1990 and 2019, the population density increased from 42.5 to 147.9 people km−2 and the GDP also increased 264-fold. These changes have put enormous pressure on the Minjiang River Basin, which Chengdu relies on as one of the city’s main water sources and an important source of water for agriculture. With population growth and the expansion of agricultural land, the Minjiang River Basin is facing water shortages and pollution problems. Simultaneously, the implementation of a series of water conservancy projects, such as dams, river embankments and reservoirs, has altered the natural water cycle of the basin and affected its hydrological situation.
4.2.3. Significant Negative Effects of Landscape Factors
Landscape factors directly affect the generation of and changes in surface runoff [56]. Landscape types can be classified into ‘source’ and ‘sink’ landscapes according to their contribution to and consumption of surface runoff. Cropland, woodland and grassland are usually considered sink landscapes and impervious surfaces as source landscapes. The area of source and sink landscapes in this watershed in 1990 was 4881.77 and 477.98 km2, and in 2019 was 4520.95 and 828.91 km2, respectively. This was indicative of the significant urbanisation of the region and an increase in the area of impervious surfaces, which reduced the infiltration capacity of rainwater and increased the runoff coefficient. Additionally, landscape connectivity affects the flow and distribution of water between patches, thereby influencing surface runoff volume and peaks [57,58]. In the Minjiang River Basin in Chengdu, large areas of the original continuous landscape have been cut up in the last 30 years due to the construction of infrastructure (roads, industrial and mining, irrigation canals, etc.) and land use changes; this has resulted in increased landscape fragmentation and homogeneity, and decreased landscape diversity and connectivity. These effects also have an impact on surface runoff.
4.2.4. Non-Significant Effects of Climatic Factors
In the quantitative analysis of the effect of climate factors on surface runoff, we found that the path coefficient of the climate factor was −0.102, but it did not pass the significance test, i.e., the effect of climate on surface runoff was not significant. Although climatic factors are widely recognized as one of the key factors driving changes in surface runoff in the theoretical framework and are expected to have a significant impact on the study area [59], the specific findings of this study reveal the limitations of climatic impacts in the watershed. This non-significant result may be attributed to a combination of several complex factors. First, the relatively small geographic scale of the study watershed may limit the ability of climatic factors to contribute significantly to surface runoff on a larger spatial scale. Second, the climatic factors themselves exhibited a high degree of heterogeneity in their spatial distribution, i.e., the climatic characteristics of different geographic locations varied significantly, and this heterogeneity may have weakened the overall influence of climatic factors on surface runoff in a given watershed. Furthermore, the intensity of changes in climatic factors during the study period was relatively small and failed to trigger the threshold for significant changes in surface runoff. It is worth noting that although the current study concludes that the climate effect is not significant, this does not mean that the relationship between climate factors and surface runoff can be completely ignored. On the contrary, it suggests that we need to further explore the specific mechanisms of climate factors at different time scales, spatial scales, and intensities of change in future studies. However, there are many challenges in acquiring and analyzing climate research data. On the one hand, long time series of climate data are crucial for revealing the long-term trend and cyclical pattern of climate change, but the existing data are often limited by the lack of spatial and temporal resolution, making it difficult to accurately characterize the climate at the regional scale. On the other hand, many river basins did not have a well-established meteorological observation system at an early stage, resulting in a serious lack of historical data and impaired data continuity, which greatly limits the development of climate change research on a continuous time scale.
5. Conclusions
In this study, the Minjiang River Basin (Chengdu section) was taken as a case study. The monthly-scale runoff process from 1990 to 2019 was simulated using the SWAT model and the PLS-SEM model was used to explore the impacts of nature, climate, landscape, and society on surface runoff changes, as well as the interactions among the factors. The results showed that the average runoff in the Minjiang River Basin in Chengdu was 628.96–1088.46 mm, with an average value of 834.13 mm. The runoff showed a non-significant upward trend, with an average linear growth rate of 1.247 mm·a−1 and an overall spatial distribution pattern of ‘high–low–high’ from the northwest to the southeast. The main factors affecting the changes in surface runoff were relative elevation, powder content in soil, mean annual air temperature, population density, and SHDI. The PLS-SEM model analysis showed that socio-economic and landscape factors had significant negative effects on surface runoff, surface factors had significant positive effects on surface runoff, and climatic factors did not have significant effects on surface runoff. Additionally, economic factors had an indirect negative effect on runoff by changing the landscape distribution, and natural factors had an indirect negative effect on runoff by influencing economic activities. Runoff changes in the Minjiang River Basin (Chengdu section) are the result of a combination of natural and socio-economic factors. Therefore, it is necessary to comprehensively consider the influence of various factors and rationally optimize water resource management measures to achieve the sustainable use of water resources.
Author Contributions
Conceptualization, J.L., K.Y., Q.L., L.L. and P.P.; Formal analysis, J.L. and L.L.; Methodology, J.L., K.Y., Q.L. and L.L.; Validation, J.L.; Writing—original draft, J.L.; Supervision, K.Y., Q.L., L.L. and P.P.; Writing—review and editing, K.Y. and Q.L.; Funding acquisition, Q.L.; Project administration, Q.L. All authors have read and agreed to the published version of the manuscript.
Funding
This research was funded by the National Key Research and Development Program of China (2022YFF1301104), the National Natural Science Foundation of China (41401664), and the Youth Innovation Promotion Association of the Chinese Academy of Sciences (No. 2021375).
Data Availability Statement
The authors will supply the relevant data in response to reasonable requests.
Conflicts of Interest
The authors declare no conflicts of interest.
References
- Owuor, S.O.; Butterbach-Bahl, K.; Guzha, A.C.; Rufino, M.C.; Pelster, D.; Díaz-Pinés, E.; Breuer, L. Groundwater recharge rates and surface runoff response to land use and land cover changes in semi-arid environments. Ecol. Process. 2016, 5, 16. [Google Scholar] [CrossRef]
- Li, X.; Liu, S.; Xiao, Q.; Ma, M.; Jin, R.; Che, T.; Wang, W.; Hu, X.; Xu, Z.; Wen, J.; et al. A multiscale dataset for understanding complex eco-hydrological processes in a heterogeneous oasis system. Sci. Data 2017, 4, 170083. [Google Scholar] [CrossRef] [PubMed]
- Rumynin, V.G.; Rumynin, V.G. Surface Runoff Generation, Vertical Infiltration and Subsurface Lateral Flow. Overl. Flow Dyn. Solute Transp. 2015, 26, 3–50. [Google Scholar] [CrossRef]
- Zheng, J.; Wang, H.; Liu, B. Impact of the long-term precipitation and land use changes on runoff variations in a humid subtropical river basin of China. J. Hydrol. Reg. Stud. 2022, 42, 101136. [Google Scholar] [CrossRef]
- Gray, L.C.; Zhao, L.; Stillwell, A.S. Impacts of climate change on global total and urban runoff. J. Hydrol. 2023, 620, 129352. [Google Scholar] [CrossRef]
- Dimitriadou, S.; Nikolakopoulos, K.G. Evapotranspiration trends and interactions in light of the anthropogenic footprint and the climate crisis: A review. Hydrology 2021, 8, 163. [Google Scholar] [CrossRef]
- Wu, M.; Liu, P.; Lei, X.; Liao, W.; Cia, S.; Xia, Q.; Zou, K.; Wang, H. Impact of surface and underground water uses on streamflow in the upper-middle of the Weihe River basin using a modified WetSpa model. J. Hydrol. 2023, 616, 128840. [Google Scholar] [CrossRef]
- Zhai, R.; Tao, F. Contributions of climate change and human activities to runoff change in seven typical catchments across China. Sci. Total Environ. 2017, 605, 219–229. [Google Scholar] [CrossRef]
- Li, Z.; Quiring, S.M. Identifying the Dominant Drivers of Hydrological Change in the Contiguous United States. Water Resour. Res. 2021, 57, e2021WR029738. [Google Scholar] [CrossRef]
- Piao, S.; Friedlingstein, P.; Ciais, P.; de Noblet-Ducoudré, N.; Labat, D.; Zaehle, S. Changes in climate and land use have a larger direct impact than rising CO2 on global river runoff trends. Proc. Natl. Acad. Sci. USA 2007, 104, 15242–15247. [Google Scholar] [CrossRef]
- Wang, D.; Hejazi, M. Quantifying the relative contribution of the climate and direct human impacts on mean annual streamflow in the contiguous United States. Water Resour. Res. 2011, 47, 411. [Google Scholar] [CrossRef]
- Farsi, N.; Mahjouri, N. Evaluating the contribution of the climate change and human activities to runoff change under uncertainty. J. Hydrol. 2019, 574, 872–891. [Google Scholar] [CrossRef]
- Zhai, R.; Tao, F.; Lall, U.; Fu, B.; Elliott, J.; Jägermeyr, J. Larger drought and flood hazards and adverse impacts on population and economic productivity under 2.0 than 1.5 C warming. Earth’s Future 2020, 8, e2019EF001398. [Google Scholar] [CrossRef]
- Zhang, Y.; Zheng, H.; Zhang, X.; Leung, L.R.; Liu, C.; Zheng, C.; Guo, Y.; Chiew, F.H.; Post, D.; Kong, D.; et al. Future global streamflow declines are probably more severe than previously estimated. Nat. Water 2023, 1, 261–271. [Google Scholar] [CrossRef]
- Fang, D.; Hao, L.; Cao, Z.; Huang, X.; Qin, M.; Hu, J.; Liu, Y.; Sun, G. Combined effects of urbanization and climate change on watershed evapotranspiration at multiple spatial scales. J. Hydrol. 2020, 587, 124869. [Google Scholar] [CrossRef]
- Hagras, A. Runoff modeling using SCS-CN and GIS approach in the Tayiba Valley Basin, Abu Zenima area, South-west Sinai, Egypt. Model. Earth Syst. Environ. 2023, 9, 3883–3895. [Google Scholar] [CrossRef]
- Jia, M.; He, D.; Huo, X.; Zhang, H.; Jia, S.; Zhang, J. Exploring the impact of climate change on flood risk at cultural heritage sites using a GIS-based SCS-CN method: A case study of Shanxi province, China. Int. J. Disaster Risk Reduct. 2023, 96, 103968. [Google Scholar] [CrossRef]
- Soulis, K.X.; Valiantzas, J.D. SCS-CN parameter determination using rainfall-runoff data in heterogeneous watersheds–the two-CN system approach. Hydrol. Earth Syst. Sci. 2012, 16, 1001–1015. [Google Scholar] [CrossRef]
- Randall, M.; Sun, F.; Zhang, Y.; Jensen, M.B. Evaluating Sponge City volume capture ratio at the catchment scale using SWMM. J. Environ. Manag. 2019, 246, 745–757. [Google Scholar] [CrossRef]
- Akoko, G.; Le, T.H.; Gomi, T.; Kato, T. A review of SWAT model application in Africa. Water 2021, 13, 1313. [Google Scholar] [CrossRef]
- Li, H.; Wang, W.; Fu, J.; Wei, J. Spatiotemporal heterogeneity and attributions of streamflow and baseflow changes across the headstreams of the Tarim River Basin, Northwest China. Sci. Total Environ. 2023, 856, 159230. [Google Scholar] [CrossRef] [PubMed]
- Tan, M.L.; Gassman, P.W.; Yang, X.; Haywood, J. A review of SWAT applications, performance and future needs for simulation of hydro-climatic extremes. Adv. Water Resour. 2020, 143, 103662. [Google Scholar] [CrossRef]
- Zhou, S.; Wang, Y.; Chang, J.; Guo, A.; Li, Z. Investigating the dynamic influence of hydrological model parameters on runoff simulation using sequential uncertainty fitting-2-based multilevel-factorial-analysis method. Water 2018, 10, 1177. [Google Scholar] [CrossRef]
- Li, Z.; Huang, S.; Liu, D.; Leng, G.; Zhou, S.; Huang, Q. Assessing the effects of climate change and human activities on runoff variations from a seasonal perspective. Stoch. Environ. Res. Risk Assess. 2020, 34, 575–592. [Google Scholar] [CrossRef]
- Dijkstra, T.K.; Henseler, J. Consistent and asymptotically normal PLS estimators for linear structural equations. Comput. Stat. Data Anal. 2015, 81, 10–23. [Google Scholar] [CrossRef]
- Hair, J.; Hollingsworth, C.L.; Randolph, A.B.; Chong, A.Y.L. An updated and expanded assessment of PLS-SEM in information systems research. Ind. Manag. Data Syst. 2017, 117, 442–458. [Google Scholar] [CrossRef]
- He, Y.; Pan, H.; Wang, R.; Yao, C.; Cheng, J.; Zhang, T. Research on the cumulative effect of multiscale ecological compensation in river basins: A case study of the Minjiang River Basin, China. Ecol. Indic. 2023, 154, 110605. [Google Scholar] [CrossRef]
- Cui, X.; Liu, S.; Wei, X. Impacts of forest changes on hydrology: A case study of large watersheds in the upper reaches of Minjiang River watershed in China. Hydrol. Earth Syst. Sci. 2012, 16, 4279–4290. [Google Scholar] [CrossRef]
- Yao, C.; He, Y.M.; Cheng, J.X.; Zhang, T.Y.; Pan, H.Y.; Ma, H.J. Evaluation of ecological security pattern and optimization suggestions in Minjiang River Basin based on MCR model and gravity model. Acta Ecol. Sin. 2023, 43, 7083–7096. [Google Scholar] [CrossRef]
- Li, A.; Ran, M.; Song, L.; Xue, J.; Zhang, Y.; Li, C.; Deng, Q.; Fang, H.; Dai, T.; Li, Q. Spatial Distribution Characteristics and Influencing Factors of Cropland Topsoil Organic Carbon Content in the Sichuan Basin. Resour. Environ. Yangtze Basin 2023, 32, 1102–1112. [Google Scholar] [CrossRef]
- Aawar, T.; Khare, D. Assessment of climate change impacts on streamflow through hydrological model using SWAT model: A case study of Afghanistan. Model. Earth Syst. Environ. 2020, 6, 1427–1437. [Google Scholar] [CrossRef]
- Li, M.; Di, Z.; Duan, Q. Effect of sensitivity analysis on parameter optimization: Case study based on streamflow simulations using the SWAT model in China. J. Hydrol. 2021, 603, 126896. [Google Scholar] [CrossRef]
- Wang, Y.; Jiang, R.; Xie, J.; Zhao, Y.; Yan, D.; Yang, S. Soil and water assessment tool (SWAT) model: A systemic review. J. Coast. Res. 2019, 93, 22–30. [Google Scholar] [CrossRef]
- Arnold, J.G.; Moriasi, D.N.; Gassman, P.W.; Abbaspour, K.C.; White, M.J.; Srinivasan, R.; Santhi, C.; Harmel, R.D.; Van Griensven, A.; Van Liew, M.W.; et al. SWAT: Model use, calibration, and validation. Trans. ASABE 2012, 55, 1491–1508. [Google Scholar] [CrossRef]
- Hosseini, S.H.; Khaleghi, M.R. Application of SWAT model and SWAT-CUP software in simulation and analysis of sediment uncertainty in arid and semi-arid watersheds (case study: The Zoshk–Abardeh watershed). Model. Earth Syst. Environ. 2020, 6, 2003–2013. [Google Scholar] [CrossRef]
- Malik, M.A.; Dar, A.Q.; Jain, M.K. Modelling streamflow using the SWAT model and multi-site calibration utilizing SUFI-2 of SWAT-CUP model for high altitude catchments, NW Himalaya’s. Model. Earth Syst. Environ. 2022, 8, 1203–1213. [Google Scholar] [CrossRef]
- Gocic, M.; Trajkovic, S. Analysis of changes in meteorological variables using Mann-Kendall and Sen’s slope estimator statistical tests in Serbia. Glob. Planet. Chang. 2013, 100, 172–182. [Google Scholar] [CrossRef]
- Gao, J.; Bian, H.; Zhu, C.; Tang, S. The response of key ecosystem services to land use and climate change in Chongqing: Time, space, and altitude. J. Geogr. Sci. 2022, 32, 317–332. [Google Scholar] [CrossRef]
- Tonidandel, S.; LeBreton, J.M. Relative importance analysis: A useful supplement to regression analysis. J. Bus. Psychol. 2011, 26, 1–9. [Google Scholar] [CrossRef]
- Chin, W.W. The partial least squares approach to structural equation modeling. Mod. Methods Bus. Res. 1998, 295, 295–336. [Google Scholar]
- Hair, J.F.; Sarstedt, M.; Ringle, C.M.; Mena, J.A. An assessment of the use of partial least squares structural equation modeling in marketing research. J. Acad. Mark. Sci. 2012, 40, 414–433. [Google Scholar] [CrossRef]
- Sarstedt, M.; Ringle, C.M.; Hair, J.F. Partial least squares structural equation modeling. In Handbook of Market Research; Springer International Publishing: Cham, Switzerland, 2021; pp. 587–632. [Google Scholar]
- Wang, F.; Shao, W.; Yu, H.; Kan, G.; He, X.; Zhang, D.; Ren, M.; Wang, G. Re-evaluation of the power of the Mann-Kendall test for detecting monotonic trends in hydrometeorological time series. Front. Earth Sci. 2020, 8, 14. [Google Scholar] [CrossRef]
- Miao, C.; Wu, Y.; Fan, X.; Su, J. Projections of global land runoff changes and their uncertainty characteristics during the 21st century. Earth’s Future 2023, 11, e2022EF003286. [Google Scholar] [CrossRef]
- Bai, X.; Zhao, W. Impacts of climate change and anthropogenic stressors on runoff variations in major river basins in China since 1950. Sci. Total Environ. 2023, 898, 165349. [Google Scholar] [CrossRef] [PubMed]
- Yang, L.; Zhao, G.; Tian, P.; Mu, X.; Tian, X.; Feng, J.; Bai, Y. Runoff changes in the major river basins of China and their responses to potential driving forces. J. Hydrol. 2022, 607, 127536. [Google Scholar] [CrossRef]
- Wang, B.; Wang, H.; Jiao, X.; Huang, L.; Chen, H.; Guo, W. Runoff change in the Yellow River Basin of China from 1960 to 2020 and its driving factors. J. Arid. Land 2024, 16, 168–194. [Google Scholar] [CrossRef]
- Li, B.; Feng, Q.; Wang, Y. Historical and future runoff changes and their impacts on stormflow characteristics in the upper Yangtze River basin, China. Catena 2024, 235, 107684. [Google Scholar] [CrossRef]
- Yang, T.; Yang, X.; Jia, C. Detecting the main driving force of runoff change in the Beiluo River Basin, China. Environ. Sci. Pollut. Res. 2023, 30, 89823–89837. [Google Scholar] [CrossRef]
- Hu, G.R.; Li, X.Y.; Yang, X.F. The impact of micro-topography on the interplay of critical zone architecture and hydrological processes at the hillslope scale: Integrated geophysical and hydrological experiments on the Qinghai-Tibet Plateau. J. Hydrol. 2020, 583, 124618. [Google Scholar] [CrossRef]
- Yang, Z.H.A.N.G.; Yu, D.E.N.G.; Fu-quan, N.I.; Chao, N.I.E.; Jie, M.A. Spatial and Temporal Variation Characteritics of Blue and Green Water Resources in Min-Tou River Basin were Analyzed Based on SWAT Model. Chin. J. Agrometeorol. 2020, 41, 345–356. [Google Scholar] [CrossRef]
- Hu, J.; Ma, J.; Nie, C.; Xue, L.; Zhang, Y.; Ni, F.; Deng, Y.; Liu, J.; Zhou, D.; Li, L.; et al. Attribution Analysis of Runoff change in Min-tuo River Basin based on SWAT model simulations, China. Sci. Rep. 2020, 10, 2900. [Google Scholar] [CrossRef]
- Zhai, H.; Wang, M.; Shen, D.; Hu, B.; Li, Y. Analysis of runoff variation and driving factors in the Minjiang River Basin over the last 60 years. J. Water Clim. Chang. 2022, 13, 3675–3691. [Google Scholar] [CrossRef]
- Leonarduzzi, E.; Maxwell, R.M.; Mirus, B.B.; Molnar, P. Numerical analysis of the effect of subgrid variability in a physically based hydrological model on runoff, soil moisture, and slope stability. Water Resour. Res. 2021, 57, e2020WR027326. [Google Scholar] [CrossRef]
- Nagaveni, C.; Kumar, K.P.; Ravibabu, M.V. Evaluation of TanDEMx and SRTM DEM on watershed simulated runoff estimation. J. Earth Syst. Sci. 2019, 128, 2. [Google Scholar] [CrossRef]
- Mahato, S.; Pal, S.; Talukdar, S.; Saha, T.K.; Mandal, P. Field based index of flood vulnerability (IFV): A new validation technique for flood susceptible models. Geosci. Front. 2021, 12, 101175. [Google Scholar] [CrossRef]
- Zhang, Y.; Bi, Z.; Zhang, X.; Yu, Y. Influence of landscape pattern changes on runoff and sediment in the Dali River watershed on the Loess Plateau of China. Land 2019, 8, 180. [Google Scholar] [CrossRef]
- Jahanishakib, F.; Salmanmahiny, A.; Mirkarimi, S.H.; Poodat, F. Hydrological connectivity assessment of landscape ecological network to mitigate development impacts. J. Environ. Manag. 2021, 296, 113169. [Google Scholar] [CrossRef] [PubMed]
- Wu, L.; Zhang, M.; Xie, X.; Lv, J.; Zhou, X.; Shen, N. Effect of wetland hydrological connectivity on runoff based on a basin comparison. J. Hydrol. 2023, 619, 129348. [Google Scholar] [CrossRef]


Disclaimer/Publisher’s Note: The statements, opinions and data contained in all publications are solely those of the individual author(s) and contributor(s) and not of MDPI and/or the editor(s). MDPI and/or the editor(s) disclaim responsibility for any injury to people or property resulting from any ideas, methods, instructions or products referred to in the content. |
© 2024 by the authors. Licensee MDPI, Basel, Switzerland. This article is an open access article distributed under the terms and conditions of the Creative Commons Attribution (CC BY) license (https://creativecommons.org/licenses/by/4.0/).