Abstract
Septic-derived nitrogen (N) sources have harmful effects on water resources, humans, and ecosystems in several countries. On Jeju Island, South Korea, the rapid increase in personal sewage treatment facilities (PSTFs, also known as on-site septic systems) raises concerns regarding the deterioration of groundwater quality, as groundwater is the sole water resource on the island. Therefore, this study employed a field study and numerical modeling to assess the impact of PSTF effluents on groundwater quality in the Jocheon area of northeastern Jeju. Water quality analysis revealed that the total nitrogen (T-N) concentrations in the effluent exceeded the effluent standards (75–92% PSTFs). The numerical model simulated the transport of N species, showing limited NH4+ and NO2− plume migration near the surface due to nitrification and adsorption. However, NO3− concentrations increased and stabilized over time, leaching on the water table with higher levels in lowland areas and clustered PSTFs. The predictive model estimated a 79% reduction in NO3− leaching when the effluents followed standards, indicating the necessity of effective PSTF management. This study highlights the importance of managing improperly operated septic systems to mitigate groundwater contamination based on an understanding of the behavior of N species in subsurface hydrologic systems.
1. Introduction
Groundwater is a major water resource that provides 50% of drinking water, 40% of irrigation water, and 30% of industrial water worldwide [1]. However, increasing anthropogenic activities such as agriculture, livestock farming, and wastewater discharge degrade groundwater quality [2,3]. Among the numerous types of groundwater contamination, nitrate (NO3−) contamination has been a significant issue in many countries [4,5,6]. Although the N component is an essential nutrient for plant growth, an excessive loading of N elevates the NO3− concentration in groundwater over a maximum criteria level (MCL) for drinking water of 50 mg/L of NO3− [7,8] or 10 mg/L of NO3-N [9,10,11,12]. Therefore, various studies have been conducted to identify the source and transformation of NO3− based on the stable isotope analysis [6,13], reduce the NO3− level in groundwater via applying remediation methods [14,15], and predict the groundwater NO3− concentration for the water quality management by using numerical models [16,17].
Among the various N contaminants, sewage discharge from septic systems has been identified as a major contributor to groundwater NO3− contamination in many countries [18,19,20,21]. In highly populated coastal areas in Florida, USA, the clustered septic systems are considered as the principal N source with an annual N load of 2.4–2.9 × 10¹⁰ g N/year [18], which present a threat to public health and the ecosystem by polluting groundwater and surface water [22,23]. In Hawaii, USA, approximately 88,000 cesspools (on-site sewage disposal systems, OSDS) are widespread across the islands, directly discharging pathogens and nutrients into groundwater [20]. Lu et al. [21] discovered that poorly managed septic tanks caused an increase in NO3− levels in groundwater in the Pearl River Delta, China, which underwent rapid urbanization in the early 2000s. In Hungary, effects of the sewage effluent remained in soil and groundwater more than 10 years after closure with detection of high NO3− and PO43− posing prolonged hazardous pollution due to septic effluents [24]. Moreover, contaminants from septic tanks, which are expected to support sewer treatment for 4.9 billion individuals by 2030, contribute to approximately 30% of the NO3− contamination in groundwater [25,26]. Hence, the effective management of septic systems to mitigate groundwater NO3− contamination is essential for understanding the behavior of N species in subsurface hydrologic systems.
Numerical modeling has been widely used to estimate the N load from septic systems and simulate the reactive transport of N species in the vadose zone and groundwater system [27,28,29,30,31,32]. In rural areas, mixed influences of multiple N sources, such as agriculture, livestock, and wastewater, are typically observed in groundwater, and quantifying the N load from septic effluent remains challenging. Karlović et al. [29] and Okuhata et al. [30] quantitively evaluated the N load from the septic system to groundwater in mixed land-use areas. Specifically, Okuhata et al. [30] combined the interpretation of simulated NO3− concentrations in the coastal Keauhou Aquifer, Hawaii, with δ15N analysis to validate the identification of multiple N sources. They suggested that OSDS accounted for the highest proportion of the N load (54%) compared with other N sources. Humphrey et al. [33] calculated the N loading from an on-site septic system installed in three different types of soil. Sand and sandy loam soils pose a higher risk of N loading than clayey soils. Pang et al. [31] simulated the reactive transport of N species and fecal coliforms discharged from clustered septic tank systems in New Zealand, which revealed a significant cumulative impact on groundwater NO3− concentrations, although the impact of fecal coliforms was localized. MacQuarrie et al. [32] developed a multicomponent reactive transport model to simulate a wastewater plume at the Cambridge site in the USA and discovered that the most significant biogeochemical changes occurred in the unsaturated zone, with complete nitrification converting NH4+ to NO3−.
Jeju Island, formed by multiple volcanic eruptions, is a tourist destination known for its stunning scenery and pristine environment on the Korean Peninsula. The island is primarily composed of porous volcanic rock, which allows rapid groundwater recharge; however, it is also vulnerable to surface contamination and land-use effects [34,35,36]. KOSIS [37] and JSSGP [38] reported that the population and visitors increased by 13% and 23%, respectively, over a decade (2013–2023), leading to an increase in wastewater discharge. Owing to an increase in population and visitors, many buildings have been constructed in mid-mountainous areas with elevations of 200–600 m a.s.l. However, public sewage networks are not sufficiently connected; therefore, personal sewage treatment facilities (PSTFs, known as on-site septic systems), which can purify wastewater from residential and commercial facilities, have been rapidly installed. PSTFs are the most numerous point sources, with a total of 10,977 in 2022, showing a two-fold increase over a decade (5141 in 2010). On Jeju Island, the effluent from the PSTFs directly infiltrates underground because of the lack of perennial streams due to its hydrogeological characteristics. JRI [39] examined the water quality of ten PSTFs effluents and, except for two facilities, almost all samples exceeded the effluent standard regulated by the Jeju Special Self-Governing Province, as total nitrogen (T-N) levels were exceeded three times. Similarly, JSSGP and Korea University [40] reported that manure and sewage impacted groundwater resources for tap water supply in 31 of 113 wells, whereas chemical fertilizers affected 68 wells.
Concerns have been raised about groundwater pollution on the island due to improperly treated effluents from the PSTFs. Calculating and predicting the quantitative impact of PSTFs on groundwater is crucial for groundwater quality management against the NO3− contamination. Therefore, this study aimed to (1) estimate the N loading rate based on field data from PSTFs in the Jocheon watershed, which is located in the northeastern part of Jeju Island and is characterized by the concentrated distribution of PSTFs, based on the T-N analysis in effluent samples from the PSTFs and the effluent discharge amount, (2) predict spatiotemporal behavior of the N species in the unsaturated and saturated zones using a numerical model considering reactive transformation of NH4+, and (3) simulating the NO3− leaching on the water table by major N sources such as the PSTF effluents and chemical fertilizers applied from crop fields. Based on the results of the PSTF effluent quality and the numerical model, this study proposed appropriate PSTF management plans for Jeju Island.
2. Study Area
Jeju Island is located in the southwestern part of the Korean Peninsula and was formed by multiple volcanic eruptions over 1.8 Ma [41]. In Jeju, groundwater is the sole water resource because perennial streams are rarely developed on the island due to the hydrogeological characteristics of the highly permeable volcanic rocks [42]. Approximately 96% of the total water use relies on groundwater for drinking, irrigation, and other purposes [43].
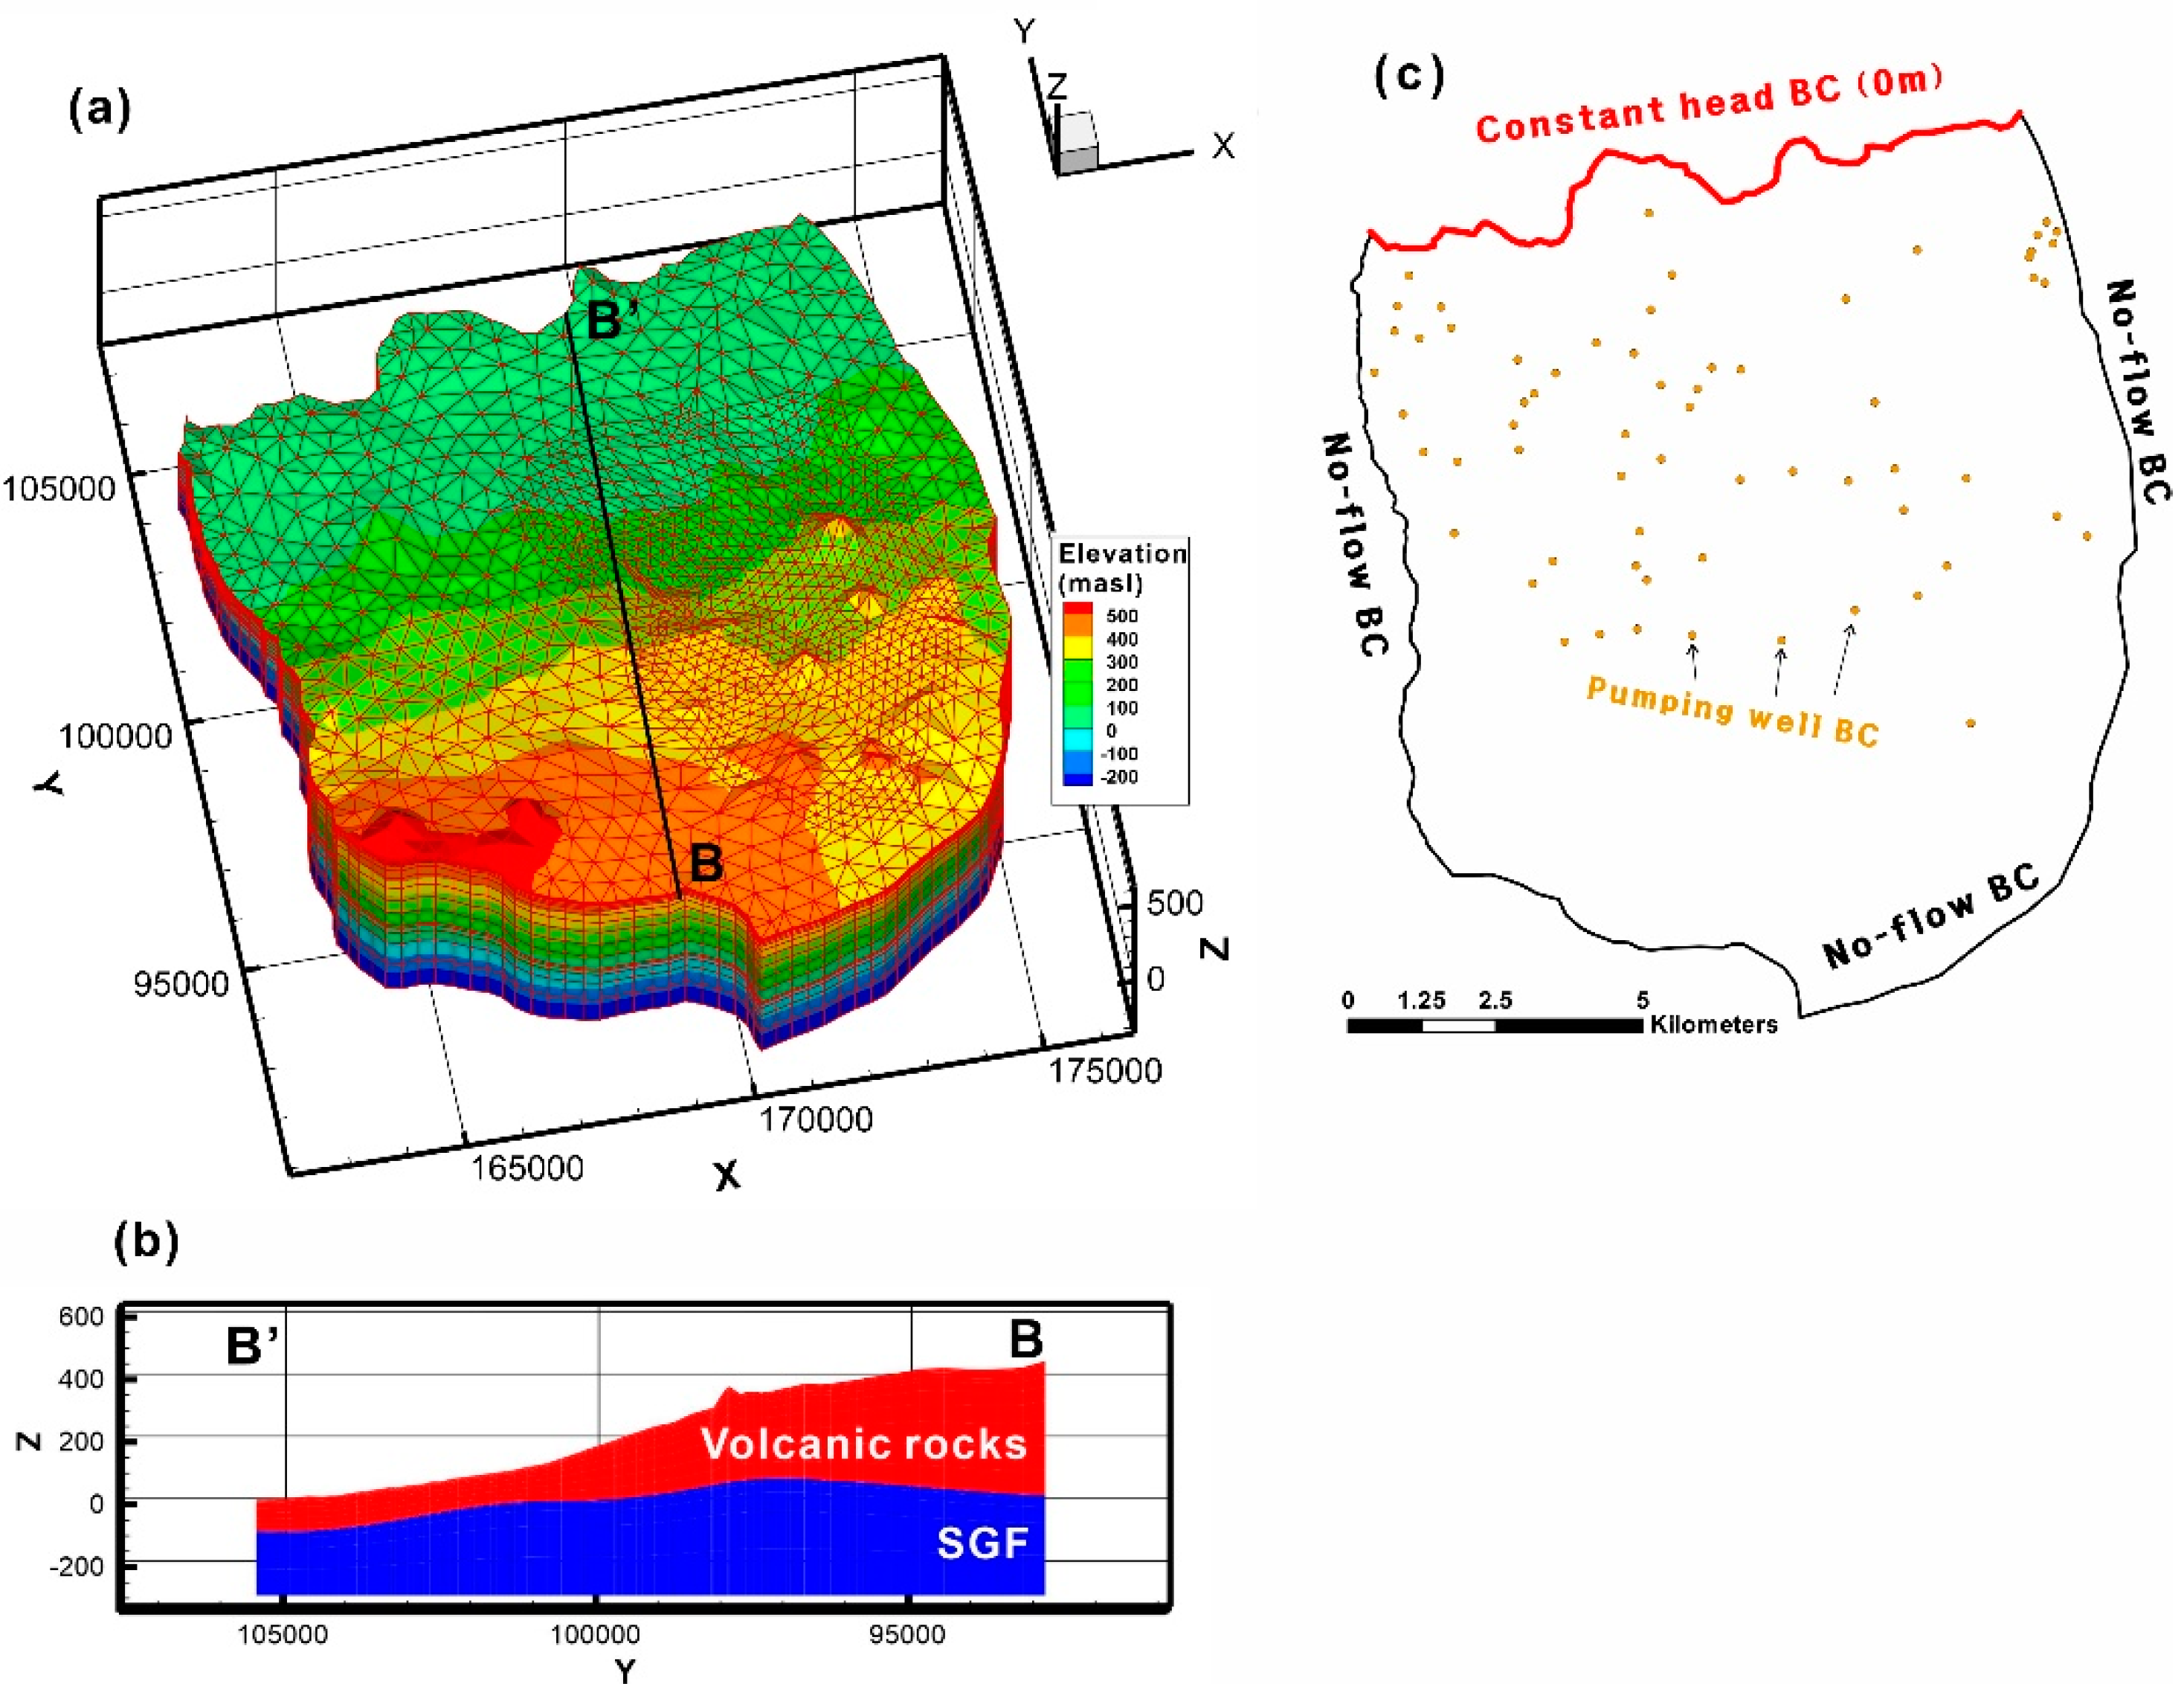
The Jocheon study area is situated in the northeastern part of Jeju Island (Figure 1a,b) and covers 145 km2. The annual rainfall in Jocheon was 1517 mm in 2022 (measured at the Daehul weather station [43]), which was higher than that for the entire island (1362 mm). Additionally, the groundwater recharge rate in the Jocheon watershed was 55%, whereas the mean recharge rate for the entire island was 46%. Figure 1c displays the geological distribution of the study area through an A to A′ cross-section of the boreholes (Figure 1b, mint-filled circles). The two major geological layers of volcanic rocks and the Seogwipo Formation (SGF) comprise the subsurface geology of the study area. The SGF, which underlies volcanic rocks, is composed of sand, bioclastic shells, basaltic tuff, and mudstone, and is characterized by low permeability [42]. Volcanic rocks, which are the major geological units on Jeju Island, overlie the SGF. Clinkers, joints, and fractures developed in the volcanic rock layers act as the main channels for groundwater flow [35]. The clay unit (paleosol) is interbedded between the volcanic rock layers, indicating periods of volcanic dormancy [44].
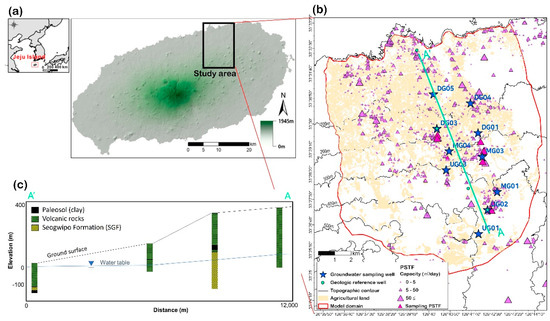
Figure 1.
Map of (a) Jeju Island and (b) the Jocheon study area in the northeastern Jeju Island, South Korea showing PSTFs (personal sewage treatment facilities), agricultural land, and sampling locations (PSTFs and groundwater wells), and (c) a geological cross-section along line A−A′ in (b).
The Jocheon study area is covered with 10 km2 of urban area (7% of the total land area), 47 km2 of agricultural land (32%), and 88 km2 of forests and grasslands (61% [45]). In the agricultural land, tangerine, buckwheat, and soybeans are commonly farmed and received 890,377 tons of N fertilizers in 2021 accounting for 5.5% of the total N use (16,110,222 tons) on the entire island. In the study area, there are 1128 PSTFs with a total capacity of 4775 m3/day, accounting for 10% of the total PSTFs on Jeju Island (Figure 1b). According to the daily treatment capacity, there were 934, 186, and 8 PSTFs < 5 m3/day, between 5 and 50 m3/day, and ≥50 m3/day, respectively. On Jeju Island, PSTFs with ≥50 m3/day capacity (1% of the total PSTFs in Jocheon) were required by law to hire a professional treatment manager until April 2024, whereas PSTFs with <50 m3/day capacity (99%) are managed by building owners who may lack of understanding of sewage treatment. Owing to the ordinance amendment, from May 2024, a PSTF with ≥20 m3/day capacity is required to hire a professional treatment manager.
3. Materials and Methods
3.1. PSTFs and Groundwater Sampling
The PSTF effluents from 40 facilities in the study area were sampled between March and June 2022. Temperature, electrical conductivity (EC), pH, and dissolved oxygen (DO) were measured in situ using a multi-parameter instrument (ProQuatro, YSI, Yellow Springs, OH, USA). The effluents were collected in a 2 L polyethylene sterilized sampling bag to analyze the biochemical oxygen demand (BOD) and total nitrogen (T-N). BOD and T-N were analyzed at the KOTITI Testing & Research Institute (Gwacheon-si, Republic of Korea). Additionally, NH4+ was analyzed in an additional 10 PSTFs effluent samples (Figure 1b, magenta-filled triangles) twice (March and June 2022) to compare the T-N concentration.
Groundwater was also sampled from 10 groundwater wells to assess the influence of PSTFs effluents on water quality (Figure 1b, blue-filled stars). Two groundwater sampling campaigns were conducted in March and June 2022. Temperature, EC, pH, and DO were measured in situ after purging the wells until the parameters stabilized. Samples were filtered using a 0.45 μm pore size filter and stored at 4 °C until before the chemical analysis. NO3− and NO2− were analyzed at the Korea Basic Science Institute (Cheongju-si, Republic of Korea), and NH4+ was analyzed at the KOTITI Testing & Research Institute (Gwacheon-si, Republic of Korea).
3.2. Estimation of Discharge and N Loading from the PSTFs Effluents
To estimate the N loading from the PSTF effluent, the sewage discharge of each building (1128 in total) with installed PSTFs and the N loading unit of the building were used. The sewage discharge rate was calculated based on the tap water usage data of the building in 2022 (provided by Jeju Special Self-Governing Province). The conversion ratio from tap water to sewage is 0.8, according to a previous study [46]. The N loading unit was calculated based on building usage and PSTF capacity using the 40 PSTF effluent T-N concentration. Eleven types of building usage were considered (Figure S1), and the capacity was divided into three classes: <5 m3/day, between 5 and 50 m3/day, and ≥50 m3/day. PSTFs with a capacity exceeding 50 m3/day were supposed to discharge 20 mg/L of T-N, which is the maximum allowed T-N level, because they were managed by experts. PSTFs with a capacity below 50 m3/day were expected to discharge a range of 1.7 mg/L to 53.8 mg/L T-N, depending on their capacity and building usage (Table S1).
3.3. Model Settings
A three-dimensional numerical model was used to assess the behavior of N pollutants from the PSTF effluent in the unsaturated and saturated zones. HydroGeoSphere [47] was used to simulate variably saturated groundwater flows and the reactive transport of N species (NH4+, NO2−, and NO3−) in this study. The governing equation for three-dimensional variably saturated groundwater flow [47] is as follows,
where q is the fluid flux (L/T) given by Equation (2), Q is a volumetric fluid flux per unit volume representing source/sink (1/T), θs is the saturated water content (dimensionless), and Sw is the degree of water saturation (dimensionless), t is the time (T), K is the saturated hydraulic conductivity tensor (L/T), kr is the relative permeability with a function of Sw, ψ is the pressure head (L), and z is the elevation head (L).
Also, the governing equation for three-dimensional transport of solutes in a variably saturated porous medium [47] is as follows,
where C is the solute concentration (M/L3) of the current species among multiple species, D is the hydrodynamic dispersion tensor (L2/T), λ is a first-order decay constant (1/L), par is the parent species for a decay chain, and Qc is a solute exchange with the outside of the model domain representing source/sink (M/L3/T). R is the retardation factor (dimensionless).
The boundary of the model domain was set according to the coastline and groundwater flow directions. The model domain covered an area of 154 km2 with vertical and horizontal dimensions of 12 km and 15 km, respectively (Figure 1b). The surface of the model domain was defined based on the topology using digital elevation model (DEM) data. The elevation ranged from 0 m a.s.l. on the coastline to 563 m a.s.l. at the highest point in the southwestern region (Figure 2a). A uniform elevation of the domain bottom was set at −300 m a.s.l. The model grid was constructed using a finite element triangular mesh, and the mesh around the monitored PSTFs and groundwater wells was refined. The model lithology was constructed using two layers, volcanic rocks and the SGF (Figure 2b), based on geologic logs obtained from groundwater wells in the study area [48]. The input parameters for the model are provided in Table 1, as referenced in previous studies [49,50,51].
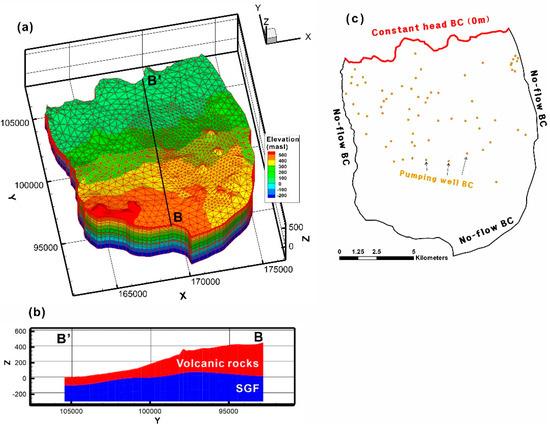
Figure 2.
(a) A three-dimensional model domain, (b) cross−sectional geologic layers (B−B′ in (a)) in the model (Z exaggeration: 5) and (c) boundary conditions (BCs) for numerical modeling.

Table 1.
Input parameters used for the model.
The boundary condition (BC) of a constant head (Figure 2c) was set along the coastline of the northern part of the model domain at 0 m. No flow BCs were assigned along the upstream, left, or right sides of the outer domain boundaries. Uniform groundwater recharge conditions were set at the top domain surface based on yearly precipitation data from 1991 to 2020 recorded at the weather station (Figure S2). The recharge rate was calculated as 55% [52] of the yearly mean precipitation in the different elevation zones of 0–200, 200–400, and 400–600 m a.s.l. Groundwater pumping at the agricultural wells was assigned using groundwater usage data from 2001 to 2020 (provided by the Korea Rural Community Corporation in Jeju).
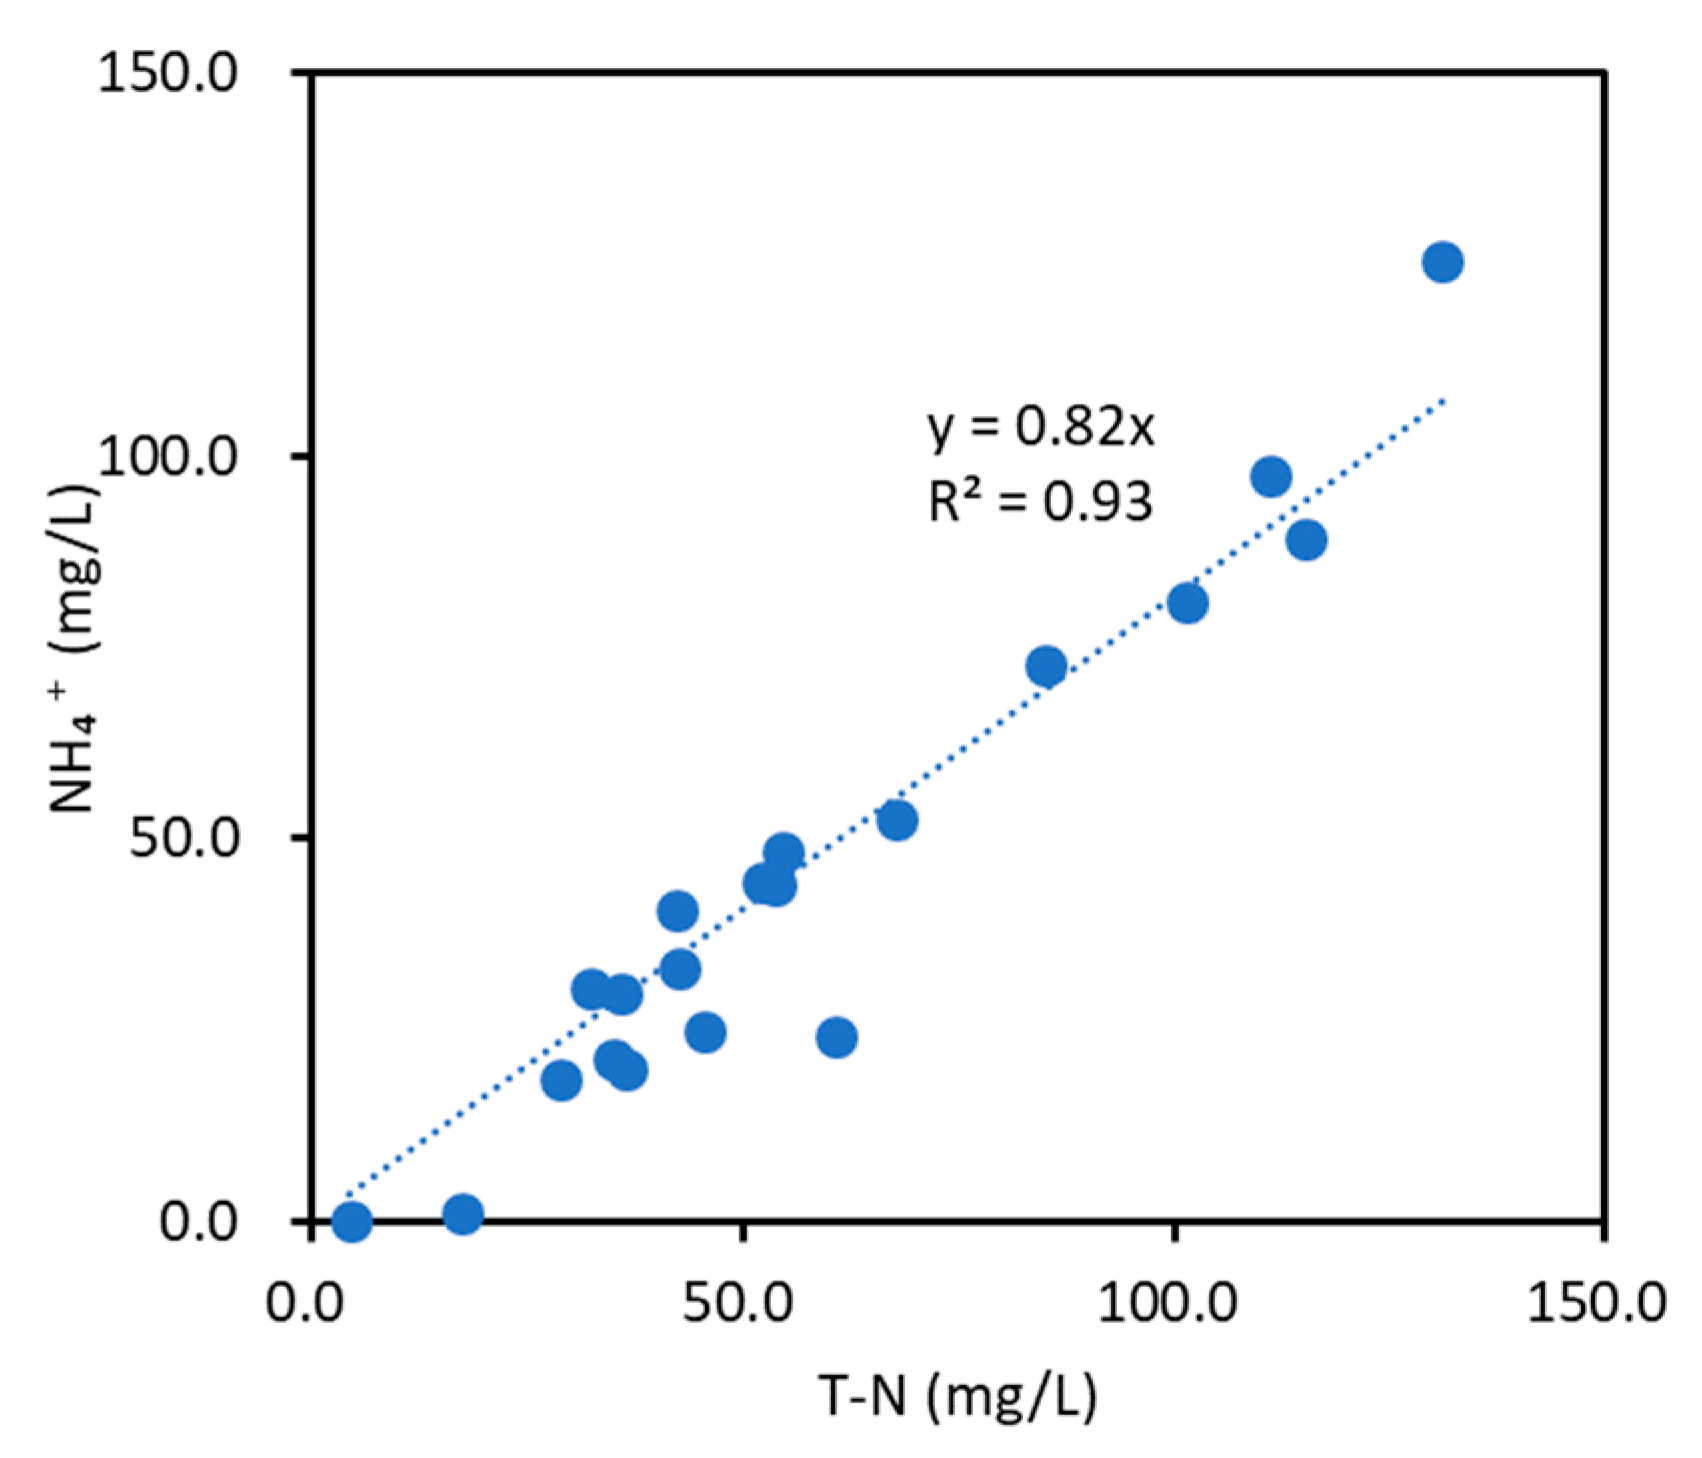
For the N species transport, the N loading of the T-N discharge from 1280 PSTFs (Figure S3) was used for modeling. The T-N loading rate was converted to the NH4+ concentration based on the sewage discharge and water quality analysis results of the PSTFs, showing a linear relationship (Equation (4), Figure 3). The NH4+ that infiltrates underground is rapidly oxidized and converted into NO2− and NO3− [53]. To simply simulate the nitrification process of NH4+ from the PSTF effluent, sequential first-order decay reactions [54] were utilized (Equation (5), Table S2). The denitrification transformation was not considered in our model, as the denitrification process does not occur in the groundwater of Jeju Island, according to the previous study [6]. The NH4+ component has a positive charge, allowing it to be adsorbed onto the negatively charged surfaces of soil particles [55]. Consequently, the behavior of high-concentration NH4+ pollution discharged into sewage, removal, and retardation of NH4+ components due to adsorption was observed [54]. The adsorption of NH4+ was also considered in the model using a retardation factor (R).

Figure 3.
Relationships of T-N and NH4+ in PSTF effluents.
The variables μ1, and μ2 represent the first-order decay constant, respectively. Values of first-order decay constants and retardation factor used in the model are listed in Table S2, with referenced values from a previous study [56].
In the study area, N chemical fertilizers applied to agricultural fields also contribute to the enrichment of NO3− in groundwater, in addition to PSTFs [57]. Therefore, the influx of NO3− from agricultural activities was incorporated into the solute transport model. Modeling of the transport of N species was conducted under the following four scenarios: In scenario 1, the N loading was assumed to be caused only by the PSTFs effluent. Scenario 2-1 only considered the N loading from chemical fertilizer applied to agricultural land. In scenario 2-2, the N loading was assumed to be caused by both the PSTF effluent and N fertilizer. For areas with agricultural fields (Figure 1b), the observed NO3− concentration in the soil layer, due to the use of chemical fertilizers in the Gosan area of Jeju Island [58], was referenced. The amount of N fertilizer applied in 2017 in the Gosan and Jocheon areas [57] was used to adjust the NO3− concentration in the upper soil layer of the agricultural fields in the Jocheon model area. In scenario 3, the discharge of the PSTFs effluent was assumed to follow the T-N standard of 20 mg/L (Table S3) to evaluate the effect of managing the water quality of the effluent. The loading of agricultural N sources was not considered in scenario 3.
4. Results and Discussion
4.1. PSTFs Effluent Quality
Temperature of the PSTF effluents ranged from 11.1 to 27.2 °C (Table 2), approximately equivalent to room temperature. EC ranged from 416 μS/cm to 1711 μS/cm, which is similar to the sewage EC of 1480 ± 131 μS/cm investigated by Geary and Lucas [59]. The pH showed a neutral range for an average of 7.0 ± 0.7, the appropriate condition for microbial activity in nutrient degradation [60]. DO averaged 2.9 ± 2.6 mg/L, sufficient for aerobic degradation [60]. BOD and T-N concentrations varied from 5.4 to 107.8 mg/L and 3.2 to 131.1 mg/L, respectively.
Table 2.
Descriptive statistics of water quality parameters in the PSTFs effluent.
A total of 22 PSTFs (92% of 24 PSTFs with a capacity <5 m3/day) and 12 PSTFs (75% of 16 PSTFs with a capacity ≥5 m3/day) exceeded the effluent standards for BOD at <20 mg/L and <10 mg/L (Table S3), respectively. A total of 13 PSTFs (81% of 16 PSTFs with a capacity ≥5 m3/day) exceeded the effluent standards for T-N (<20 mg/L, Table S3). The NH4+ concentration in the PSTF effluents ranged from not detected (ND) to 125.5 mg/L. According to seasons, NH4-N and T-N from the effluent in March ranged from 1.0 to 97.4 mg/L and 17.2 to 111.0 mg/L (Figure S4a), respectively. In June, NH4-N and T-N exhibited similar ranges from ND to 125.5 mg/L and 4.4 mg/L to 131.1 mg/L, respectively. Seasonal differences in the NH4-N and T-N concentrations in the effluent were not observed. The major N species in the PSTF effluents was NH4+, constituting a contribution ratio ranging from 0.0 to 75.6% (median: 61.3%) implying that the nitrification process, in which NH4+ is oxidized to NO3−, did not significantly occur during PSTF treatment. In addition, as shown in Figure 3, T-N and NH4+ had a linear relationship, with 82% of the T-N being NH4+ (R2 = 0.93).
4.2. Groundwater Quality
In groundwater samples from the study area, temperature, EC, pH, and DO were averaged at 14.9 ± 1.8 °C, 97.9 ± 22.2 μS/cm, 7.9 ± 0.4 and 10.2 ± 1.0 mg/L, respectively (Table 3). The levels of BOD and T-N ranged from 0.2 mg/L to 2.2 mg/L and from 0.1 mg/L to 2.9 mg/L, respectively, which were significantly lower than those found in PSTF effluents. According to the conditions required for denitrification [61], a DO level below 2.0 mg/L is suitable for denitrifying bacteria to use NO3− as an electron acceptor. Additionally, BOD/T-N ratio of groundwater in the Jocheon area, which averaged 2.01 ± 2.93, is insufficient to cause denitrification using heterotrophic bacteria [62]. Therefore, denitrification was unlikely to occur in groundwater of the study area. NH4+ and NO2− were not detected in the groundwater samples, indicating that the organic N compounds discharged from the PSTF were sufficiently oxidized during infiltration through the subsurface medium.
Table 3.
Descriptive statistics of water quality components in groundwater.
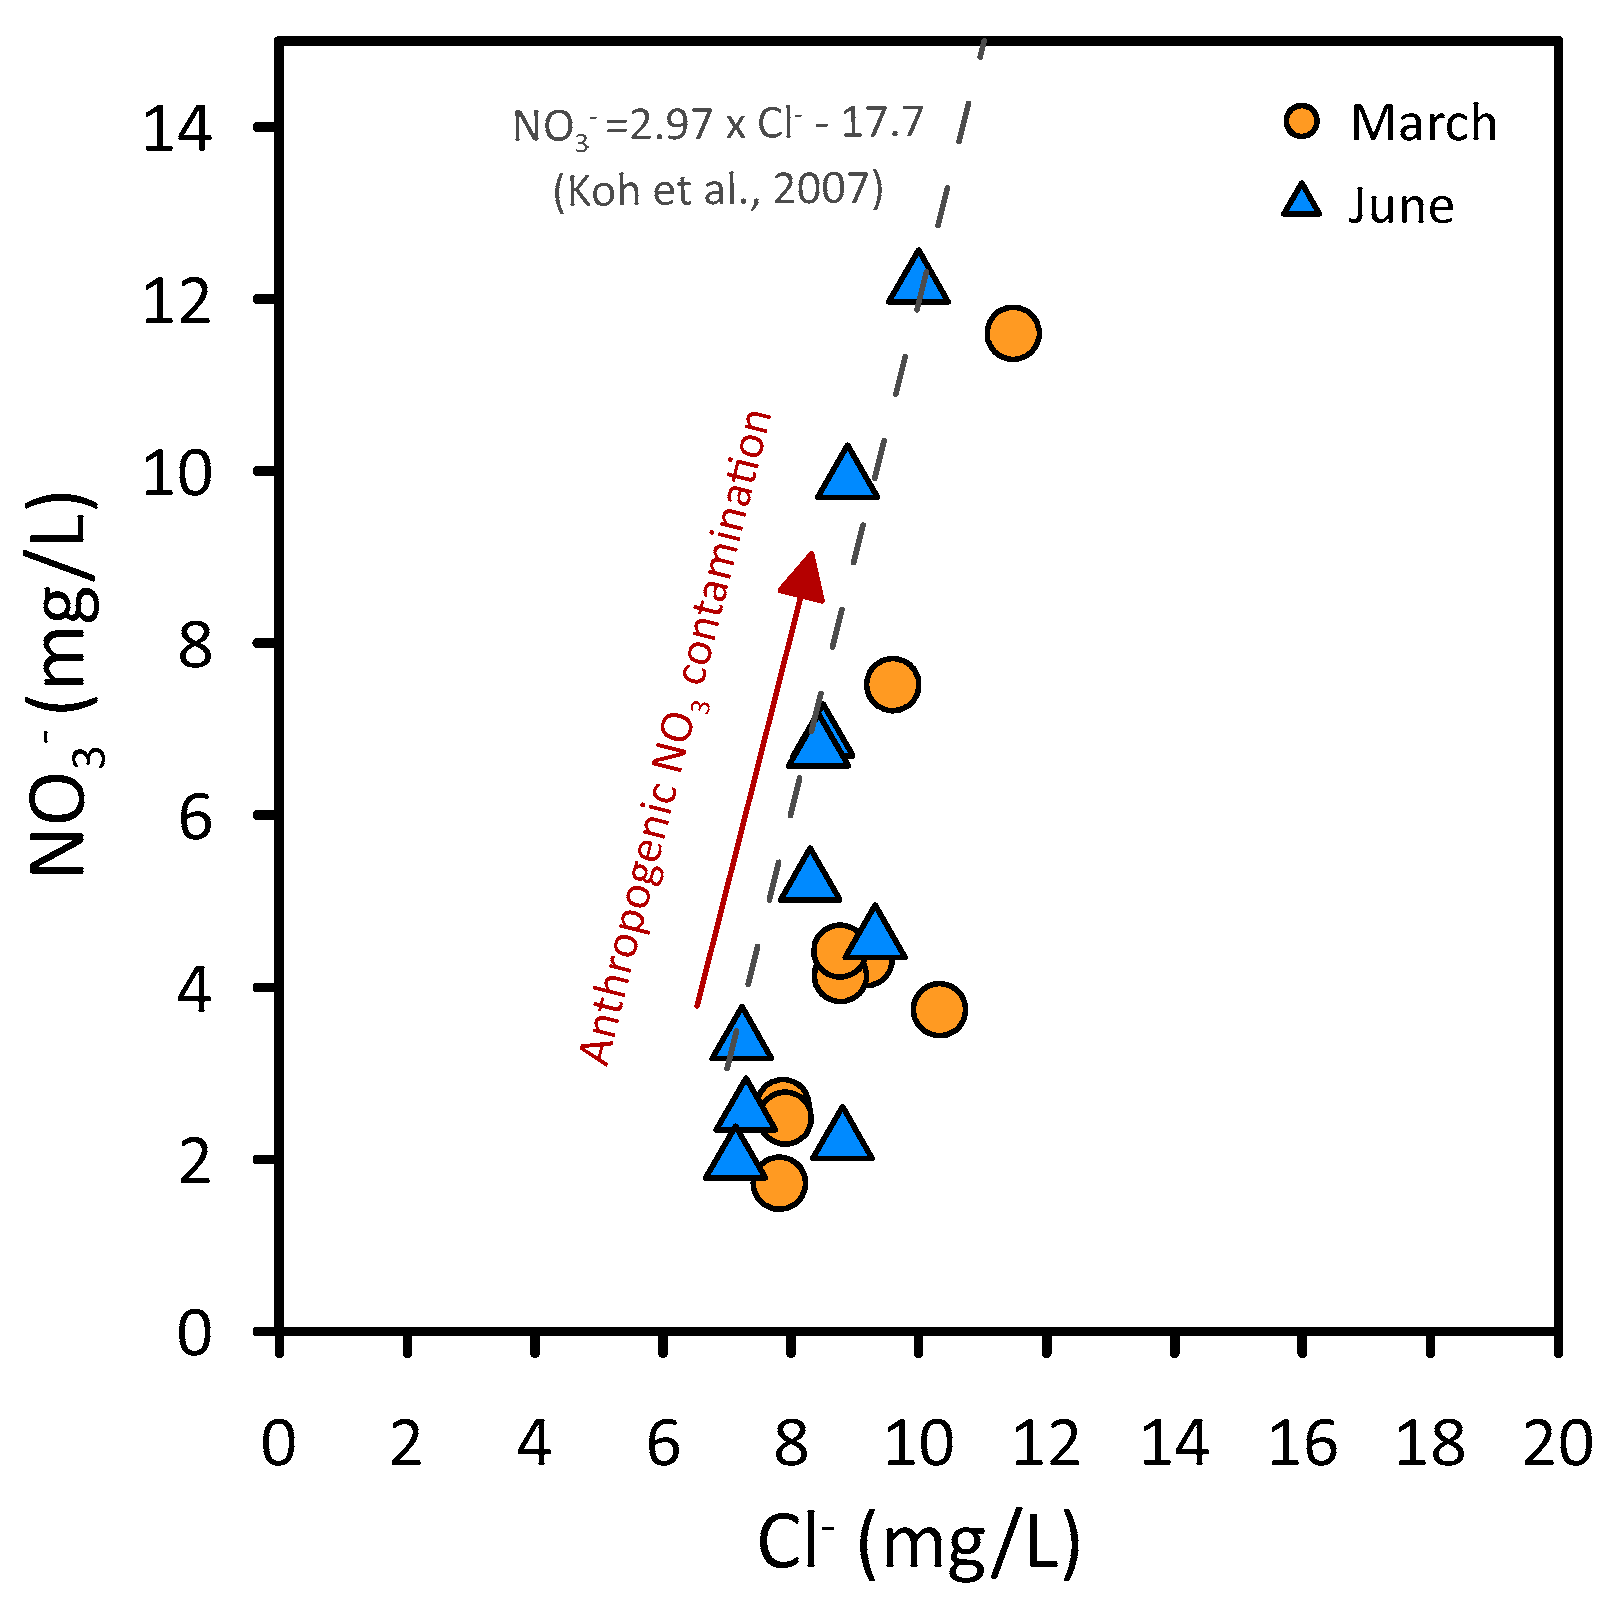
Average NO3− and Cl− concentrations in the groundwater were measured as 5.2 ± 3.2 mg/L and 8.7 ± 1.1 mg/L (Table 3), respectively. The NO3− concentration was higher than the background water quality level in Jeju Island (5.5 mg/L [63]), while the Cl− was close to the natural water quality level (average: 8.8 mg/L [64]). Koh et al. [34] suggested that a linear increase in NO3− compared to Cl− indicated the influence of anthropogenic contamination in the groundwater on Jeju Island. The relationship between Cl− and NO3− in Jocheon groundwater also showed a trend similar to that suggested by Koh et al. [34], indicating the influence of anthropogenic N contaminants (Figure 4). As see the spatial distribution of NO3− in the groundwater (Figure S4b), the NO3− levels increased along the groundwater flow through the clustered PSTF area. Groundwater wells (UG01, UG03, and MG03), which are located upstream of the clustered PSTF area, showed lower NO3− levels (1.7–3.7 mg/L) compared to the wells in the downstream area (DG01, DG05, and DG04, NO3− concentration: 4.1–11.6 mg/L). This indicated that the effluent from the clustered PSTFs likely accumulated NO3− in the groundwater as it flowed downstream. However, various N sources, such as chemical fertilizers, livestock waste, and septic wastewater, have been reported to affect NO3− in the groundwater [57,65,66,67]. Therefore, the combined influence of N sources, in addition to septic wastewater, can occur in the study area.
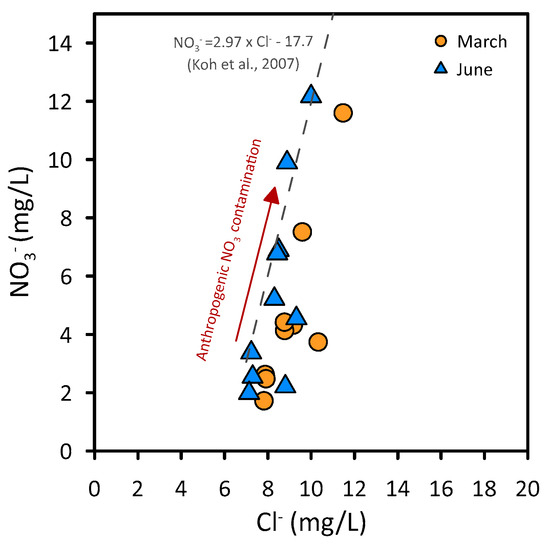
Figure 4.
Relationships of Cl− and NO3− in groundwater. Gray dotted line indicates anthropogenic NO3− contamination in groundwater suggested by Koh et al. [34].
4.3. Calculation of T-N Loading by PSTFs Effluent
The T-N loading units of the PSTFs were calculated based on the T-N results of the 40 PSTFs, considering their building usage and capacity (Table S1 and Figure S1a). The T-N loading rate was multiplied by the unit load of T-N and the sewage discharge quantity of 1280 PSTFs. Therefore, the total amount of T-N discharge quantity was 15,540 kg/y. According to building usage, 9510 kg/y (61%) of T-N was from residential buildings, 2332 kg/y (15%) was from business facilities, and 2085 kg/y (13%) was from accommodation facilities (Table S4). Regarding the PSTF capacity, 10,358 kg/y (67%) of T-N was from PSTFs with a capacity of less than 5 m3/day, 4988 kg/y (32%) of T-N was from PSTFs with a capacity between 5 and 50 m3/day, and 194 kg/y (1%) of T-N was from PSTFs with a capacity of ≥50 m3/day. Scattered T-N loading from the PSTFs was observed throughout the study area (Figure S3). Clustered PSTFs are located in several regions and have overlapping T-N loadings, which have a cumulative impact on groundwater quality [31,68]. In addition, the PSTFs were also located in mid-mountainous areas (elevation ranges from 200 to 600 m a.s.l.), and septic discharges of 974 kg/y T-N were estimated (Figure S3). On Jeju Island, the mid-mountainous area is considered the major groundwater recharge region [69,70], therefore, it is important to prevent groundwater contamination by PSTF effluents.
4.4. Numerical Modeling Results
4.4.1. Model Calibration
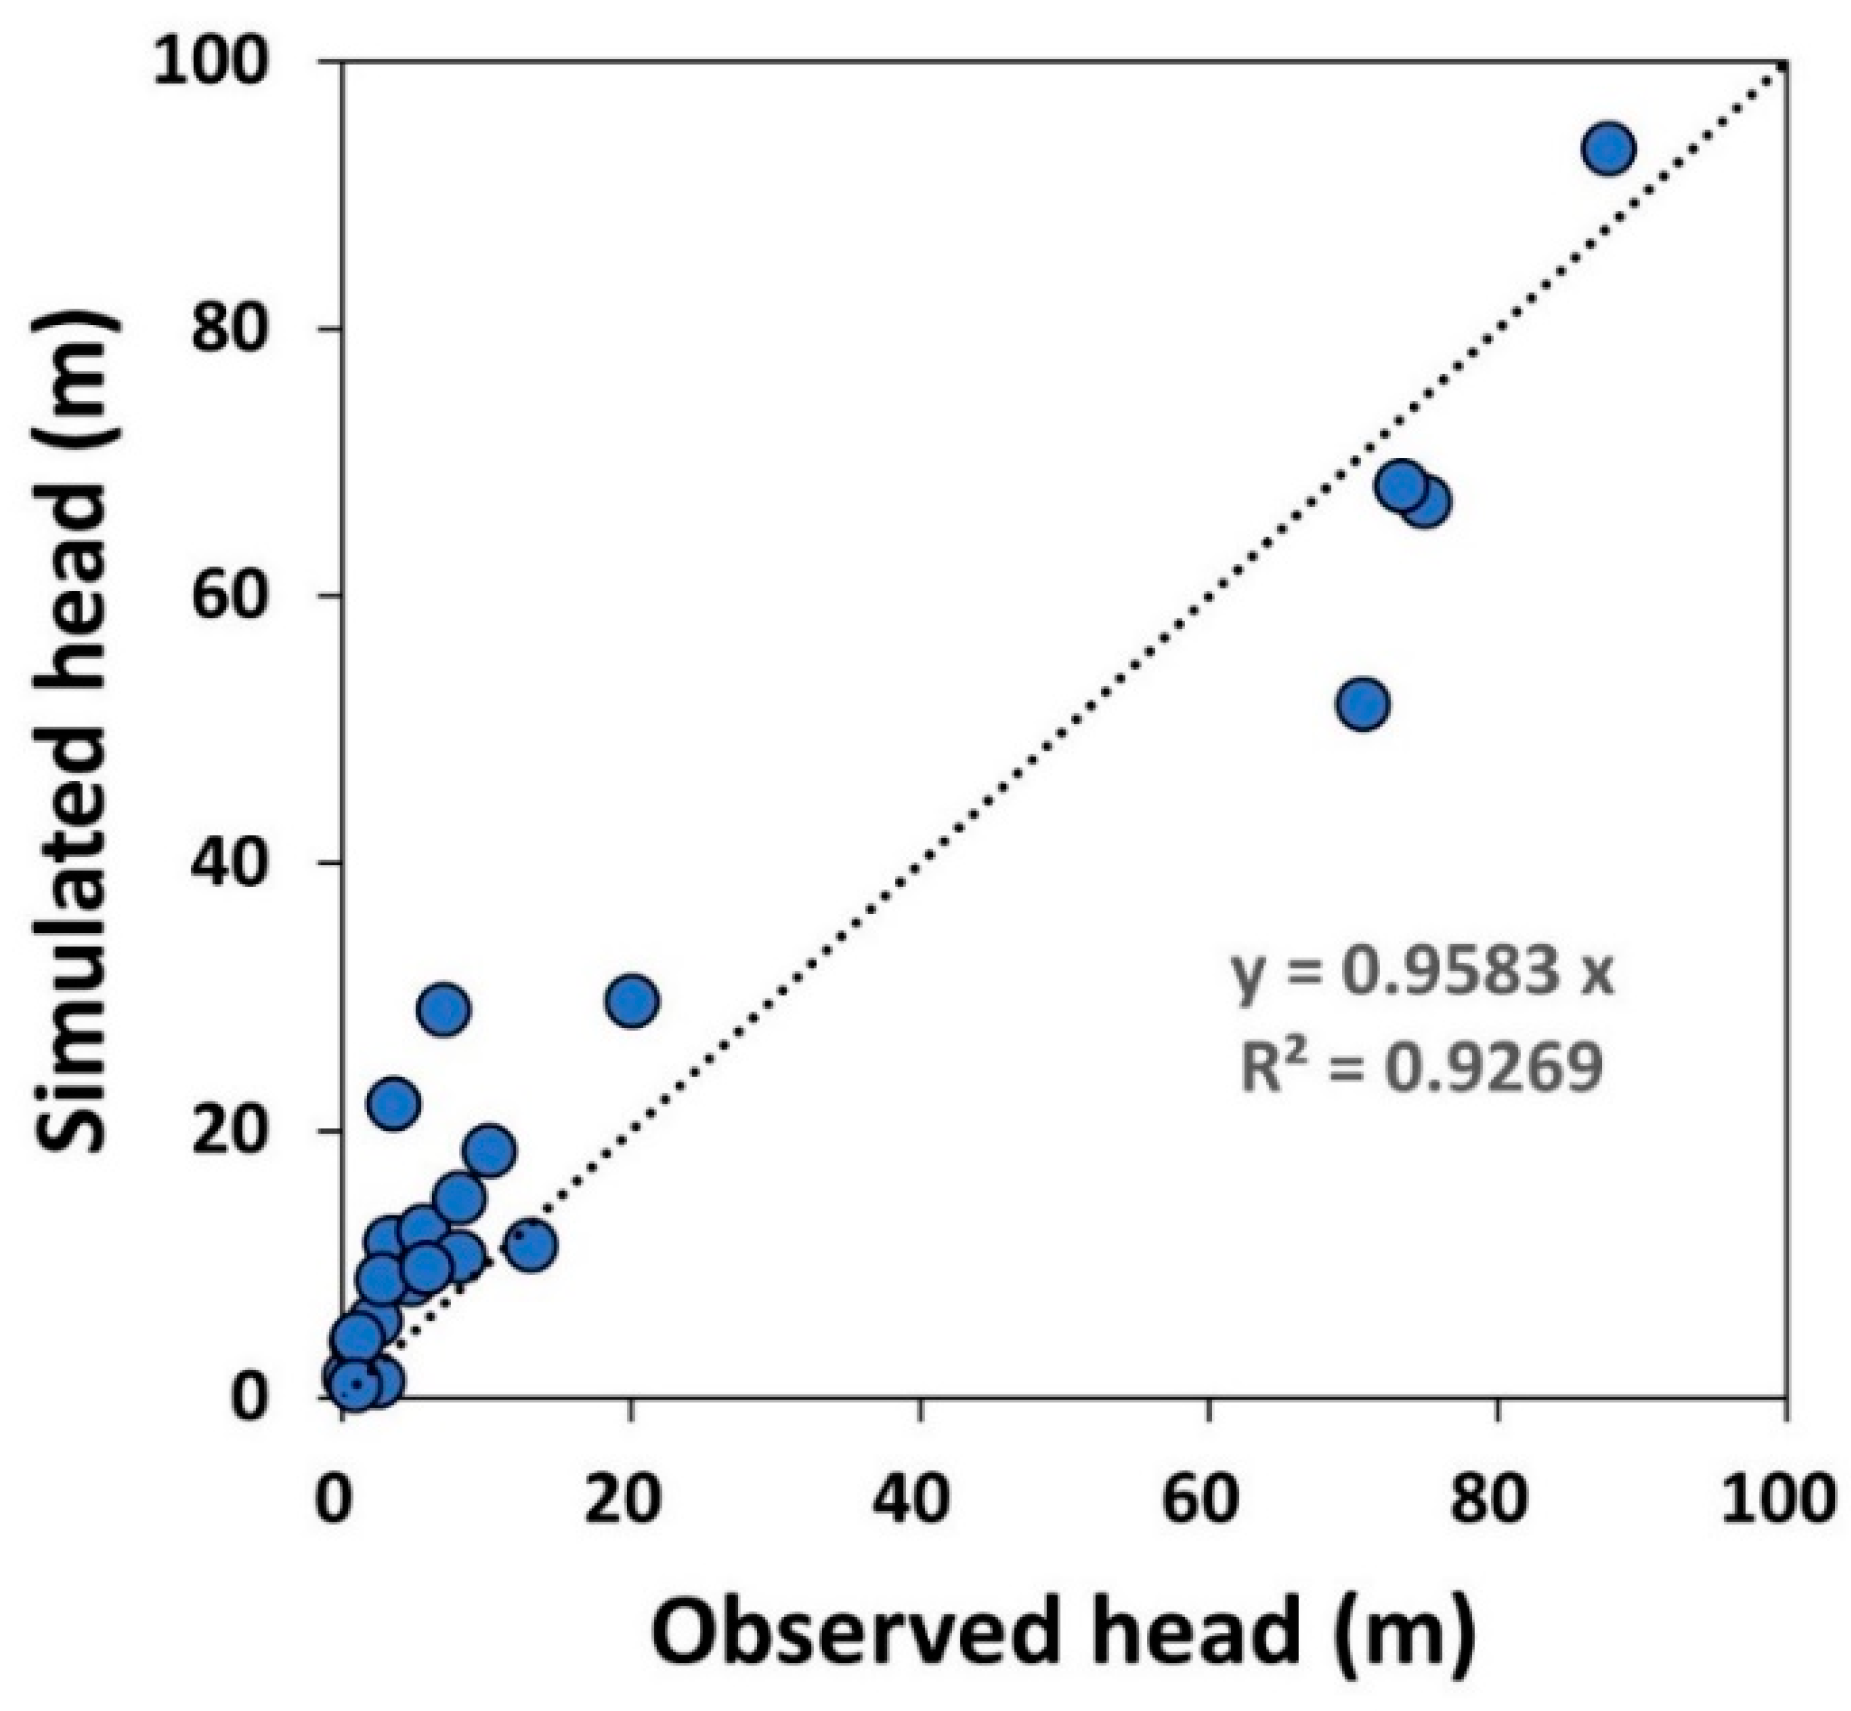
Calibration of the numerical model was conducted for the groundwater head and NO3− concentration using a trial and error method. For the transport model of N species, only the NO3− component was used for the model calibration as the other N species, NH4+ and NO2−, were not detected in the groundwater samples from the study area (Table 3). The groundwater head was calibrated using the groundwater levels observed in the monitoring wells (blue circles in Figure S2) by adjusting the hydraulic conductivity of each geological layer, volcanic rock, and SGF. A high R2 value of 0.9269 was obtained by comparing the simulated and observed heads (Figure 5), indicating that our model sufficiently represented the groundwater flow field in the study area. The highest groundwater level was simulated in the southwestern highland (>150 m a.s.l.) and gradually decreased toward the northern coastal area (0 m a.s.l.), as shown in Figure 6a. Groundwater generally flows from the southwest to the north. An unsaturated zone, with saturation lower than 0.4, developed, and below the water table, a fully saturated condition was simulated by the model (Figure 6b).

Figure 5.
Comparison between observed and simulated groundwater heads.
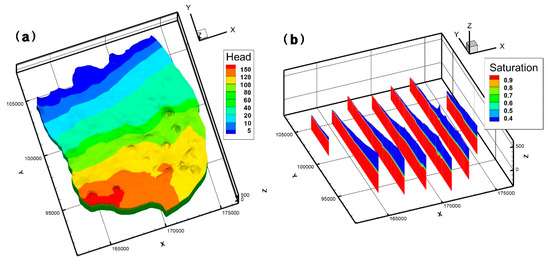
Figure 6.
Simulated (a) head and (b) saturation in steady-state condition (Z exaggeration: 5).
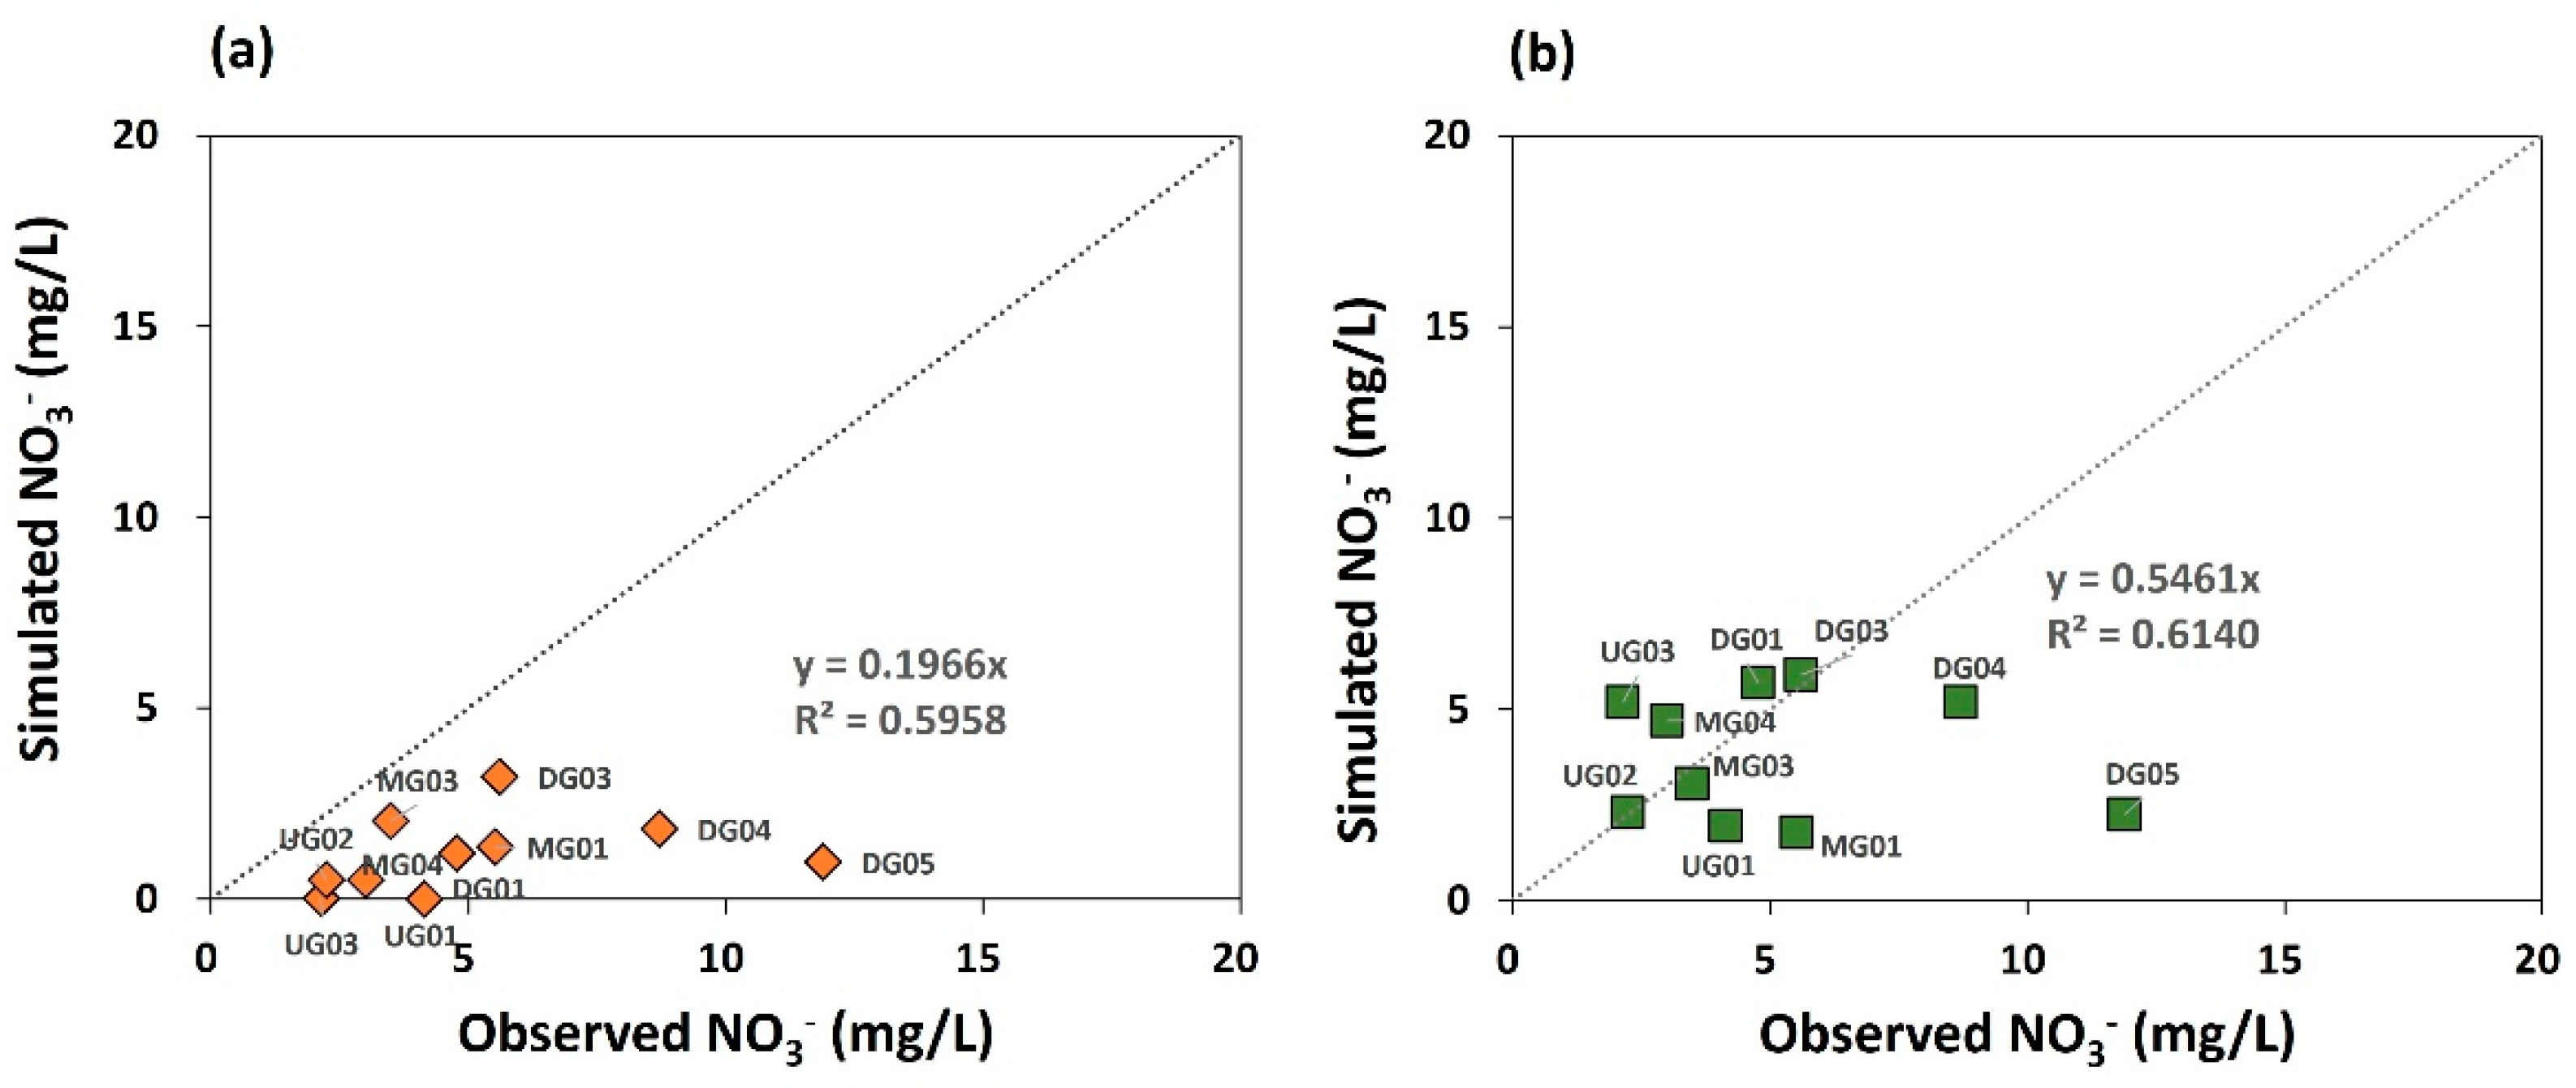
Unlike the head calibration, an R2 of 0.5958 was obtained in the NO3− calibration from the scenario 1 model (Figure 7a), which considered N loading only from the PSTF effluent. The simulated NO3− concentrations in scenario 1 were lower than the measured NO3−. However, scenario 2-2, which included additional N sources such as PSTF effluent and chemical fertilizers, exhibited improved calibration results with an R2 value of 0.6140 (Figure 7b). Despite this improvement, several wells (DG05, DG04, and MG01) showed lower simulated NO3− values than the observed NO3−, implying a lack of consideration of the spatially heterogeneous characteristics of agricultural activities in our model.

Figure 7.
Comparison between observed and simulated NO3− concentrations in groundwater. N source loading (a) only from PSTFs (scenario 1), and (b) PSTFs and chemical fertilizer (scenario 2−2).
4.4.2. N Species Transport
The vertical distribution of the N species (NH4+, NO2−, and NO3−) over time, as a simulated result (scenario 1) of the NH4+ decay chain, is presented in Figure 8. After the release of the effluent from the PSTFs, NH4+ exists at higher concentrations near the surface over time (Figure 8a–c). However, vertical infiltration is limited because of attenuation by nitrification and adsorption onto the soil medium. MacQuarrie et al. [32] also discovered restricted vertical and horizontal movement of the NH4+ plume at the Cambridge site, Canada, showing the occurrence of nitrification completion of less than 1 m in the unsaturated zone from the septic system. Similar to the NH4+ plume, the NO2− concentration is elevated near the surface (Figure 8d–f) as NH4+ converts to NO2− and then rapidly converts to NO3−. NO3−, the final product of nitrification, gradually migrates into the subsurface over time (Figure 8g–i) as its movement is not inhibited by adsorption or chemical reactions in the unsaturated zone. The NO3− concentration increased and stabilized, reaching its highest level after 10 years, showing the highest NO3− concentration immediately below the NH4+ plume.
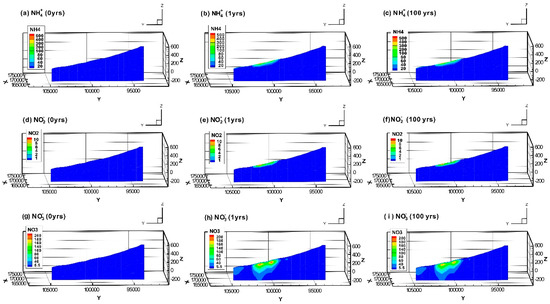
Figure 8.
Cross−sectional view showing spatiotemporal changes in simulated (a–c) NH4+, (d–f) NO2−, and (g–i) NO3− concentration (unit: mg/L). Location of the cross−section is provided in Figure 2a.
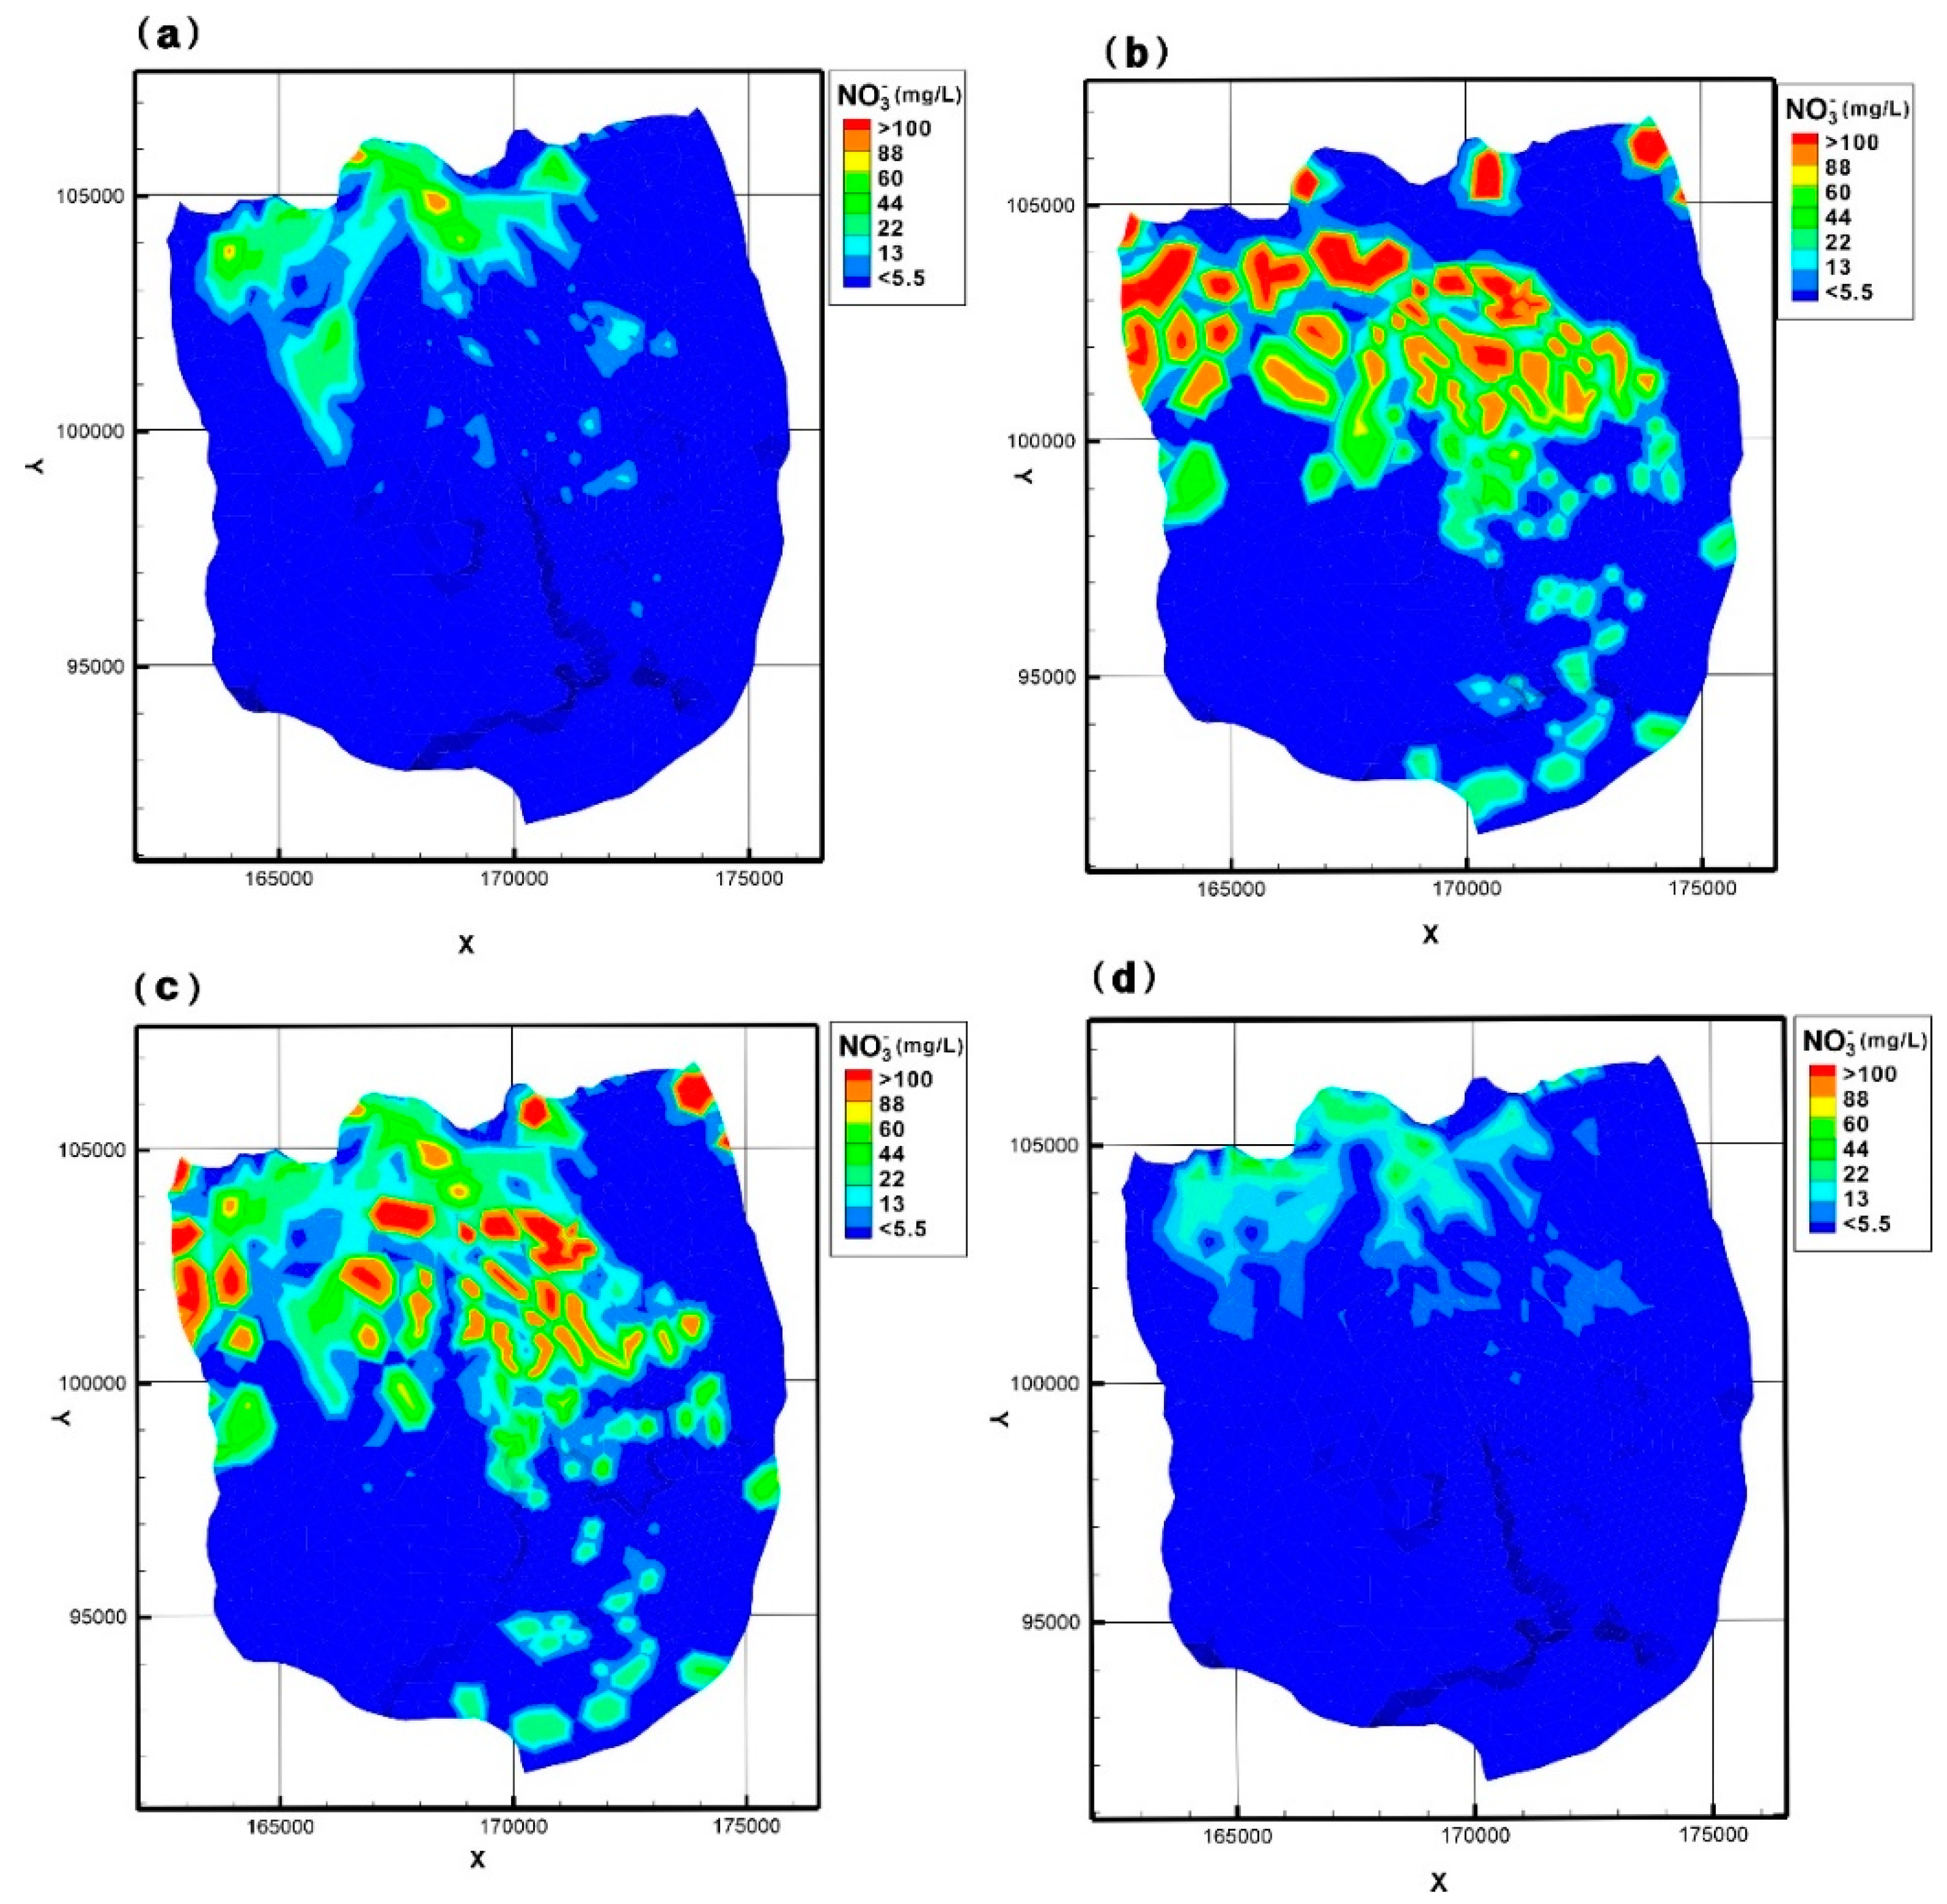
Figure 9 shows the spatial distribution of the simulated NO3− concentration leaching to the water table. In scenario 1, considering the PSTF effluent as the only N source, the downstream area reached a maximum NO3− concentration of 94 mg/L (Figure 9a), which exceeds the drinking water standard for NO3− in South Korea (45 mg/L and 10 mg/L as NO3-N). Leaching of higher NO3− concentrations tended to occur in the clustered PSTF areas with elevations lower than 200 m a.s.l. A clustered septic tank system has a cumulative impact on groundwater [31,71]. Pang et al. [31] demonstrated that density increases in a septic system accumulate NO3− in groundwater, owing to a reduction in dilution effects. The results of our model indicated that, although clustered PSTFs were also located in highland areas (elevation > 200 m a.s.l.), lower NO3− concentrations were simulated to leach into the water table. In high-elevation regions, a higher precipitation rate facilitates NO3− dilution in groundwater as the PSTF effluent infiltrates through a thick unsaturated zone over a longer period. Meanwhile, the low-elevation region receives lower precipitation, and a shallow unsaturated zone develops, enabling the rapid arrival of the NO3− plume with minimal dilution.

Figure 9.
Simulated results of leaching NO3− on the water table with different N source loading conditions. (a) PSTFs effluents in present condition (scenario 1), (b) chemical fertilizers only (no PSTFs considered; scenario 2−1), (c) PSTFs effluent and chemical fertilizer (scenario 2−2), and (d) PSTFs effluents following the T-N standards (scenario 3).
In scenario 2-1, the N loading was only from chemical fertilizer, and higher concentrations of NO3− exceeding 100 mg/L were simulated in the northwestern lowland area (Figure 9b) where agricultural areas were densely located (Figure 1b). Compared to the NO3− distribution in scenario 1, the chemical fertilizer significantly elevated groundwater NO3− in the study area more than PSTFs effluents. In scenario 2-2 (Figure 9c), assuming two N sources of PSTF effluent and chemical fertilizer usage, the distribution of NO3− exceeded the background water quality threshold of 5.5 mg/L [63]), covering a broader area than that in scenarios 1 and 2-1. Owing to the diverse N-related human activities, the influence of multiple N sources on groundwater NO3− has been discovered, and it is challenging to discriminate septic-derived N from various N sources. Multiple stable isotopes (such as N, B, and S) and hydrophilic organic wastewater constituents (such as artificial sweeteners and pharmaceuticals) have been widely used to detect the effects of wastewater [72,73,74,75]. Therefore, further studies, including various source tracers, are required to differentiate human wastewater NO3− in the groundwater of the study area.
To evaluate the effect of managing the PSTFs, scenario 3 was simulated with the assumption that all discharged PSTFs followed effluent standards. All input data for modeling (such as, hydrologic parameters, boundary conditions, and septic discharge rate) were the same as in scenario 1; however, the T-N unit load of the PSTFs was assigned as 20 mg/L (converted into NH4+ based on Equation (4)), which is the threshold of the PSTFs effluent standard. The simulation results of scenario 3 (Figure 9d) showed similar spatial NO3− leaching on the water table to scenario 1; however, the maximum NO3− concentration in the groundwater decreased from 94 mg/L to 27 mg/L (71% reduction). Therefore, PSTFs managing to observe effluent standards is essential for mitigating the degradation of groundwater quality by the septic-derived NO3−.
4.5. Suggestion of PSTFs Management Strategies
Based on our model results, the PSTFs effluent had a significant impact on groundwater quality in the study area. Therefore, managing PSTFs is essential for preserving groundwater on Jeju Island. Similar to Jeju Island, many countries have experienced groundwater contamination from NH4+, NO3−, and fecal coliforms from on-site septic systems. Septic-to-sewer conversion has been implemented to address septic-related environmental problems [76,77]. In Rockledge City, Florida, USA, a reduction in groundwater NO3− by 70% was achieved after septic-to-sewer conversion [76]. Buszka and Reeves [78] predicted timescales for NO3− reduction following septic-to-sewer conversion in Charotte Harbor, Florida, USA, using numerical modeling approaches; they estimated 2–3 years for a 50% reduction and 8–10 years for a 90% reduction. The most promising strategy for managing PSTFs is septic-to-sewer conversion based on priority classification. The Hawaiian government prioritized cesspool conversions, designating top priority (priority 1) areas with a significant risk of human impact, such as source water protection areas [79]. In addition, clustered septic systems significantly degraded groundwater quality, as shown in our model results. Therefore, clustered PSTFs also have priority in sewer conversion.
Building owners on Jeju Island currently manage PSTFs with a capacity of <20 m3/day. JRI [39] and our study showed that effluents from small-scale PSTFs exceeded the effluent standard owing to improper management by owners. Therefore, PSTF owners should receive compulsory education regarding proper PSTF management. In priority PSTF management areas, regular examinations of effluent water quality and operation conditions should be regulated by the government.
5. Conclusions
This study used a numerical model to simulate the reactive transport of N species derived from personal sewage treatment facilities (PSTFs, known as on-site septic systems) in the Jocheon area of Jeju Island, South Korea. Moreover, the chemical analysis of PSTF effluents and groundwater in the study area was also performed to assess the quality of PSTF effluent and groundwater. The PSTF effluents detected high T-N (3.2–131.1 mg/L) and NH4+ (ND–125.5 mg/L) concentrations, and 75–92% of PSTFs exceeded the effluent standards. In groundwater, the T-N concentration was low at 0.1–2.9 mg/L, and NH4+ and NO2− were not detected, indicating the sufficient oxidation of organic N derived from the PSTFs as it infiltrated through the subsurface. Elevated NO3− concentrations along with Cl− suggested the influence of anthropogenic contaminants, such as chemical fertilizers and PSTF effluents; however, a further study is needed to discriminate the impact of septic-derived N sources on groundwater.
Based on the model results, the vertical infiltration of NH4+ species was limited, showing the highest concentration in the unsaturated zone near the surface owing to nitrification and adsorption on the soil medium. NO2− also presented a similar plume behavior over time as NH4+ rapidly converted to NO3−. The NO3− component migrated through the saturated zone with an increasing concentration over time, showing the highest NO3− levels immediately below the NH4+ plume. By discharging the PSTF effluents, the NO3− leached on the water table with a higher concentration in the lowland area (elevation < 60 m a.s.l.) compared to the highland (elevation > 200 m a.s.l.) due to a lower dilution effect and rapid contaminant arrival. In addition, the clustered PSTFs induced accumulative impacts on the groundwater, resulting in elevated NO3− levels. In addition to the PSTFs, the agricultural N source greatly contributed to groundwater NO3− contamination in the model. Based on the prediction model results following the standard of PSTF effluents, a 71% reduction (94 mg/L → 27 mg/L) in the highest NO3− concentration in groundwater was evaluated. Therefore, to manage PSTFs on Jeju Island, regular examinations of effluent water quality and compulsory education of the owners are suggested to prevent degradation in groundwater quality. Ultimately, septic-to-sewer conversion should be implemented in priority areas with a significant risk of human impact and clustered PSTFs.
Supplementary Materials
The following supporting information can be downloaded at: https://www.mdpi.com/article/10.3390/hydrology11090146/s1, Figure S1: Model domain and PSTFs distribution classified by building usage in each PSTFs; Figure S2: The location of weather station (filled cross) and groundwater-level monitoring wells (filled circles) used for a numerical model; Figure S3: T-N discharge calculated by T-N unit load and sewage discharge in each PSTFs; Figure S4: Spatiotemporal distribution of (a) T-N and NH4 in PSTFs effluent and, (b) NO3 in groundwater in March and June; Table S1: Unit load of T-N according to building usage (unit: mg/L); Table S2: Model input parameters for the reactive transport of N species; Table S3: Effluent water quality standards and exceeding rate for PSTF until the ordinance amendment May 2024 in Jeju Island, South Korea (Null means not surveyed); Table S4: T-N discharge according to building usage and capacity (unit: kg/year).
Author Contributions
Conceptualization, J.K. and M.K.; methodology, M.K. and E.-H.K.; software, E.-H.K.; validation, M.K. and E.-H.K.; investigation, M.K.; resources, M.K.; data curation, M.K.; writing—original draft preparation, M.K.; writing—review and editing, J.K. and E.-H.K.; visualization, M.K. and E.-H.K.; supervision, E.-H.K.; project administration, M.K.; funding acquisition, E.-H.K. All authors have read and agreed to the published version of the manuscript.
Funding
This research was supported by “Regional Innovation Strategy (RIS)” through the National Research Foundation of Korea (NRF) funded by the Ministry of Education (MOE) (2023RIS-009).
Data Availability Statement
Readers can contact the authors for the available data and materials.
Conflicts of Interest
The authors declare no conflicts of interest.
References
- Lall, U.; Josset, L.; Russo, T.A. Snapshot of the world’s groundwater challenges. Annu. Rev. Environ. Resour. 2020, 45, 171–194. [Google Scholar] [CrossRef]
- Khatri, N.; Tyagi, S. Influences of natural and anthropogenic factors on surface and groundwater quality in rural and urban areas. Front. Life Sci. 2015, 8, 23–39. [Google Scholar] [CrossRef]
- Akhtar, N.; Syakir Ishak, M.I.; Bhawani, S.A.; Umar, K. Various natural and anthropogenic factors responsible for water quality degradation: A review. Water 2021, 13, 2660. [Google Scholar] [CrossRef]
- Shukla, S.; Saxena, A. Sources and leaching of nitrate contamination in groundwater. Curr. Sci. 2020, 118, 883–891. Available online: https://www.jstor.org/stable/27226382 (accessed on 7 February 2024). [CrossRef]
- Richa, A.; Touil, S.; Fizir, M. Recent advances in the source identification and remediation techniques of nitrate contaminated groundwater: A review. J. Environ. Manag. 2022, 316, 115265. [Google Scholar] [CrossRef] [PubMed]
- Koh, E.H.; Kaown, D.; Park, S.H.; Kim, H.; Lee, K.K. Nitrate sources, timing, and pathways of a permeable volcanic aquifer system with mixed land use in Jeju Island, South Korea. Sci. Total Environ. 2023, 888, 164129. [Google Scholar] [CrossRef] [PubMed]
- SCF (Scientific Committee on Food). Assessment of dietary intake of nitrates by the population in the European Union, as a consequence of the consumption of vegetables. In Reports on Tasks for Scientific Cooperation: Report of Experts Participating in Task 3.2.3; European Commission: Brussels, Belgium, 1997. [Google Scholar]
- WHO (World Health Organization). World Health Organization (WHO) Guidelines for Drinking-Water Quality, 4th ed.; World Health Organization: Geneva, Switzerland, 2011. [Google Scholar]
- USEPA (United States Environmental Protection Agency). National Primary Drinking Water Regulations; USEPA: Washington, DC, USA, 2015.
- ME (Ministry of Environment). Groundwater Act Enforcement Rules; Ministry of Environment: Sejong City, Republic of Korea, 2024. Available online: https://www.law.go.kr/lsInfoP.do?lsiSeq=263417&efYd=20240624&ancYnChk=0#0000 (accessed on 7 February 2024).
- Umezawa, Y.; Hosono, T.; Onodera, S.I.; Siringan, F.; Buapeng, S.; Delinom, R.; Yoshimizu, C.; Tayasu, I.; Nagata, T.; Taniguchi, M. Sources of nitrate and ammonium contamination in groundwater under developing Asian megacities. Sci. Total Environ. 2008, 404, 361–376. [Google Scholar] [CrossRef]
- Zhai, Y.; Lei, Y.; Wu, J.; Teng, Y.; Wang, J.; Zhao, X.; Pan, X. Does the groundwater nitrate pollution in China pose a risk to human health? A critical review of published data. Environ. Sci. Pollut. Res. 2017, 24, 3640–3653. [Google Scholar] [CrossRef]
- Li, Z.; Wang, S.; Nie, X.; Sun, Y.; Ran, F. The application and potential non-conservatism of stable isotopes in organic matter source tracing. Sci. Total Environ. 2022, 838, 155946. [Google Scholar] [CrossRef]
- Huno, S.K.; Rene, E.R.; van Hullebusch, E.D.; Annachhatre, A.P. Nitrate removal from groundwater: A review of natural and engineered processes. J. Water Supply Res. Technol.—AQUA 2018, 67, 885–902. [Google Scholar] [CrossRef]
- Abascal, E.; Gómez-Coma, L.; Ortiz, I.; Ortiz, A. Global diagnosis of nitrate pollution in groundwater and review of removal technologies. Sci. Total Environ. 2022, 810, 152233. [Google Scholar] [CrossRef] [PubMed]
- Koh, E.H.; Lee, E.; Kaown, D.; Green, C.T.; Koh, D.C.; Lee, K.K.; Lee, S.H. Comparison of groundwater age models for assessing nitrate loading, transport pathways, and management options in a complex aquifer system. Hydrol. Process. 2018, 32, 923–938. [Google Scholar] [CrossRef]
- Rawat, M.; Sen, R.; Onyekwelu, I.; Wiederstein, T.; Sharda, V. Modeling of Groundwater Nitrate Contamination Due to Agricultural Activities—A Systematic Review. Water 2022, 14, 4008. [Google Scholar] [CrossRef]
- Badruzzaman, M.; Pinzon, J.; Oppenheimer, J.; Jacangelo, J.G. Source of nutrients impacting surface waters in Florida: A review. J. Environ. Manag. 2012, 109, 80–92. [Google Scholar] [CrossRef] [PubMed]
- Ducci, L.; Rizzo, P.; Pinardi, R.; Solfrini, A.; Maggiali, A.; Pizzati, M.; Balsamo, F.; Celico, F. What is the impact of leaky sewers on groundwater contamination in urban semi-confined aquifers? A test study related to fecal matter and Personal Care Products (PCPs). Hydrology 2022, 10, 3. [Google Scholar] [CrossRef]
- Mezzacapo, M.; Donohue, M.J.; Smith, C.; El-Kadi, A.; Falinski, K.; Lerner, D.T. Review Article: Hawai‘i’s Cesspool Problem: Review and Recommendations for Water Resources and Human Health. J. Contem. Water Res. Ed. 2020, 170, 35–75. [Google Scholar] [CrossRef]
- Lu, Y.; Tang, C.; Chen, J.; Sakura, Y. Impact of septic tank systems on local groundwater quality and water supply in the Pearl River Delta, China: Case study. Hydrol. Process. Int. J. 2008, 22, 443–450. [Google Scholar] [CrossRef]
- Kroeger, K.D.; Cole, M.L.; York, J.K.; Valiela, I. Nitrogen loads to estuaries from waste water plumes: Modeling and isotopic approaches. Ground Water 2006, 44, 188–200. [Google Scholar] [CrossRef]
- Markey, P.G. Report for Evaluation of Existing Data and Sampling Protocol; Leggette, Brashears&Graham, Inc.: Washington, DC, USA, 2006. [Google Scholar]
- Mester, T.; Szabó, G.; Sajtos, Z.; Baranyai, E.; Szabó, G.; Balla, D. Environmental Hazards of an Unrecultivated Liquid Waste Disposal Site on Soil and Groundwater. Water 2022, 14, 226. [Google Scholar] [CrossRef]
- Kookana, R.S.; Drechsel, P.; Jamwal, P.; Vanderzalm, J. Urbanisation and emerging economies: Issues and potential solutions for water and food security. Sci. Total Environ. 2020, 732, 139057. [Google Scholar] [CrossRef]
- Harman, J.; Robertson, W.D.; Cherry, J.A.; Zanini, L. Impacts on a sand aquifer from an old septic system: Nitrate and phosphate. Groundwater 1996, 34, 1105–1114. [Google Scholar] [CrossRef]
- Heatwole, K.K.; McCray, J.E. Modeling potential vadose-zone transport of nitrogen from onsite wastewater systems at the development scale. J. Contam. Hydrol. 2007, 91, 184–201. [Google Scholar] [CrossRef] [PubMed]
- Mori-Sánchez, O.L.; Ramos-Fernández, L.; Lluén-Chero, W.E.; Pino-Vargas, E.; Flores del Pino, L. Application of the Iber two-dimensional model to recover the water quality in the Lurín River. Hydrology 2023, 10, 84. [Google Scholar] [CrossRef]
- Karlović, I.; Posavec, K.; Larva, O.; Marković, T. Numerical groundwater flow and nitrate transport assessment in alluvial aquifer of Varaždin region, NW Croatia. J. Hydrol. Reg. Stud. 2022, 41, 101084. [Google Scholar] [CrossRef]
- Okuhata, B.K.; El-Kadi, A.I.; Henrietta, D.; Lee, J.; Wada, C.A.; Bremer, L.L.; Burnett, K.M.; Delevaus, J.M.S.; Shuler, C.K. A density-dependent multi-species model to assess groundwater flow and nutrient transport in the coastal Keauhou aquifer, Hawaii, USA. Hydrogeol. J. 2022, 30, 231–250. [Google Scholar] [CrossRef]
- Pang, L.; Nokes, C.; Šimůnek, J.; Kikkert, H.; Hector, R. Modeling the impact of clustered septic tank systems on groundwater quality. Vadose Zone J. 2006, 5, 599–609. [Google Scholar] [CrossRef]
- MacQuarrie, K.T.B.; Edward, A.S.; William, D.R. Multicomponent simulation of wastewater-derived nitrogen and carbon in shallow unconfined aquifers: II. Model application to a field site. J. Contam. Hydrol. 2001, 47, 85–104. [Google Scholar] [CrossRef]
- Humphrey, C.; O’Driscoll, M.A.; Armstrong, M.C. Onsite wastewater system nitrogen loading to groundwater in the Newport River watershed, North Carolina. Environ. Nat. Resour. 2012, 2, 70–79. [Google Scholar] [CrossRef]
- Koh, D.C.; Ko, K.S.; Kim, Y.; Lee, S.G.; Chang, H.W. Effect of agricultural land use on the chemistry of groundwater from basaltic aquifers, Jeju Island, South Korea. Hydrogeol. J. 2007, 15, 727–743. [Google Scholar] [CrossRef]
- Koh, E.H.; Lee, S.H.; Kaown, D.; Moon, H.S.; Lee, E.; Lee, K.K.; Kang, B.R. Impacts of land use change and groundwater management on long-term nitrate-nitrogen and chloride trends in groundwater of Jeju Island, Korea. Environ. Earth Sci. 2017, 76, 176. [Google Scholar] [CrossRef]
- Kwon, E.; Park, J.; Park, W.B.; Kang, B.R.; Woo, N.C. Nitrate contamination of coastal groundwater: Sources and transport mechanisms along a volcanic aquifer. Sci. Total Environ. 2021, 768, 145204. [Google Scholar] [CrossRef] [PubMed]
- KOSIS (Korean Statistical Information Service). Statistics Korea, KOSIS, Daejeon City, Republic of Korea. 2024. Available online: https://kosis.kr/statHtml/statHtml.do?orgId=101&tblId=DT_1B040A3&conn_path=I2 (accessed on 24 July 2024).
- JSSGP (Jeju Special Self-Governing Province). Statistics of JSSGP; Jeju Special Self-Governing Province: Jeju City, Republic of Korea, 2024. (In Korean)
- JRI (Jeju Research Institute). A Basic Study on the Improvement of Individual Sewage Treatment Facilities on Jeju Island; JRI: Jeju City, Republic of Korea, 2019. [Google Scholar]
- JSSGP (Jeju Special Self-Governing Province); Korea University. Jeju Special Self-Governing Province Tap Water Source Characteristics Survey and Efficient Management Strategy Research; Korea University: Seoul City, Republic of Korea, 2021; p. 70. (In Korean)
- Brenna, M.; Cronin, S.J.; Smith, I.E.; Sohn, Y.K.; Maas, R. Spatio-temporal evolution of a dispersed magmatic system and its implications for volcano growth, Jeju Island Volcanic Field, Korea. Lithos 2012, 148, 337–352. [Google Scholar] [CrossRef]
- Won, J.H.; Lee, J.Y.; Kim, J.W.; Koh, G.W. Groundwater occurrence on Jeju island, Korea. Hydrogeol. J. 2006, 14, 253–265. [Google Scholar] [CrossRef]
- JSSGP (Jeju Special Self-Governing Province). Basic Plan for Integrated Water Management in Jeju Special Self-Governing Province (2023–2032); Jeju Special Self-Governing Province: Jeju City, Republic of Korea, 2022.
- Koh, G.W. Characteristics of the Groundwater and Hydrogeologic Implications of the Seoguipo Formation in Cheju Island. Ph.D. Thesis, Pusan National University, Pusan City, Republic of Korea, 1997; pp. 126–161, (In Korean with English Abstract). [Google Scholar]
- ME (Ministry of Environment). Land Cover Map, Environmental Spatial Information System; Ministry of Envirionment: Sejong City, Republic of Korea, 2022. Available online: https://egis.me.go.kr/intro/land.do (accessed on 7 February 2024). (In Korean)
- ME (Ministry of Environment). Calculate the Amount of Water and Sewage Generation in a Housing Complex in Unit Intensity and Study the Cost of Sewage; ME: Sejong City, Republic of Korea, 2001. (In Korean)
- Therrien, R.; McLaren, R.; Sudicky, E.; Panday, S.M. A Three-Dimensional Numerical Model Describing Fully-Integrated Subsurface and Surface Flow and Solute Transport; User Guide; University of Waterloo: Waterloo, ON, Canada, 2010. [Google Scholar]
- Jeju Water Resources Management Office. Data Collection Book of Geological Logs of Jeju Island; Jeju Special Self-Governing Province: Jeju City, Republic of Korea, 2001. (In Korean)
- Batu, V. Aquifer Hydraulics: A Comprehensive Guide to Hydrogeologic Data Analysis; LNC John Wiley and Sons: Hoboken, NJ, USA, 1998. [Google Scholar]
- Hodnett, M.G.; Tomasella, J. Marked differences between van Genuchten soil water-retention parameters for temperate and tropical soils: A new water-retention pedo-transfer functions developed for tropical soil. Goederma 2002, 108, 155–180. [Google Scholar] [CrossRef]
- Gelhar, L.W. Stochastic subsurface hydrology from theory to application. Water Resour. Res. 1986, 22, 161–180. [Google Scholar] [CrossRef]
- Jeju-do Report on the Overall Investigation of Hydrogeology and the Groundwater Resource in Jeju Island (III); Jeju Provincial Government: Jeju City, Republic of Korea, 2003. (In Korean)
- Peña-Haro, S.; Pulido-Velazquez, M.; Sahuquillo, A. A hydro-economic modelling framework for optimal management of groundwater nitrate pollution from agriculture. J. Hydrol. 2009, 373, 193–203. [Google Scholar] [CrossRef]
- Ceazan, M.L.; Thurman, E.M.; Smith, R.L. Retardation of ammonium and potassium transport through a contaminated sand and gravel aquifer: The role of cation exchange. Environ. Sci. Technol. 1989, 23, 1402–1408. [Google Scholar] [CrossRef]
- Alshameri, A.; He, H.; Zhu, J.; Xi, Y.; Zhu, R.; Ma, L.; Tao, Q. Adsorption of ammonium by different natural clay minerals: Characterization, kinetics and adsorption isotherms. Appl. Clay Sci. 2018, 159, 83–93. [Google Scholar] [CrossRef]
- Simunek, J.; Van Genuchten, M.T.; Sejna, M. The HYDRUS-1D software package for simulating the one-dimensional movement of water, heat, and multiple solutes in variably-saturated media. Univ. Calif.-Riverside Res. Rep. 2005, 3, 1–240. [Google Scholar]
- JSSGP (Jeju Special Self-Governing Province). Study on Groundwater Water Quality Improvement and Pollution Control; JSSGP and Jeju Research Institute: Jeju City, Republic of Korea, 2019. (In Korean)
- Koh, E.H.; Lee, E.; Lee, K.K. Impact of leaky wells on nitrate cross-contamination in a layered aquifer system: Methodology for and demonstration of quantitative assessment and prediction. J. Hydrol. 2016, 541, 1133–1144. [Google Scholar] [CrossRef]
- Geary, P.; Lucas, S. Contamination of estuaries from failing septic tank systems: Difficulties in scaling up from monitored individual systems to cumulative impact. Environ. Sci. Pollut. Res. 2019, 26, 2132–2144. [Google Scholar] [CrossRef] [PubMed]
- Ferris, G.; Szponar, N.; Edwards, B. Groundwater Microbiology; Groundwater Project: Guelph, ON, Canada, 2021; pp. 7–26. [Google Scholar]
- Cey, E.E.; Rudolph, D.L.; Aravena, R.; Parkin, G. Role of the riparian zone in controlling the distribution and fate of agricultural nitrogen near a small stream in southern Ontario. J. Contam. Hydrol. 1999, 37, 45–67. [Google Scholar] [CrossRef]
- Hiscock, K.M.; Lloyd, J.W.; Lerner, D.N. Review of natural and artificial denitrification of groundwater. Water Res. 1991, 25, 1099–1111. [Google Scholar] [CrossRef]
- Koh, D.C.; Chae, G.T.; Yoon, Y.Y.; Kang, B.R.; Koh, G.W.; Park, K.H. Baseline geochemical characteristics of groundwater in the mountainous area of Jeju Island, South Korea: Implications for degree of mineralization and nitrate contamination. J. Hydrol. 2009, 376, 81–93. [Google Scholar] [CrossRef]
- Jeju-do, Report on the Overall Investigation of Hydrogeology and the Groundwater Resources in Jeju Island (I); Jeju Provincial Government: Jeju City, Republic of Korea, 2001. (In Korean)
- Hyun, I.H.; Seo, B.W.; Kim, T.H.; Song, B.H.; Kang, S.K.; Kim, S.J.; Yun, S.T.; Oh, S.S. Tracking sources of nitrate in groundwater around livestock manure spill area. Rep. JIHE (Jeju Inst. Health Environ.) 2017, 28, 111–124. (In Korean) [Google Scholar]
- Kim, S.H.; Kim, H.R.; Yu, S.; Kang, H.J.; Hyun, I.H.; Song, Y.C.; Kim, H.; Yun, S.T. Shift of nitrate sources in groundwater due to intensive livestock farming on Jeju Island, South Korea: With emphasis on legacy effects on water management. Water Res. 2021, 191, 116814. [Google Scholar] [CrossRef]
- Koh, E.H.; Kaown, D.; Mayer, B.; Kang, B.R.; Moon, H.S.; Lee, K.K. Hydrogeochemistry and isotopic tracing of nitrate contamination of two aquifer systems on Jeju Island, Korea. J. Environ. Qual. 2012, 41, 1835–1845. [Google Scholar] [CrossRef]
- McCray, J.E.; Kirkland, S.L.; Siegrist, R.L.; Thyne, G.D. Model parameters for simulating fate and transport of on-site wastewater nutrients. Groundwater 2005, 43, 628–639. [Google Scholar] [CrossRef]
- Jeju-do, Report on the General Investigation of the Mountainous Area in Jeju Island; Jeju Provincial Government: Jeju City, Republic of Korea, 1997.
- Koh, D.C.; Chang, H.W.; Lee, K.S.; Ko, K.S.; Kim, Y.J.; Park, W.B. Hydrogeochemistry and environmental isotopes of groundwater in Jeju volcanic island, Korea: Implications for nitrate contamination. Hydrol. Process. 2005, 19, 2225–2245. [Google Scholar] [CrossRef]
- Zhu, Y.; Ye, M.; Roeder, E.; Hicks, R.W.; Shi, L.; Yang, J. Estimating ammonium and nitrate load from septic systems to surface water bodies within ArcGIS environments. J. Hydrol. 2016, 532, 177–192. [Google Scholar] [CrossRef]
- Katz, B.G.; Eberts, S.M.; Kauffman, L.J. Using Cl/Br ratios and other indicators to assess potential impacts on groundwater quality from septic systems: A review and examples from principal aquifers in the United States. J. Hydrol. 2011, 397, 151–166. [Google Scholar] [CrossRef]
- Lee, H.J.; Kim, K.Y.; Hamm, S.Y.; Kim, M.; Kim, H.K.; Oh, J.E. Occurrence and distribution of pharmaceutical and personal care products, artificial sweeteners, and pesticides in groundwater from an agricultural area in Korea. Sci. Total Environ. 2019, 659, 168–176. [Google Scholar] [CrossRef] [PubMed]
- Nitka, A.L.; DeVita, W.M.; McGinley, P.M. Evaluating a chemical source-tracing suite for septic system nitrate in household wells. Water Res. 2019, 148, 438–445. [Google Scholar] [CrossRef] [PubMed]
- Widory, D.; Petelet-Giraud, E.; Négrel, P.; Ladouche, B. Tracking the sources of nitrate in groundwater using coupled nitrogen and boron isotopes: A synthesis. Environ. Sci. Technol. 2005, 39, 539–548. [Google Scholar] [CrossRef] [PubMed]
- Applied Ecology. The Breeze Swept Septic to Sewer Conversion Project Analysis Report for the City of Rockledge; Applied Ecology: Rockledge City, FL, USA, 2019. [Google Scholar]
- Mester, T.; Balla, D.; Karancsi, G.; Bessenyei, É.; Szabó, G. Effects of nitrogen loading from domestic wastewater on groundwater quality. Water SA 2019, 45, 349–358. [Google Scholar] [CrossRef]
- Buszka, T.T.; Reeves, D.M. Pathways and timescales associated with nitrogen transport from septic systems in coastal aquifers intersected by canals. Hydrogeol. J. 2021, 29, 1953–1964. [Google Scholar] [CrossRef]
- The State of Hawaii. Report to the Twenty-Ninth Legislature State of Hwaii 2018; Relationg to Cesspools and Prioritization for Replacement; Department of Health and Environmental Management Division: Pearl City, HI, USA, 2017. [Google Scholar]


Disclaimer/Publisher’s Note: The statements, opinions and data contained in all publications are solely those of the individual author(s) and contributor(s) and not of MDPI and/or the editor(s). MDPI and/or the editor(s) disclaim responsibility for any injury to people or property resulting from any ideas, methods, instructions or products referred to in the content. |
© 2024 by the authors. Licensee MDPI, Basel, Switzerland. This article is an open access article distributed under the terms and conditions of the Creative Commons Attribution (CC BY) license (https://creativecommons.org/licenses/by/4.0/).