
Evaluation of the Extreme Precipitation and Runoff Flow Characteristics in a Semiarid Sub-Basin Based on Three Satellite Precipitation Products

 , ,
, ,
Abstract
1. Introduction
2. Materials and Methods
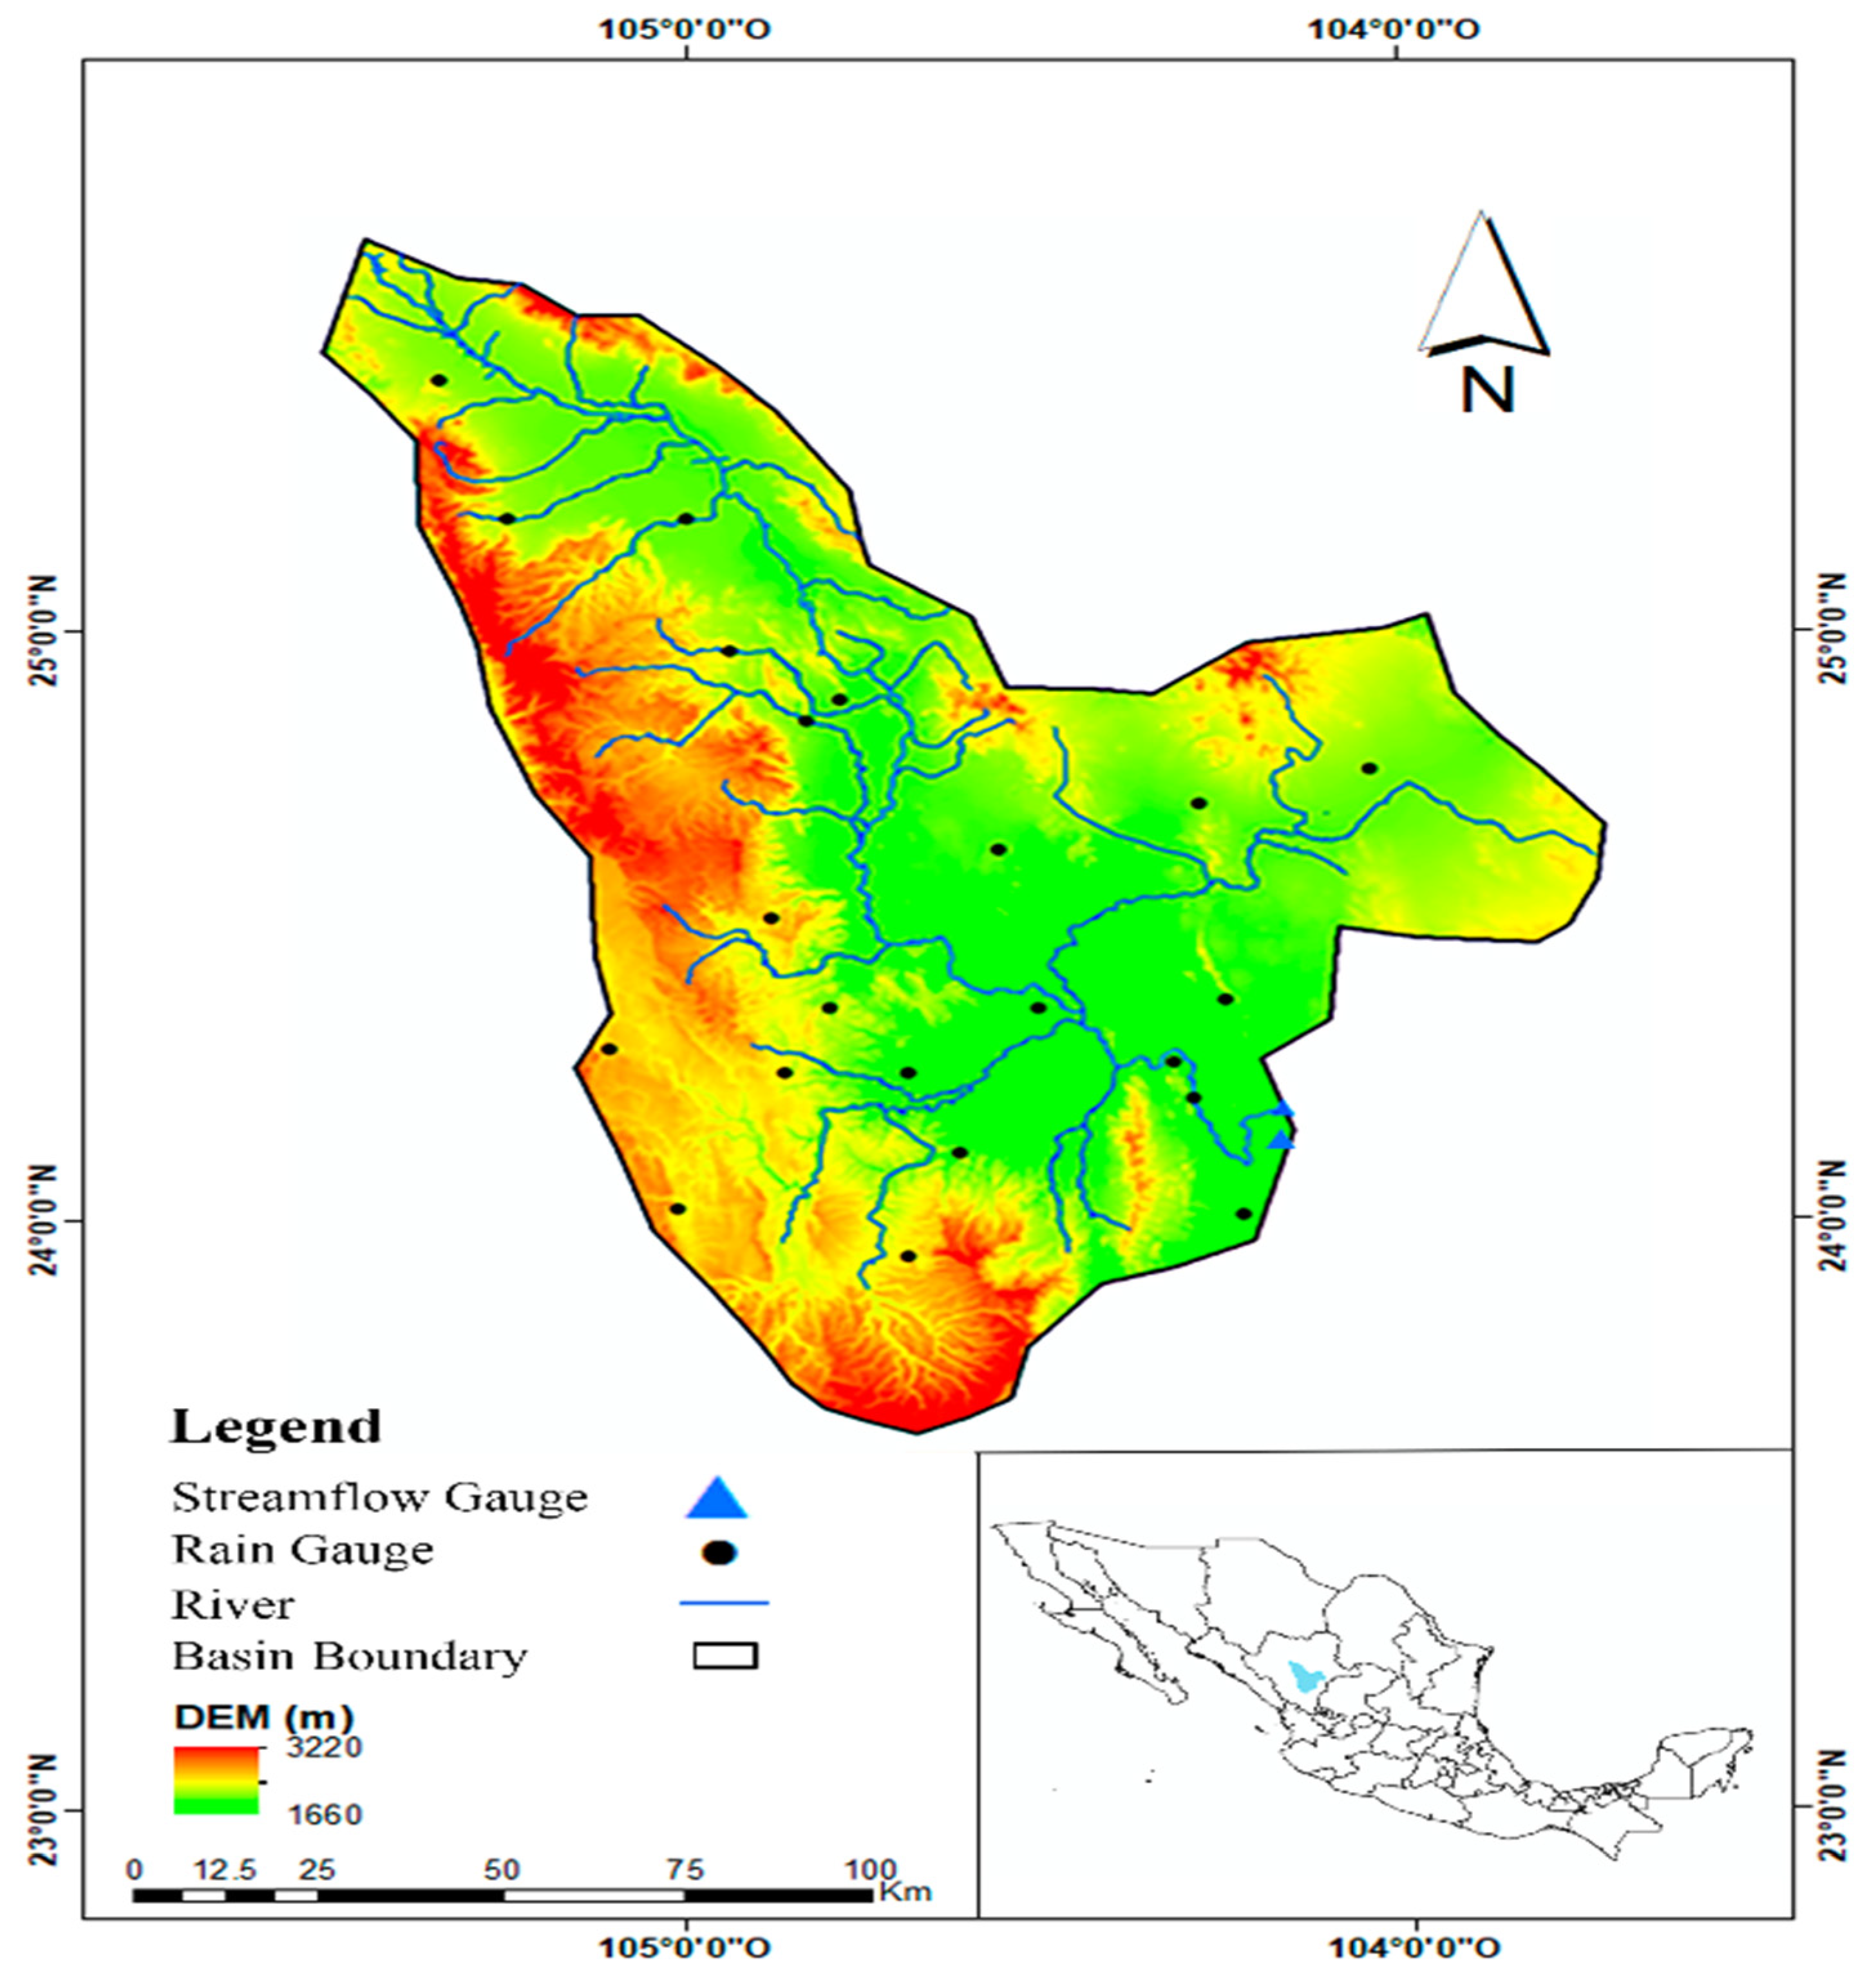
2.1. Study Area
2.2. Data
2.2.1. Satellite Precipitation Products
2.2.2. Rain and Hydrometric Gauge Data
2.3. Methods
2.3.1. Extreme Rainfall and Runoff Indices
2.3.2. Accuracy Assessment Methods
2.3.3. Hydrologic Model Calibration
3. Results and Discussion
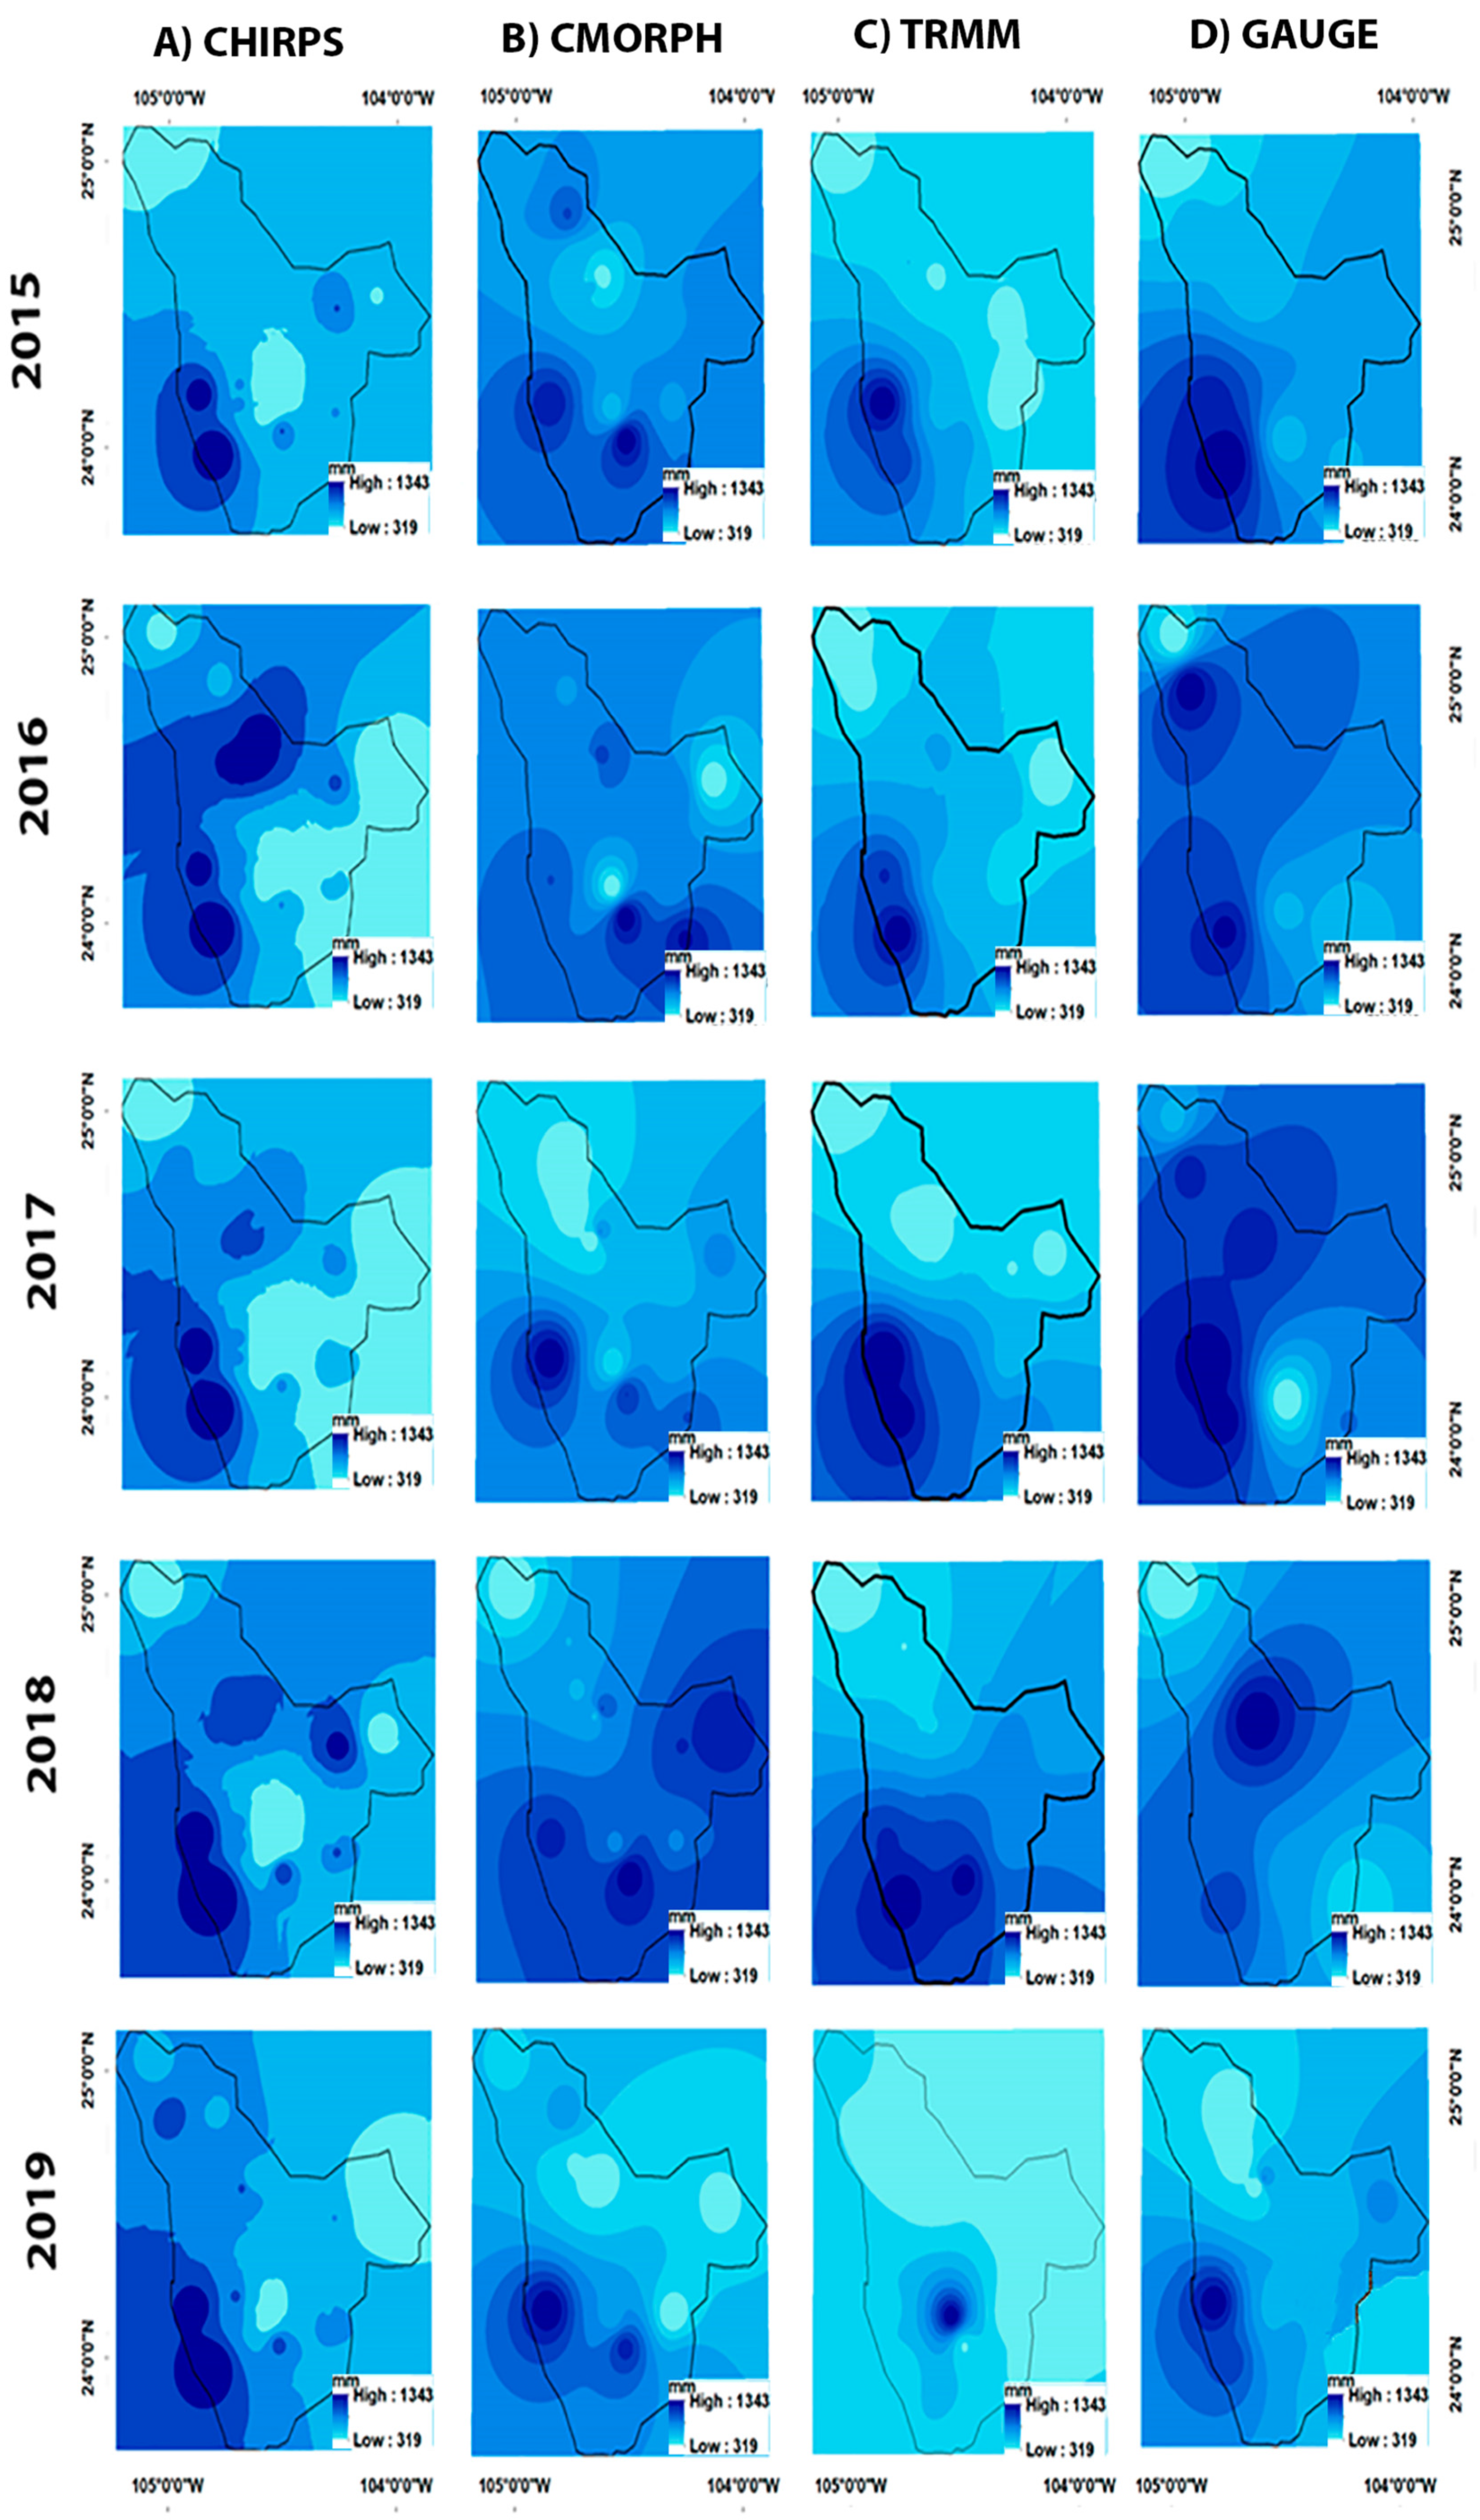
3.1. Satellite Product Comparison
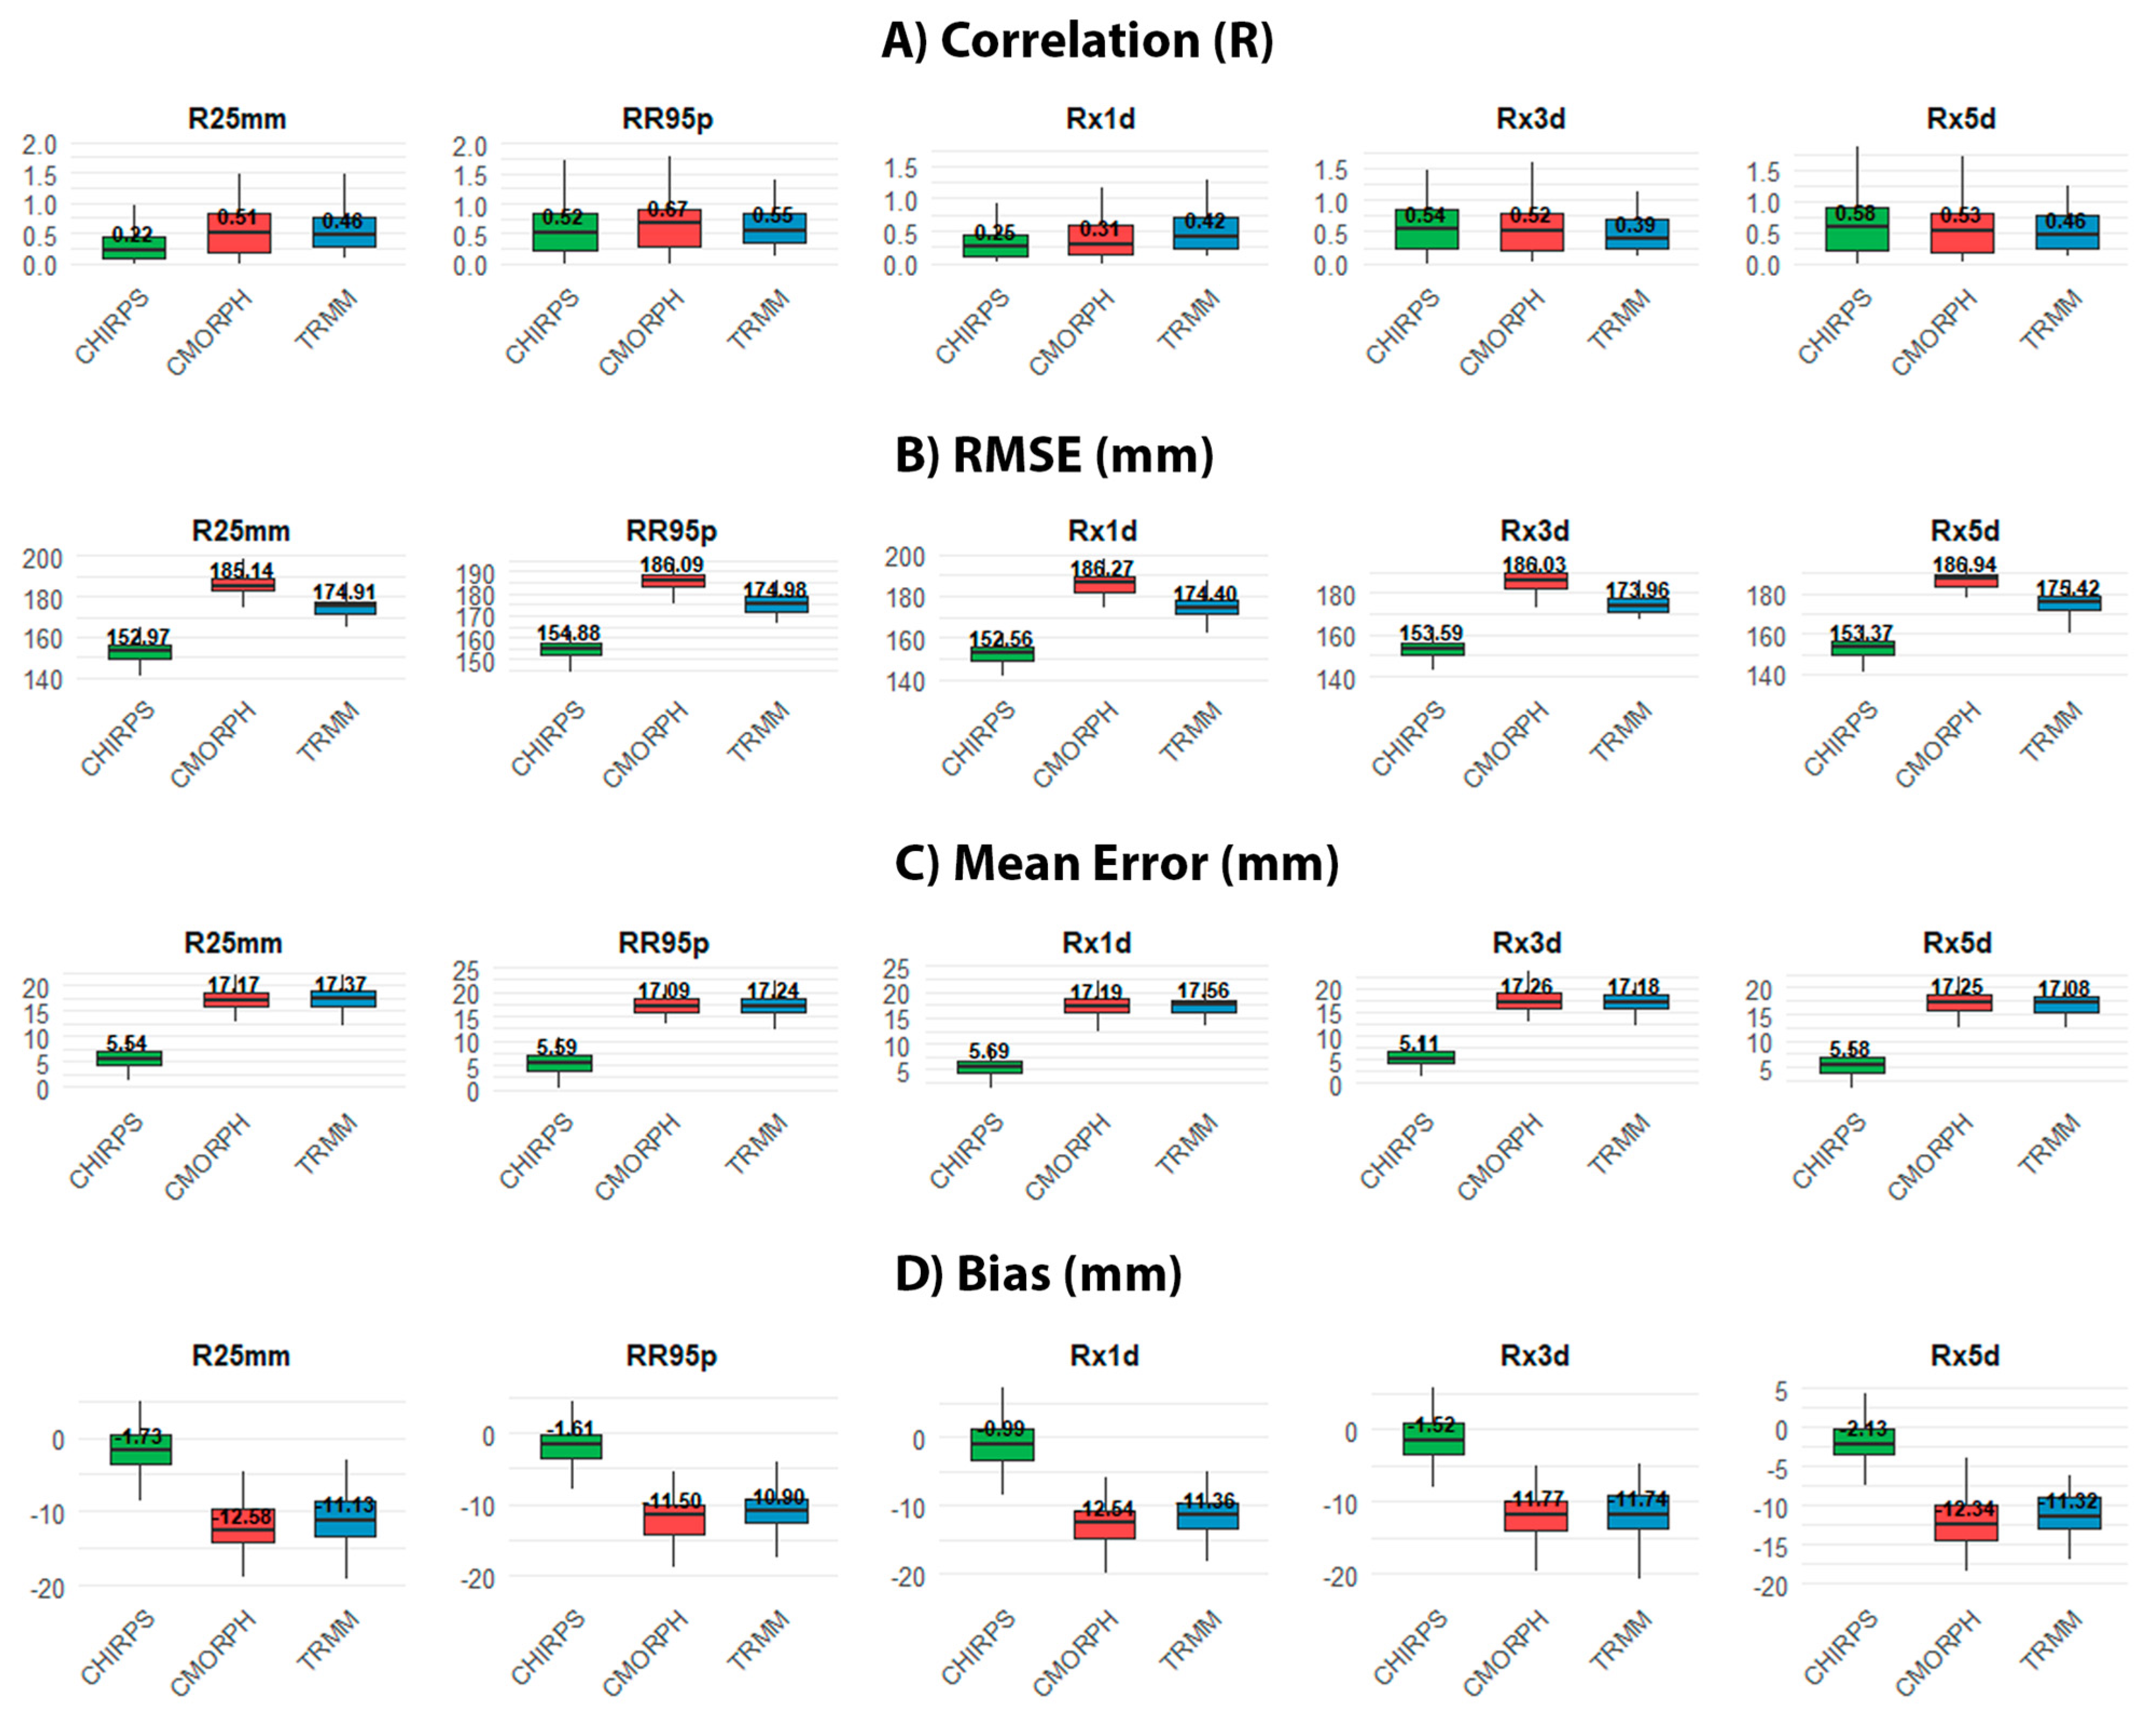
3.2. The Efficiency of SPPs in Monitoring Extreme Precipitation Events
3.3. The Performance of SPPs in Extreme Flow Capture
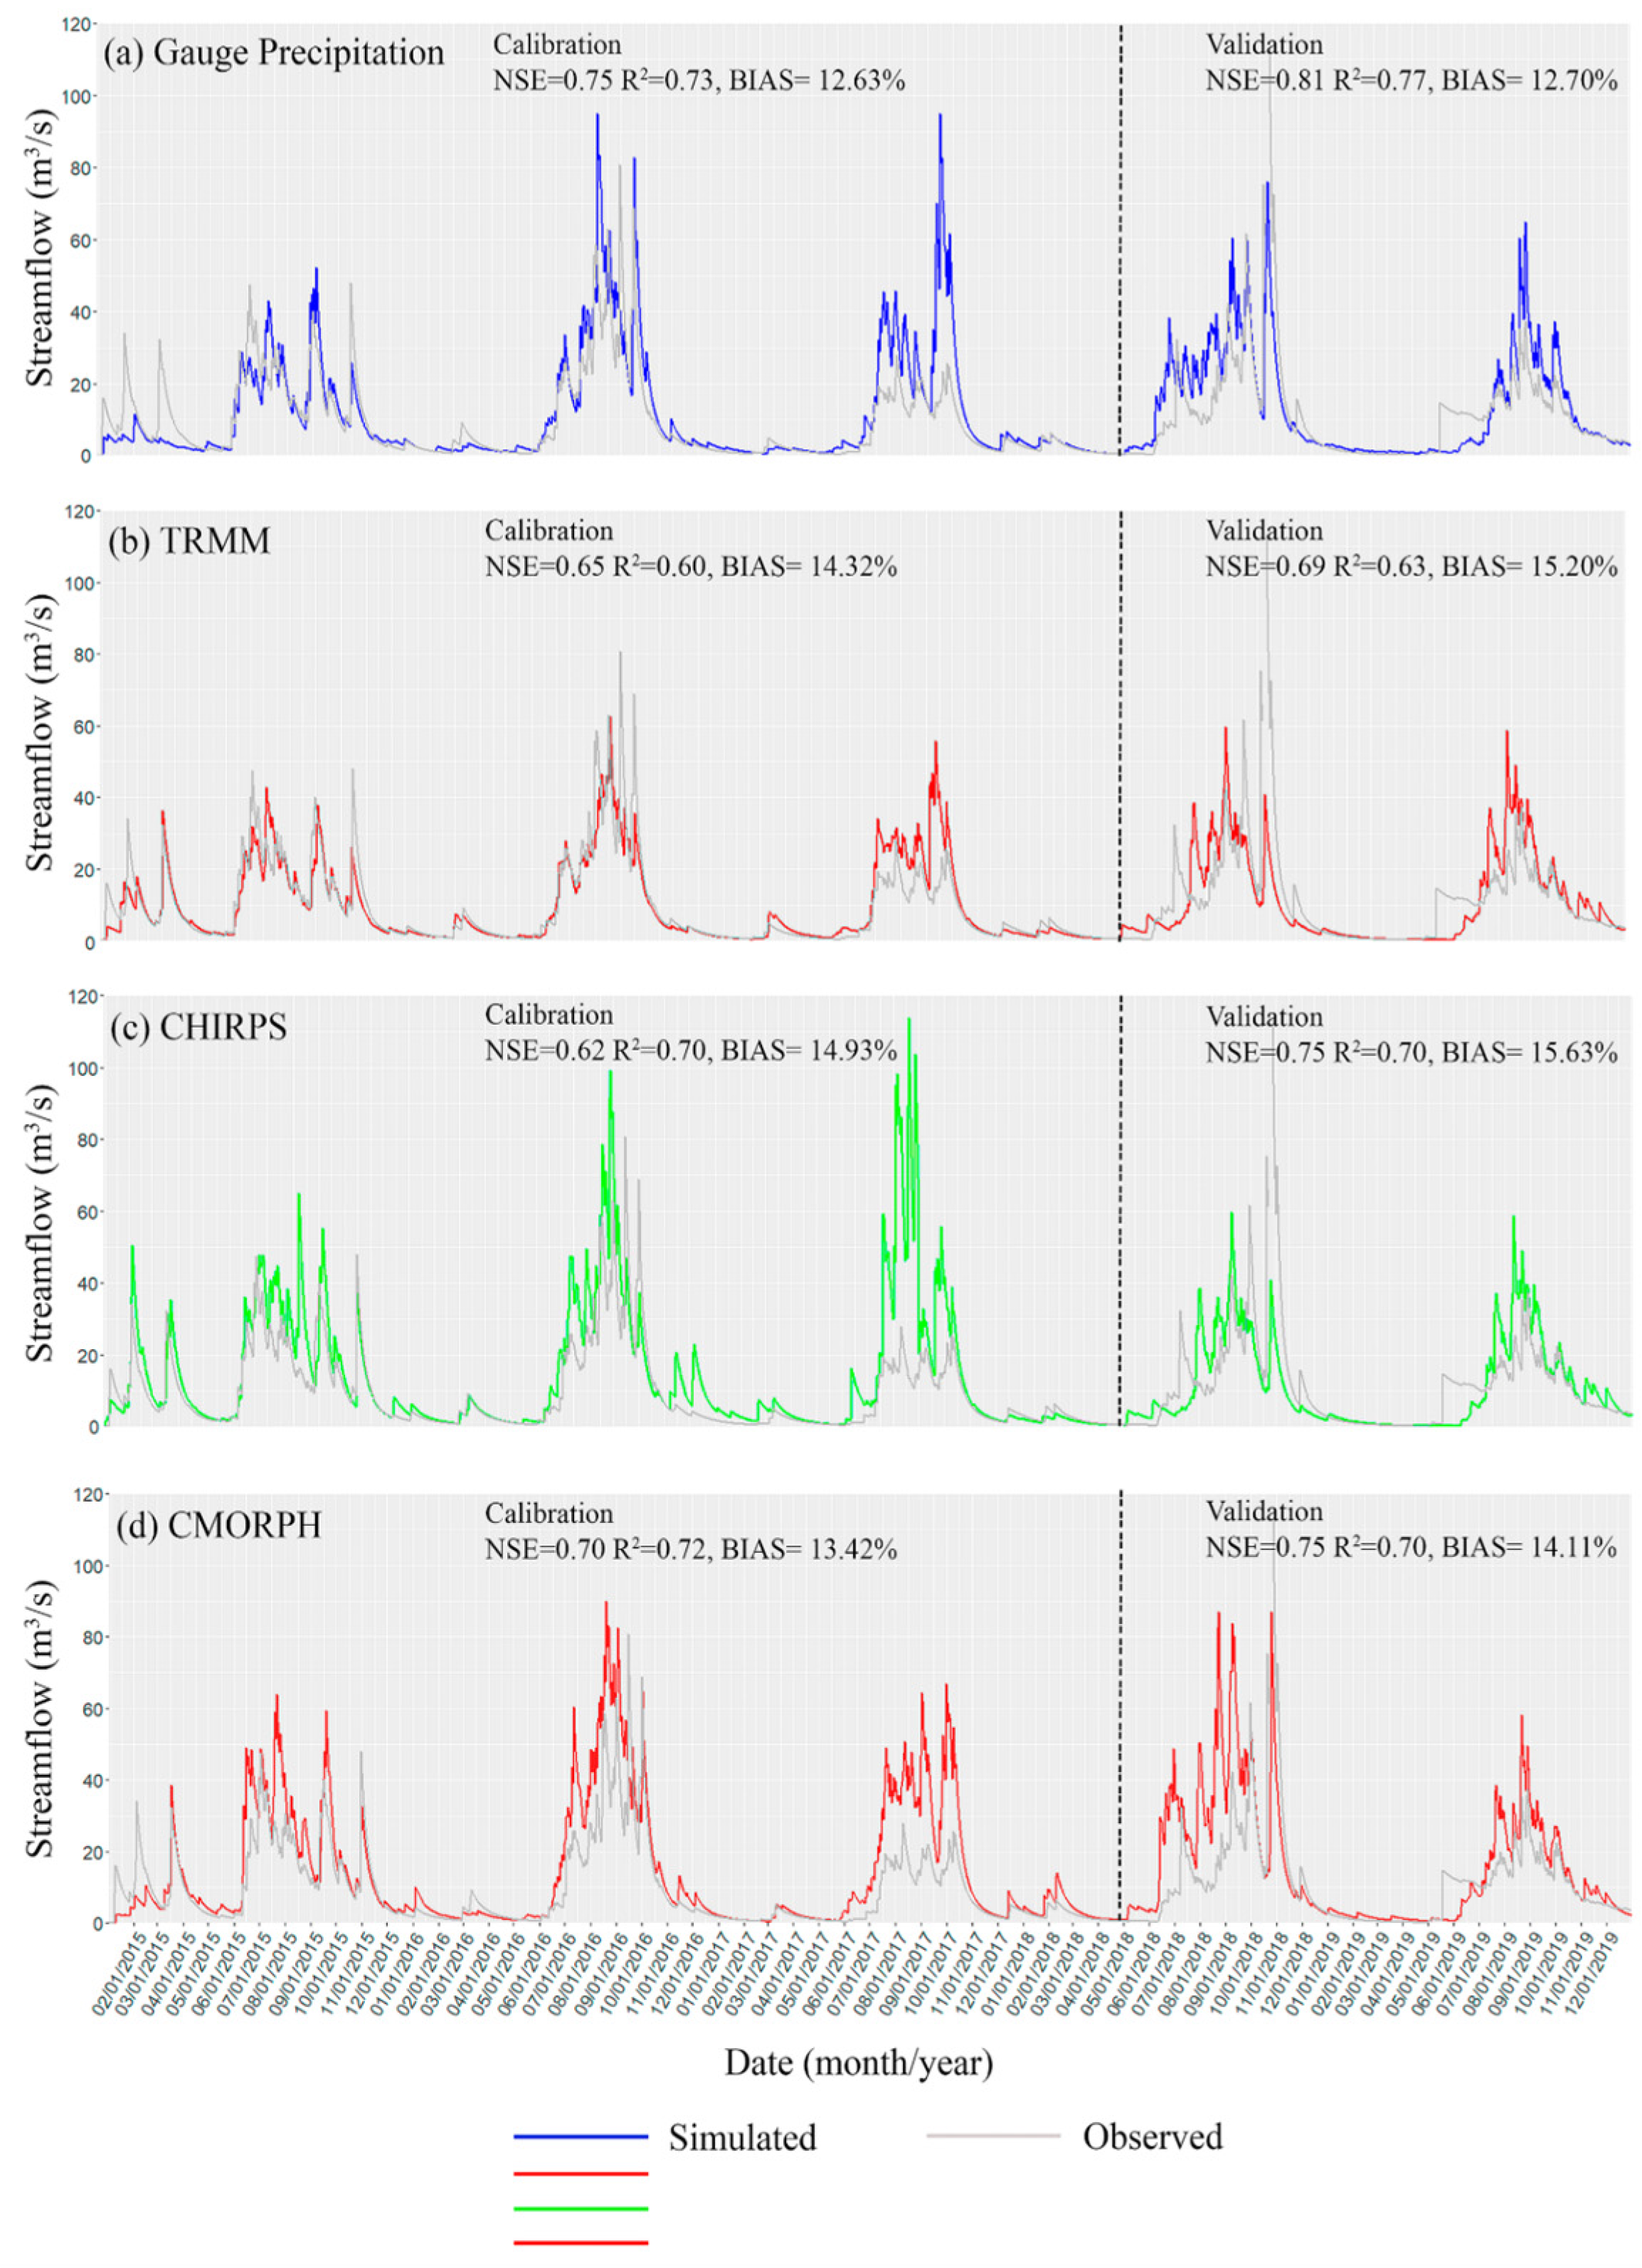
3.3.1. Validation of the PCSWMM Model
3.3.2. Extreme Flow Assessment of the Three SPPs
4. Conclusions
Author Contributions
Funding
Data Availability Statement
Acknowledgments
Conflicts of Interest
References
- Myhre, G.; Alterskjær, K.; Stjern, C.W.; Hodnebrog, Ø.; Marelle, L.; Samset, B.H.; Sillmann, J.; Schaller, N.; Fischer, E.; Schulz, M.; et al. Frequency of extreme precipitation increases extensively with event rareness under global warming. Sci. Rep. 2019, 9, 16063. [Google Scholar] [CrossRef] [PubMed]
- Papalexiou, S.M.; Montanari, A.J.W.R.R. Global and regional increase of precipitation extremes under global warming. Water Resour. Res. 2019, 55, 4901–4914. [Google Scholar] [CrossRef]
- Flint, L.E.; Flint, A.L.; Stolp, B.J.; Danskin, W.R. A basin-scale approach for assessing water resources in a semiarid environment: San Diego region, California and Mexico. Hydrol. Earth Syst. Sci. 2012, 16, 3817–3833. [Google Scholar] [CrossRef]
- Deng, C.; Pisani, B.; Hernández, H.; Li, Y. Assessing the impact of climate change on water resources in a semi-arid area in central Mexico using a SWAT model. Boletín Soc. Geológica Mex. 2020, 72, 1–19. [Google Scholar] [CrossRef]
- Liu, Z. Accuracy of satellite precipitation products in data-scarce Inner Tibetan Plateau comprehensively evaluated using a novel ground observation network. J. Hydrol. Reg. Stud. 2023, 47, 101405. [Google Scholar] [CrossRef]
- Jahanshahi, A.; Roshun, S.H.; Booij, M.J. Comparison of satellite-based and reanalysis precipitation products for hydrological modeling over a data-scarce region. Clim. Dyn. 2024, 62, 3505–3537. [Google Scholar] [CrossRef]
- Tavakol-Davani, H.; Goharian, E.; Hansen, C.H.; Tavakol-Davani, H.; Apul, D.; Burian, S.J. How does climate change affect combined sewer overflow in a system benefiting from rainwater harvesting systems? Sustain. Cities Soc. 2016, 27, 430–438. [Google Scholar] [CrossRef]
- Yang, D.; Yang, Y.; Xia, J. Hydrological cycle and water resources in a changing world: A review. Geogr. Sustain. 2021, 2, 115–122. [Google Scholar] [CrossRef]
- Shrestha, A.; Chaosakul, T.; Priyankara, D.P.; Chuyen, L.H.; Myat, S.S.; Syne, N.K.; Irvine, K.N.; Koottatep, T.; Babel, M.S. Application of PCSWMM to explore possible climate change impacts on surface flooding in a Peri-urban area of Pathumthani, Thailand. J. Water Manag. Model. 2014, 22, C377. [Google Scholar] [CrossRef]
- Schuurmans, J.M.; Bierkens, M.F.P. Effect of spatial distribution of daily rainfall on interior catchment response of a distributed hydrological model. Hydrol. Earth Syst. Sci. 2007, 11, 677–693. [Google Scholar] [CrossRef]
- Upadhyay, R.K. Markers for global climate change and its impact on social, biological and ecological systems: A review. Am. J. Clim. Change 2020, 9, 159. [Google Scholar] [CrossRef]
- Rijal, M.; Luo, P.; Mishra, B.K.; Zhou, M.; Wang, X. Global systematical and comprehensive overview of mountainous flood risk under climate change and human activities. Sci. Total Environ. 2024, 941, 173672. [Google Scholar] [CrossRef] [PubMed]
- Michaelides, S.; Levizzani, V.; Anagnostou, E.; Bauer, P.; Kasparis, T.; Lane, J.E. Precipitation: Measurement, remote sensing, climatology and modeling. Atmos. Res. 2009, 94, 512–533. [Google Scholar] [CrossRef]
- Joyce, R.J.; Janowiak, J.E.; Arkin, P.A.; Xie, P. CMORPH: A Method that Produces Global Precipitation Estimates from Passive Microwave and Infrared Data at High Spatial and Temporal Resolution. J. Hydrometeorol. 2004, 5, 487–503. [Google Scholar] [CrossRef]
- Hu, Q.; Li, Z.; Wang, L.; Huang, Y.; Wang, Y.; Li, L. Rainfall Spatial Estimations: A Review from Spatial Interpolation to Multi-Source Data Merging. Water 2019, 11, 579. [Google Scholar] [CrossRef]
- Chintalapudi, S.; Sharif, H.O.; Yeggina, S.; Elhassan, A. Physically Based, Hydrologic Model Results Based on Three Precipitation Products. JAWRA J. Am. Water Resour. Assoc. 2012, 48, 1191–1203. [Google Scholar] [CrossRef]
- Tsintikidis, D.; Georgakakos, K.P.; Sperfslage, J.A.; Smith, D.E.; Carpenter, T.M. Precipitation Uncertainty and Raingauge Network Design within Folsom Lake Watershed. J. Hydrol. Eng. 2002, 7, 175–184. [Google Scholar] [CrossRef]
- Funk, C.; Nicholson, S.E.; Landsfeld, M.; Klotter, D.; Peterson, P.; Harrison, L. The Centennial Trends Greater Horn of Africa precipitation dataset. Sci. Data 2015, 2, 150050. [Google Scholar] [CrossRef]
- Funk, C.; Peterson, P.; Landsfeld, M.; Pedreros, D.; Verdin, J.; Shukla, S.; Husak, G.; Rowland, J.; Harrison, L.; Hoell, A.; et al. The climate hazards infrared precipitation with stations—A new environmental record for monitoring extremes. Sci. Data 2015, 2, 150066. [Google Scholar] [CrossRef]
- Paredes-Trejo, F.J.; Barbosa, H.A.; Lakshmi Kumar, T.V. Validating CHIRPS-based satellite precipitation estimates in Northeast Brazil. J. Arid Environ. 2017, 139, 26–40. [Google Scholar] [CrossRef]
- Katsanos, D.; Retalis, A.; Tymvios, F.; Michaelides, S. Analysis of precipitation extremes based on satellite (CHIRPS) and in situ dataset over Cyprus. Nat. Hazards 2016, 83, 53–63. [Google Scholar] [CrossRef]
- Poméon, T. Evaluating the Contribution of Remote Sensing Data Products for Regional Simulations of Hydrological Processes in West Africa Using a Multi-Model Ensemble. Ph.D. Thesis, Rheinische Friedrich-Wilhelms-Universität Bonn, Bonn, Germany, 2019. [Google Scholar]
- Maggioni, V.; Nikolopoulos, E.I.; Anagnostou, E.N.; Borga, M. Modeling satellite precipitation errors over mountainous terrain: The influence of gauge density, seasonality, and temporal resolution. IEEE Trans. Geosci. Remote Sens. 2017, 55, 4130–4140. [Google Scholar] [CrossRef]
- Sayama, T.; Ozawa, G.; Kawakami, T.; Nabesaka, S.; Fukami, K. Rainfall–runoff–inundation analysis of the 2010 Pakistan flood in the Kabul River basin. Hydrol. Sci. J. 2012, 57, 298–312. [Google Scholar] [CrossRef]
- Skofronick-Jackson, G.; Berg, W.; Kidd, C.; Kirschbaum, D.B.; Petersen, W.A.; Huffman, G.J.; Takayabu, Y.N. Global Precipitation Measurement (GPM): Unified Precipitation Estimation from Space. In Remote Sensing of Clouds and Precipitation; Andronache, C., Ed.; Springer International Publishing: Cham, Switzerland, 2018; pp. 175–193. [Google Scholar]
- You, Y.; Wang, N.-Y.; Kubota, T.; Aonashi, K.; Shige, S.; Kachi, M.; Kummerow, C.; Randel, D.; Ferraro, R.; Braun, S.; et al. Comparison of TRMM Microwave Imager Rainfall Datasets from NASA and JAXA. J. Hydrometeorol. 2020, 21, 377–397. [Google Scholar] [CrossRef]
- Li, N.; Wang, Z.; Chen, X.; Austin, G. Studies of General Precipitation Features with TRMM PR Data: An Extensive Overview. Remote Sens. 2019, 11, 80. [Google Scholar] [CrossRef]
- George Huffman, W.M.; Cosner, C.; Reed, J. Global Precipitation Measurement. In The Global Precipitation Measurement Mission (GPM); Earth Science Division/National Aeronautics and Space Administration: Hampton, VA, USA, 2024. [Google Scholar]
- Demirdjian, L.; Zhou, Y.; Huffman, G.J. Statistical Modeling of Extreme Precipitation with TRMM Data. J. Appl. Meteorol. Climatol. 2018, 57, 15–30. [Google Scholar] [CrossRef]
- Sheffield, J.; Wood, E.F.; Pan, M.; Beck, H.; Coccia, G.; Serrat-Capdevila, A.; Verbist, K.J. Satellite remote sensing for water resources management: Potential for supporting sustainable development in data-poor regions. Water Resour. Res. 2018, 54, 9724–9758. [Google Scholar] [CrossRef]
- Pakoksung, K.; Takagi, M. Effect of satellite based rainfall products on river basin responses of runoff simulation on flood event. Model. Earth Syst. Environ. 2016, 2, 143. [Google Scholar] [CrossRef]
- Bhattacharjee, S.; Ghosh, S.K.; Chen, J. Spatial Interpolation. In Semantic Kriging for Spatio-Temporal Prediction; Springer Singapore: Singapore, 2019; pp. 19–41. [Google Scholar]
- Wu, Y.H.; Hung, M.C. Comparison of spatial interpolation techniques using visualization and quantitative assessment. Appl. Spat. Stat. 2016, 17–34. [Google Scholar] [CrossRef]
- Kuras, A. Airborne Hyperspectral Imaging for Multisensor Data Fusion. Ph.D. Thesis, Norwegian University of Life Sciences, As, Norway, 2023. [Google Scholar]
- Dinku, T.; Funk, C.; Peterson, P.; Maidment, R.; Tadesse, T.; Gadain, H.; Ceccato, P. Validation of the CHIRPS satellite rainfall estimates over eastern Africa. Q. J. R. Meteorol. Soc. 2018, 144, 292–312. [Google Scholar] [CrossRef]
- Ye, X.; Guo, Y.; Wang, Z.; Liang, L.; Tian, J. Extensive Evaluation of Four Satellite Precipitation Products and Their Hydrologic Applications over the Yarlung Zangbo River. Remote Sens. 2022, 14, 3350. [Google Scholar] [CrossRef]
- Wang, J.; Petersen, W.A.; Wolff, D.B. Validation of Satellite-Based Precipitation Products from TRMM to GPM. Remote Sens. 2021, 13, 1745. [Google Scholar] [CrossRef]
- Kidd, C.; Matsui, T.; Blackwell, W.; Braun, S.; Leslie, R.; Griffith, Z. Precipitation Estimation from the NASA TROPICS Mission: Initial Retrievals and Validation. Remote Sens. 2022, 14, 2992. [Google Scholar] [CrossRef]
- Hernández, A.; Arganis Juárez, M.L.; Mora, R.D.; Elizondo, E.C.; Ibarra, I.P. HIDROGRAMAS DE DISEÑO OBTENIDO CON ANÁLISIS DE ESCURRIMIENTOS; Universidad Nacional Autónoma de México Facultad de Ingeniería: Mexico City, Mexico, 2018. [Google Scholar]
- Banco Nacional de Datos de Aguas Superficiales (SIG BANDAS). Regiones Hidrologicas Administrativas. Available online: http://hidrosuperf.imta.mx/bandas/ (accessed on 7 February 2020).
- Tu, M.C.; Wadzuk, B.; Traver, R. Methodology to simulate unsaturated zone hydrology in storm water management model (SWMM) for green infrastructure design and evaluation. PLoS ONE 2020, 15, e0235528. [Google Scholar] [CrossRef]
- Huffman, G.J.; Bolvin, D.T.; Nelkin, E.J.; Wolff, D.B.; Adler, R.F.; Gu, G.; Hong, Y.; Bowman, K.P.; Stocker, E.F. The TRMM multisatellite precipitation analysis (TMPA): Quasi-global, multiyear, combined-sensor precipitation estimates at fine scales. J. Hydrometeorol. 2007, 8, 38–55. [Google Scholar] [CrossRef]
- Ajaaj, A.A.; Mishra, A.K.; Khan, A.A. Evaluation of satellite and gauge-based precipitation products through hydrologic simulation in Tigris River basin under data-scarce environment. J. Hydrol. Eng. 2019, 24, 05018033. [Google Scholar] [CrossRef]
- Levizzani, V.; Kidd, C.; Kirschbaum, D.B.; Kummerow, C.D.; Nakamura, K.; Turk, F.J. Satellite Precipitation Measurement; Springer: Berlin/Heidelberg, Germany, 2020. [Google Scholar]
- Kumar, M.; Hodnebrog, Ø.; Daloz, A.S.; Sen, S.; Badiger, S.; Krishnaswamy, J. Measuring precipitation in Eastern Himalaya: Ground validation of eleven satellite, model and gauge interpolated gridded products. J. Hydrol. 2021, 599, 126252. [Google Scholar] [CrossRef]
- Paredes-Trejo, F.; Barbosa, H.A.; Giovannettone, J.; Lakshmi Kumar, T.V.; de Oliveira Buriti, C.; Prieto, J. Assessing Satellite-Based Products in Characterizing Agricultural Drought Under Climate Change in Northeast Brazil. In Climate Change and Agriculture: Perspectives, Sustainability and Resilience; John Wiley & Sons Ltd.: Hoboken, NJ, USA, 2022; pp. 426–442. [Google Scholar]
- Beck, H.E.; Van Dijk, A.I.; Levizzani, V.; Schellekens, J.; Miralles, D.G.; Martens, B.; De Roo, A. MSWEP: 3-hourly 0.25 global gridded precipitation (1979–2015) by merging gauge, satellite, and reanalysis data. Hydrol. Earth Syst. Sci. 2017, 21, 589–615. [Google Scholar] [CrossRef]
- Clark, P.E.; Rilee, M.L. Remote Sensing Tools for Exploration: Observing and Interpreting the Electromagnetic Spectrum; Springer Science & Business Media: Berlin/Heidelberg, Germany, 2010. [Google Scholar]
- Awasthi, N.; Tripathi, J.N.; Petropoulos, G.P.; Gupta, D.K.; Singh, A.K.; Kathwas, A.K. Performance Assessment of Global-EO-Based Precipitation Products against Gridded Rainfall from the Indian Meteorological Department. Remote Sens. 2023, 15, 3443. [Google Scholar] [CrossRef]
- Harrison, L.; Landsfeld, M.; Husak, G.; Davenport, F.; Shukla, S.; Turner, W.; Peterson, P.; Funk, C. Advancing early warning capabilities with CHIRPS-compatible NCEP GEFS precipitation forecasts. Sci. Data 2022, 9, 375. [Google Scholar] [CrossRef]
- Koo, M.-S.; Hong, S.-Y.; Kim, J. An evaluation of the tropical rainfall measuring mission (TRMM) multi-satellite precipitation analysis (TMPA) data over South Korea. Asia-Pac. J. Atmos. Sci. 2009, 45, 265–282. [Google Scholar]
- Prat, O.P.; Nelson, B.R. Mapping the world’s tropical cyclone rainfall contribution over land using the TRMM Multi-satellite Precipitation Analysis. Water Resour. Res. 2013, 49, 7236–7254. [Google Scholar] [CrossRef]
- National Research Council; Institute of Medicine; Board on Health Sciences Policy; Division on Earth and Life Studies; Board on Earth Sciences and Resources; Committee on Research Priorities for Earth Science and Public Health. Earth Materials and Health: Research Priorities for Earth Science and Public Health; National Academies Press: Washington, DC, USA, 2007. [Google Scholar]
- Nakamura, K. Progress from TRMM to GPM. J. Meteorol. Soc. Jpn. 2021, 99, 697–729. [Google Scholar] [CrossRef]
- Kummerow, C.; Simpson, J.; Thiele, O.; Barnes, W.; Chang, A.T.; Stocker, E.; Adler, R.F.; Hou, A.; Kakar, R.; Wentz, F.; et al. The status of the Tropical Rainfall Measuring Mission (TRMM) after two years in orbit. J. Appl. Meteorol. 2000, 39, 1965–1982. [Google Scholar] [CrossRef]
- Zagrodnik, J.P. Comparison and Validation of Tropical Rainfall Measuring Mission (TRMM) Rainfall Algorithms in Tropical Cyclones. Master’s Thesis, Florida International University, Miami, FL, USA, 2012. [Google Scholar] [CrossRef]
- Yang, R.; Rui, H. Applications of Trmm Scientific Data. In Observation, Theory and Modeling of Atmospheric Variability; World Scientific Publishing: Singapore, 2004; pp. 473–483. [Google Scholar]
- Cheema, M.J.M.; Bastiaanssen, W.G.M. Local calibration of remotely sensed rainfall from the TRMM satellite for different periods and spatial scales in the Indus Basin. Int. J. Remote Sens. 2012, 33, 2603–2627. [Google Scholar] [CrossRef]
- Kummerow, C.; Olson, W.S.; Giglio, L. A simplified scheme for obtaining precipitation and vertical hydrometeor profiles from passive microwave sensors. IEEE Trans. Geosci. Remote Sens. 1996, 34, 1213–1232. [Google Scholar] [CrossRef]
- Giglio, L.; Kendall, J.D.; Tucker, C.J. Remote sensing of fires with the TRMM VIRS. Int. J. Remote Sens. 2000, 21, 203–207. [Google Scholar] [CrossRef]
- Weng, F.; Zhao, L.; Ferraro, R.R.; Poe, G.; Li, X.; Grody, N.C. Advanced microwave sounding unit cloud and precipitation algorithms. Radio Sci. 2003, 38, 33-1–33-13. [Google Scholar] [CrossRef]
- Bruster-Flores, J.L.; Ortiz-Gómez, R.; Ferriño-Fierro, A.L.; Guerra-Cobián, V.H.; Burgos-Flores, D.; Lizárraga-Mendiola, L.G. Evaluation of precipitation estimates CMORPH-CRT on regions of Mexico with different climates. Water 2019, 11, 1722. [Google Scholar] [CrossRef]
- Liu, J.; Xia, J.; She, D.; Li, L.; Wang, Q.; Zou, L. Evaluation of six satellite-based precipitation products and their ability for capturing characteristics of extreme precipitation events over a climate transition area in China. Remote Sens. 2019, 11, 1477. [Google Scholar] [CrossRef]
- Chen, J.; Li, Z.; Li, L.; Wang, J.; Qi, W.; Xu, C.-Y.; Kim, J.-S. Evaluation of Multi-Satellite Precipitation Datasets and Their Error Propagation in Hydrological Modeling in a Monsoon-Prone Region. Remote Sens. 2020, 12, 3550. [Google Scholar] [CrossRef]
- Duan, Z.; Liu, J.; Tuo, Y.; Chiogna, G.; Disse, M. Evaluation of eight high spatial resolution gridded precipitation products in Adige Basin (Italy) at multiple temporal and spatial scales. Sci. Total Environ. 2016, 573, 1536–1553. [Google Scholar] [CrossRef] [PubMed]
- Filianoti, P.; Gurnari, L.; Zema, D.A.; Bombino, G.; Sinagra, M.; Tucciarelli, T. An Evaluation Matrix to Compare Computer Hydrological Models for Flood Predictions. Hydrology 2020, 7, 42. [Google Scholar] [CrossRef]
- Yosef, Y.; Aguilar, E.; Alpert, P. Is it possible to fit extreme climate change indices together seamlessly in the era of accelerated warming. Int. J. Climatol. 2021, 41, E952–E963. [Google Scholar] [CrossRef]
- Chang, M.; Dereczynski, C.; Freitas, M.A.V.; Chou, S.C. Climate Change Index: A Proposed Methodology for Assessing Susceptibility to Future Climatic Extremes. Am. J. Clim. Chang. 2014, 3, 326. [Google Scholar] [CrossRef]
- Russo, S.; Sterl, A. Global changes in indices describing moderate temperature extremes from the daily output of a climate model. J. Geophys. Res. Atmos. 2011, 116, 1–12. [Google Scholar] [CrossRef]
- Codjoe, S.N.; Atiglo, D.Y. The implications of extreme weather events for attaining the sustainable development goals in sub-Saharan Africa. Front. Clim. 2020, 2, 592658. [Google Scholar] [CrossRef]
- Mishra, A.; Alnahit, A.; Campbell, B. Impact of land uses, drought, flood, wildfire, and cascading events on water quality and microbial communities: A review and analysis. J. Hydrol. 2021, 596, 125707. [Google Scholar] [CrossRef]
- Pan, X.; Rahman, A.; Haddad, K.; Ouarda, T.B. Peaks-over-threshold model in flood frequency analysis: A scoping review. Stoch. Environ. Res. Risk Assess. 2022, 36, 2419–2435. [Google Scholar] [CrossRef]
- Norheim, S. Flood Frequency Analysis: Comparing Annual Maximum Series and Peak over Threshold: A Case Study for Norway; Høgskulen på Vestlandet: Bergen, Norway, 2018. [Google Scholar]
- Mostofi Zadeh, S.; Durocher, M.; Burn, D.H.; Ashkar, F. Pooled flood frequency analysis: A comparison based on peaks-over-threshold and annual maximum series. Hydrol. Sci. J. 2019, 64, 121–136. [Google Scholar] [CrossRef]
- Wi, S.; Valdés, J.B.; Steinschneider, S.; Kim, T.W. Non-stationary frequency analysis of extreme precipitation in South Korea using peaks-over-threshold and annual maxima. Stoch. Environ. Res. Risk Assess. 2016, 30, 583–606. [Google Scholar] [CrossRef]
- Dams, J.; Nossent, J.; Senbeta, T.B.; Willems, P.; Batelaan, O. Multi-model approach to assess the impact of climate change on runoff. J. Hydrol. 2015, 529, 1601–1616. [Google Scholar] [CrossRef]
- Cooley, A.K.; Chang, H. Detecting change in precipitation indices using observed (1977–2016) and modeled future climate data in Portland, Oregon, USA. J. Water Clim. Chang. 2021, 12, 1135–1153. [Google Scholar] [CrossRef]
- Moran-Tejeda, E.; López-Moreno, J.I.; Vicente-Serrano, S.M.; Lorenzo-Lacruz, J.; Ceballos-Barbancho, A. The contrasted evolution of high and low flows and precipitation indices in the Duero basin (Spain). Hydrol. Sci. J. 2012, 57, 591–611. [Google Scholar] [CrossRef]
- Rahmani, V.; Harrington, J., Jr. Assessment of climate change for extreme precipitation indices: A case study from the central United States. Int. J. Climatol. 2019, 39, 1013–1025. [Google Scholar] [CrossRef]
- Bitew, M.M.; Gebremichael, M. Assessment of satellite rainfall products for streamflow simulation in medium watersheds of the Ethiopian highlands. Hydrol. Earth Syst. Sci. 2011, 15, 1147–1155. [Google Scholar] [CrossRef]
- Maggioni, V.; Massari, C. On the performance of satellite precipitation products in riverine flood modeling: A review. J. Hydrol. 2018, 558, 214–224. [Google Scholar] [CrossRef]
- Tikkanen, H. Hydrological Modeling of a Large Urban Catchment Using a Stormwater Management Model (SWMM). Master’s Thesis, Aalto University, Espoo, Finland, 2013. [Google Scholar]
- Zeng, Z.; Yuan, X.; Liang, J.; Li, Y. Designing and implementing an SWMM-based web service framework to provide decision support for real-time urban stormwater management. Environ. Model. Softw. 2021, 135, 104887. [Google Scholar] [CrossRef]
- Lee, H.; Woo, W.; Park, Y.S. A User-Friendly Software Package to Develop Storm Water Management Model (SWMM) Inputs and Suggest Low Impact Development Scenarios. Water 2020, 12, 2344. [Google Scholar] [CrossRef]
- Zhang, X.; Qiao, W.; Xiao, Y.; Lu, Y. Analysis of regional flooding in the urbanization expansion process based on the SWMM model. Nat. Hazards 2023, 117, 1349–1363. [Google Scholar] [CrossRef]
- Dell, T.; Razzaghmanesh, M.; Sharvelle, S.; Arabi, M. Development and Application of a SWMM-Based Simulation Model for Municipal Scale Hydrologic Assessments. Water 2021, 13, 1644. [Google Scholar] [CrossRef]
- Montalvo, C.; Reyes-Silva, J.D.; Sañudo, E.; Cea, L.; Puertas, J. Urban pluvial flood modelling in the absence of sewer drainage network data: A physics-based approach. J. Hydrol. 2024, 634, 131043. [Google Scholar] [CrossRef]
- Sun, N.; Hall, M.; Hong, B.; Zhang, L. Impact of SWMM Catchment Discretization: Case Study in Syracuse, New York. J. Hydrol. Eng. 2014, 19, 223–234. [Google Scholar] [CrossRef]
- Fujita, T.; Capozzoli, C.R.; Rafee, S.A.A.; de Freitas, E.D. Hydrological Modeling of Urbanized Basins. In Environmental Governance of the São Paulo Macrometropolis: Perspectives on Climate Variability; Jacobi, P.R., Turra, A., Bermann, C., Freitas, E.D.d., Frey, K., Giatti, L.L., Travassos, L., Sinisgalli, P.A.d.A., Momm, S., Zanirato, S., et al., Eds.; Springer Nature Switzerland: Cham, Switzerland, 2024; pp. 231–240. [Google Scholar]
- Gichamo, T.; Nourani, V.; Gökçekuş, H.; Gelete, G. Ensemble rainfall–runoff modeling of physically based semi-distributed models using multi-source rainfall data fusion. J. Water Clim. Chang. 2024, 15, 325–347. [Google Scholar] [CrossRef]
- Snikitha, S.; Kumar, G.P.; Dwarakish, G.S. A Comprehensive Review of Cutting-Edge Flood Modelling Approaches for Urban Flood Resilience Enhancement. Water Conserv. Sci. Eng. 2024, 10, 2. [Google Scholar] [CrossRef]
- Abedin, S.; MacVicar, B. Understanding the impacts of hydraulic uncertainties on urban flood mapping. In River Flow 2022; CRC Press: Boca Raton, FL, USA, 2024; pp. 1028–1034. [Google Scholar]
- Manandhar, B.; Cui, S.; Wang, L.; Shrestha, S. Urban Flood Hazard Assessment and Management Practices in South Asia: A Review. Land 2023, 12, 627. [Google Scholar] [CrossRef]
- Nasrollahi, F. Modeling the Effectiveness of Flood Adaptation Strategies Under Climate Change. Ph.D. Thesis, Drexel University, Philadelphia, PA, USA, 2024. [Google Scholar]
- Mayou, L.A.; Alamdari, N.; Ahmadisharaf, E.; Kamali, M. Impacts of future climate and land use/land cover change on urban runoff using fine-scale hydrologic modeling. J. Environ. Manag. 2024, 362, 121284. [Google Scholar] [CrossRef]
- Khatooni, K.; Hooshyaripor, F.; MalekMohammadi, B.; Noori, R. A new approach for urban flood risk assessment using coupled SWMM–HEC-RAS-2D model. J. Environ. Manag. 2025, 374, 123849. [Google Scholar] [CrossRef]
- Sañudo, E.; Cea, L.; Puertas, J. Modelling Pluvial Flooding in Urban Areas Coupling the Models Iber and SWMM. Water 2020, 12, 2647. [Google Scholar] [CrossRef]
- Zafeirakos, N. A Study on the Mandra Flash Flood of 2017 Using a Coupled 1D/2D Model (SWMM/P-DWave). Master’s Thesis, National Technical University of Athens, Athens, Greece, 2020. [Google Scholar]
- Huffman, G.J.; Stocker, E.F.; Bolvin, D.T.; Nelkin, E.J.; Tan, J. GPM IMERG Final Precipitation L3 Half Hourly 0.1 degree × 0.1 degree V06; Goddard Earth Sciences Data and Information Services Center (GES DISC): Greenbelt, MD, USA, 2019. [Google Scholar] [CrossRef]
- Sgroi, L.; Forgioni, F.; Müller, G.; Doyle, M.; Lovino, M.; Benítez, V.; Ferreira, L.; Flores, K. Desempeño de productos IMERG y PERSIANN para detección de precipitación en el sudeste de Sudamerica. In Proceedings of the XIV Congreso Argentino de Meteorología (CONGREMET), Buenos Aires, Argentina, 7–11 November 2022. [Google Scholar]
- de Lourdes Corral-Bermudez, M.; Sánchez-Ortiz, E.; Álvarez-Bernal, D.; Gutiérrez-Montenegro, M.O.; Cassio-Madrazo, E. Scenarios of availability of water due to overexploitation of the aquifer in the basin of Laguna de Santiaguillo, Durango, Mexico. PeerJ 2019, 7, e6814. [Google Scholar] [CrossRef]
- Ferrari, L.; Levresse, G.; Aranda-Gómez, J.J.; Henry, C.D.; Valencia-Moreno, M.; Landín, L.O.; Ferrari, L.; Levresse, G.; Aranda-Gómez, J.J.; Henry, C.D.; et al. Tectonomagmatic Pulses and Multiphase Mineralization in the Sierra Madre Occidental, Mexico. In Tectonomagmatic Pulses and Multiphase Mineralization in the Sierra Madre Occidental, Mexico; Society of Economic Geologists: Littleton, CO, USA, 2020; Volume 61. [Google Scholar]
- Qiu, Y.; da Silva Rocha Paz, I.; Chen, F.; Versini, P.A.; Schertzer, D.; Tchiguirinskaia, I. Space variability impacts on hydrological responses of nature-based solutions and the resulting uncertainty: A case study of Guyancourt (France). Hydrol. Earth Syst. Sci. 2021, 25, 3137–3162. [Google Scholar] [CrossRef]
- Gwak, Y.; Kim, S. Factors affecting soil moisture spatial variability for a humid forest hillslope. Hydrol. Process. 2017, 31, 431–445. [Google Scholar] [CrossRef]
- Li, D.; Lettenmaier, D.P.; Margulis, S.A.; Andreadis, K. The value of accurate high-resolution and spatially continuous snow information to streamflow forecasts. J. Hydrometeorol. 2019, 20, 731–749. [Google Scholar] [CrossRef]
- Shen, Y.; Hong, Z.; Pan, Y.; Yu, J.; Maguire, L. China’s 1 km merged gauge, radar and satellite experimental precipitation dataset. Remote Sens. 2018, 10, 264. [Google Scholar] [CrossRef]
- Sadeghi, M.; Asanjan, A.A.; Faridzad, M.; Nguyen, P.H.; Hsu, K.; Sorooshian, S.; Braithwaite, D.A. PERSIANN-CNN: Precipitation estimation from remotely sensed information using artificial neural networks–convolutional neural networks. J. Hydrometeorol. 2019, 20, 2273–2289. [Google Scholar] [CrossRef]
- Li, H.; Zhang, Y.; Lei, H.; Hao, X. Machine learning-based bias correction of precipitation measurements at high altitude. Remote Sens. 2023, 15, 2180. [Google Scholar] [CrossRef]
- Nguyen, P.; Thorstensen, A.; Sorooshian, S.; Zhu, Q.; Tran, H.; Ashouri, H.; Miao, C.; Hsu, K.; Gao, X. Evaluation of CMIP5 model precipitation using PERSIANN-CDR. J. Hydrometeorol. 2017, 18, 2313–2330. [Google Scholar] [CrossRef]
- Marc, O.; Oliveira, R.A.; Gosset, M.; Emberson, R.; Malet, J.P. Global assessment of the capability of satellite precipitation products to retrieve landslide-triggering extreme rainfall events. Earth Interact. 2022, 26, 122–138. [Google Scholar] [CrossRef]
- Kidd, C.; Huffman, G. Global precipitation measurement. Meteorol. Appl. 2011, 18, 334–353. [Google Scholar] [CrossRef]
- Turk, F.J.; Li, L.; Haddad, Z.S. A physically based soil moisture and microwave emissivity data set for Global Precipitation Measurement (GPM) applications. IEEE Trans. Geosci. Remote Sens. 2014, 52, 7637–7650. [Google Scholar] [CrossRef]
- Skofronick-Jackson, G.; Petersen, W.A.; Berg, W.; Kidd, C.; Stocker, E.F.; Kirschbaum, D.B.; Kakar, R.; Braun, S.A.; Huffman, G.J.; Iguchi, T.; et al. The Global Precipitation Measurement (GPM) mission for science and society. Bull. Am. Meteorol. Soc. 2017, 98, 1679–1695. [Google Scholar] [CrossRef] [PubMed]
- Prakash, S.; Mitra, A.K.; AghaKouchak, A.; Pai, D.S. Error characterization of TRMM Multisatellite Precipitation Analysis (TMPA-3B42) products over India for different seasons. J. Hydrol. 2015, 529, 1302–1312. [Google Scholar] [CrossRef]
- Hirpa, F.A.; Gebremichael, M.; Hopson, T. Evaluation of high-resolution satellite precipitation products over very complex terrain in Ethiopia. J. Appl. Meteorol. Climatol. 2010, 49, 1044–1051. [Google Scholar] [CrossRef]
- Kim, J.; Han, H. Evaluation of the CMORPH high-resolution precipitation product for hydrological applications over South Korea. Atmos. Res. 2021, 258, 105650. [Google Scholar] [CrossRef]
- Zhang, C.; Chen, X.; Shao, H.; Chen, S.; Liu, T.; Chen, C.; Ding, Q.; Du, H. Evaluation and Intercomparison of High-Resolution Satellite Precipitation Estimates—GPM, TRMM, and CMORPH in the Tianshan Mountain Area. Remote Sens. 2018, 10, 1543. [Google Scholar] [CrossRef]
- Katiraie-Boroujerdy, P.-S.; Nasrollahi, N.; Hsu, K.-l.; Sorooshian, S. Evaluation of satellite-based precipitation estimation over Iran. J. Arid Environ. 2013, 97, 205–219. [Google Scholar] [CrossRef]
- Shen, Y.; Xiong, A.; Wang, Y.; Xie, P. Performance of high-resolution satellite precipitation products over China. J. Geophys. Res. Atmos. 2010, 115. [Google Scholar] [CrossRef]
- Thiemig, V.; Rojas, R.; Zambrano-Bigiarini, M.; Levizzani, V.; De Roo, A. Validation of satellite-based precipitation products over sparsely gauged African river basins. J. Hydrometeorol. 2012, 13, 1760–1783. [Google Scholar] [CrossRef]
- Rozante, J.R.; Vila, D.A.; Barboza Chiquetto, J.; Fernandes, A.D.; Souza Alvim, D. Evaluation of TRMM/GPM blended daily products over Brazil. Remote Sens. 2018, 10, 882. [Google Scholar] [CrossRef]
- Sun, Q.; Miao, C.; Duan, Q.; Ashouri, H.; Sorooshian, S.; Hsu, K.L. A review of global precipitation data sets: Data sources, estimation, and intercomparisons. Rev. Geophys. 2018, 56, 79–107. [Google Scholar] [CrossRef]
- Xiao, S.; Xia, J.; Zou, L. Evaluation of multi-satellite precipitation products and their ability in capturing the characteristics of extreme climate events over the Yangtze River Basin, China. Water 2020, 12, 1179. [Google Scholar] [CrossRef]
- Guo, H.; Bao, A.; Liu, T.; Chen, S.; Ndayisaba, F. Evaluation of PERSIANN-CDR for Meteorological Drought Monitoring over China. Remote Sens. 2016, 8, 379. [Google Scholar] [CrossRef]
- Guo, H.; Bao, A.; Liu, T.; Ndayisaba, F.; He, D.; Kurban, A.; De Maeyer, P. Meteorological Drought Analysis in the Lower Mekong Basin Using Satellite-Based Long-Term CHIRPS Product. Sustainability 2017, 9, 901. [Google Scholar] [CrossRef]
- Miao, C.; Ashouri, H.; Hsu, K.L.; Sorooshian, S.; Duan, Q. Evaluation of the PERSIANN-CDR Daily Rainfall Estimates in Capturing the Behavior of Extreme Precipitation Events over China. J. Hydrometeorol. 2015, 16, 1387–1396. [Google Scholar] [CrossRef]
- Yang, L.; Shi, Z.; Liu, R.; Xing, M. Evaluating the performance of global precipitation products for precipitation and extreme precipitation in arid and semiarid China. Int. J. Appl. Earth Obs. Geoinf. 2024, 130, 103888. [Google Scholar] [CrossRef]
- Guo, H.; Li, M.; Nzabarinda, V.; Bao, A.; Meng, X.; Zhu, L.; De Maeyer, P. Assessment of Three Long-Term Satellite-Based Precipitation Estimates against Ground Observations for Drought Characterization in Northwestern China. Remote Sens. 2022, 14, 828. [Google Scholar] [CrossRef]
- Manchikatla, S.K.; Umamahesh, N.V. Simulation of flood hazard, prioritization of critical sub-catchments, and resilience study in an urban setting using PCSWMM: A case study. Water Policy 2022, 24, 1247–1268. [Google Scholar] [CrossRef]
- Irvine, K.N.; Chua, L.H.C. Modeling stormwater runoff from an urban park, Singapore using PCSWWM. J. Water Manag. Model. 2016, 25, 1–8. [Google Scholar] [CrossRef]
- Moriasi, D.N.; Arnold, J.G.; Van Liew, M.W.; Bingner, R.L.; Harmel, R.D.; Veith, T.L. Model evaluation guidelines for systematic quantification of accuracy in watershed simulations. Trans. ASABE 2007, 50, 885–900. [Google Scholar] [CrossRef]
- Martinez-Cruz, D.A.; Gutiérrez, M.; Alarcón-Herrera, M.T. Spatial and temporal analysis of precipitation and drought trends using the climate forecast system reanalysis (CFSR). In Stewardship of Future Drylands and Climate Change in the Global South: Challenges and Opportunities for the Agenda 2030; Springer: Berlin/Heidelberg, Germany, 2020; pp. 129–146. [Google Scholar]
- Agel, L.; Barlow, M.; Qian, J.H.; Colby, F.; Douglas, E.; Eichler, T. Climatology of Daily Precipitation and Extreme Precipitation Events in the Northeast United States. J. Hydrometeorol. 2015, 16, 2537–2557. [Google Scholar] [CrossRef]
- Jiang, D.; Wang, K. The Role of Satellite-Based Remote Sensing in Improving Simulated Streamflow: A Review. Water 2019, 11, 1615. [Google Scholar] [CrossRef]
- Wang, N.; Lombardo, L.; Gariano, S.L.; Cheng, W.; Liu, C.; Xiong, J.; Wang, R. Using satellite rainfall products to assess the triggering conditions for hydro-morphological processes in different geomorphological settings in China. Int. J. Appl. Earth Obs. Geoinf. 2021, 102, 102350. [Google Scholar] [CrossRef]


| Key | Name | State | Latitude | Longitude | Height (msnm) | Topography |
|---|---|---|---|---|---|---|
| 10002 | Canatlán/SMN | Durango | 24.55 | 104.74 | 1960 | Plain |
| 10016 | Chinacates | Durango | 25.01 | 105.21 | 2050 | Mountain |
| 10022 | El Pino | Durango | 24.62 | 104.87 | 2100 | Mountain |
| 10024 | El Saltito | Durango | 24.03 | 104.35 | 1847 | Plain |
| 10027 | Francisco I. Madero | Durango | 24.4 | 104.32 | 1960 | Plain |
| 10030 | Guadalupe Victoria | Durango | 24.45 | 104.12 | 2000 | Plain |
| 10051 | Otinapa | Durango | 24.05 | 105.01 | 2400 | Mountain |
| 10066 | San José de Acevedo | Durango | 23.81 | 104.27 | 2100 | Mountain |
| 10076 | Santiago Bayacora | Durango | 23.9 | 104.6 | 2150 | Mountain |
| 10083 | Tejamén | Durango | 24.81 | 105.13 | 1930 | Plain |
| 10090 | Canatlán | Durango | 24.52 | 104.78 | 2000 | Plain |
| 10092 | Durango | Durango | 24.02 | 104.67 | 1900 | Plain |
| 10103 | Santa Barbara | Durango | 23.82 | 104.93 | 2260 | Mountain |
| 10110 | Hacienda La Pila | Durango | 24.12 | 104.29 | 1890 | Plain |
| 10137 | Guatimape | Durango | 24.81 | 104.92 | 1974 | Plain |
| 10006 | Cendradillas | Durango | 26.28 | 106.01 | 2270 | Mountain |
| Name | Spatial Coverage | Reference | Time Span | Website |
|---|---|---|---|---|
| CHIRPS | 50° S−50° N | [19] | 1981–present | https://data.chc.ucsb.edu/products/CHIRPS-2.0/ |
| CMORPH | 60° S−60° N | [14] | 1998–present | Index of /precip/global_CMORPH |
| TRMM | 35° S−35° N | [51] | 1997–present | https://gpm.nasa.gov/missions/trmm/mission-end |
| Category | ID | Definition | Unit |
|---|---|---|---|
| Extreme precipitation indices | RR95p | 95th percentile of daily precipitation on wet days (days with daily precipitation ≥1 mm) | mm/day |
| R25mm | Annual count of days when daily precipitation is ≥25 mm | days | |
| Rx1d | Maximum annual precipitation of 1 day | mm | |
| Rx2d | Annual maximum of 5 days of consecutive precipitation | mm | |
| Extreme flow rates | Qx1d | Maximum annual flow rate of 1 day | m3/S |
| Qx2d | Maximum annual flow rate of 2 days | m3/S | |
| Qx3d | Maximum annual flow rate of 3 days | m3/S |
| Statistical Index | Description | |
|---|---|---|
| Bias volume (%) | (1) | |
| Mean square error | (2) | |
| Correlation | (3) | |
| Medium bias | (4) | |
| where Qv is the volume of observation, Qvs is the volume of simulation, Qpo is the observation peak, Qps is the simulation peak, Qo is the data of observation, Qs is the simulation data, and n is the total sample number. |
| Parameter or Attribute | Description |
|---|---|
| Area | Watershed area (hectares or acres) |
| Width | Characteristic width of the flow path due to superficial runoff |
| %Slope | Average slope of the basin in % |
| %Imprev | Percentage of watershed whose soil is impermeable |
| N-Inprev | Manning’s n coefficient for surface flow over the waterproof area of the basin |
| N-Prev | Manning’s N coefficient for surface flow over the permeable area of the basin |
| Dstore-Imperv | Storage height in depression above the impermeable area of the basin |
| Dstore-Prev | Storage height in depression above the permeable area of the basin |
| %Zero-Imprev | Percentage of impermeable soil that does not have depression storage |
| Percent Routed | Percentage of runoff between different areas |
| Infiltration | The process of precipitation that penetrates the soil surface in the unsaturated soil zone of permeable catchment sub-areas. The SWMM offers five models as an option in infiltration modeling: Horton’s classical method; Horton’s modified method; Green–Ampt method; modified Green–Ampt method; curve number method. |
| Metric | Mountain Stations | Plain Stations |
|---|---|---|
| Correlation (Rs) | ||
| CHIRPS | 0.63 ** | 0.75 ** |
| CMORPH | 0.58 * | 0.71 * |
| TRMM | 0.51 ** | 0.59 ** |
| RMSE (mm) | ||
| CHIRPS | 28 | 22 |
| CMORPH | 30 | 19 |
| TRMM | 35 | 33 |
| Relative Bias (%) | ||
| CHIRPS | −29 | 40 |
| CMORPH | −22 | 30 |
| TRMM | −27 | 35 |
| Mean Ratio | ||
| CHIRPS | 0.78 | 1.30 |
| CMORPH | 0.68 | 1.40 |
| TRMM | 0.80 | 1.20 |
| Extreme Precipitation Index | Statistical Results | TRMM | CHIRPS | CMORPH |
|---|---|---|---|---|
| RR95p | Rs | 0.55 * | 0.67 ** | 0.51 * |
| RMSE (mm) | 150.00 | 120.00 | 160.00 | |
| ME (mm) | 12.00 | 3.00 | 13.00 | |
| BIAS (%) | −8.00 | −0.50 | −9.00 | |
| R25mm | Rs | 0.46 * | 0.22 * | 0.51 ** |
| RMSE (mm) | 3.50 | 3.20 | 3.40 | |
| ME (mm) | 2.20 | 2.00 | 2.20 | |
| BIAS (%) | 30.00 | 10.00 | 32.00 | |
| Rx1d | Rs | 0.42 * | 0.25 * | 0.31 * |
| RMSE (mm) | 18.00 | 16.50 | 18.50 | |
| ME (mm) | 12.00 | 11.50 | 12.50 | |
| BIAS (%) | −10.00 | −18.00 | −0.50 | |
| Rx3d | Rs | 0.39 * | 0.52 * | 0.54 ** |
| RMSE (mm) | 30.00 | 28.00 | 31.00 | |
| ME (mm) | 25.00 | 24.00 | 25.50 | |
| BIAS (%) | −30.00 | −22.00 | −35.00 | |
| Rx5d | Rs | 0.46 * | 0.53 ** | 0.58 * |
| RMSE (mm) | 29.50 | 27.50 | 30.00 | |
| ME (mm) | 25.00 | 24.00 | 25.50 | |
| BIAS (%) | −30.00 | −22.00 | −35.00 |
| Extreme Runoff Index | Statistical Results | TRMM | CHIRPS | CMORPH | Precipitation Gauge (CONAGUA) |
|---|---|---|---|---|---|
| Qx1d | R | 0.40 ** | 0.45 ** | 0.50 ** | 0.95 ** |
| RMSE (mm) | 174.80 | 153.74 | 185.78 | ||
| ME (mm) | 17.25 | 5.38 | 17.35 | ||
| BIAS (%) | −11.40 | −1.54 | −12.40 | 3.0 | |
| Qx3d | R | 0.35 * | 0.14 * | 0.35 ** | 0.94 ** |
| RMSE (mm) | 4.10 | 4.088 | 4.089 | ||
| ME (mm) | 2.83 | 2.85 | 2.83 | ||
| BIAS (%) | 35.86 | 14.36 | 36.16 | 3.5 | |
| Qx5d | R | −0.183 * | 0.006 * | 0.123 * | 0.93 * |
| RMSE (mm) | 21.15 | 20.81 | 21.17 | ||
| ME (mm) | 15.34 | 15.14 | 15.42 | ||
| BIAS (%) | −15.48 | −23.88 | −2.50 | 3.2 |
Disclaimer/Publisher’s Note: The statements, opinions and data contained in all publications are solely those of the individual author(s) and contributor(s) and not of MDPI and/or the editor(s). MDPI and/or the editor(s) disclaim responsibility for any injury to people or property resulting from any ideas, methods, instructions or products referred to in the content. |
© 2025 by the authors. Licensee MDPI, Basel, Switzerland. This article is an open access article distributed under the terms and conditions of the Creative Commons Attribution (CC BY) license (https://creativecommons.org/licenses/by/4.0/).
Share and Cite
Barraza, R.L.; Herrera, M.T.A.; Celestino, A.E.M.; Jáquez, A.D.B.; Cruz, D.A.M. Evaluation of the Extreme Precipitation and Runoff Flow Characteristics in a Semiarid Sub-Basin Based on Three Satellite Precipitation Products. Hydrology 2025, 12, 89. https://doi.org/10.3390/hydrology12040089
Barraza RL, Herrera MTA, Celestino AEM, Jáquez ADB, Cruz DAM. Evaluation of the Extreme Precipitation and Runoff Flow Characteristics in a Semiarid Sub-Basin Based on Three Satellite Precipitation Products. Hydrology. 2025; 12(4):89. https://doi.org/10.3390/hydrology12040089
Chicago/Turabian StyleBarraza, Rosalía López, María Teresa Alarcón Herrera, Ana Elizabeth Marín Celestino, Armando Daniel Blanco Jáquez, and Diego Armando Martínez Cruz. 2025. "Evaluation of the Extreme Precipitation and Runoff Flow Characteristics in a Semiarid Sub-Basin Based on Three Satellite Precipitation Products" Hydrology 12, no. 4: 89. https://doi.org/10.3390/hydrology12040089
APA StyleBarraza, R. L., Herrera, M. T. A., Celestino, A. E. M., Jáquez, A. D. B., & Cruz, D. A. M. (2025). Evaluation of the Extreme Precipitation and Runoff Flow Characteristics in a Semiarid Sub-Basin Based on Three Satellite Precipitation Products. Hydrology, 12(4), 89. https://doi.org/10.3390/hydrology12040089