Article

Impact Assessment of Floating Photovoltaic Systems on the Water Quality of Kremasta Lake, Greece

Hellenic Centre for Marine Research—H.C.M.R., Institute of Marine Biological Resources and Inland Waters, 46.7 km Athens—Sounio Ave, 19013 Anavyssos, Attica, Greece
*
Author to whom correspondence should be addressed.
Hydrology 2025, 12(4), 92; https://doi.org/10.3390/hydrology12040092
Submission received: 28 March 2025 / Revised: 12 April 2025 / Accepted: 14 April 2025 / Published: 16 April 2025

Abstract

:
Floating photovoltaic systems (FPV) are one of the emerging technologies that are able to support the “green” energy transition. In Greece, the environmental impact assessment of such projects is still under early development. The scope of the present study was to provide insights into the potential impacts of a small-scale FPV system on the water quality of the oligotrophic Kremasta Lake, an artificial reservoir. For this reason, a hydrodynamic and water quality model was employed. The results showed that the water quality parameter variations were insignificant and limited only in the immediate area of the FPV construction and gradually disappeared toward the shoreline. Likewise, this variation was restricted to the first few meters of depth of the water column and was eliminated onwards. The water temperature slightly decreased only in the area of close proximity to the installation. Average annual dissolved oxygen, chlorophyll-a, and nutrient concentrations were predicted not to change considerably after the panels’ construction. FPV systems can provide an attractive alternative for energy production in artificial reservoirs, especially in regions of land use conflicts that are associated with land allocation for alternative energy development. Given the limited data on the long-term impact of such projects, robust monitoring programs are essential. These initiatives rely on public support, making collaboration between stakeholders and the local community crucial.

1. Introduction

Based on the most recent Sixth Assessment Report (AR6) of the Intergovernmental Panel on Climate Change (IPCC), the largest source of global net anthropogenic greenhouse gas (GHG) direct emissions is the energy sector and the electricity and heat generator individual subsectors in particular [1]. Climate change adaptation and mitigation strategies highlight the need for alternative energy production and propose the use of cleaner energy from renewable resources [2,3]. The energy transition beyond fossil fuels is favored by recent technological advances and innovations that have reduced production costs [1]; solar photovoltaic systems, specifically, are increasingly competitive compared to other forms of electricity generation [4]. Floating photovoltaic (FPV) systems consist of an attractive and viable application with multiple benefits since they provide a solution to the land use conflicts that are associated with deforestation and land allocation [5,6,7] and contribute to water loss through evaporation reduction [5,6,8,9] and to a reduction in carbon dioxide gas emissions [10]. It is remarkable that even in some European Union (EU) countries, efforts to assess the holistic impacts of alternative energy development, including FPV systems, have been late in coming; there are plenty of examples of poor planning and associated conflicts [11,12]. Especially at sites with minimal societal conflict and in artificial reservoirs, where the necessary infrastructure for conveying electricity to consumers has already been installed, hybrid FPV-hydropower systems could contribute to the increasing global energy demands [7,13,14].
Most studies related to the FPV systems in inland water bodies focus on the technological aspects and the financial feasibility rather than the possible environmental issues [15], which are mainly related to water quality, landscape degradation, and impacts on biodiversity and ecosystem functioning [15,16,17]. Τhere is strong evidence that although FPV panels affect local light intensity [18], the impact of FPV systems on the overall water quality of a water body is usually negligible and even beneficial by controlling the water’s thermal properties, turbidity, dissolved oxygen concentrations, pH, and eventually nutrients concentrations, chlorophyll-a density and phytoplankton population growth [8,9,19,20]. Eventually, depending on how FPV projects are being implemented and the scale of the development, they may even contribute to improvements in ecosystem functioning and climate change mitigation targets [21,22]. Possible negative impacts are highly related to the environmental conditions of the project (e.g., a waterbody’s trophic status or climate conditions) and the FPV systems design and specifications (e.g., coverage size and array design) [16,23]. However, there is a knowledge uncertainty and a major research gap regarding detailed environmental impact assessments [17].
Greece’s climate conditions and high amount of solar insolation favor the advancement of renewable energy production [24,25]. In recent years, Greece has demonstrated a remarkable renewable energy penetration in the total share of the country’s electricity generation; in 2023, 19% of the country’s gross electricity production was generated from solar photovoltaic systems [26]. Few FPV projects have yet to be initiated, but these systems in inland water bodies and artificial reservoirs specifically have been identified as beneficial alternatives for electricity production in the country [25]. Recent studies report that the potential electricity production from an FPV system can outnumber the production from hydropower by only using 10% of the reservoirs’ surface area of the country and simultaneously reducing water loss due to evaporation [27,28,29]. Another study reports that a 1% surface coverage of the Greek lentic water systems with a FPV system can provide over 6% of the country’s anticipated annual electricity consumption in 2030 [30]. Nevertheless, most site-specific studies regarding FPV system construction in Greece focus on the technical characteristics and specifications of proposed projects, while the environmental impacts are neglected or only qualitatively described (e.g., [31,32,33,34]).
Here, we focus on one of the first studies for FPV development and impact assessment in artificial reservoirs in Greece. The present study aims to contribute to a better understanding of the potential impacts on water quality of a proposed FPV system designed within Greece’s largest artificial reservoir, Kremasta, in Western Greece. For this reason, a hydrodynamic and water quality model of Kremasta Lake was developed and calibrated, and the impact of the FPV panels on the water temperature, dissolved oxygen concentrations, nutrients (total nitrogen and total phosphate concentrations), and chlorophyll-a (chl-a) concentrations under the project area and in close proximity was investigated. The ultimate objective was to present a quantitative assessment of the possible consequences of the FPV project on the most important water quality parameters of the lake.

2. Materials and Methods
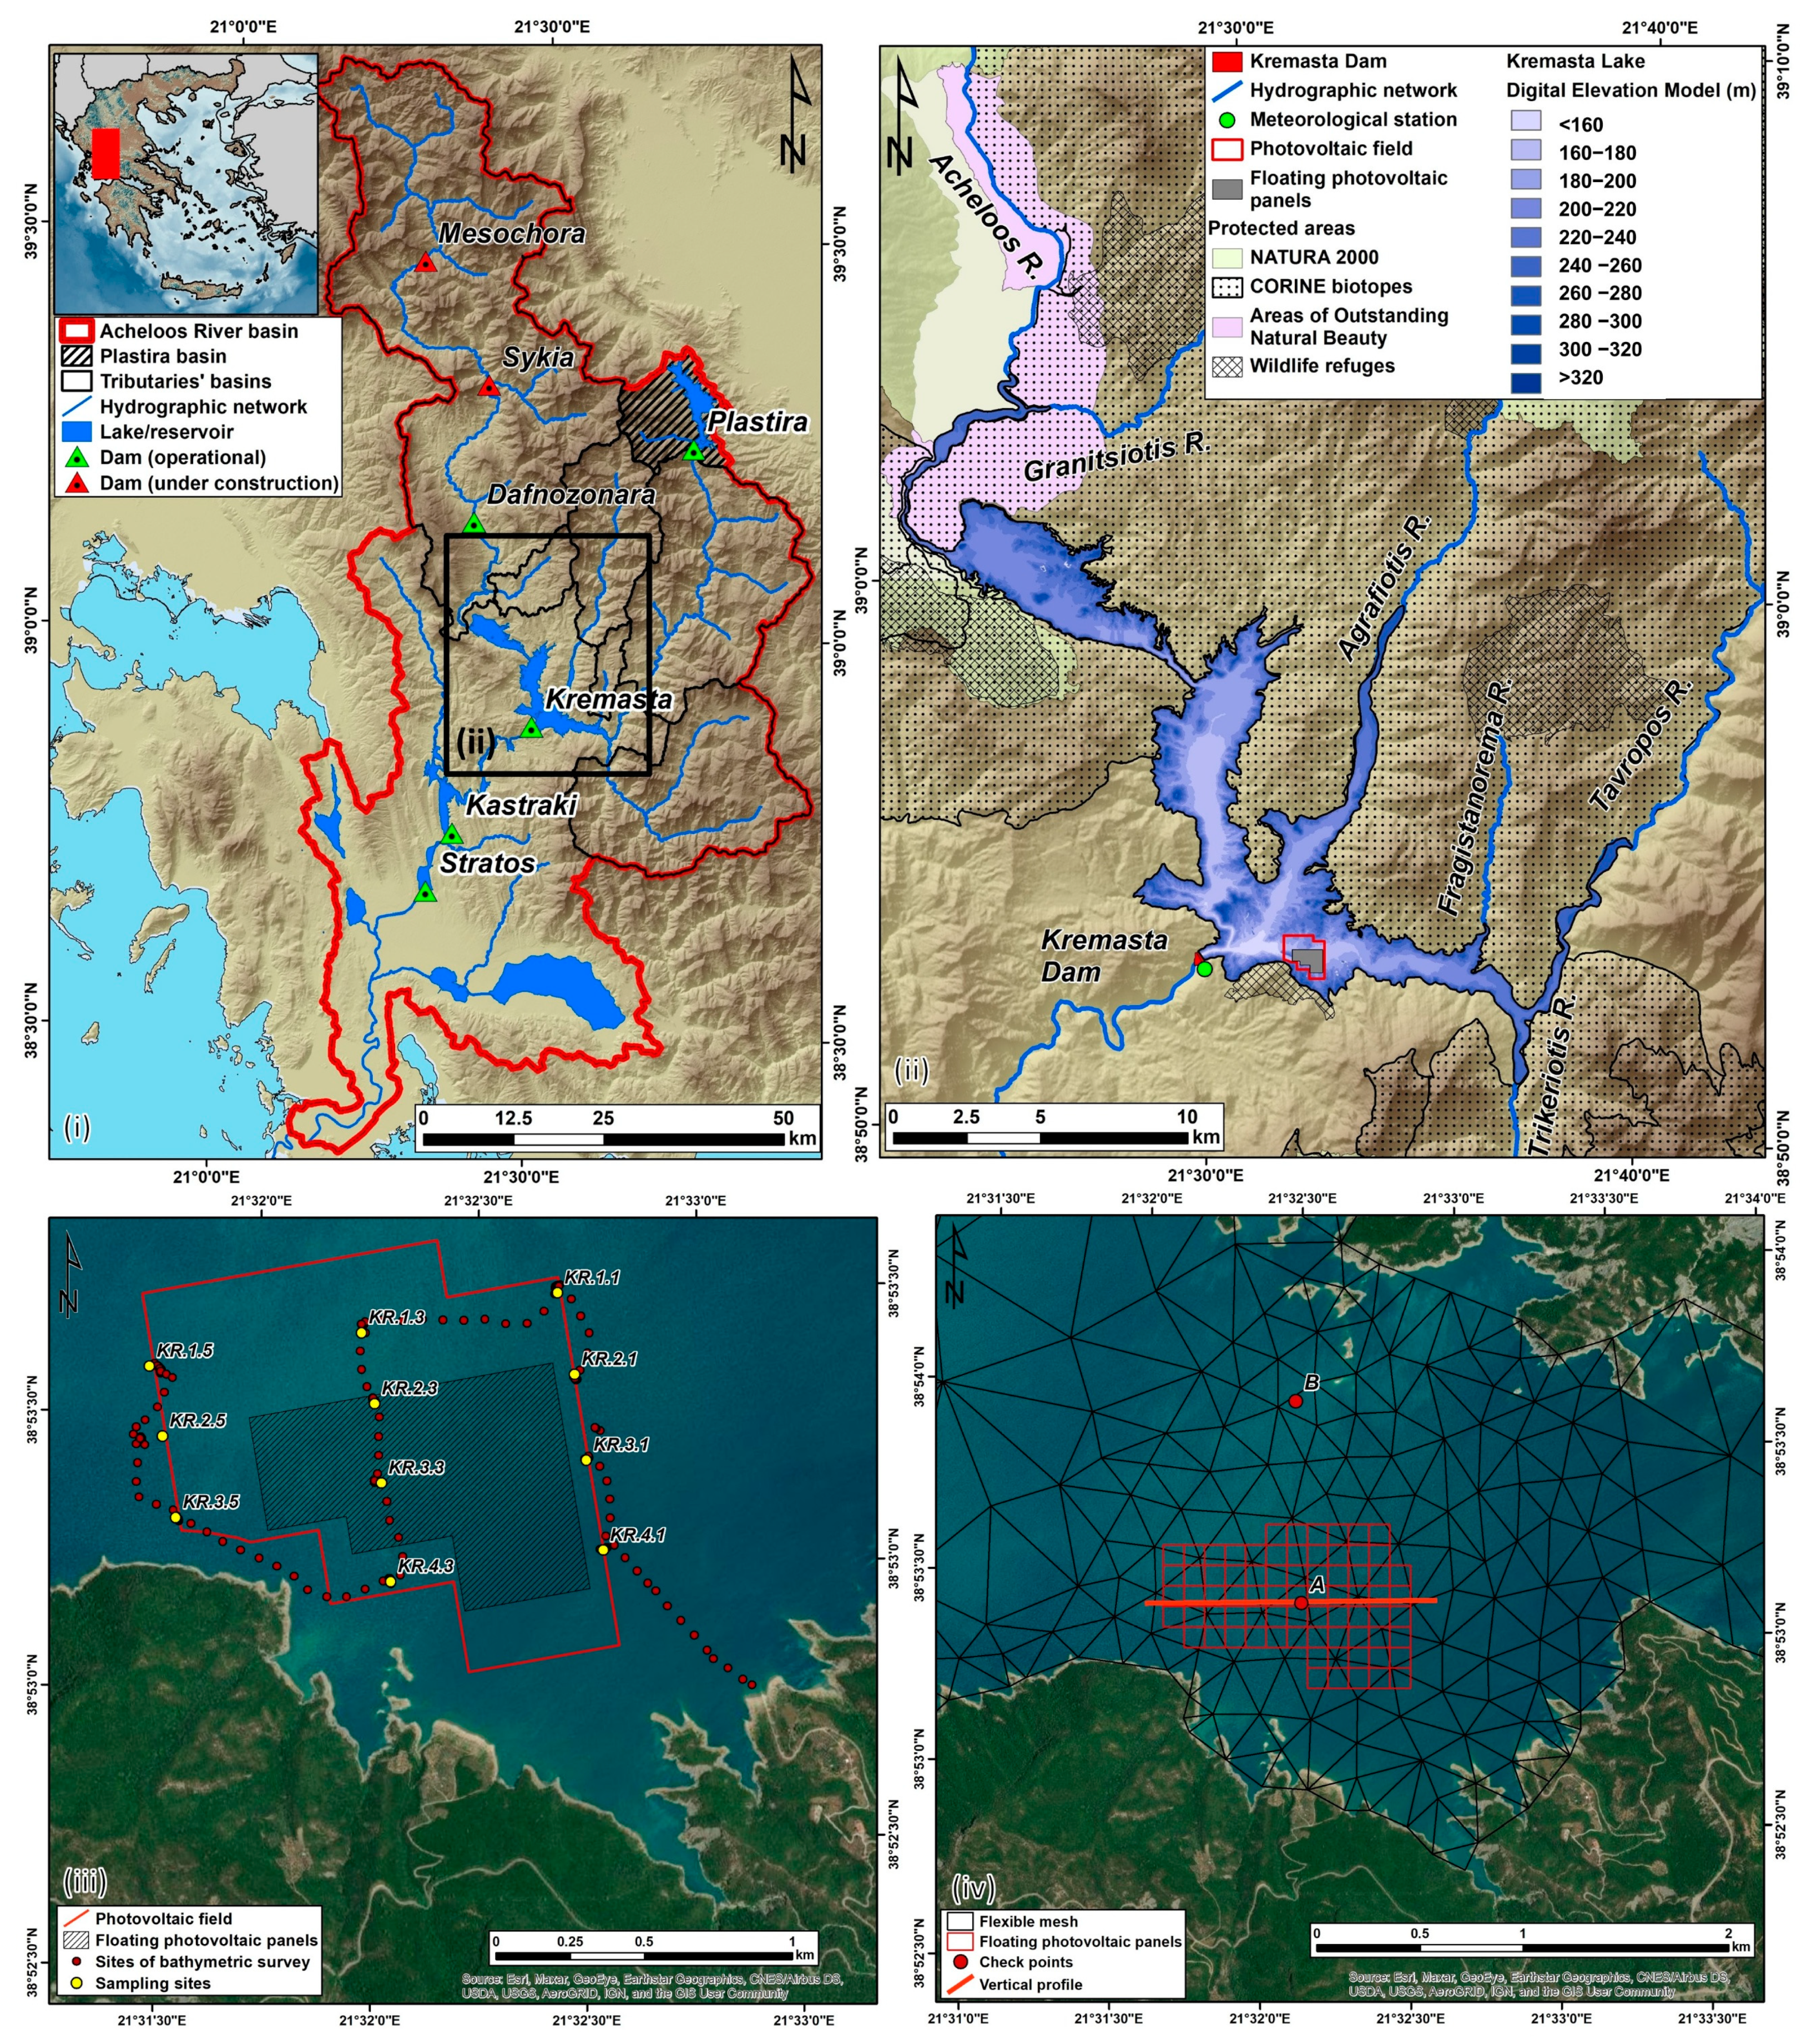
2.1. Study Area

Kremasta Lake is an artificial reservoir located in Western Greece (Figure 1i). It was formed after the construction of the homonymous dam by the Public Power Corporation SA of Greece (PPC) in the conjunction of Acheloos, Agrafiotis, Tavropos, and Trikeriotis rivers in 1966 for hydropower production as well as to meet irrigation needs and for flood control (Figure 1ii). Kremasta Lake is the largest artificial reservoir in Greece, and its maximum depth locally is up to 130 m; its mean depth has been calculated as 47 m [35]. It covers an area of 78.3 km2 when filled to the principal spillway at 282 m altitude, and the effective storage capacity of the reservoir is 3.3 × 10⁹ m3 [36]. The upstream drainage area of the dam is about 3570 km2 [37].
Kremasta dam is part of the Acheloos River hydroelectric scheme that consists of the Kremasta, Kastraki, and Stratos dams [38]. It should be noted that the water from the Plastira reservoir, constructed upstream at the Tavropos tributary of the Acheloos River, is completely diverted to the adjacent plain of Thessaly to meet irrigation and water supply needs [39]. Additionally, the Mesochora Dam, although constructed, is not operational yet, while the Sykia Dam, also on the main stem of the Acheloos, is not yet completed.
The Kremasta Lake is a monomictic reservoir, the thermal stratification of which is affected by hydroelectric power plant operation [35]. It is a cool water oligotrophic reservoir with relatively low biodiversity. This is due to the daily water level fluctuations due to hydroelectric functioning, increased siltation from cool water incoming streams and rivers, and a very steep and deep relief of the lake bed and the rocky littoral areas [40,41]. Biological productivity is low, and there is limited species diversity, low plankton biomass [35], and low invertebrate abundance in the water column and lake sediments. Sparse fish populations of eight native and seven non-native species have been recorded [42,43], while only a few species potentially benefit from the local cool water conditions. Overall, many aquatic species (aquatic fauna and water-dependent avifauna) that are often found in the other littoral and lacustrine environments of natural lakes in Western Greece are scarce or absent [41].
Around the reservoir, parts of the wider area have been included in environmental protection networks, such as NATURA 2000 (codes GR2110006 and GR2430002), CORINE biotopes (codes A00060072, A00060057, A00060055, A00060014, A00060071, and A00060054), Wildlife Refuges (codes Κ279, Κ622, Κ623, Κ301, Κ304, Κ810, and Κ907), and Areas of Outstanding Natural Beauty (codes AT2011037 and AT2011040) [41] (Figure 1ii). Due to the steep relief and prominence of the surrounding mountains rising above the lake, many of the lake’s landscapes are of remarkable aesthetic beauty. Nevertheless, the proposed FPV project site is not included in the NATURA 2000 network or the national inventory of protected areas, as defined in the relevant national legislation [44]. Based on Greek national legislation, FPV stations up to 80 MW capacity are allowed in conservation reservoirs and artificial lakes that are not located within NATURA 2000 sites and that have not been constructed to meet water supply needs or in reservoirs and artificial waterbodies constructed in inactive mining holdings [45].
The FPV system under study at Kremasta Lake is located in the southern part of the reservoir. Based on the environmental impact assessment study, the FPV panels and field are expected to cover 0.9% and 2.5% of the total reservoir area, respectively, and are not located in protected areas [46].

2.2. Hydrodynamic and Water Quality Model

2.2.1. MIKE 3 FM

Modeling tools have been used by researchers in order to understand the impact of FPV systems on water quality [47]. The model used in the present study was the MIKE 3 FM (Flexible Mesh) HD (Hydrodynamic Module) in three dimensions (3D), developed by the Danish Hydraulic Institute Water and Environment—DHI Water and Environment. The MIKE 3 FM model is based on the numerical solution of the three-dimensional incompressible Reynolds-averaged Navier–Stokes equations and has been successfully applied in many lakes, bays, and reservoirs hydrodynamic circulation studies. Additionally, MIKE 3 FM provides the necessary tools for flexible mesh generation, allowing the user to incorporate detailed bathymetric information into the model [48]. Finally, the hydrodynamic module coupled to the ecological module (ECO Lab) can be used for the simulation of the environmental phenomena of these systems [49].
The most important parameters of the hydrodynamic model were the flexible mesh–bathymetry, the time-step interval, the initial conditions (the water level and water temperature), the inflow sources, and the climatological data (the precipitation rate, air temperature, relative humidity, and wind speed and direction). The main calibration factors were bed resistance, the wind friction coefficients, the horizontal and vertical eddy viscosities, and the horizontal and vertical dispersions. The horizontal and vertical Eddy viscosities were specified using the Smagorinsky formulation [50]. The density was assumed to be a function of the temperature. After the calibration of the hydrodynamic model of Kremasta Lake, the ecological model was set up and calibrated using the template, Eutrophication Model 1, which is integrated into the advection–dispersion module and can be used in environmental impact assessment studies in aquatic systems [51]. The specific template was used for the simulation of the concentration of dissolved oxygen, nutrients (total nitrogen and total phosphate), and chlorophyll-a (chl-a). The most important parameters of the ecological model were the initial concentrations of the parameters, the inflow concentration sources, and the update frequency. The main calibration factors were the horizontal and vertical dispersion coefficients and the initial concentrations. The Euler integration method was used for the coupled ordinary differential equations. Finally, apart from the other climatological data used in the hydrodynamic model, in the water quality model, solar radiation must also be determined.

2.2.2. Flexible Mesh Generation

Information regarding the bathymetry of Kremasta Lake was retrieved from the 7 × 7 m digital elevation model (DEM) of the area before the dam’s construction in 1966. The aerial survey was conducted before 1963 by the Hellenic Military Geographical Service, during which the orthophotos of 1:45,000 or 1:30,000 scale were captured, and topographic diagrams of 1:5000 scale were produced. The digitalization was performed by the PPC, and the final DEM was processed by the National Technical University of Athens in the ‘00 [37,52]. It should be noted that the current lake’s topography may locally differ from the one produced through this procedure due to sedimentation [37]. Nevertheless, the DEM’s accuracy is considered to be sufficient for the needs of the current study. Additionally, a detailed bathymetric study at the area of the FPV system’s possible construction site was specifically conducted during the present study by the scientific personnel of the Hellenic Centre for Marine Research (HCMR) in November 2023 (Figure 1iii).
The use of an accurate, flexible mesh is essential for the set up of a stable and reliable hydrodynamic model [48]. Several modifications of the primary mesh (Figure 2i) were necessary so as to achieve accurate results and a short simulation time. The mesh resolution was decreased except in the area of the FPV system, where the resolution was locally increased, using the results of the bathymetric study conducted so as to increase the precision in the specific area of interest and decrease the simulation time. The shoreline of the lake was considered to be the boundary of the mesh (land boundary) at 282 m (the elevation of the principal spillway-maximum area of the lake). Due to the extremely complicated morphology of the laced shoreline, some smoothing was necessary so as to reduce the model’s instabilities. The final mesh produced is presented in Figure 2ii. Finally, the vertical discretization was specified using the sigma domain with 10 layers and equidistant distribution (Figure 2iii).

2.2.3. Input Data

Daily climatological data (precipitation, air temperature, relative humidity, wind speed, and wind direction) were retrieved from the Kremasta telemetric meteorological station (owner PPC, latitude: 38.8853°; longitude: 21.4973°; altitude: 305 m). Evaporation from Kremasta Lake was calculated based on the Penman equation [53]. Due to the lack of sunshine hour measurements, solar radiation was calculated based on the empirical equation using air temperature, proposed by Hargreaves and Samani [54,55].
Information regarding the Kremasta Dam’s operation (the monthly total inflows to the reservoir, the monthly water volume used for hydropower production and irrigation needs, the monthly water volume that overspills, and the daily water level of the reservoir) was provided by PPC. Overall, four inflow sources were defined for each of the rivers discharging into the reservoir (Acheloos/Granitsiotis, Agrafiotis, Frangistanorema, and Tavropos/Krikeliotis). The total inflows to the reservoir were distributed per tributary based on the upstream area of each one in relation to the total upstream drainage area of the dam (Figure 1i). Finally, information regarding the water temperature of the inflows was retrieved from the telemetric station of Mesochora (owner HCRM-IMBRIW, latitude: 39.3843°; longitude: 21.2728°; altitude: 533 m), the only available source of high-quality and high-resolution time series for the water temperature of Acheloos River.
Based on the total data available, the model was set up and calibrated for the period from 1 January to 31 December 2023. The time step was 300 s so as to prevent the model’s instabilities and errors. The initial water level conditions of the lake (the surface elevation of the water column at the beginning of the simulation) were set to 263.4 m, as reported by PPC on 1 January 2023. The initial conditions of the water temperature were retrieved from previous runs of the model.
Due to the fact that the time step of the available inflows to the reservoir was monthly, the calibration of the hydrodynamic model was achieved by the trial-and-error approach between the monthly predicted and observed water levels of the lake. The water temperature was calibrated based on the results of the sampling campaign conducted in the area on 15 November 2023. More specifically, vertical temperature profiles from an 11-point grid were acquired using the multiparameter probe Aqua TROLL 400 (In-Situ©) (Figure 1iv). The water quality model was calibrated against in situ vertical dissolved oxygen profile concentrations and surface total nitrogen, total phosphate, and chlorophyll-a concentrations at the same 11-point grid.
The model’s performance was evaluated using the most common statistical metrics (mean absolute error—MAE; correlation coefficient—R; coefficient of determination—R2; Nash–Sutcliffe coefficient—NSE [56]; Kling–Gupta Efficiency—KGE [57]; root mean square error—RMSE; percent bias—PBIAS) and the criteria proposed by Moriasi et al. [58] concerning R2, NSE, and PBIAS, and Knoben et al. [59] concerning KGE.

2.2.4. Investigation of the FPV Impact on Kremasta Lake

For the investigation of the potential impact of the construction of FPV panels on the water quality of Kremasta Lake, the calibrated hydrodynamic and water quality model of the reservoir was employed. In the predefined structures already incorporated in MIKE 3 FM, FPV panels or similar structures are not included. Therefore, the impact of the FPV panels on the reservoir’s water quality was investigated by employing the ice coverage module after modifications. More specifically, the simulation was based on the assumption that under the FPV panels, solar radiation and wind do not affect the water surface, likewise in the case of ice coverage, but also that there is no explicit effect of the low temperature of the ice on the heat exchange module. An ice thickness of 0.5 m was used to emulate the effect of the FPV panels on the reservoir’s water level and hydrodynamic conditions locally. Furthermore, the Eutrophication Model 1 template was modified accordingly to ensure the nullification of the effect of solar radiation on the biological processes under the area of the FPV panels’ ice coverage.
The impact of the FPV panels construction on Kremasta Lake’s water quality was assessed in two sites: one under the panels (checkpoint A) and one in close proximity to the panels (checkpoint B), along a 1350 m vertical profile with an east–west orientation at the area of the FPV panels (Figure 1iv). A similar procedure using reference points under the panel area and open water conditions to investigate the impact of the FPV panels on the water quality of surface waterbodies has been commonly used in similar studies (e.g., [60,61,62]).

3. Results

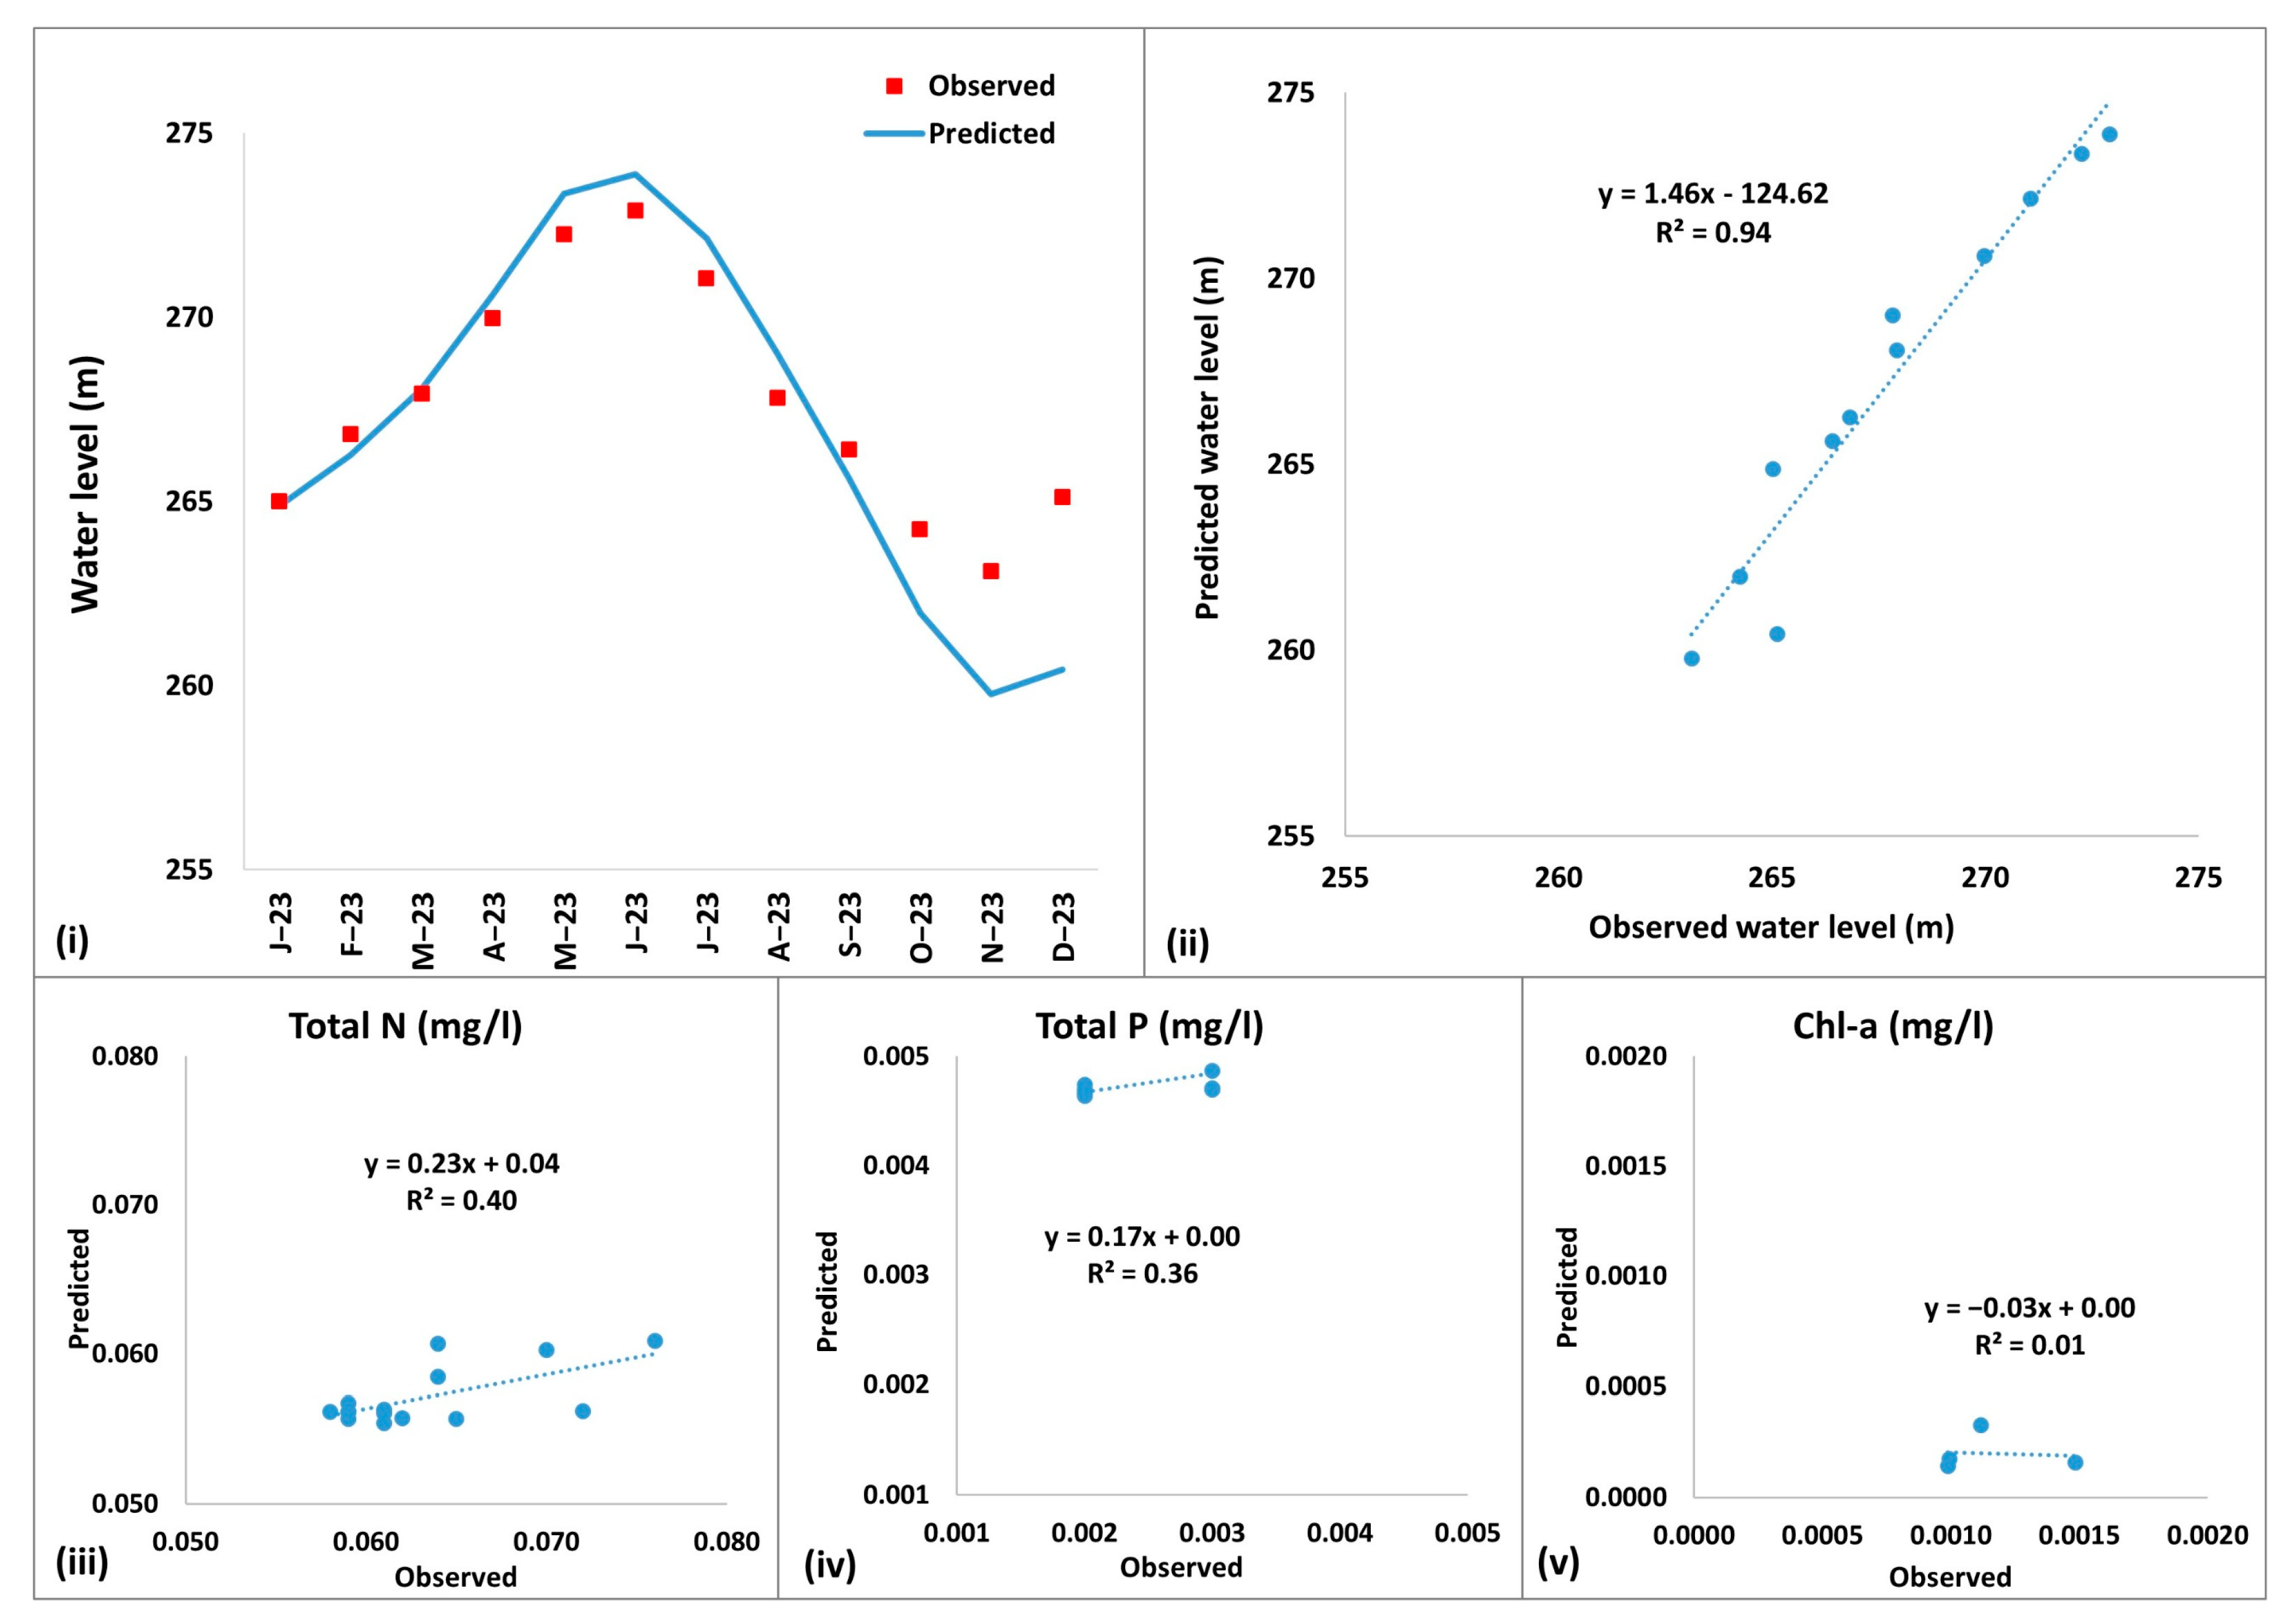
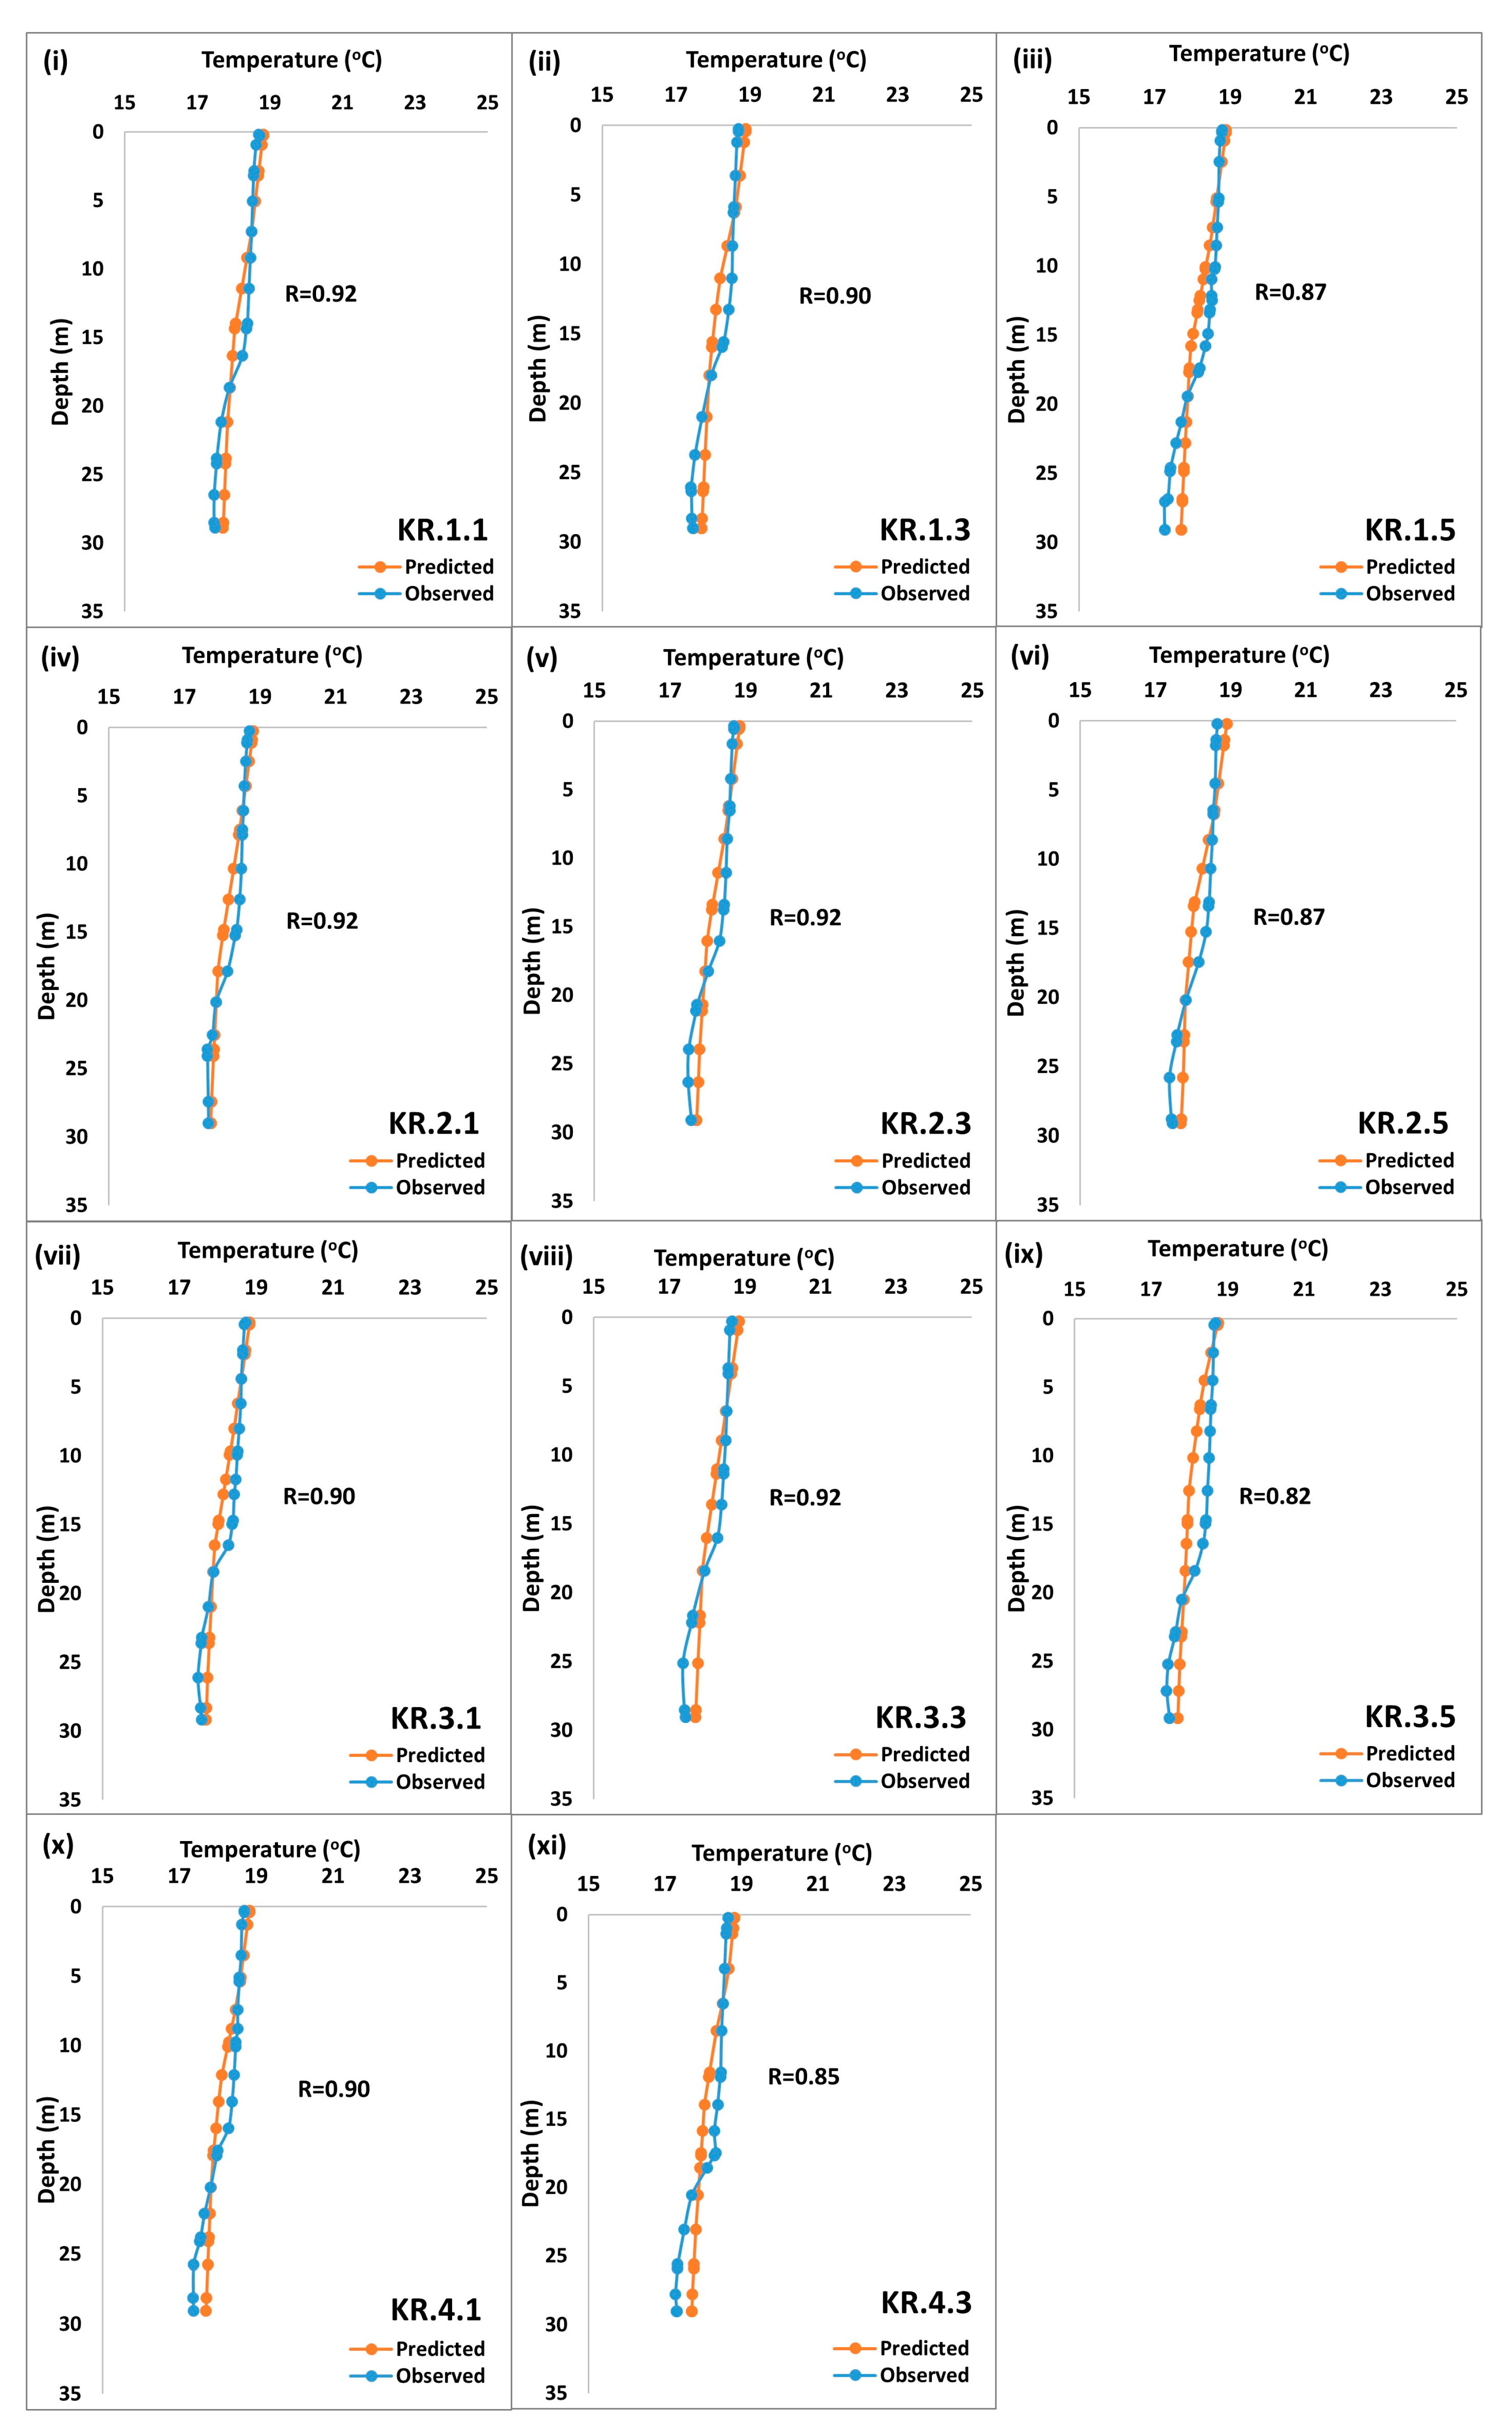
3.1. Hydrodynamic and Water Quality Model

The results of the hydrodynamic model set up for the period 01–12/2023 indicate that there was a very good agreement between the observed and the simulated reservoir’s water level values (Table 1 and Figure 3i,ii). The correlation coefficient R was calculated to be 0.97 and can be characterized as very high [63], indicating the sufficient performance of the hydrodynamic model. The result was statistically significant at p < 0.01. Based on the criteria proposed by Moriasi et al. [58], the model can be characterized as very good regarding the coefficient of determination (R2) (higher than 0.85) and the percent bias (PBIAS) (lower than ±5%) and satisfactory regarding the Nash–Sutcliffe coefficient (NSE) (higher than 0.50). The Kling–Gupta efficiency (KGE) was higher than 0.30, and therefore, the simulation can be considered behavioral [59]. It should be noted that the model slightly underestimated the reservoir’s water levels in October, November, and December.
Regarding the water temperature, the model managed to predict the vertical variations in the sampling points successfully (Table 1 and Figure 4). The correlation coefficient R was calculated to be higher than 0.80 in all cases and even higher than 0.90 in seven sampling points and can be characterized as very high to high [63]. In all cases, the result was statistically significant at p < 0.01. The R2 was higher than 0.75, the NSE was higher than 0.70, and the PBIAS was lower than ±5%, indicating good performance of the model regarding the water temperature prediction. Only in sampling points KR.3.5 and KR.4.3 can the model performance be characterized as satisfactory since the R2 was between 0.60 and 0.75, and the NSE was between 0.50 and 0.70. In both cases, the PBIAS was lower than ±5%. The Kling–Gupta efficiency (KGE) was higher than 0.30 in all cases, and the simulation can be considered behavioral [59]. The RMSE ranged between 0.17 and 0.30, while the higher values were reported at the western part of the sampling grid. The MAE values demonstrate similar variations.
Regarding the dissolved oxygen concentrations, the model managed to predict the vertical variations in the sampling points successfully (Table 1 and Figure 5). The correlation coefficient R was calculated to be higher than 0.89 in all cases and can be characterized as very high [63]. In all cases, the result was statistically significant at p < 0.01. The model can be characterized as very good or good since the R2 was higher than 0.75 or 0.85, and the PBIAS was lower than ±5% in all cases. The NSE was higher than 0.60 in all cases except in the sampling points KR.1.5, KR.2.5, and KR.3.5, in which case, the NSE was about 0.50, indicating satisfactory performance of the model. The Kling–Gupta efficiency (KGE) was higher than 0.30 in all cases, and again, the simulation can be considered behavioral [59]. It should be noted that in all cases, the model’s performance regarding dissolved oxygen concentrations was weaker in higher reservoir depths.
The comparison between the predicted and observed total N and total P concentrations indicated a satisfactory performance of the water quality model. The R between the predicted and observed total N and total P concentrations was 0.64 and 0.60, respectively. Nevertheless, the model underestimated the total N and total P concentrations at a rate of 0.006 mg/L and 0.002 mg/L, respectively (Figure 3iii,iv). The Chl-a concentrations were underestimated at a rate of 0.0009 mg/L (Figure 3v).

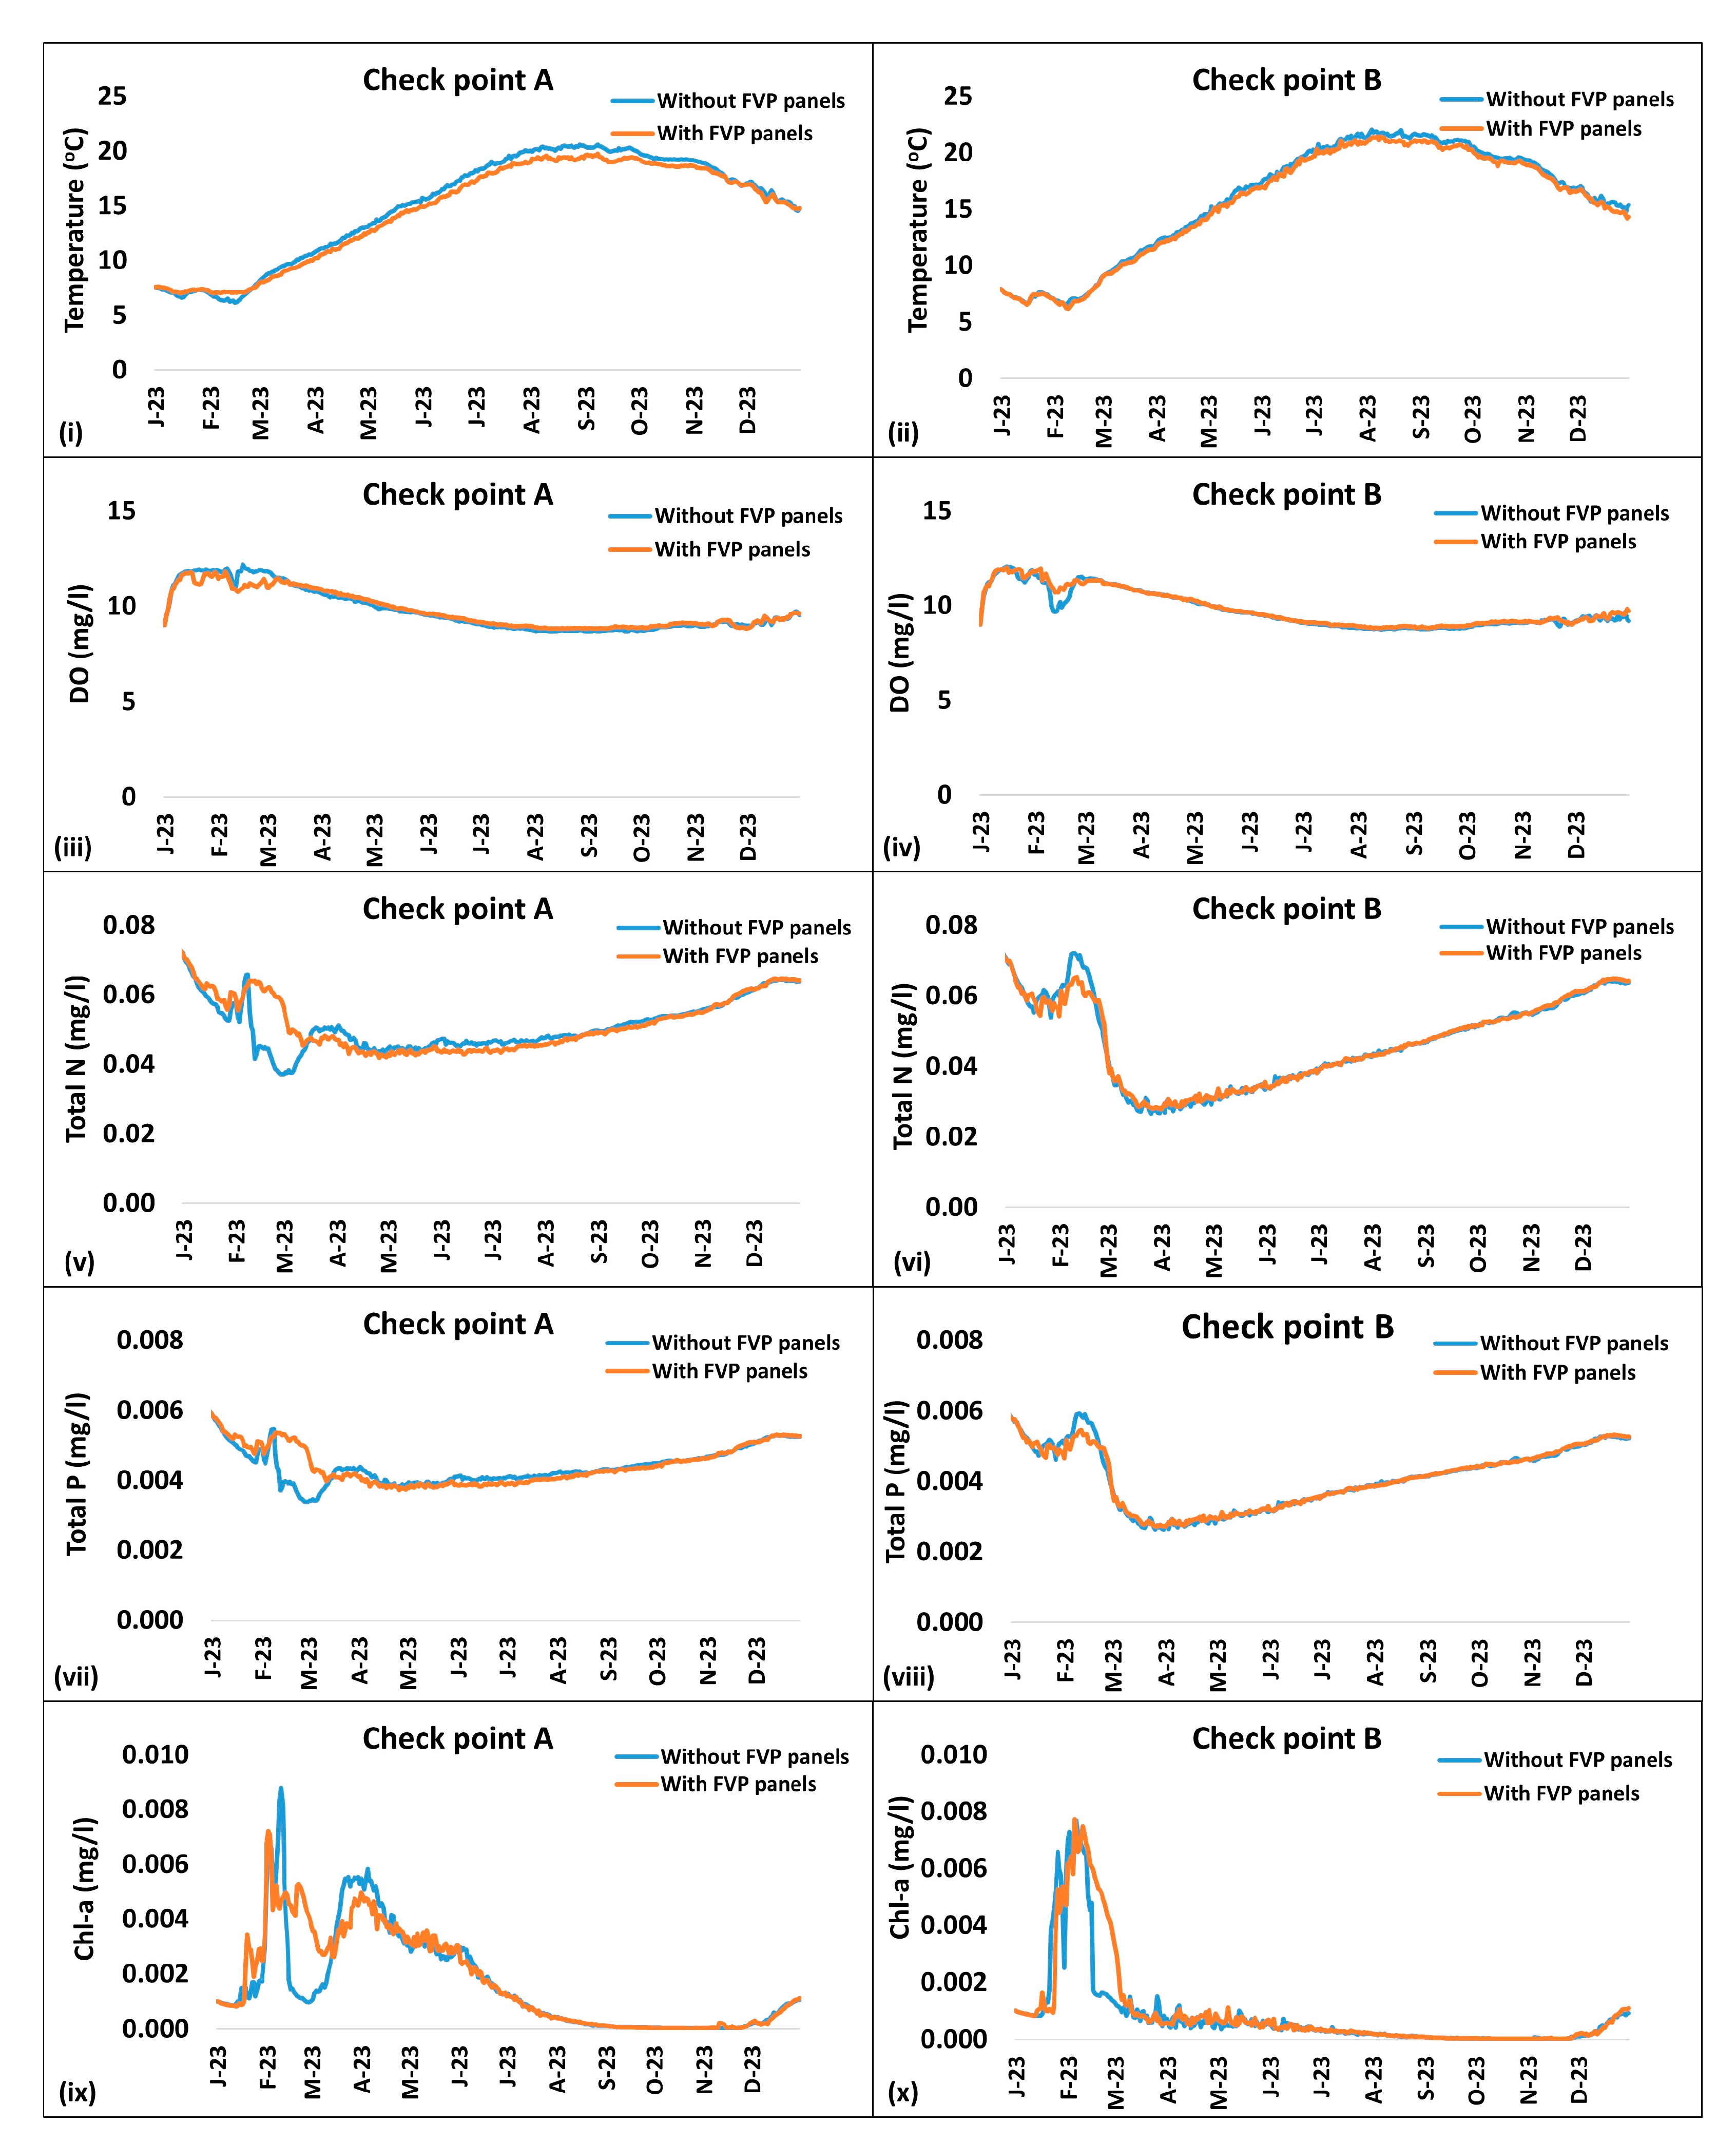
3.2. Impact of FPV System on Kremasta Lake’s Water Quality

The results showed that the FPV panels’ construction would lead to a small decrease in water temperature at the locality of the project area. The average annual temperature decreased from 15.0 °C to 14.5 °C at checkpoint A (−3.2%) and from 15.9 °C to 15.6 °C at checkpoint B (−2.2%) after panel construction. A maximum surface water temperature decrease was recorded in checkpoint A in late August (about 1.2 °C). Temperature decreases would be gradually eliminated as the distance from the panels increased; indicatively, the maximum water temperature decrease at checkpoint B was 1.0 °C in summer (Figure 6i,ii and Figure S1). The reservoir’s thermocline was evident, especially during summer, and although the water temperature decreased with increased depth, in some cases, small temperature anomalies were observed (e.g., in February). The impact of the FPV panel construction was more profound in low depths but was eliminated in higher depths (Figure S1).
Regarding DO, the FPV panels’ construction would lead to the concentration decreasing at the area in close proximity to the project in February and March (checkpoint A in the reservoir surface—maximum decrease in 15/02: 1.2 mg/L) (Figure 6iii,iv). The DO concentration did not alter significantly for the rest of the year (maximum increase recorded: 0.4 mg/L). At checkpoint B, further away from the panels, a small surface DO concentration increase was recorded only in February (1.2 mg/L), while the DO concentration changes were negligible for the rest of the year (Figure S3). It should be noted that the average annual DO concentration at the checkpoints practically did not change in the case of the panel construction (9.77 mg/L to 9.78 at checkpoint A, 0.2% increase; 9.75 mg/L to 9.83 mg/L at checkpoint B, 0.8% increase). Likewise, the vertical changes in the DO concentrations can be considered negligible (Figure S4).
The average annual total N concentration at the reservoir’s surface is predicted not to change significantly despite the FPV panels’ construction. The average annual total N concentration is predicted to increase after the panel construction from 0.051 mg/L to 0.052 mg/L (+1.3%) at checkpoint A and to remain the same at checkpoint B (0.047 mg/L). At checkpoint A in the area of the project, the total N concentration increased in February and March (maximum increase of 0.022 mg/L) and then gradually decreased until mid-October (maximum decrease of 0.005 mg/L). At checkpoint B, the total N concentration decreased in February and March and reached 0.009 mg/L, while concentration changes were negligible for the rest of the year (Figure 6v,vi and Figure S5. Based on the vertical profiles, the impact of the possible FPV panels’ construction on the total N concentration is limited at the upper part of the reservoir and can be considered negligible (Figure S6).
Likewise, the average annual total P concentration at the reservoir’s surface did not change significantly despite the FPV panels’ construction. The average annual total P concentration increased from 0.00437 mg/L to 0.00443 at checkpoint A (+1.2%) after panel construction and remained the same at checkpoint B (0.0041 mg/L). At checkpoint A, the total P concentration slightly increased in February and March (maximum value 0.002 mg/L in February). The total P concentration gradually decreased, especially in April and during the summer. At checkpoint B, the total P concentration decreased in February (0.0006 mg/L) and remained practically unchanged for the rest of the year (Figure 6vii,viii and Figure S7). Based on the vertical profiles, the impact of the FPV panels’ construction on the total P concentration was limited at the upper part of the reservoir and can be considered negligible (Figure S8).
Finally, the impact on the chl-a concentration is expected to be negligible since the average annual chl-a concentration at the reservoir’s surface did not change significantly despite the FPV panels’ construction. The average annual chl-a concentration increased from 0.0016 mg/L to 0.0017 mg/L at checkpoint A after the FPV panels’ construction (+7.1%) and from 0.0008 mg/L to 0.0009 mg/L at checkpoint B (+15.0%). At checkpoint A, in the area of the FPV panels, the chl-a concentration increased in late January and March (a maximum increase of 0.004 mg/L) and decreased in late February and April (a maximum decrease of 0.004 mg/L). At checkpoint B, the chl-a concentration did not change significantly, except in March. In both checkpoints, the concentration fluctuations decreased (Figure 6ix,x and Figure S9). Likewise, the impact of the possible FPV panels’ construction regarding the chl-a concentration is expected to be extremely limited at the upper part of the reservoir (Figure S10). Finally, high values of algal biomass in February and a subsequent sharp decrease in March were reported. In monomictic lakes, such as Lake Kremasta, which mix once a year, warmer temperatures during stratified periods can lead to increased algal biomass, especially if the nutrient levels are sufficient. In our case, in mid-February, the surface water temperature increased substantially, which may explain this increase in biomass. However, in March, there was a small decline in water temperature, which explains the abrupt decrease in algal biomass.

4. Discussion

The present study aimed to provide insights into the potential impacts of an FPV system construction on the water quality (water temperature, dissolved oxygen concentrations, total nitrogen, total phosphate, and chl-a concentrations) of a heavily modified lentic water system in Greece. For this purpose, the hydrodynamic and water quality simulation of Kremasta Lake, a deep oligotrophic reservoir, was performed. Under this scope, the MIKE 3 FM HD model and Ecolab module (Eutrophication Model 1, Basic template by DHI after modifications) were employed. Based on the data available, the model was set up and calibrated for the period 1 January–31 December 2023 against in situ measurements with satisfactory results. The hydrodynamic model demonstrated strong performance in simulating the water level and vertical temperature profiles. Likewise, the water quality model reliably predicted vertical variations in dissolved oxygen, as well as surface concentrations of total nitrogen, total phosphate, and chlorophyll-a. The model managed to predict water temperature values and dissolved oxygen concentrations more efficiently at the central part of the sampling grid. This can be attributed to the heterogeneous and steep morphological relief near the shoreline, which apparently was not possible to incorporate into the model with absolute success. It should be noted that due to the deep water oligotrophic status of Kremasta Lake, the simulation of the water quality of the reservoir was challenging since diel oscillations of the water quality parameters are relatively small [64]. Finally, some uncertainty has risen due to the fact that the calibration of the model was based on a single monitoring campaign, and therefore, the possible thermal stratification cycle and seasonal variations in the water quality parameters may not have been captured.
The results of this study showed that the impact of the construction of FPV panels on the water quality of Kremasta Lake is expected to be insignificant. These impacts can be considered negligible, especially with regard to the oligotrophic status of the lake, the relatively low biodiversity, and the biological productivity of this water body [41]. All parameters examined demonstrated similar behavior. Changes in the water quality parameters were observed only locally in the area of the panels’ construction and were gradually eliminated towards the shoreline. Likewise, the panels’ impact was limited to the first few meters of water depth and was eliminated onwards. The average annual concentrations of dissolved oxygen, chlorophyll-a, and nutrients did not vary considerably with or without the panels’ construction. The water temperature slightly decreased in the area affected (with a 3.2% decrease in the area under the panels and a 2.2% decrease in close proximity). A small decrease in dissolved oxygen concentration was observed in February and March (with a maximum decrease of 1.2 mg/L) and practically remained the same after the panels’ construction. Chlorophyll-a concentrations slightly increased, and variations decreased in the case of the panels’ construction. Finally, a small seasonal nutrient concentration variation increase was reported in the case of the panels’ construction; their average annual values practically remained the same. It should be noted that the analysis conducted under the present study did not include all the biological elements of the ecosystem, such as phytoplankton and aquatic vegetation—a simulation of which could be performed after the completion of the necessary in situ measurements.
Kremasta Lake is the largest artificial reservoir in Greece, and being a deep oligotrophic system, it has some distinctive features. The FPV project under consideration is planned to occupy about 2.5% of the reservoir’s surface. Recent studies confirm that the impact of FPV systems on reservoirs is relative to the size of the coverage and dependent on the siting array location [21]. Small surface coverage of this rate is expected to cause minimum impacts on the waterbody; this result is in agreement with a study that reported that a 2% surface occupancy causes minimum changes to the thermal characteristics of a lake [62]. Likewise, another research initiative verified that inland waterbodies could benefit when an optimum coverage percentage is applied by minimizing evaporation rates and maximizing power production while meeting water quality standards [65]. Similar studies support the findings of the present effort and also conclude that the impact of the FPV project on lakes’ and reservoirs’ water quality can be minimal or unnoticed [61,66], although special care should be exercised when comparing different systems [18]. Taking into account the findings of the present study and based on the conclusions of similar projects [62,65], a small increase in the FPV panels’ coverage is not expected to impact the water quality of the reservoir considerably. Nevertheless, a potential increase in the FPV panels’ coverage should always follow the national legislation limitations regarding the total power station’s capacity [45] and possible landscape degradation.
The revised National Energy and Climate Plans (NECP) of Greece highlight the importance of a reduction in energy production costs toward the green energy transition. The target is that by 2050, 88% of the primary energy supply will be produced by renewable resources and 49% from photovoltaic power plants, in particular [67]. Additionally, based on NECP, FPV projects are among the innovative technologies that should be developed so as to meet the environmental targets that have been set [67]. Especially under the threat of agricultural land loss under the recent rapid terrestrial photovoltaic solar energy developments [68], FPV systems may provide a viable alternative for the electricity production of the country. Nevertheless, the environmental impact assessment of proposed FPV systems on Greek waterbodies has only recently been implemented, and there is still little local experience.
Very often, local communities oppose such projects, focusing on the aesthetic and tourism impacts, while stakeholders, scientists, and contractors fail to communicate the possible environmental and social benefits. Due to a history of poor planning, including the sprawling development of other alternative energy projects (e.g., wind farms) within many sensitive landscapes and protected areas, there is often potential for societal conflicts, as outstanding cultural ecosystem services may be at stake [11]. A lack of relative supporting policies and development roadmaps only hampers the implementation of low-impact projects, such as proposed FPVs in artificial waterbodies, even away from protected areas. Under this scope, a close collaboration between stakeholders and scientists is essential for a better understanding of the potential environmental and socio-economic impacts of this technology [23].

5. Conclusions

The recent energy crisis has highlighted the urgent need for alternative and efficient energy production solutions. This study provides an analysis of potential water quality impacts in a proposed floating photovoltaic (FPV) project at an artificial reservoir in Greece, where conditions favor the development. FPV projects, when carefully sited and implemented, can have effective technical benefits and negligible environmental impacts. In Greece, where land availability is limited and alternative energy projects have often sparked societal conflict in sensitive landscapes, FPV systems may present an attractive alternative. Nevertheless, although existing evidence suggests that FPV systems have minimal impact on water quality at the proposed scale of development, data on their long-term effects and potential aesthetic landscape degradation remain unavailable. Therefore, the implementation of a monitoring program before and after FPV panel construction is necessary in order to verify the scientific results and to identify possible additional impacts so as to adapt the necessary interventions. Finally, such projects cannot be implemented without the public’s support. Therefore, collaboration among stakeholders, governmental authorities, and the local community is essential.

Supplementary Materials

The following supporting information can be downloaded at: https://www.mdpi.com/article/10.3390/hydrology12040092/s1, Figure S1: Surface water temperature (°C) difference per month, with and without the FVP panels’ construction (negative value: decrease); Figure S2: Vertical water temperature vertical profiles per month, without and with PFV panels; Figure S3: Surface dissolved oxygen (DO) concentrations (mg/L) difference per month, with and without the FVP panels’ construction (negative value: decrease); Figure S4: Vertical dissolved oxygen (DO) concentrations (mg/L) vertical profiles per month, without and with PFV panels; Figure S5: Total nitrogen concentrations (mg/L) difference per month, with and without the FVP panels’ construction (negative value: decrease); Figure S6: Total nitrogen concentrations (mg/L) vertical profiles per month, without and with PFV panels; Figure S7: Total phosphate concentrations (mg/L) difference per month, with and without the FVP panels’ construction (negative value: decrease); Figure S8: Total phosphate concentrations (mg/L) vertical profiles per month, without and with PFV panels; Figure S9: Chlorophyll-a concentrations (mg/L) difference per month, with and without the FVP panels’ construction (negative value: decrease); Figure S10: Chlorophyll-a concentrations (mg/L) vertical profiles per month, without and with PFV panels.

Author Contributions

Conceptualization, A.M., E.D. and I.K.; Formal analysis, A.M. and I.K.; Funding acquisition, S.Z.; Investigation, S.Z.; Methodology, A.M., E.D. and I.K.; Project administration, E.D. and S.Z.; Supervision, E.D. and S.Z.; Validation, A.M.; Visualization, A.M. and E.D.; Writing—original draft, A.M. and S.Z.; Writing—review and editing, I.K. All authors have read and agreed to the published version of the manuscript.

Funding

This research was conducted under the research program “Environmental Impact Assessment Study of the Project Floating PV Project at Kremasta II with the capacity of 115.87968 MW” funded by “ILIAKO POWER VIΙΙ SINGLE MEMBER PC”.

Data Availability Statement

Data are subject to third-party restrictions.

Acknowledgments

The authors gratefully acknowledge support from Elias Moussoulis and the staff personnel from DHI for the Eutrophication Model 1, Basic template modification. Photene Tsafou assisted in the original environmental impact study in 2024, Dimitris Zogaris assisted with field biological sampling, and Sofia Laschou and Evangelia Smeti provided important support to the study’s associated lab work.

Conflicts of Interest

The funders had no role in the design of the study, in the collection, analyses, or interpretation of the data, in the writing of the manuscript, or in the decision to publish the results.

References

  1. Dhakal, S.; Minx, J.C.; Toth, F.L.; Abdel-Aziz, A.; Figueroa Meza, M.J.; Hubacek, K.; Jonckheere, I.G.C.; Yong-Gun, K.; Nemet, G.F.; Pachauri, S.; et al. Emissions Trends and Drivers. In Climate Change 2022: Mitigation of Climate Change. Contribution of Working Group III to the Sixth Assessment Report of the Intergovernmental Panel on Climate Change; Shukla, P.R., Skea, J., Slade, R., Al Khourdajie, A., van Diemen, R., McCollum, D., Pathak, M., Some, S., Vyas, R., Fradera, R., et al., Eds.; Cambridge University Press: Cambridge, UK; New York, NY, USA, 2022; pp. 215–294. ISBN 978-1-009-15793-3. [Google Scholar]
  2. Suman, A. Role of Renewable Energy Technologies in Climate Change Adaptation and Mitigation: A Brief Review from Nepal. Renew. Sustain. Energy Rev. 2021, 151, 111524. [Google Scholar] [CrossRef]
  3. Bölük, G.; Mert, M. Fossil & Renewable Energy Consumption, GHGs (Greenhouse Gases) and Economic Growth: Evidence from a Panel of EU (European Union) Countries. Energy 2014, 74, 439–446. [Google Scholar] [CrossRef]
  4. Clarke, L.; Wei, Y.-M.; De La Vega Navarro, A.; Garg, A.; Hahmann, A.N.; Khennas, S.; Azevedo, I.M.L.; Löschel, A.; Singh, A.K.; Steg, L.; et al. Energy Systems. In Climate Change 2022: Mitigation of Climate Change. Contribution of Working Group III to the Sixth Assessment Report of the Intergovernmental Panel on Climate Change; Shukla, P.R., Skea, J., Slade, R., Al Khourdajie, A., van Diemen, R., McCollum, D., Pathak, M., Some, S., Vyas, P., Fradera, R., et al., Eds.; Cambridge University Press: Cambridge, UK; New York, NY, USA, 2022; pp. 613–746. ISBN 978-1-009-15793-3. [Google Scholar]
  5. Sahu, A.; Yadav, N.; Sudhakar, K. Floating Photovoltaic Power Plant: A Review. Renew. Sustain. Energy Rev. 2016, 66, 815–824. [Google Scholar] [CrossRef]
  6. Farfan, J.; Breyer, C. Combining Floating Solar Photovoltaic Power Plants and Hydropower Reservoirs: A Virtual Battery of Great Global Potential. Energy Procedia 2018, 155, 403–411. [Google Scholar] [CrossRef]
  7. Pouran, H.; Padilha, M.; Lopes, C.; Nogueira, T.; Alves, D.; Branco, C.; Sheng, Y. Environmental and Technical Impacts of Floating Photovoltaic Plants as an Emerging Clean Energy Technology. iScience 2022, 25, 105253. [Google Scholar] [CrossRef]
  8. Rosa-Clot, M.; Tina, G.M. Floating Plants and Environmental Aspects. In Submerged and Floating Photovoltaic Systems; Elsevier: Amsterdam, The Netherlands, 2018; pp. 185–212. [Google Scholar]
  9. Kumar, M.; Mohammed Niyaz, H.; Gupta, R. Challenges and Opportunities towards the Development of Floating Photovoltaic Systems. Sol. Energy Mater. Sol. Cells 2021, 233, 111408. [Google Scholar] [CrossRef]
  10. Woolway, R.; Zhao, G.; Rocha, S.; Thackeray, S.; Armstrong, A. Decarbonization Potential of Floating Solar Photovoltaics on Lakes Worldwide. Nat. Water 2024, 2, 566–576. [Google Scholar] [CrossRef]
  11. Vlami, V.; Kokkoris, I.; Zogaris, S.; Kehayias, G.; Dimopoulos, P. Cultural Ecosystem Services in the Natura 2000 Network: Introducing Proxy Indicators and Conflict Risk in Greece. Land 2021, 10, 4. [Google Scholar] [CrossRef]
  12. Ioannidis, R.; Koutsoyiannis, D. A Review of Land Use, Visibility and Public Perception of Renewable Energy in the Context of Landscape Impact. Appl. Energy 2020, 276, 115367. [Google Scholar] [CrossRef]
  13. Almeida, R.; Schmitt, R.; Grodsky, S.; Flecker, A.; Gomes, C.; Zhao, L.; Barros, N.; Kelman, R.; McIntyre, B. Floating Solar Power: Evaluate Trade-Offs. Nature 2022, 606, 246–249. [Google Scholar] [CrossRef]
  14. Lee, N.; Grunwald, U.; Rosenlieb, E.; Mirletz, H.; Aznar, A.; Spencer, R.; Cox, S. Hybrid Floating Solar Photovoltaics-Hydropower Systems: Benefits and Global Assessment of Technical Potential. Renew. Energy 2020, 162, 1415–1427. [Google Scholar] [CrossRef]
  15. Pimentel Da Silva, G.; Branco, D. Is Floating Photovoltaic Better than Conventional Photovoltaic? Assessing Environmental Impacts. Impact Assess. Proj. Apprais. 2018, 36, 390–400. [Google Scholar] [CrossRef]
  16. Nobre, R.; Boulêtreau, S.; Colas, F.; Azemar, F.; Tudesque, L.; Parthuisot, N.; Favriou, P.; Cucherousset, J. Potential Ecological Impacts of Floating Photovoltaics on Lake Biodiversity and Ecosystem Functioning. Renew. Sustain. Energy Rev. 2023, 188, 113852. [Google Scholar] [CrossRef]
  17. Essak, L.; Ghosh, A. Floating Photovoltaics: A Review. Clean Technol. 2022, 4, 752–769. [Google Scholar] [CrossRef]
  18. Bax, V.; van de Lageweg, W.; Hoosemans, R.; van den Berg, B. Floating Photovoltaic Pilot Project at the Oostvoornse Lake: Assessment of the Water Quality Effects of Three Different System Designs. Energy Rep. 2023, 9, 1415–1425. [Google Scholar] [CrossRef]
  19. Abdelal, Q. Floating PV; An Assessment of Water Quality and Evaporation Reduction in Semi-Arid Regions. Int. J. Low-Carbon Technol. 2021, 16, 732–739. [Google Scholar] [CrossRef]
  20. Exley, G.; Page, T.; Thackeray, S.; Folkard, A.; Couture, R.; Hernandez, R.; Cagle, A.; Salk, K.; Clous, L.; Whittaker, P.; et al. Floating Solar Panels on Reservoirs Impact Phytoplankton Populations: A Modelling Experiment. J. Environ. Manag. 2022, 324, 116410. [Google Scholar] [CrossRef]
  21. Exley, G.; Armstrong, A.; Page, T.; Jones, I. Floating Photovoltaics Could Mitigate Climate Change Impacts on Water Body Temperature and Stratification. Sol. Energy 2021, 219, 24–33. [Google Scholar] [CrossRef]
  22. Liu, Z.; Ma, C.; Li, X.; Deng, Z.; Tian, Z. Aquatic Environment Impacts of Floating Photovoltaic and Implications for Climate Change Challenges. J. Environ. Manag. 2023, 346, 118851. [Google Scholar] [CrossRef]
  23. Benjamins, S.; Williamson, B.; Billing, S.; Yuan, Z.; Collu, M.; Fox, C.; Hobbs, L.; Masden, E.; Cottier-Cook, E.; Wilson, B. Potential Environmental Impacts of Floating Solar Photovoltaic Systems. Renew. Sustain. Energy Rev. 2024, 199, 114463. [Google Scholar] [CrossRef]
  24. Vigkos, S.; Kosmopoulos, P.G. Photovoltaics Energy Potential in the Largest Greek Cities: Atmospheric and Urban Fabric Effects, Climatic Trends Influences and Socio-Economic Benefits. Energies 2024, 17, 3821. [Google Scholar] [CrossRef]
  25. Lytopoulos, F.; Xydis, G. Harnessing Water for Solar Power: Economic and Environmental Insights from Floating Photovoltaic Systems in Greece and in Cyprus. Energy Sources Part A Recovery Util. Environ. Eff. 2025, 47, 5654–5674. [Google Scholar] [CrossRef]
  26. REN21. Renewables 2024 Global Status Collection: Energy Supply; REN21 Secretariat: Paris, France, 2024; ISBN 978-3-948393-15-1. [Google Scholar]
  27. Kakoulaki, G.; Gonzalez Sanchez, R.; Gracia Amillo, A.; Szabo, S.; De Felice, M.; Farinosi, F.; De Felice, L.; Bisselink, B.; Seliger, R.; Kougias, I.; et al. Benefits of Pairing Floating Solar Photovoltaics with Hydropower Reservoirs in Europe. Renew. Sustain. Energy Rev. 2023, 171, 112989. [Google Scholar] [CrossRef]
  28. Vourdoubas, J. Assessment of the Potential of Installing Floating Photovoltaic Systems in Existing Water Reservoirs in Greece. Eur. J. Energy Res. 2023, 3, 17–23. [Google Scholar] [CrossRef]
  29. Vourdoubas, J. Integration of Floating Solar Photovoltaic Systems with Hydropower Plants in Greece. Eur. J. Eng. Technol. Res. 2023, 8, 6–12. [Google Scholar] [CrossRef]
  30. Athanasiou, D.; Zafirakis, D. Assessing the Theoretical, Minimal Intervention Potential of Floating Solar in Greece: A Policy-Oriented Planning Exercise on Lentic Water Systems of the Greek Mainland. Energies 2024, 17, 2144. [Google Scholar] [CrossRef]
  31. Rizos, D. Technical and Technoeconomic Analysis of Floating Photovoltaics on Pumped-Storage Hydropower Dams. Master’s Thesis, Instituto Superior Técnico Lisboa, Lisbon, Portugal, 2023. [Google Scholar]
  32. Vourdoubas, J. Study on the Use of Floating Photovoltaics on Kourna Lake, Western Crete, Greece. Eur. J. Appl. Sci. Eng. Technol. 2024, 2, 4–13. [Google Scholar] [CrossRef]
  33. Vourdoubas, J. Estimation of Solar Electricity Generation from Floating Photovoltaics Installed in Water Dams in the Island of Crete, Greece. Eur. J. Environ. Earth Sci. 2023, 4, 27–33. [Google Scholar] [CrossRef]
  34. Bletsis, I. Installation Study of a Floating Photovoltaic Power Plant in a Dam Reservoir. Bachelor’s Thesis, Institute of Steel Structures, National Technical University of Athens, Athens, Greece, 2023. (In Greek). [Google Scholar]
  35. Stamou, G.; Katsiapi, M.; Moustaka-Gouni, M.; Michaloudi, E. Trophic State Assessment Based on Zooplankton Communities in Mediterranean Lakes. Hydrobiologia 2019, 844, 83–103. [Google Scholar] [CrossRef]
  36. Greek Committee on Large Dams. The Dams of Greece; Greek Committee on Large Dams: Athens, Greece, 2013. [Google Scholar]
  37. Zarris, D. Appraisal of River Sediment Deposits in Reservoirs of Hydropower Dams. Ph.D. Thesis, National Technical University of Athens, Department of Water Resources and Environmental Engineering, Athens, Greece, 2019. (In Greek). [Google Scholar]
  38. Varveris, A.; Panagopoulos, P.; Triantafillou, K.; Tegos, A.; Efstratiadis, A.; Mamassis, N.; Koutsoyiannis, D. Assessment of Environmental Flows of Acheloos Delta. In Proceedings of the Geophysical Research Abstracts; European Geosciences Union General Assembly, Vienna, Austria, 2 May 2010. [Google Scholar]
  39. Efstratiadis, A.; Tegos, A.; Varveris, A.; Koutsoyiannis, D. Assessment of Environmental Flows under Limited Data Availability—Case Study of Acheloos River, Greece. Hydrol. Sci. J. 2014, 59, 731–750. [Google Scholar] [CrossRef]
  40. Economou, A.; Daoulas, C.; Economidis’, P. Observations on the Biology of Leuciscus “svallize” in the Kremasta Reservoir (Greece). Hydrobiologia 1991, 213, 99–111. [Google Scholar] [CrossRef]
  41. Zogaris, S.; Mentzafou, A.; Karaouzas, I.; Markogianni, V.; Vavalidis, T.; Giakoumi, S.; Dimitriou, E. Environmental Impact Assessment Study of the Project Floating PV Project at Kremasta II with Capacity of 115.87968 MW. Biological and Limnological Survey; HCMR-IMBRIW, ILIAKO POWER VIΙΙ SINGLE MEMBER PC: Anavyssos, Greece, 2024. (In Greek) [Google Scholar]
  42. Vardakas, L.; Koutsikos, N.; Perdikaris, C.; Petriki, O.; Bobori, D.; Zogaris, S.; Giakoumi, S.; Fitoka, E.; Tompoulidou, M.; Tsiaoussi, V.; et al. Τhe Fish Fauna in Lentic Ecosystems of Greece. Mediterr. Mar. Sci 2022, 23, 223–265. [Google Scholar] [CrossRef]
  43. Koutsikos, N.; Vavalidis, T.; Perdikaris, C.; Zogaris, S.; Vardakas, L. Anthropogenic Influences Reshape Lentic Fish Diversity: Patterns of Homogenization and Differentiation across a Mediterranean Biodiversity Hotspot. Sci. Total Environ. 2025, 973, 179154. [Google Scholar] [CrossRef] [PubMed]
  44. Hellenic Republic Law 3937. Conservation of Biodiversity and Other Provisions FEK 60/A/2011. Gov. Gaz. Greece 2011, 60, 1619–1666. (In Greek) [Google Scholar]
  45. Hellenic Republic Law 5151. Arrangements for the Modernization of Waste Management, the Improvement of the Energy Saving Framework, the De-velopment of Energy Projects and the Address Urban Planning Issues FEK 173/A/2024. Gov. Gaz. Greece 2024, 173, 9397–9496. (In Greek) [Google Scholar]
  46. Tsafou, F. Environmental Impact Assessment Study of the Project Floating PV Project at Kremasta II with Capacity of 115.87968 MW. Environmental Impact Assessment Study; ILIAKO POWER IX SINGLE MEMBER PC: Athens, Greece, 2022. (In Greek) [Google Scholar]
  47. World Bank Group; ESMAP; Series. Where Sun Meets Water: Floating Solar Handbook for Practitioners; World Bank: Washington, DC, USA, 2019. [Google Scholar]
  48. DHI. MIKE 3 Flow Model FM. Hydrodynamic and Transport Module; Scientific Documentation; DHI: Hørsholm, Denmark, 2020. [Google Scholar]
  49. DHI. MIKE 3 Flow Model FM. ECO Lab/Oil Spill Module; User Guide; DHI: Hørsholm, Denmark, 2020. [Google Scholar]
  50. Smagorinsky, J. General Circulation Experiment with the Primitive Equations. Mon. Weather. Rev. 1963, 93, 99–164. [Google Scholar] [CrossRef]
  51. DHI. DHI Eutrophication Model 1. MIKE ECO Lab Template; Scientific Description; DHI: Hørsholm, Denmark, 2020. [Google Scholar]
  52. Zarris, D.; Lykoudi, E.; Koutsoyiannis, D. Appraisal of River Sediment Deposits in Reservoirs of Hydropower Dams, Final Report; Department of Water Resources, Hydraulic and Maritime Engineering—National Technical University of Athens: Athens, Greece, 2001. (In Greek) [Google Scholar]
  53. Penman, H.L. Natural Evaporation from Open Water, Bare Soil and Grass. Proc. R. Soc. London. Ser. A Math. Phys. Sci. 1948, 193, 120–145. [Google Scholar] [CrossRef]
  54. Hargreaves, G.H.; Samani, Z.A. Reference Crop Evapotranspiration from Temperature. Appl. Eng. Agric. 1985, 1, 96–99. [Google Scholar] [CrossRef]
  55. Allen, R.G.; Pereira, L.S.; Raes, D.; Smith, M. FAO Irrigation and Drainage Paper No. 56. Crop Evapotranspiration (Guidelines for Computing Crop Water Requirements); FAO—Food and Agriculture Organization of the United Nations: Rome, Italy, 1998; ISBN 92-5-104219-5. [Google Scholar]
  56. Nash, J.E.; Sutcliffe, J.V. River Flow Forecasting through Conceptual Models. Part I—A Discussion of Principles. J. Hydrol. 1970, 10, 282–290. [Google Scholar] [CrossRef]
  57. Gupta, H.V.; Kling, H.; Yilmaz, K.K.; Martinez, G.F. Decomposition of the Mean Squared Error and NSE Performance Criteria: Implications for Improving Hydrological Modelling. J. Hydrol. 2009, 377, 80–91. [Google Scholar] [CrossRef]
  58. Moriasi, D.; Gitau, M.; Pai, N.; Daggupati, P. Hydrologic and Water Quality Models: Performance Measures and Evaluation Criteria. Trans. ASABE 2015, 58, 1763–1785. [Google Scholar] [CrossRef]
  59. Knoben, W.J.M.; Freer, J.E.; Woods, R.A. Technical Note: Inherent Benchmark or Not? Comparing Nash-Sutcliffe and Kling-Gupta Efficiency Scores. Hydrol. Earth Syst. Sci. 2019, 23, 4323–4331. [Google Scholar] [CrossRef]
  60. Yang, P.; Chua, L.; Irvine, K.; Nguyen, M.; Low, W. Impacts of a Floating Photovoltaic System on Temperature and Water Quality in a Shallow Tropical Reservoir. Limnology 2022, 23, 441–454. [Google Scholar] [CrossRef]
  61. de Lima, R.; Paxinou, K.; Boogaard, F.; Akkerman, O.; Lin, F. In-situ Water Quality Observations under a Large-scale Floating Solar Farm Using Sensors and Underwater Drones. Sustainability 2021, 13, 6421. [Google Scholar] [CrossRef]
  62. Ilgen, K.; Schindler, D.; Wieland, S.; Lange, J. The Impact of Floating Photovoltaic Power Plants on Lake Water Temperature and Stratification. Sci. Rep. 2023, 13, 7932. [Google Scholar] [CrossRef] [PubMed]
  63. Hinkle, D.; Wiersma, W.; Jurs, S. Applied Statistics for the Behavioral Sciences, 5th ed.; Houghton Mifflin: Boston, MA, USA, 2003; ISBN 978-0618124053. [Google Scholar]
  64. Richardson, D.; Carey, C.; Bruesewitz, D.; Weathers, K. Intra- and Inter-Annual Variability in Metabolism in an Oligotrophic Lake. Aquat. Sci. 2017, 79, 319–333. [Google Scholar] [CrossRef]
  65. El Baradei, S.; Al Sadeq, M. Effect of Solar Canals on Evaporation, Water Quality, and Power Production: An Optimization Study. Water 2020, 12, 2103. [Google Scholar] [CrossRef]
  66. Bax, V.; van de Lageweg, W.; van den Berg, B.; Hoosemans, R.; Terpstra, T. Will It Float? Exploring the Social Feasibility of Floating Solar Energy Infrastructure in the Netherlands. Energy Res. Soc. Sci. 2022, 89, 102569. [Google Scholar] [CrossRef]
  67. Hellenic Republic. National Energy and Climate Plan of Greece-Revised Edition; Ministry of Environment and Energy: Athens, Greece, 2024. [Google Scholar]
  68. Sargentis, F.; Siamparina, P.; Sakki, G.; Efstratiadis, A.; Chiotinis, M.; Koutsoyiannis, D. Agricultural Land or Photovoltaic Parks? The Water–Energy–Food Nexus and Land Development Perspectives in the Thessaly Plain, Greece. Sustainability 2021, 13, 8935. [Google Scholar] [CrossRef]
Figure 1. (i) Acheloos River basin and (ii) the location of the proposed FPV system under study; protected areas and Kremasta Lake digital elevation model (DEM); (iii) sites of the bathymetric survey and sampling sites of the current study; and (iv) the vertical profile and investigated sites of the impact of FPV panel construction on the reservoir’s water quality.
Hydrology 12 00092 g001
Figure 2. Initial (i) and (ii) final bathymetry and flexible meshes, and (iii) vertical discretization of Kremasta Lake used in the hydrodynamic model.
Hydrology 12 00092 g002
Figure 3. Simulated and observed monthly water levels (i,ii), and total N (iii), total P (iv), and chl-a (v) simulated and observed concentrations of Kremasta Lake.
Hydrology 12 00092 g003
Figure 4. Simulated and observed water temperature profiles of Kremasta Lake on 15 November 2023 for sampling sites (i) KR.1.1, (ii) KR.1.3, (iii) KR.1.5, (iv) KR.2.1, (v) KR.2.3, (vi) KR.2.5, (vii) KR.3.1, (viii) KR.3.3, (ix) KR.3.5, (x) KR.4.1, and (xi) KR.4.3.
Hydrology 12 00092 g004
Figure 5. Simulated and observed dissolved oxygen concentration profiles of Kremasta Lake on 15 November 2023 for sampling sites (i) KR.1.1, (ii) KR.1.3, (iii) KR.1.5, (iv) KR.2.1, (v) KR.2.3, (vi) KR.2.5, (vii) KR.3.1, (viii) KR.3.3, (ix) KR.3.5, (x) KR.4.1, and (xi) KR.4.3.
Hydrology 12 00092 g005
Figure 6. Time series of surface temperature (i,ii), dissolved oxygen—DO (iii,iv), total nitrogen—Total N (v,vi), total phosphate—Total P (vii,viii), and chlorophyll-a—Chl-a concentrations (ix,x) at check points A and B with and without FPV panel construction.
Hydrology 12 00092 g006
Table 1. The statistical characteristics and efficiency criteria of the water level, vertical temperature, and dissolved oxygen concentration profiles for the calibration of the Kremasta Lake hydrodynamic water quality model.
Sampling SiteParameterNMAERp-ValueR2NSEKGERMSEPBIAS
DamWater level121.410.97<0.00001 *0.940.610.491.920.21%
KR.1.1Water temperature200.180.92<0.00001 *0.840.820.840.20−0.31%
KR.1.3200.210.90<0.00001 *0.810.790.820.24−0.39%
KR.1.5290.240.87<0.00001 *0.760.740.710.280.08%
KR.2.1200.140.92<0.00001 *0.850.840.910.170.15%
KR.2.3200.160.92<0.00001 *0.840.840.880.19−0.13%
KR.2.5190.210.87<0.00001 *0.750.750.830.24−0.14%
KR.3.1220.170.90<0.00001 *0.820.810.830.200.21%
KR.3.3180.190.92<0.00001 *0.840.810.830.21−0.38%
KR.3.5200.270.82<0.00001 *0.670.600.640.300.58%
KR.4.1230.180.90<0.00001 *0.810.810.820.21−0.13%
KR.4.3230.270.85<0.00001 *0.720.700.730.30−0.37%
KR.1.1Dissolved oxygen200.210.95<0.00001 *0.920.760.740.26−2.13%
KR.1.3200.270.94<0.00001 *0.880.650.650.33−2.70%
KR.1.5290.380.89<0.00001 *0.800.540.470.48−2.52%
KR.2.1200.220.97<0.00001 *0.940.710.660.30−2.56%
KR.2.3200.210.96<0.00001 *0.920.710.640.32−2.39%
KR.2.5190.330.96<0.00001 *0.920.480.580.44−4.12%
KR.3.1220.270.94<0.00001 *0.890.670.590.35−2.25%
KR.3.3180.260.97<0.00001 *0.950.620.650.34−3.25%
KR.3.5200.360.89<0.00001 *0.800.450.420.46−2.81%
KR.4.1230.290.93<0.00001 *0.860.670.640.36−2.59%
KR.4.3230.280.92<0.00001 *0.850.660.700.34−2.69%
* The result is significant at p < 0.01.
Disclaimer/Publisher’s Note: The statements, opinions and data contained in all publications are solely those of the individual author(s) and contributor(s) and not of MDPI and/or the editor(s). MDPI and/or the editor(s) disclaim responsibility for any injury to people or property resulting from any ideas, methods, instructions or products referred to in the content.

