Abstract
We present technical advances and methods to measure effective broadband physical albedo in snowy mountain headwaters using a prototype dual-sensor pyranometer mounted on an Autonomous Aerial Vehicle (an AAV). Our test flights over snowy meadows and forested areas performed well during both clear sky and snowy/windy conditions at an elevation of ~2650 m above mean sea level (MSL). Our AAV-pyranometer platform provided high spatial (m) and temporal resolution (sec) measurements of effective broadband (310–2700 nm) surface albedo. The AAV-based measurements reveal spatially explicit changes in landscape albedo that are not present in concurrent satellite measurements from Landsat and MODIS due to a higher spatial resolution. This AAV capability is needed for validation of satellite snow albedo products, especially over variable montane landscapes at spatial scales of critical importance to hydrological applications. Effectively measuring albedo is important, as annually the seasonal accumulation and melt of mountain snowpack represent a dramatic transformation of Earth’s albedo, which directly affects headwaters’ water and energy cycles.
1. Introduction
Albedo is the proportion of incoming incident radiation that is reflected back to the atmosphere, and is a critical component of the Earth’s energy and water balance [1]. This simple ratio governs many of the calculations of land-atmosphere interactions and climate models [2,3], quantifies the energy reflected from the surface back to the atmosphere [4], and varies considerably across time and space [5].
In mountainous regions that are characterized by seasonal snowpack, the spatio-temporal variability of albedo is particularly relevant as snow accumulation and melt cycles drive some of the most profound changes on the surface of the Earth [6,7]. This seasonal phenomenon dramatically alters the energy balance of the planet’s mountain headwaters. In snow-free conditions lower albedo vegetation, soils, and rock can absorb ~90% of short-wave radiation. Comparatively, higher albedo snowpack reflects up to 90% of visible radiation [8]. Additionally, the albedo of snow is not fixed, and decays as a function of time as snow crystals’ physical properties change, particularly during ablation (melt) [9,10]. Local-scale changes in snow albedo scale up to affect regional-scale energy and water balances [11].
1.1. Current Methods of Measuring Albedo
In its simplest form, albedo ( is derived by the ratio between reflected irradiance from the surface ( and incoming irradiance (.
The albedo of an individual feature on the landscape, such as a tree branch or snowflake, is distinct to that object, but challenging to measure at that level of detail. Measurements of albedo spatially expand beyond an individual object, and they return an integrated measurement of the sensor’s field of view [8]. The size of the footprint over which a sensor receives signal is a function of the sensor’s field of view and measurement altitude, and can range from a few m2 (a handheld sensor) to 25 ha (a satellite grid cell). Albedo has different spectral values across wavelengths, and the physical albedo is the integrated signal for all visible wavelengths. Physical effective albedo represents the overall signal from the measurement footprint and is dependent on the composition of the measured area [12]. In heterogeneous landscapes, ground-based measurements are able to detect spatial variability in albedo at a much finer scale than satellite measurements with coarser resolution.
The importance of snow albedo and its physical controls are identified in the National Academies of Science 2017 Decadal Strategy for Earth Observation from Space and are Targeted Observables of both Surface Biology and Geology, and Snow Depth and Snow Water Equivalent [13]. Specifically, the Decadal Strategy identifies that key goals are improving measurements and modeling of albedo as a component of Earth’s land surface, and understanding hazards in mountainous terrain [13]. Even with opportunities to improve satellite measurements of albedo in the future, Bair et al., [14] demonstrated that current remotely-sensed albedos are of value and provide better results than traditional age-decay model approaches.
Global patterns of effective albedo rely on satellite and airborne data, collectively referred to as Earth Observations (EO). These EO provide a unique perspective of our planet, offering novel insights that improve our understanding of complex land-atmosphere interactions from pole to pole, fundamentally changing the way that the Earth is measured, mapped, and modeled [15]. NASA’s Moderate Resolution Imaging Spectroradiometer (MODIS) Terra Snow Cover (MOD10A1 Version 6) provides daily albedo at 500 m resolution. The presence/absence of snow cover is identified using the Normalized Difference Snow Index (NDSI), which is vetted to alleviate errors and flag uncertain snow cover detections [16]. NASA Landsat satellites also provide an albedo product at higher spatial resolution (30 m) every 16 days. These data are at Level-2, requiring field-based data for validation and calibration to improve the product [2,17,18]
Current EO like MODIS and Landsat require near-Earth measurements to calibrate and validate the signals recorded [14,19,20,21], regardless of the platform or mission. However, the scaling issues that exist between in situ and EO data generate challenges in the calibration and validation of measurements, especially with satellite measurements across variable terrain [14,18,22]. In situ data are commonly measured from fixed towers or weather stations, limiting the spatial extent of their measurements and underrepresenting the inherent variability that exists across the broader landscape and topography [14,19,21,22]. In locations with harsh winters, tower-based sensors are commonly disassembled in the fall and do not collect data because of icing and bad weather [18], effectively eliminating calibration and validation data in snowy regions during these seasons. This absence of measurements occurs at a time when validation data is critical for understanding shifts in the energy and water balance in snowy regions. Additionally, the cost of equipment and maintenance associated with fixed towers preclude their broad distribution across the globe, and their locations are commonly limited to economically developed nations [23]. As a result, this limited number of near-Earth measurements has the potential to introduce bias into satellite calibration and validation towards the existing monitoring sites’ landscape [19,21,22].
Similarly, many near-Earth measurements of albedo do not account for topography, even though terrain readily influences albedo across variable terrain [24]. Previous efforts to account for snow surface topography in satellite measurements of albedo have required computationally complex, data intensive measurements from an expensive and cumbersome terrestrial laser scanner [14]. AAVs provide rapid, inexpensive surveys to create high resolution (<10 cm) terrain models of snow surface topography [25,26].
1.2. Opportunities to Improve Measurements of Albedo
Autonomous Aerial Vehicles (AAVs) bridge the scaling and measurement challenges associated with fixed position, in situ data providing near-Earth measurements horizontally and at multiple altitudes. This flexibility allows AAVs to support measurements for field campaigns that range from ha to km2. By design, AAVs are flexible and not fixed to a particular field location, allowing one craft to measure multiple sites with minimal marginal costs. The nascent AAV industry and associated novel sensors are projected to have a compound annual growth rate of 15.8% between 2019 and 2026 [27], resulting in improved aircraft and sensors at lower prices [28]. Combined, these decreased costs, improved hardware, and sensors create new opportunities to measure the Earth under a range of seasonal conditions. These data can help bridge the existing gap between ground-truthing field data and satellites [21], measure dramatic alterations of the Earth’s surface [18], or be integrated into models as forcing or assimilation data.
Previous AAV-albedo focused work demonstrated the ability of a fixed-wing AAV to measure albedo over the Greenland ice sheet [29]. This study used small silicon pyranometers (a sensor that measures solar irradiance over an area (Wm−2)) with the ability to capture a spectral signal of 300–1100 nm. This limited spectral range excluded some solar energy contributions to the surface energy balance and was tested on ice sheets with albedos ranging from 0.11–0.64 [29]. This range (0.11–0.64) captures on the lower scope of snow albedo, which ranges from 0.95 for fresh snow to 0.4 for shallow dirty snow [9]. Levy et al. [21] measured surface albedo across relatively level, forested stands in the northeastern United States using more advanced pyranometers (Kipp & Zonen CMP3 with a spectral range: 310–2700 nm and a mass of 350 g [30]). Reflected irradiance was measured from the AAV, and incoming irradiance was measured from a fixed position (a single pole). This provided an advance in the application of AAVs but did not measure albedo spatially across snowy landscapes. Also this study did not resolve the issue of a single fixed-point measurement of incoming radiation. Collecting fixed point data requires additional equipment (e.g., mounting pole/tower) and are not collocated with the AAV measurements. Webster & Jonas [12] furthered AAV-based measurements by employing upward- and downward-facing CMP3 sensors to measure albedo over a forested stand in Switzerland. Their study focused on forest snow albedo over a single ~0.75 ha study site with flight paths of ~170 m. Their work demonstrated that measurements of incoming and outgoing irradiance from a single AAV extends the ability to measure albedo variability over forested areas, at a range of altitudes, and at detailed spatial resolutions. All these data extend well beyond fixed-location measurements and at a much higher spatial resolution than satellite data.
The spatial flexibility of AAVs in the x, y, z plane begins to address the scaling issues (from tens of meters to several km2) that have commonly hampered the calibration and validation of satellite albedo products such as MODIS and Landsat, and have not been addressed in previous research. Additionally, AAVs provide the ability to assess the albedo of the terrain under a range of conditions and in locations that are inaccessible or potentially hazardous for human safety (e.g., avalanche-prone areas).
To address these issues, we present viable materials and methodology to improve the measurement of effective broadband physical albedo from AAVs based upon the results of four AAV flights in an alpine catchment. Results document changes in albedo at the scale of tens of meters that directly address the known albedo scaling issues [14,18,22]. This research focuses on effective broadband physical albedo (310–2700 nm) across snowy landscapes comprised of pure snow and coniferous forest.
2. Materials and Methods
2.1. Pyranometers and AAV
We tested the efficacy of Kipp & Zonen PR1 pyranometers (calibrated in Nov 2017), a retrofitted sensor built for this study with Kipp & Zonen’s SMP3 hardware and encased in a smaller, lighter shell. These digital sensors have a spectral range of 310–2700 nm, a response time (95%) of 0.2 s, an effective field of view of 180°, a mass of 145 g, and connect to a Meteon 2.0 digital data logger [31]. The PR1 provides a more efficient sensing platform for AAVs than the silicon pyranometers and CMP3 pyranometers used in previous studies [12,21,29]. CMP3 sensors employ passive correction, whereas the SMP3/PR1 hardware provides active digital temperature correction ranging from −20 °C to 50 °C. As a result, the PR1 provides higher accuracy measurements. The PR1 is also 59% lighter than the CMP3 (350 g lighter per sensor) [30], allowing for increased flight times and better handling for this AAV and payload configuration.
Upward and downward-facing PR1 pyranometers were mounted on fixed-position gimbals aboard a DJI Matrice 210 V2 (M210, Figure 1). This is a quadcopter design with a total wingspan of about 88 cm (35 inches) and without payload weighs approximately 4.53 kg (10 lbs). The upward-facing sensor measured the incoming irradiance (, and the downward-facing sensor measured the reflected irradiance from the surface (. Atmospheric corrections of albedo were assumed to be negligible at the low altitude of the AAV flights. For these test flights we assume that the ratio between incoming and reflected irradiance represents the effective broadband surface albedo ( of the snow surface [9] as measured by the pyranometers (Equation (1)).
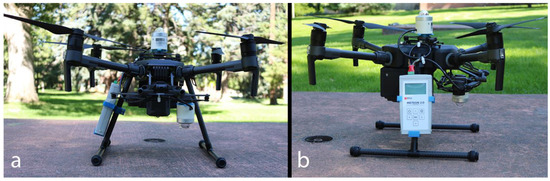
Figure 1.
The forward (a) and lateral (b) view of the Matrice 210 V2 with the pyranometers and data logger mounted.
To ensure that the sensors were equally standardized, both PR1s were removed from the AAV and over the course of ~50 h recorded incoming irradiance, capturing a range of solar zenith angles on a rooftop with minimal topography or buildings in the field of view. Of concern was the influence that the AAV’s non-retractable landing gear would have on the downward facing irradiance measurements (Figure 1). A separate calibration was performed to quantify this measurement interference. For reference conditions, the upward-facing sensor was set up with an unobstructed field of view. For AAV-obstructed conditions the downward-facing sensor was mounted on the underside of the M210, which was then flipped upside down providing sky view conditions with the same obstructions that would occur during flight. This calibration was conducted over ~6 h on multiple days, across zenith conditions (10 h–18 h).
Because the PR1 sensors are prototypes, one of the primary challenges we encountered was securely fastening the pyranometers to the gimbals on the AAV. Three-dimensional (3D) printing facilitated the design and fabrication of mounts and allowed our group to develop, prototype, and test the mounting brackets and hardware at a relatively minimal cost. Mounts were based on measurements from standard engineering calipers, designed in AutoDesk Fusion360 (CAD software), and printed with a Flashforge Inventor II 3D printer using PLA filaments. The first test flights were conducted in a nearby agricultural field with fabricated PR1 replicas of the same dimensions and mass, which were mounted on the AAV to test for weight distribution issues and evaluate the integrity of the mounting brackets. These flights also provided us with an estimate of maximum flight duration. The Meteon Data Logger was attached to the M210 leg on a mount that was designed and 3D printed for this project. To enable implementation of these methods by other groups, all 3D CAD files used in the project are freely available for download at https://github.com/GEOSWRL/UAV_Albedo.
2.2. Flight Planning
The M210 provided a stable, robust platform to mount the sensors and data loggers. One of the challenges associated with this new-to-market (in 2019) AAV was instability with regards to several different flight planning software programs. We tested multiple software products (e.g., DJI, other proprietary, and open source software) during practice flights in a nearby agricultural field. All software underperformed. The firmware on the new-to-market AAV was not backwards compatible with existing flight planning software. A down-looking camera would greatly facilitate data analysis and interpretation. However, the camera for the AAV was backordered and unavailable, thus no high-resolution images were captured during our flights. The inherent hardware and software limitations of the AAV at the time of testing required that all paths and plans were flown manually, using line of sight and the field-of-view camera installed within the M210.
The M210′s internal GPS and Inertial Measurement Unit (IMU) recorded geographic location and altitude in addition to the pitch, roll, and yaw of the AAV. The PR1 sampled irradiance values every second, which were recorded on the data logger. For tables detailing the characteristics of the M210 and the PR1 sensors please refer to Appendix A and Appendix B.
2.3. Study Area and Flight Descriptions
Four flights (on two separate days, two flights each day) were conducted in montane terrain (45.23, −111.47) in southwestern Montana, USA near Yellowstone National Park (~2650 m MSL), in an area comprised of open meadows and stands of conifer trees (Figure 2). Our tests were conducted on 15 April and 1 May 2019, both characterized by considerable seasonal snowpack on the ground with spot probe snow depths of 1.6 m and 1.8 m respectively at our flight staging location. The flights were conducted between 11:29 and 12:30 in the day, and each lasted from 10–15 min, the safe limits of the battery power in cold conditions. The fourth flight was 2 min due to battery limitations. The solar zenith angles at noon on these dates were 43° and 38°, and the solar noon was 13:25 and 13:22 respectively. Both dates had meteorological characteristics distinct from one another. 15 April was windy and snowy (12 cm in the previous 48 h), and had an air temperature of −2 °C under cloudy skies. 1 May had clear sky conditions, an air temperature of 1 °C, with 5 cm of snow falling 48 h prior.

Figure 2.
Context map of the study site noted by the white dot within the state boundary of Montana (a), USA [32]. Local map of the study area terrain with each of the four flights (b).
2.4. Post-Processing of Data
Post-flight processing of the M210 data used DatCon [33], an open-source product, to convert the raw AAV data to a .csv file. The Meteon 2.0 data logger required accompanying free, proprietary software to download the data. To ensure the quality of the radiometer data any records were removed that corresponded to prior/during liftoff, during the initial ascent, and until the radiometer measurements stabilized. Merging the two disparate time series (radiometer data logger and the internal GPS data of the AAV) into a single composite was completed using the “Synchronize” function in MATLAB [34]. Data with temporal mismatches between the AAV and the data logger were discarded, so that every measurement corresponded to a measured lat/lon location.
Each pyranometer was mounted on a gimbal mount that ensures stability but does not ensure nadir. Thus to reduce error associated with the AAV’s pitch and roll, a tilt limit of 5° (based upon the IMU data from the M210) was applied [35], and data records with a pitch or roll >5° were removed. This initial pass resulted in filtering 62 of 1381 points, or 4% of the data collected indicating stable flights even in windy conditions.
The landscape where the flights were conducted was classified as Meadow (an open snow-covered area), Trees (stands of trees, comprised entirely of conifers), or Edge (a 10 m buffer around the stands of trees) using recent aerial imagery at 1m resolution [32] and standard GIS functions. Using the latitude and longitude locations from the merged AAV and radiometer dataset, each point was assigned one of the three landcover classifications based upon geographic location of the measurement.
2.5. Reducing Oversampling of AAV Measurements for Comparison to Space-Borne Data
The AAV collected albedo data at higher spatial resolutions than individual 30 m Landsat grid cells. To address potential oversampling biases of the AAV-based measurements, the central tendency of the data (mean, geometric mean, and median) were calculated over the co-located Landsat cell. These calculations were completed using the pandas and geopandas libraries in Python. For example, if there were eight AAV measurements collected within the spatial domain of an individual Landsat cell, the central tendency of the eight measurements was assigned to the Landsat cell for comparison. The intent of calculating the central tendency was to develop a better quantitative comparison of the AAV and Landsat data at the same spatial resolution, and to address the technical limitations of all flight paths and plans being flown manually.
2.6. Space-Borne-Data
The space-borne observations used for comparative analysis of albedo consisted of the daily MODIS 10A1 (MOD10A1—Snow Albedo) product [16] and calculations of broadband albedo using Landsat 7 and Landsat 8 Analysis Ready Data (ARD) [36,37]. The MOD10A1 data combines measurements from both Terra and Aqua satellites to retrieve directional hemispherical reflectance at local solar noon as both spectral (seven narrow spectral bands [16]) and three broadband (300–700 nm, 0.7–5.0 µm, and 0.3–5.0 µm) quantities. The MOD10A1 Terra and Aqua flights crossed the study area at approximately 12:25 and 2:00 local time, respectively, on both field days. The solar zenith angle is parameterized in the MOD10A1 albedo calculations [38]. The algorithm’s coefficients for broadband albedo calculations were applied for Landsat 7 [39] and Landsat 8 [40]. The Landsat 8 flight paths crossed the study area on 14 April (13:12 local time, zenith angle of 43° [36]) and 30 April (13:00h local time, zenith angle of 24° [36]), one day before each of our AAV missions. Landsat 7 was co-located with the study area on 1 May. Because of the clear sky conditions on this day and resultant bright snow over the study area, the Landsat 7 images were oversaturated and not usable for analysis.
3. Results
3.1. Testing of AAV and Calibration of Sensors
Test flights with the replica PR1 sensors assessed the stability of the M210. These flights in April 2019 occurred in windy conditions, (up to ~4 ms−1), and the AAV provided stable flights and responsive navigation with the replicas and data loggers mounted. Similarly, flights with the PR1 sensors, accompanying cables, and data logger in nearby agricultural fields provided stable flights and sample data from the sensors.
Ground-based instrument standardization of the PR1 sensors provided a high level of agreement without the landing gear present (R2 = 0.998, Mean Absolute Error = 11.25 Wm−2, Mean Absolute Error % = 2.89%) and with the landing gear present in the downward facing sensor’s field of view (R2 = 0.995, Mean Absolute Error = 24.0 Wm−2, Mean Absolute Error % = 3.15%). The effects of the visible landing gear on the downward facing pyranometer were minimal (<3%), similar to ground-based calibrations of Webster & Jonas [12]. Field measurements from the downward facing pyranometer were calibrated by a factor of 1.0287 for the presence of landing gear. This bias correction and a high level of agreement (R2 = 0.998) between the two pyranometers provide a high level of confidence that calculations of physical broadband albedo (a ratio) are accurate.
3.2. Metrics From Flight Data
The length and time of the four flights recorded by the AAV are provided in Table 1. While the flights were flown manually, every attempt to fly at a constant velocity and altitude during each flight was made. The flights on the first day were flown at roughly half the velocity as the second day of flights. Flights 2 and 3 were intentionally flown at a higher median altitude than flights 1 and 4.

Table 1.
Physical characteristics of the four flights.
The differences between the calculated central tendencies of the data to address oversampling of albedo data over Landsat cells showed minimal variability (Figure 3). In Figure 3, there is little to no difference between the mean and geometric mean (Gmean—blue plot). The difference between the mean and median is nominal and evenly distributed (orange plot) with minimal skew or bias. Thus all data is displayed as the mean for each Landsat cell (Figure 4).

Figure 3.
The differences in the central tendency calculations of the spatially aggregated albedo values. The shape of the plot widens as a function of data distribution and its probability density—where wider reflects more probable.

Figure 4.
The albedo data from all four flights presented as a time series (left panels), flight pattern (center panels), and mapped (right panels). The grid in the right panels represents the Landsat grid cells. Results show considerable variation of albedo across the flight paths, and readily distinguish the differences between open, snowy meadows (blue circles) and forested areas (green circles). The notations X, Y, and Z are intended to connect the spatial location of the measurements on the maps with the corresponding flight distance.
3.3. Albedo Measurements Across a Snowy Landscape
All four flights provided spatially explicit albedo measurements that clearly identified the different landcover types across the varying landscape, and across Landsat and MODIS grid cells (Figure 4 and Figure 5). In Figure 4, the sub-figures in the left column (Figure 4a,d,g,j) present the albedo data as a function of flight distance, symbolized by the underlying landscape as defined in Section 2.4. The sub-figures in the center column (Figure 4b,e,h,k) show the individual data points and the pattern of each flight. The right column (Figure 4c,f,i,l) present the same data spatially averaged to the individual Landsat grid cell as described in Section 2.5.
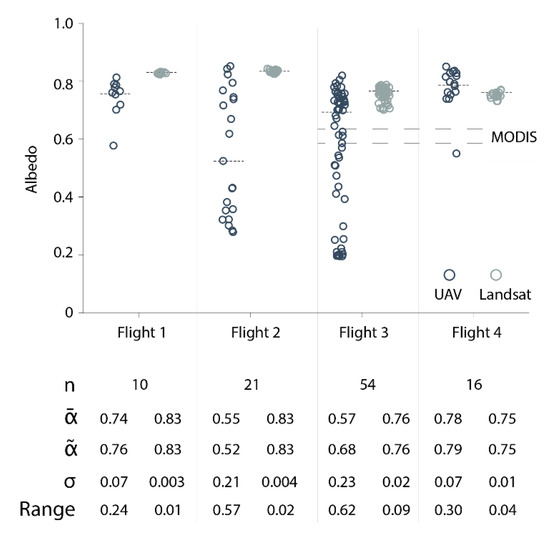
Figure 5.
The range of albedo values across each of the flights displays a more spatially explicit representation than albedo values from Landsat 8 (LS8) and MODIS MOD10A1. The MODIS values are represented by a single dashed line for each date due to the more-coarse resolution of the MODIS instrument.
During the cloudy, snowy conditions of flight 1, the sensors readily distinguished the edges, or transitional areas, between the forest and open meadow (Figure 4a–c; annotated by semi-circles X). Similarly, during flight 2 the AAV platform readily distinguished albedo differences across the flight path with a range of 0.25–0.87 (Figure 4d–f) at a mean velocity of ~1 ms−1. Flight paths over forested areas show markedly lower albedos (semi-circles Y). These low albedo values at ~500 m (Figure 4d) are associated with the AAV stopping and rotating just outside a forested area.
During the clear sky conditions of flight 3, the AAV platform distinguished changes in landcover albedo across a broader spatial domain (~10 ha) with an albedo range of 0.18–0.81 (Figure 4g–i). This flight moved at a faster velocity (~2 ms−1) but was still able to capture the transitions into forested areas (semi-circles Z). Flight 3 also highlighted that the albedo of snow is not uniform across open, snowy areas. This same heterogeneity is evident in Flight 4, which focused solely on snowy, open meadows but had a range of albedo values of 0.58–0.85. Of interest are the differences in the spatially averaged albedo values in between Flights 3 and 4 (Figure 4i,l), specifically in the southern central portion of the study area. In this sub-region, flight 3 shows lower albedo values than Flight 4, which was flown approximately 30 min later and at a lower altitude.
The resolution of the measurements from the AAV data is also telling. The AAV was able to provide measurements of albedo across the landscape, with a much higher degree of spatial detail as compared to the Landsat and MODIS data. For example, flight 2 (Figure 4c) collected 671 valid measurements (i.e., matching time stamps through QA/QC in roughly 15 min over 920 m flown by the AAV. Flight 3 (Figure 4e, flying at a slower velocity) collected 242 valid measurements over 1960 m flown by the AAV. These data were collected over variable terrain that would have required considerably more time to compile if measuring by walking the transects and taking point observations.
3.4. AAV-Based Albedo Measurements Compared to Landsat and MODIS Data
The AAV provided a much more spatially explicit representation of albedo that is not encapsulated in measurements from the MODIS (MOD10A1—Terra and Aqua) and Landsat instruments. Figure 5 graphically represents the range of albedo values averaged over corresponding Landsat grid cells, as compared to calculated values of broadband albedo from Landsat 8 and from MOD10A1 (dashed lines). For example, measured albedo values from flight 2 describe a heterogeneous reflectance landscape (0.28 0.85; = 0.55, σ = 0.21) across open meadows and forested landscapes as compared to calculations of albedo from Landsat 8 (0.82 0.84; = 0.83, σ = 0.00). The MOD10A1 data was classified as clouds. Of note is that these flights occurred during snowy conditions with new snow on the ground and in the forest canopy. Similarly, during clear sky conditions flight 3 provided a broad range of albedo measurements (0.20 0.82; = 0.57, σ = 0.22) as compared to Landsat 8 (0.71 0.79; = 0.75, σ = 0.02) and MOD10A1 (0.59 and 0.65). The values represent the entire AAV flightpath that is comprised of open meadows, transitional areas and stands of trees. These differences are not readily distinguished in the space-borne measurements, which would potentially provide albedo measurements that are markedly higher or lower than AAV-based measurements. In the cases of flights 2 and 3 (over a mix of meadow and trees) the MODIS is much closer to the AAV than the Landsat , whereas in flights 1 and 4 (almost entirely over open meadow), Landsat data has a higher level of agreement with the AAV-based measurements. It is presumed that the high bias and much narrower range of Landsat albedo measurements is a result of the sensor not adequately capturing the influence of trees. This is in part due to Landsat’s status as a Level-2 product that requires field-based data for validation and calibration [2,17,18]. Understandably, MODIS data and AAV data are distinct from one another. The MODIS product is estimated from narrow band measurements, while the AAV are broadband (310–2700 nm).
4. Discussion
The intended goal of this study was to test the ability of the AAV to fly with the prototype pyranometer and datalogger and take irradiance measurements across the landscape. In turn these AAV-based data are used to calculate broadband effective albedo (310–2700 nm) across a snowy mountain landscape. The methods and results we present focus on the testing and mounting of the pyranometers aboard the AAV and provide a case study of a viable and tangible method to collect albedo data across a mountainous catchment at these spatial scales. These data are complemented by the comparison with satellite data products.
Identifying a Path Forward for AAV-Based Measurements of Albedo
The results of this study suggest that measurements of irradiance from AAVs can improve the spatial resolution and detail of effective broadband albedo across the landscape. Tower-based measurements over forests or weather station-based measurements over meadows provide a single measurement of albedo, a deficiency that AAVs readily address. The prototype PR1 digital pyranometers present considerable technological advances from previous studies. They have a spectral range of 310–2700 nm, are temperature corrected, have a faster response time and are much lighter than sensors used in previous research [12,21,29]. The PR1 pyranometers tested in this study are now commercially available and provide a means for an economical, lightweight sensor that is readily deployed in the field under a range of temperatures.
The AAV (M210) is readily available and performs well at high elevations in variable meteorological conditions. The design and fabrication of custom mounts using an off-the-shelf 3D printer allowed pyranometers to be securely mounted to the AAV, and we provide the design files, readily available for download (https://github.com/GEOSWRL/UAV_Albedo). The entire hardware framework requires a budget of around $15,000 USD in 2019 (~$11,000 for AAV, batteries, and accessories, ~$3000 for sensors, and ~$1000 for printer and filament) and can be deployed at multiple study sites that would readily support multiple studies with the same equipment. The aerial footprint of our longest flight covered over 8 ha in 14 min, and every indication implies that updated flight planning software will facilitate longer, more efficient flight paths in the future.
As mentioned previously, all flights were conducted manually and did not use flight planning software because of compatibility issues with the new-to-market AAV. During the spring of 2019, the Matrice 210 V2 did not have functioning flight planning software available. Efforts to manually complete an overlap pattern were attempted during flight 3. The goal of the flights was to test the ability and practicality of this AAV and pyranometer, and should be interpreted as an intermediate step that tests the viability of the platform. Future implementation of flight planning software that has subsequently become available will allow for more efficient and consistent flight paths flown at constant velocities and altitudes, which will provide replicable parameters for datasets in the x, y, and z plane. This study focused on the flexibility of an AAV to assess the variability of albedo in the x–y plane. An analysis of albedo variability in the z-plane was not in the scope of this research and presents opportunities for subsequent research.
As introduced in the results, there are differences in the spatially averaged albedo values of flights 3 and 4 (Figure 4f,h) in the southern central portion of the study area. Collecting more detailed data along the z-axis will allow subsequent flights to quantify the scale dependent controls on albedo. For example, as the AAV ascends over a snowy meadow how do measurements of albedo change? Is there a threshold or optimal altitude at which AAV flights should be deployed? The insights gained from these data would readily facilitate the calibration and validation of albedo calculations from the MODIS and Landsat satellites, and would offer the distinct possibility for improving validation and calibration measurements for current and subsequent satellite calculations of albedo.
Work by Bair et al. [14] highlight the influence of topography on albedo measurements. Our study area was over rolling terrain, with minimal topographic and snow surface relief (~20 m) that did not create shade during our flight times. Subsequent research in areas with higher relief will need to account for the effect of sensor angle with respect to surface topography. Potential methods include a bias correction in post-processing or physically mounting the sensors on gimbals that adjust to the slope and topography of the landscape. Similarly, the effect of solar zenith angles on AAV measurements and Landsat 8 calculations of physical albedo were beyond the scope of our study. Subsequent, more detailed comparisons and potential validation of satellite measurements will require the incorporation of solar zenith angles.
The effects of the landing gear on measurements of reflected irradiance were characterized (quantified and calibrated). There are AAV platforms with retractable landing gear, which are larger and heavier than the M210. One of the strengths of the M210 platform is its portability, requiring only moderate effort for a two-person team to ski into remote locations for measurements. We have tested a larger DJI M600 at another field location, but its size and weight limits its deployment to sites that are accessible by vehicle. Better quantifying the influence of the landing gear will provide enhanced bias correction of the reflected shortwave radiation measurements.
Our broadband pyranometers do not address albedo’s variability across spectral wavelengths. It is of note that gimbal-mounted hyperspectral sensors are commercially available (i.e., Headwall or Resonon). These products are designed primarily for commercial agricultural applications, have a low temperature threshold of 0 °C, are heavier (requiring a bigger AAV), and are more expensive than the PR1 sensors presented in this research.
Our AAV framework operates on a smaller AAV (packable in size), at a considerably reduced cost, and is temperature corrected down to −20 °C. We do not presume that AAVs will replace space-borne observations that provide global coverage over an extended period of record. Instead we suggest that AAV-based measurements from a representative portion of a mountain headwater throughout the accumulation and melt season provide a means to augment existing EO and the ability to improve the validation and calibration of satellite data. The methods and resulting data presented in this paper provide a tangible way forward to produce data at relevant spatial scales to improve snow melt hydrological models and provide insights into the scaling issues associated with space-borne measurements of albedo.
Understanding these discrepancies in albedo values would have a considerable effect on energy and water balance calculations in this study area, especially computations focused on the spring melt and runoff [41], the effects of which propagate downstream through ecosystems and society. Improved albedo measurements of snowpack would also improve drought prediction and monitoring in snow dependent regions [42].
5. Conclusions
The advances we present in measuring albedo from an AAV improve scientific capacity, and subsequent efforts in the lab and field will improve the robustness of the platform and its measurements. Our measurements readily encapsulate the spatial variability of albedo across landscapes that is not discernable in coarser resolution satellite data. Our efforts should be interpreted as a first stage to directly address the timely, complex challenge of improved measurements and models of albedo [13]. These improvements will facilitate workflows to measure albedo at the hillslope and small watershed scale, greatly expanding from the current status quo of point-based measurements and broad scale remote sensing. These insights will provide better data for more geographically focused energy and water balance simulations, critical for improved hydrological modelling. Additionally, subsequent data from AAVs present great opportunities to augment space-borne calibration and validation measurements. These new data will not be tethered to a fixed location and have the inherent capacity to measure across rugged and hazardous terrain. While this study focuses on 11 ha total, this approach could easily be scaled and flown in other snowy mountains across the Earth.
All of the data presented in this manuscript have been published online (https://doi.org/10.5281/zenodo.3386418, [43]) and are licensed under Creative Commons v.4.
Author Contributions
Conceptualization, E.A.S.; methodology, E.A.S., A.M.; software, E.A.S., A.M.; validation, E.A.S., A.M.; formal analysis, E.A.S., A.M., J.H., and C.G.; investigation, E.A.S., A.M. and J.H.; resources, E.A.S., J.H., and S.T.; data curation, E.S, A.M.; writing—original draft preparation, E.A.S.; writing—review and editing, E.A.S., A.M., J.H., C.G., and S.T.; visualization, E.A.S.; supervision, E.A.S.; project administration, E.S; funding acquisition, E.A.S.; All authors have read and agreed to the published version of the manuscript.
Funding
This research was funded by an incubator grant from the Earth Science Information Partners (ESIP) and ESIP Labs.
Acknowledgments
The authors would like to thank Victor Cassella at Kipp & Zonen for providing the PR1 radiometers and for his technical expertise. Additionally, we would like to thank Bryan Scherer at Montana State University for assistance in calibrating the pyranometers at the Montana State University weather station operated by Joseph A. Shaw. The Yellowstone Club, Doug McCabe, and their ski patrol were gracious in facilitating access to the study area and for logistical support. Finally, we would like to thank the two peer reviewers for their suggestions and feedback that improved this manuscript.
Conflicts of Interest
While the authors mention several companies and their products in this manuscript, it is provided for informational purposes only. The authors do not have a conflict of interest in providing these details.
Appendix A
Table A1.
Specifications of the DJI Matrice 210 V2 as provided by DJI [44].
Table A1.
Specifications of the DJI Matrice 210 V2 as provided by DJI [44].
| Dimensions | Unfolded, propellers and landing gears included, 883 × 886 × 398 mm |
| Folded, propellers and landing gears excluded, 722 × 282 × 242 mm | |
| Weight | Approx. 4.8 kg (with two TB55 batteries); |
| Max Takeoff Weight | 6.14 kg |
| Max Payload | 1.34 kg |
| Operating Frequency | 2.4000–2.4835 GHz; 5.725–5.850 GHz |
| Hovering Accuracy (P-mode with GPS) | Vertical: ± 1.64 feet (±0.5 m) or ± 0.33 feet (±0.1 m, Downward Vision System enabled) |
| Horizontal: ± 4.92 feet (±1.5 m) or ± 0.98 feet (±0.3 m, Downward Vision System enabled) | |
| Max Angular Velocity | Pitch: 300°/s, Yaw: 120°/s |
| Max Pitch Angle (Dual Downward Gimbal/Single Upward Gimbal) | S-mode: 30°; P-mode: 30° (Forward Vision System enabled: 25°); A-mode: 30° |
| Max Pitch Angle (Single Downward Gimbal (Gimbal Connector I)) | S-mode: 35°; P-mode: 30° (Forward Vision System enabled: 25°); A-mode: 30° |
| Max Ascent Speed | 16.4 ft/s (5 m/s) |
| Max Descent Speed (vertical) | 9.8 ft/s (3 m/s) |
| Max Speed (Dual Downward Gimbal/Single Upward Gimbal) | S-mode/A-mode: 73.8 kph (45.9 mph); P-mode: 61.2 kph (38 mph) |
| Max Speed (Single Downward Gimbal (Gimbal ConnectorI)) | S-mode/A-mode: 81 kph (50.3 mph); P-mode: 61.2 kph (38 mph) |
| Max Service Ceiling Above Sea Level | 3000 m, with 1760S propellers |
| Max Wind Resistance | 39.4 ft/s (12 m/s) |
| Max Flight Time (with two TB55 batteries) | M210 V2: 34 min (no payload), 24 min (takeoff weight: 6.14 kg) |
| Supported DJI Gimbals | Zenmuse X4S/X5S/X7/XT/XT2/Z30 |
| Supported Gimbal Configurations | Single Downward Gimbal, Dual Downward Gimbals, Single Upward Gimbal |
| GNSS | M210 V2: GPS+GLONASS; |
| Operating Temperature | −20° to +50 °C |
Appendix B
Table A2.
Specifications of the Kipp & Zonen SMP3 as provided by Kipp & Zonen [30].
Table A2.
Specifications of the Kipp & Zonen SMP3 as provided by Kipp & Zonen [30].
| Spectral range (50% points) | 310–2700 nm |
| Response time (63%) | <0.1 s |
| Response time (95%) | <0.2 s |
| Zero offset A | <15 W/m² |
| Zero offset B | <5 W/m² |
| Directional response (up to 80° with 1000 W/m² beam) | 20 W/m² |
| Temperature dependence of sensitivity (−20 °C to +50 °C) | <3% |
| Analogue output (-V version) | 0–1 V |
| Analogue output (-A version) | 4–20 mA |
| Digital output | 2-wire RS-485 |
References
- Dickinson, R.E. Land surface processes and climate—Surface albedos and energy balance. In Advances in Geophysics; Elsevier: London, UK, 1983; Volume 25, pp. 305–353. [Google Scholar]
- Franch, B.; Vermote, E.F.; Claverie, M. Intercomparison of Landsat albedo retrieval techniques and evaluation against in situ measurements across the US SURFRAD network. Remote Sens. Environ. 2014, 152, 627–637. [Google Scholar] [CrossRef]
- Sun, Q.; Wang, Z.; Li, Z.; Erb, A.; Schaaf, C.B. Evaluation of the global MODIS 30 arc-second spatially and temporally complete snow-free land surface albedo and reflectance anisotropy dataset. Int. J. Appl. Earth Obs. Geoinf. 2017, 58, 36–49. [Google Scholar] [CrossRef]
- Lucht, W.; Schaaf, C.; Strahler, A.H.; d’Entremont, R. Remote Sensing of Albedo Using the BRDF in Relation to Land Surface Properties. In Observing Land from Space: Science, Customers and Technology; Verstraete, M.M., Menenti, M., Peltoniemi, J., Eds.; Springer Netherlands: Dordrecht, The Netherlands, 2000; ISBN 978-0-306-48124-6. [Google Scholar]
- He, T.; Liang, S.; Song, D.-X. Analysis of global land surface albedo climatology and spatial-temporal variation during 1981–2010 from multiple satellite products. J. Geophys. Res. Atmos. 2014, 119, 10,210–281,298. [Google Scholar] [CrossRef]
- Dozier, J. Mountain hydrology, snow color, and the fourth paradigm. Eos, Trans. Am. Geophys. Union 2011, 92, 373. [Google Scholar] [CrossRef]
- Sproles, E.A.; Crumley, R.L.; Nolin, A.W.; Mar, E.; Moreno, J.I.L. SnowCloudHydro—A New Framework for Forecasting Streamflow in Snowy, Data-Scarce Regions. Remote Sens. 2018, 10, 1276. [Google Scholar] [CrossRef]
- Coakley, J.A. Reflectance and Albedo, Surface. Encycl. Atmos. Sci. 2003, 1914–1923. [Google Scholar] [CrossRef]
- DeWalle, D.R.; Rango, A. Principles of Snow Hydrology; Cambridge University Press: Cambridge, UK, 2008; ISBN 0521823625. [Google Scholar]
- Wiscombe, W.J.; Warren, S.G. A Model for the Spectral Albedo of Snow. I: Pure Snow. J. Atmos. Sci. 1980, 37, 2712–2733. [Google Scholar] [CrossRef]
- Winter, K.J.-P.M.; Kotlarski, S.; Scherrer, S.C.; Schär, C. The Alpine snow-albedo feedback in regional climate models. Clim. Dyn. 2017, 48, 1109–1124. [Google Scholar] [CrossRef]
- Webster, C.; Jonas, T. Influence of canopy shading and snow coverage on effective albedo in a snow-dominated evergreen needleleaf forest. Remote Sens. Environ. 2018, 214, 48–58. [Google Scholar] [CrossRef]
- National Academies of Sciences Engineering and Medicine. Thriving on Our Changing Planet: A Decadal Strategy for Earth Observation from Space; National Academies Press: Washington, DC, USA, 2018. [Google Scholar]
- Bair, E.H.; Rittger, K.; Skiles, S.M.; Dozier, J. An examination of snow albedo estimates from MODIS and their impact on snow water equivalent reconstruction. Water Resour. Res. 2019. [Google Scholar] [CrossRef]
- NASA—Applied Sciences Program Water Resources Program | Applied Sciences Website. Available online: https://appliedsciences.nasa.gov/programs/water-resources-program (accessed on 22 May 2018).
- Hall, D.K.; Riggs, G.A. MODIS/Terra Snow Cover Daily L3 Global 500m Grid, Version 6; NASA National Snow and Ice Data Center Distributed Active Archive Center: Boulder, CO, USA, 2016. [Google Scholar] [CrossRef]
- He, T.; Liang, S.; Wang, D.; Cao, Y.; Gao, F.; Yu, Y.; Feng, M. Evaluating land surface albedo estimation from Landsat MSS, TM, ETM +, and OLI data based on the unified direct estimation approach. Remote Sens. Environ. 2018, 204, 181–196. [Google Scholar] [CrossRef]
- Román, M.O.; Gatebe, C.K.; Shuai, Y.; Wang, Z.; Gao, F.; Masek, J.G.; He, T.; Liang, S.; Schaaf, C.B. Use of in situ and airborne multiangle data to assess MODIS-and Landsat-based estimates of directional reflectance and albedo. IEEE Trans. Geosci. Remote Sens. 2013, 51, 1393–1404. [Google Scholar] [CrossRef]
- Wang, Z.; Schaaf, C.B.; Strahler, A.H.; Chopping, M.J.; Román, M.O.; Shuai, Y.; Woodcock, C.E.; Hollinger, D.Y.; Fitzjarrald, D.R. Evaluation of MODIS albedo product (MCD43A) over grassland, agriculture and forest surface types during dormant and snow-covered periods. Remote Sens. Environ. 2014, 140, 60–77. [Google Scholar] [CrossRef]
- Kharbouche, S.; Muller, J.-P.; Gatebe, C.K.; Scanlon, T.; Banks, A.C. Assessment of Satellite-Derived Surface Reflectances by NASA’s CAR Airborne Radiometer over Railroad Valley Playa. Remote Sens. 2017, 9, 562. [Google Scholar] [CrossRef]
- Levy, C.; Burakowski, E.; Richardson, A. Novel Measurements of Fine-Scale Albedo: Using a Commercial Quadcopter to Measure Radiation Fluxes. Remote Sens. 2018, 10, 1303. [Google Scholar] [CrossRef]
- Román, M.O.; Schaaf, C.B.; Woodcock, C.E.; Strahler, A.H.; Yang, X.; Braswell, R.H.; Curtis, P.S.; Davis, K.J.; Dragoni, D.; Goulden, M.L.; et al. The MODIS (Collection V005) BRDF/albedo product: Assessment of spatial representativeness over forested landscapes. Remote Sens. Environ. 2009, 113, 2476–2498. [Google Scholar] [CrossRef]
- Rennie, J.J.; Lawrimore, J.H.; Gleason, B.E.; Thorne, P.W.; Morice, C.P.; Menne, M.J.; Williams, C.N.; de Almeida, W.G.; Christy, J.R.; Flannery, M.; et al. The international surface temperature initiative global land surface databank: Monthly temperature data release description and methods. Geosci. Data J. 2014, 1, 75–102. [Google Scholar] [CrossRef]
- Arnold, N.S.; Rees, W.G.; Hodson, A.J.; Kohler, J. Topographic controls on the surface energy balance of a high Arctic valley glacier. J. Geophys. Res. Earth Surf. 2006, 111. [Google Scholar] [CrossRef]
- Fonstad, M.A.; Dietrich, J.T.; Courville, B.C.; Jensen, J.L.; Carbonneau, P.E. Topographic structure from motion: A new development in photogrammetric measurement. Earth Surf. Process. Landforms 2013, 38, 421–430. [Google Scholar] [CrossRef]
- Bühler, Y.; Marty, M.; Egli, L.; Veitinger, J.; Jonas, T.; Thee, P.; Ginzler, C. Snow depth mapping in high-alpine catchments using digital photogrammetry. Cryosphere 2015, 9. [Google Scholar] [CrossRef]
- Acumen Research and Consulting. Unmanned Aerial Vehicle (UAV) Market (By Type: Fixed Wing, Multi Rotor, Single Rotor, Hybrid; By Component: Hardware (Camera, Sensors, Others), Software; By UAV Size: Small UAV, Medium UAV, Large UAV; By Application: Military & Defense, Retail, Media & En. 2020. Available online: https://www.acumenresearchandconsulting.com/unmanned-aerial-vehicle-uav-market (accessed on 28 February 2020).
- Borovytsky, V.; Averin, D. Optical sensor for drone coordinate measurements. Opt. Photonics Adv. Dimens. Metrol. 2020, 11352, 113521J. [Google Scholar]
- Ryan, J.C.; Hubbard, A.; Box, J.E.; Brough, S.; Cameron, K.; Cook, J.M.; Cooper, M.; Doyle, S.H.; Edwards, A.; Holt, T.; et al. Derivation of High Spatial Resolution Albedo from UAV Digital Imagery: Application over the Greenland Ice Sheet. Front. Earth Sci. 2017, 5, 40. [Google Scholar] [CrossRef]
- Kipp & Zonen Smart Pyranometer CMP3—Kipp & Zonen. Available online: https://www.kippzonen.com/Product/201/SMP3-Pyranometer#.XTir15NKhN0 (accessed on 24 July 2019).
- Kipp & Zonen. Instruction Manual—RaZON + ALL-IN-ONE Solar Monitoring System; Kipp & Zonen: Delft, The Netherlands, 2017. [Google Scholar]
- Esri World Imagery Basemap (Scale 1m). Available online: https://services.arcgisonline.com/arcgis/rest/services/World_Imagery/MapServer/0 (accessed on 28 February 2020).
- Datfile DatCon. 2019. Available online: https://github.com/BudWalkerJava/DatCon (accessed on 28 February 2020).
- The MathWorks MATLAB and Statistics Toolbox Release. 2018. Available online: https://www.mathworks.com/help/stats/release-notes.html (accessed on 24 July 2019).
- Bogren, W.S.; Burkhart, J.; Kylling, A. Tilt error in cryospheric surface radiation measurements at high latitudes: A model study. Cryosph. 2016, 10, 613–622. [Google Scholar] [CrossRef]
- Dwyer, J.L.; Roy, D.P.; Sauer, B.; Jenkerson, C.B.; Zhang, H.K.; Lymburner, L.; Dwyer, J.L.; Roy, D.P.; Sauer, B.; Jenkerson, C.B.; et al. Analysis Ready Data: Enabling Analysis of the Landsat Archive. Remote Sens. 2018, 10, 1363. [Google Scholar] [CrossRef]
- NASA Specifications for MODIS Instrument. Available online: https://modis.gsfc.nasa.gov/about/specifications.php (accessed on 28 August 2019).
- Strahler, A.H.; Muller, J.; Lucht, W.; Schaaf, C.; Tsang, T.; Gao, F.; Li, X.; Lewis, P.; Barnsley, M.J. MODIS BRDF/albedo product: Algorithm theoretical basis document version 5.0. MODIS Doc. 1999, 23, 42–47. [Google Scholar]
- Liang, S. Narrowband to broadband conversions of land surface albedo I algorithms. Remote Sens. Environ. 2001. [Google Scholar] [CrossRef]
- Olmedo, G.F.; Ortega-Farías, S.; Fonseca-Luengo, D.; de la Fuente-Sáiz, D.; Fuentes Peñailillo, F.; Munafó, M.V. Albedo: Calculates Broadband Albedo from Landsat data in Midraed/Water: Actual Evapotranspiration with Energy Balance Models. 2019. Available online: https://rdrr.io/cran/water/man/albedo.html (accessed on 28 February 2020).
- Molotch, N.P.; Bales, R.C. Comparison of ground-based and airborne snow surface albedo parameterizations in an alpine watershed: Impact on snowpack mass balance. Water Resour. Res. 2006, 42. [Google Scholar] [CrossRef]
- AghaKouchak, A.; Farahmand, A.; Melton, F.S.; Teixeira, J.; Anderson, M.C.; Wardlow, B.D.; Hain, C.R. Remote sensing of drought: Progress, challenges and opportunities. Rev. Geophys. 2015, 53, 452–480. [Google Scholar] [CrossRef]
- Sproles, E.; Mullen, A.; Hendrikx, J.; Gatebe, C.; Taylor, S. Snow Albedo Measurements in Mountainous Regions Using a Dual-sensor Unmanned Aerial Vehicle (UAV) 2019. AGUFM 2019, 2019, IN14A-04. [Google Scholar]
- DJI Specifications—Matrice 200 Series V2. Available online: https://www.dji.com/matrice-200-series-v2/info (accessed on 4 September 2019).


© 2020 by the authors. Licensee MDPI, Basel, Switzerland. This article is an open access article distributed under the terms and conditions of the Creative Commons Attribution (CC BY) license (http://creativecommons.org/licenses/by/4.0/).