Abstract
Soil water content is an important hydrological parameter, which is difficult to measure at a field scale due to its spatial and temporal heterogeneity. The Cosmic Ray Neutron Sensor (CRNS) is a novel and innovative approach to estimate area-averaged soil water content at an intermediate scale, which has been implemented across the globe. The CRNS is moderated by all hydrogen sources within its measurement footprint. In order to isolate the soil water content signal from the neutron intensity, the other sources of hydrogen need to be accounted for. The CRNS’s applications are not only limited to soil water content estimation, as it can potentially be used to monitor biomass. The Two-Streams clear-felling provided the unique opportunity to monitor the cosmic ray neutron intensities before, during, and after the clear-felling. The cadmium-difference method was used to obtain the pure thermal and epithermal neutron intensities from the bare and moderated detectors. The study concluded that the presence of biomass within the site reduced the epithermal neutron intensity by 12.43% and the N0 value by 13.8%. The use of the neutron ratio to monitor biomass was evaluated and changes in the neutron ratio coincided with biomass changes and resulted in a high correlation (R2 of 0.868) with the normalized difference vegetation index (NDVI) and (R2 of 0.817) leaf area index (LAI). The use of the CRNS to simultaneously monitor soil water content and biomass will be beneficial in providing more reliable soil water content estimates, provide biomass estimates at a field scale, and aid in understanding the dynamics between soil water content and vegetation.
1. Introduction
Soil water content is one of the key state variables in the soil–vegetation–atmosphere continuum, which is due to its role in the exchange of water and energy at the soil surface [1,2]. Soil water content is of great importance for several applications throughout numerous disciplines,; however, its quantification at a range of scales is challenging due to its spatial and temporal heterogeneity [3]. Accurate knowledge of the soil water content at a range of spatial scales is critical for water management, improved weather prediction, flood forecasting, and efficient irrigation scheduling [4,5].
In recent years, the Cosmic Ray Neutron Sensor (CRNS) has been developed and deployed across the globe to provide area-averaged soil water content estimates at an intermediate scale, which circumvents the shortcomings of currently existing soil water content measurement methods (at this scale) [6,7]. The CRNS is a novel non-invasive technique, which utilizes the low-energy cosmic ray neutron intensity above the ground surface, which is primarily moderated by the hydrogen content within the CRNS’s measurement footprint. [8]. Since CRNS avoids the use of an active neutron source, the method can be implemented in various sites and appears to provide reliable estimates of the soil water content once calibrated [9,10].
Recent improvements in soil water content estimation techniques are demonstrating optimal performances at intermediate scales. Studies conducted by Bauer-Marschallinger et al. [11] and El Hajj et al. [12] utilized Sentinel satellite data to provide soil water content estimates at high spatial resolutions (1 km), whilst Strati et al. [13] monitored soil water content at a fine spatial resolution (~25 m radius) using gamma ray spectroscopy.
The CRNS functions at its most fundamental level as a hydrogen mass detector, where the observed change in neutron intensity is dependent on all changes of hydrogen present in its support volume [7]. The abundance of hydrogen atoms in the air and soil largely controls the removal rate of low-energy neutrons from the support volume [14]. These hydrogen atoms are present as soil water, lattice water, water in soil organic carbon, below and above-ground biomass, atmospheric water vapour, snow, water intercepted by vegetation, and water on the ground (ponding) [15,16,17]. These different hydrogen sources have different temporal variability and can be static (lattice water), quasi-static (soil organic matter, biomass), and dynamic (soil water, atmospheric water vapour) [18,19]. Hydrogen is an essential element in the moderation of these cosmic ray neutrons due to hydrogen’s physical properties and high concentration near the land surface [6]. Soil water is generally the major source of hydrogen at the land surface (60–80% of the mass in the CRNS support volume [19]) and is therefore suitable to be estimated from the changes in neutron intensity. In order to isolate the soil water signal from the neutron intensity, the other sources of hydrogen need to be accounted for. The high amount of hydrogen present in pools other than soil water reduces the accuracy of CRNS’s soil water content estimates [1]. The implementation of the CRNS has been rapidly growing on a global scale, as the method provides root-zone soil water content at an unprecedented spatial scale [20].
The applications of the CRNS are not limited to the estimation of soil water content, as the instrument is currently used to estimate other pools of hydrogen, which include snow depth and biomass [21]. Biomass is a significant source of hydrogen in certain land uses (forestry and agriculture). Currently, there are only a handful of methods used to quantify biomass. These include direct sampling, forest allometry, and remote sensing. The use of the CRNS to estimate biomass is an ongoing question, which has continuously gained attention. Since the inception of the CRNS, there have been several studies that have focused on the estimation of biomass using the CRNS. These initial studies investigated the correction of site biomass, to account for the attenuation of the cosmic ray neutron intensity by biomass, and to improve the accuracy of the CRNS’s soil water content estimates.
There have been several CRNS studies involving biomass (Table 1).

Table 1.
Cosmic ray neutron sensor studies involving biomass.
Biomass estimation is of great importance for a variety of applications, which include bioenergy, carbon sequestration, and wood production [6]. Accurate measurements of area-average biomass are difficult to obtain at scales consistent with measurements of mass and energy transfer (1 km) [23]. The potential use of the CRNS to estimate biomass is highly attractive, as it would allow for the effects of biomass to be removed when estimating soil water content, without the need for additional measurements, and simultaneous measurements of biomass and soil water content would be valuable in improving the understanding between plant growth and soil water content deficits [2].
This research study focused on the CRNS and its use to estimate soil water content in an Acacia mearnsii (black wattle) forest stand that was undergoing clear-felling. The clear-felling was within the Two-Streams Research Catchment, which has been equipped with a CRNS (since 2014). This presented a unique opportunity to monitor the soil water content before, during, and after the clear-felling to investigate the impacts that clear-felling has on soil water content. The long-term deployment of the CRNS in the catchment also presented the opportunity of using the CRNS to estimate biomass within a forested site. A second CRNS was also set up in the catchment on a mast, at a height of 18 m above the land surface, a few months before the clear-felling. The installation of a second CRNS at a different height was designed to study the changes in the neutron intensities due to the clear-felling and allowed for the evaluation of altitude on neutron dynamics. It is important to note that the clear-felling occurred during a drought period, such that the hypothesized effects due to clear-felling are challenging to fully assess.
2. Materials and Methods
2.1. Study Site
The Two-Streams Research Catchment, which is located 70 km (north-east) from the city of Pietermaritzburg, is one of South Africa’s most intensively studied long-term forestry research catchments, with almost two decades of detailed hydrological process observations [27]. The Two-Streams Catchment (Figure 1) situated in the Seven Oaks district, in KwaZulu-Natal [28]. The altitude of the site ranges from 1080 to 1125 m. The site is in the summer rainfall region and the mean annual rainfall of the area ranges from 659 to 1139 mm. The region is susceptible to moderate frosts, heavy mists, droughts, and hail [27]. The heavy mists are significant in providing additional precipitation in the area, which gets intercepted onto the above-ground forest biomass. From past water-use studies conducted at the Two-Streams site, the trees used more water (transpiration) than they received through precipitation. Therefore, the trees were utilizing groundwater.
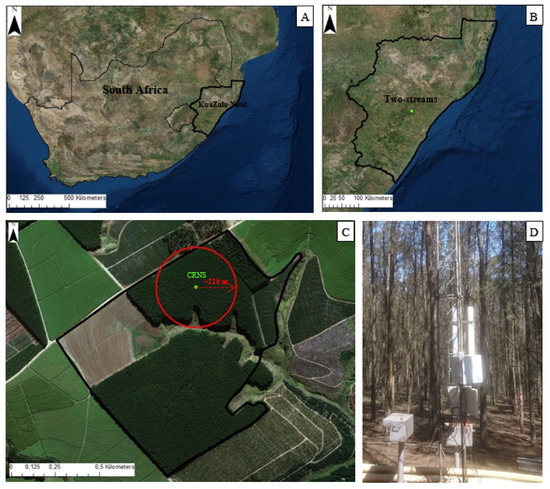
Figure 1.
The location of the Two-Streams Research Catchment in KwaZulu-Natal, South Africa is shown in plates (B) and (A), respectively. The position of the CRNS’s and footprint in the Acacia mearnsii plantation are shown in (C). The lower CRNS mounted on the lattice mast is shown in (D).
The natural vegetation of the area was previously forb-rich tall Themeda triandra grasslands; however, due to the high arable potential of the area, only a few patches remain [28]. Forestry is the most widespread land use in the area, as it is ecologically suitable, whilst sugarcane is less widespread and is grown on sites where the drainage of cold air is good [28]. The CRNS was set up in the black wattle forest stand and had a 210-m measurement radius, which was calculated using equations from Köhli et al. [29], resulting in a measurement footprint area of 0.1385 km2.
The Two-Streams Research Catchment had a CRNS at the height of 2 m, which has been operational since 2014. A second CRNS was installed on the same tower, at the height of 18 m, on the 16th October 2017. The tower CRNS had a 211-m measurement radius, which was calculated using equations from Köhli et al. [29]. Therefore, the tower CRNS had a larger measurement footprint (0.1398 km2) than the ground CRNS (0.1385 km2). The aim of installing a CRNS on the tower was to obtain cosmic ray neutron data, to firstly support any changes in neutron intensity due to the clear-felling and to investigate the effects of elevation on cosmic ray neutron dynamics (Figure 2).

Figure 2.
Schematic diagram of the lower (ground) and upper (tower) CRNS detectors in the Acacia mearnsii plantation in the Two-Streams Catchment.
2.2. Acacia Mearnsii (Black Wattle)
Black wattle is one of the few tree crops of which both the bark and timber are utilized. Black wattle, which is a leguminous tree native to Australia, was first introduced into South Africa in the mid-1800s [30]. In the following years, it was planted extensively to satisfy demands from a burgeoning forestry industry, and for the production of tannin from the bark, as well as for pulp used in the production of high-quality paper. Black wattle, which is a tall-growing (15.5–21.5 m [31]) and thorn-less evergreen tree, is the most widespread alien invasive tree in South Africa [32]. Black wattle remains a valuable tree under commercial plantations and it possesses positive characteristics. For example, it is an efficient nitrogen fixer and is also used to stabilize slopes (reduce erosion), as it can grow on steep slopes [30]. Black wattle is evergreen and therefore utilizes a large amount of the water throughout the year when compared with the natural seasonal grassland it has replaced [32].
2.3. Two-Streams Research Catchment Biomass Changes
The use of Google satellite imagery nicely illustrates the biomass changes within the Two-Streams Research Catchment from 2005 to 2018 (Figure 3a–f): (a) The site on the 6th March 2005, one year before the black wattle was planted; (b) the site on the 10th February 2010, the black wattle stand was ~four years old; (c) the site on the 26th August 2013, the black wattle stand was ~seven years old; (d) the site on the 29th July 2015, the black wattle stand was ~nine years old; (e) the site on the 5th July 2017, the black wattle stand was ~11 years old; and (f) the site on the 8th June 2018 a few months after the clear-felling. The images were taken at different growth stages and at different seasons. The black wattle stands were green and “full”, even in the dry season (winter months).

Figure 3.
Two-Streams Research Catchment biomass changes in the Acacia mearnsii plantation from 2005 to 2019. Plate (a) represents the cleared catchment in March 2005, plate (b) four years of growth (February 2010), plates (c–e) show 2–3-year increments up to July 2017, and plate (f) shows the post clear-felling (June 2018).
2.4. Clear-Felling Procedure and Potential Impacts
Clear-felling is the removal of all the trees from an area, in which the trunks are removed from the site and the logging residue (branches and foliage) is left on the ground to dry and is subsequently burnt at a later stage. Clear-felling is a method of regenerating an evenly aged stand, in which the new stand develops in a fully exposed microclimate. The clear-felling at the Two-Streams Research Catchment was conducted in stages and not all at once, which resulted in the clear-felling spanning over several weeks. Initially, every second tree row was removed; therefore, the hydrogen source attributed to the above-ground biomass decreased in stages and not all at once.
Clear-felling results in full sunlight conditions on the soil surface, which leads to an increase in air and soil temperatures near the surface. The relative humidity decreases and there is an increase in soil surface evaporation. The soil water content increases as the transpiration ceases when the trees are removed. The interception of precipitation decreases, which leads to more water reaching the soil surface; this leads to an increase in infiltration, percolation, and subsequent subsurface flow. Due to the warmer and wetter conditions at the surface, there is an increase in decomposition, which leads to more nutrients being released. These changes are favourable for the establishment and development of the next crop.
The method of clear-felling also has disadvantages, which includes a loss of habitat, the threat of invasive species, the release of stored carbon and a potential increase in erosion and soil damage. At the Two-Streams site, the forest canopy intercepted mist, which was a significant source of precipitation within this site. The loss of the canopy would result in the mist not being intercepted and an overall decrease in the precipitation (from mist) at the site.
2.5. The Cosmic Ray Neutron Sensor
The ground and tower CRNS consists of two neutron detectors, whose measurements can be differentiated into two neutron energy ranges, which are both sensitive to hydrogen [29]. The moderated neutron detector measures epithermal neutrons (above 0.5 eV) and the bare neutron detector measures thermal neutrons (0–0.5 eV) [33]. It is also important to note that fast neutrons have energies, which range from 10–1000 eV; therefore, fast neutrons are included in the epithermal neutron range [34]. The moderated detector is shielded by a 2.54-cm-thick polyethylene that serves two purposes, which are to moderate (slow down) the epithermal neutrons so that they can be counted and to block out the thermal neutrons [6]. Epithermal neutrons are continuously losing energy by collisions with atomic nuclei (and other neutrons) and will eventually be transformed into thermal neutrons [2]. The cosmic ray radiation, which is naturally occurring, can be separated into primary cosmic ray neutrons that originate in space and secondary cosmic ray neutrons, which are created by interactions with matter in the atmosphere [1]. The cosmic ray neutron intensity (count rate) and sensing volume are dependent on the total amount of hydrogen within the CRNS’s measurement footprint. As such, the extraordinary high stopping power of hydrogen makes the technique work [8,33,35].
Although the moderated detector primarily measures epithermal neutrons and the bare detector primarily measures thermal neutrons, the exact energy sensitivity of the detectors are unknown [34]. In order to obtain pure thermal and epithermal neutron intensities from the moderated and bare detectors, the epithermal contribution has to be removed from the bare detector and the thermal contribution has to be removed from the moderated detector [34]. The contribution of epithermal and thermal neutrons measured by the moderated and bare detectors can be determined using the cadmium-difference method.
The epithermal and thermal neutron intensities were obtained from the moderated and bare detectors, following the procedure outlined in Andreasen et al. [34]:
where B is the bare neutron intensity (counts per hour) (cph)), M is the moderated neutron intensity(cph), α1 (0.0290) is the fraction of the epithermal neutron intensity measured by the moderated detector, α2 (0.445) is the fraction of the thermal neutron intensity measured by the bare detector, and β1 (12.2 cph) and β2 (−1.53 cph) are offsets. The parameters α1, α2, β1, and β2, were obtained from Andreasen et al. [34].
The thermal and epithermal intensities (cph) were obtained by rearranging Equations (1) and (2):
The horizontal footprint of the CRNS is defined as the area around the probe in which 86% of the neutrons arise [8]. Due to the low interaction probability of neutrons with air molecules, the measured particles can travel hundreds of meters from the soil to the detector [36]. The radius of the measurement footprint was initially believed to be 300 m at sea level; however, a recent study by Köhli et al. [29] revised the measurement footprint radius to 240 m at sea level.
The effective measurement depth is the thickness at which 86% of the counted neutrons arise, which depends strongly on the soil water content [8]. The measurement depth ranges from 0.12 to 0.7 m and is inversely proportional to the soil water content [33]. The decrease in the measurement depth as a result of an increase in the soil water content is nonlinear [37]. The effective measurement depth of the CRNS at the Two-Streams site ranges from 0.139 and 0.297 m, which was calculated using the procedure outlined in [36].
The CRNS measures the neutron intensity, which is dependent on all sources and variations in hydrogen within the instrument’s measurement footprint. The soil water content can be determined by isolating the soil water signal within the neutron intensity, which is achieved by accounting for all the sources and variations of hydrogen [17]. This is carried out by the correction and calibration procedures.
2.6. Corrections and Calibration
To isolate the effect of soil water on the measured neutron count, it is first necessary to account for the variations in the atmospheric water vapour [38], which has the same moderating effect as the soil water content, and variations in external factors, which include atmospheric pressure and the incoming neutron flux intensity [9,33]. The procedure in carrying out these corrections are well documented in several past research studies [9,37]. Once these corrections have been carried out, the corrected neutron counts are dependent on the soil water, lattice water, soil organic carbon, and biomass, which will be addressed in the calibration.
The standard N0 (calibration) method presented by Desilets et al. [39] was undertaken. The calibration required simultaneous measurements of area-averaged soil water content and neutron count [35,40]. The site-specific calibrations implicitly included vegetation effects on the observed neutron counts [23,37]. Therefore, for sites with non-varying variations in biomass (grassland), the biomass correction is not required, as the change in hydrogen of the biomass within the site is insignificant and can be ignored in the calibration. The lattice water and the water in soil organic carbon can significantly affect the neutron count and was therefore a necessary source of hydrogen to measure and forms part of the standard calibration procedure [37]. The calibration equation proposed by Desilets et al. [39] is as follows:
where N is the corrected neutron counts, and θt is the total water (g g−1), which consists of the gravimetric soil water content (θp), lattice water (θlw), and soil organic carbon (θsoc) all in units of g g−1. To convert from the gravimetric soil water content to the volumetric soil water content, both sides must be multiplied by the bulk density [21]. A biomass correction factor has been incorporated into a revised calibration equation. However, for the purpose of this research, the standard calibration equation was used. Therefore, the biomass was explicitly accounted for in each N0 (calibration) value.
Four calibrations were conducted at the Two-Streams site. Three calibrations were conducted prior to the clear-felling and one calibration was conducted after clear-felling. The calibrations conducted before the clear-felling were on the 4th April 2016, 30th September 2016, and the 21st April 2017. The calibration after the clear-felling was conducted on the 6th August 2018. The lattice water (13.4 g g−1), bulk density (1.2 g cm−2), and the soil organic carbon (0.03 g g−1) values of the site were determined. The clear-felling at the Two-Streams site commenced on the 10th January 2018 and was conducted over 2–3 weeks. The felled trunks were removed immediately to a staging point away from the CRNS footprint. A mean moisture content of 41% was obtained from previous research conducted on the site (this value would not have varied over time). The residues were burnt, cleared, and mulched. Therefore, it is assumed that these residues would not have been detectable. Ideally, one calibration should have been conducted a day before the clear-felling and one calibration should have been conducted once the clear-felling had been completed. However, this did not happen as the clear-felling went ahead of schedule and the site was off limits due to safety rules for the period in which the clear-felling occurred. The planned calibration a few days after the clear-felling was not possible, as the residual biomass was burning, and a calibration could not be conducted. Therefore, a post clear-felling calibration was conducted several months later.
3. Methods of Biomass Estimation
The common methods of biomass estimation are in situ sampling, forest allometry, and remote sensing [23]. The CRNS is a novel technique of soil water content estimation that is affected by all hydrogen sources within its measurement footprint. Therefore, the CRNS can provide a novel approach to estimate biomass.
3.1. In Situ Sampling
In situ sampling is the traditional/conventional approach used to quantify biomass. This method involves the physical harvesting of plants/trees. These harvested plants/trees are first weighed for their mass, before being dried and subsequently weighed once more, to determine the change in weight. The change in weight is the amount of water that the plant/tree contained and is used to determine the dry biomass. The advantage of this method is that it is accurate on an individual sample scale. The disadvantages of this method are that it is a destructive approach (repeat sampling cannot be done on the same tree), it is time and labour consuming, and the spatial heterogeneity is difficult to extrapolate [41]. In situ sampling was not conducted for this research study; however, past research conducted in the region was used. A study by Dovey et al. [31] determined a dry above-ground biomass of 148 t ha−1 (14.8 kg m−2) of Acacia mearnsii by destructive sampling in the Mistley region (same region as the Two-Streams site). The tree age, management practices, tree heights, and diameter at breast height (DBH) were very similar to that of the black wattle plantation at the Two-Streams site and therefore the above-ground biomass was assumed to be similar.
3.2. Forest Allometry
Forest allometry (biomass estimation equations) is used to estimate the above-ground biomass based on tree parameters, such as the DBH and tree height. The use of forest allometry is a common and cost-effective method to estimate above-ground biomass [41]. The average DBH at the Two-Streams site was determined to be 150 mm and the average tree height was determined to be 18.5 m. There are several forest allometry equations; however, this research did not intend to compare allometric equations and since there are past relatable above-ground biomass measurements, the use of forest allometry was not be explored.
3.3. Remote Sensing
The remote sensing of biomass is dependent on the principles of plant light reflectance [41]. The advantage of this method is that large spatial scales are obtained and there is a regular (satellite dependent) temporal resolution. Common remote sensing metrics used to quantify vegetation are the normalized difference vegetation index (NDVI) and the leaf area index (LAI). The NDVI/LAI value increases with increased green biomass.
For the purpose of this research, Landsat 8 imagery was obtained from EarthExplorer. The Landsat 8 products have a 16-day temporal resolution and a 30-m spatial resolution. The data were processed in the Integrated Land and Water Information System (ILWIS) to obtain the NDVI and the LAI. The 30-m resolution of the Landsat 8 product resulted in several pixels within the CRNS footprint. Therefore, the average NDVI and LAI values were obtained for each observation date. The Landsat 8 imagery is on a 16-day temporal resolution, which is further limited using only cloud-free observation days. The equations utilized in ILWIS to calculate NDVI and LAI from the Landsat 8 bands are as follows:
where NIR is the near-infrared band and VIS is the visible red band:
Landsat 8 data for the following days: 11th of February 2017, 16th of April 2017, 3rd June 2017, 7th September 2017, 28th December 2017, 13th January 2018, 5th May 2018, and the 22nd June 2018, were processed and the NDVI and LAI of each data day were obtained.
3.4. Cosmic Ray Neutron Sensor
The CRNS is fundamentally a hydrogen detector, which can accurately estimate soil water content once all the other sources of hydrogen are accounted for. The accurate estimation of soil water content is possible as it is (generally) the largest contributor of hydrogen to the CRNS signal. Recent studies have shown that the use of the neutron ratio, which is the ratio of thermal to epithermal neutrons, correlates well with direct estimates of biomass. The neutron ratio was determined using the equation proposed by Tian et al. [26] and revised by Jakobi et al. [2]:
where Nr is the neutron ratio, E is the epithermal neutron count, T is the thermal neutron count, mean E is the time-averaged epithermal neutron count (over the data period), and mean T is the time-averaged thermal neutron count (over the data period). The epithermal neutrons are subject to variations in the incoming cosmic ray neutron intensity, atmospheric water vapour, and air pressure. The thermal neutrons corrections have not been finalized by the scientific community; therefore, for the purpose of this research, the neutron ratio was determined using the corrected epithermal neutron counts and raw thermal neutron counts.
4. Results and Discussion
The results section is split into two sections. The first section evaluates the CRNS soil water content estimates before, during, and after the clear-felling using the CRNS at the bottom of the tower mast (ground), which has been operational in the Two-Streams Catchment since 2014. The second section investigates the use of the ground and tower CRNS’s epithermal and thermal neutrons to monitor biomass.
4.1. Evaluation of Cosmic Ray Neutron Sensor Soil Water Content Estimates
As previously mentioned, a total of three calibrations were conducted before clear-felling and one calibration was conducted after clear-felling. The dates, neutron counts, volumetric water content (VWC) (%), and N0 values are illustrated in Table 2. There is a noticeable increase in the neutron count due to the clear-felling. This was expected, as the clear-felling resulted in the removal of the above-ground biomass, which led to a reduction in the hydrogen present, with a concomitant decrease in the moderation of epithermal neutrons. The average N0 value for the forested calibrations was 2907.39. The clear-felling resulted in an increase in the N0 value (3369.20). The difference in the N0 value between the average “forested” calibrations (2907.39) and the “clear-felled” calibration (3369.20) was 461.81. Therefore, the presence of the above-ground forest biomass reduced the N0 value by 13.7%. The dry above-ground biomass was estimated to be 13.7 kg m−2, using the relationship identified by Franz et al. [25], which found a 1% decline in N0 for every 1 kg m−2 of biomass present for maize and soybean crops.
Table 2.
Two-Streams Catchment calibration information.
Daily average soil water content estimates (Figure 4) were created from the hourly time steps, as longer integration periods resulted in less uncertainty, due to the Poisson counting statistics associated with the method (standard deviation = N0.5). The daily time series illustrates two scenarios. The first (blue) is the CRNS soil water content estimates before, during, and after the clear-felling (calibrated with the average “forested” calibration value of 2907.39). Seasonality in the soil water content was seen, as the soil water content was higher (above ~15% VWC) in summer (wet period) and lower in winter (below ~15% VWC). The variability in soil water content was greater in the summer months, which can be attributed to increased rainfall events and the increase in total evaporation. The point at which the clear-felling was undertaken is clearly seen, as it was accompanied by a noticeable decrease (~10% VWC) in soil water content estimates (due to an increase in neutron intensity).

Figure 4.
Time series of daily CRNS soil water content estimates using the “forested” and “clear-felled” calibration values from January 2017 to August 2018 in the Acacia mearnsii plantation in the Two-Streams Catchment.
The second scenario (red) illustrates the soil water content estimates after the clear-felling, using the clear-felled calibration value (3369.20). The use of the clear-felled calibration value resulted in higher soil water content estimates (~15% VWC) when compared to the first scenario. Although this example is an extreme case in which the biomass has been removed, the need to account for changes in biomass was highlighted, particularly in cases with sudden temporal changes in biomass, such as in agriculture and forestry.
The calibration curves were produced using the neutron counts and VWC (%) before the clear-felling (forested) and after the removal of the biomass (clear-felled) (Figure 5). The difference between the forested and clear-felled curves is the difference in the amount of hydrogen within the measurement footprint, which resulted in the calibration curves having different N0 values.

Figure 5.
Calibration curves with biomass present (forested) and without the presence of biomass (clear-felled) at the Two-Streams Catchment.
4.2. The Use of the Cosmic Ray Neutron Sensor to Monitor Biomass
The second component of the results section investigated the use of the CRNS’s epithermal and thermal neutrons to monitor biomass. The CRNS near the ground surface (ground) and top of the tower (tower) data were analyzed. A time series of the average daily epithermal and thermal neutron counts from the tower and ground CRNS’s (Figure 6) illustrate the effect that elevation has on the neutrons. A higher probability of adsorption reactions exists for thermal neutrons and a higher probability of scattering reactions exists for epithermal neutrons. The epithermal neutron intensity measured by the tower CRNS was higher (~120 cph) than that of the epithermal neutron intensity measured by the ground CRNS, which is due to the epithermal neutrons at the tower CRNS being scattered less than at the ground surface. The thermal neutron intensity measured by the tower CRNS was significantly lower (~240 cph) than the thermal neutron intensity measured by the ground CRNS, as the production rate of thermal neutrons is higher in the soil and lower in the air. The occurrence of the clear-felling was seen on the neutron counts, such that the epithermal neutron counts increased due to the clear-felling, whilst the thermal neutrons decreased as a result of the clear-felling. The increase in epithermal neutrons occurred due to a decrease in moderation. From the epithermal neutron counts before and after the clear-felling, there was a 12.43% reduction in epithermal neutrons due to the above-ground biomass forest biomass, which equated to a dry above-ground biomass of 13.81 kg m−2, using the relationship observed in Baat et al. [24].
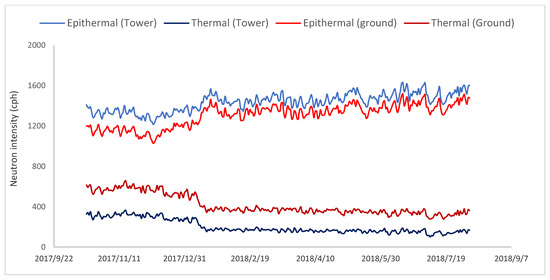
Figure 6.
Epithermal and thermal neutron intensities for the tower CRNS at 18 m and ground CRNS at 2 m from October 2017 to August 2018 in the Two-Streams Catchment.
The vegetation water content is assumed to be the weight loss after the biomass is dried. The total biomass water equivalent consists of vegetation water as well as hydrogen and oxygen present in other molecules within the dry above-ground biomass. This study assumed that this water equivalent in dry above-ground biomass can be approximated by the amount of hydrogen and oxygen contained in cellulose (C6H10O5), which is ∼55.6% by weight. Therefore, the relationships outlined in Baatz et al. [24] and Franz et al. [25] will hold for all plant material (including Acacia mearnsii).
Scatterplots of the neutron intensities of the ground CRNS (x-axis) and tower CRNS (y-axis) are plotted for both the epithermal and thermal neutron intensities (Figure 7). Both scatterplots illustrate very high correlations between the ground and tower CRNSs. There was a higher correlation between the thermal neutron intensity (R2 of 0.987) compared to the epithermal neutron intensity (R2 of 0.954). The high correlation indicated that although there were differences in the neutron intensities between the ground and tower CRNS (particularly in the thermal energy range), the relative changes in neutron intensity were maintained despite the difference in elevation.
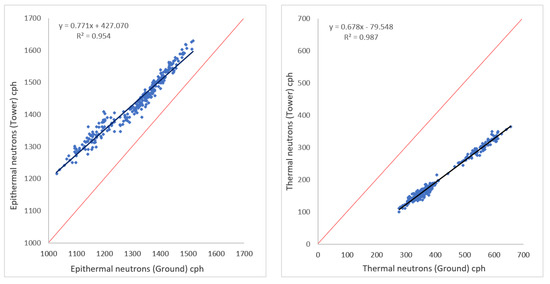
Figure 7.
Scatterplots of the ground and tower epithermal and thermal neutrons in the Two-Streams Catchment.
The daily neutron ratio (thermal/epithermal) was determined for both the ground and tower CRNS (Figure 8). The neutron ratios of the ground and tower CRNS followed the same trend, as there was a noticeable decrease in the neutron ratio due to the clear-felling. Prior to the clear-felling, the neutron ratios were ~1.6 and after the clear-felling, the neutron ratios were ~0.8. The tower CRNS seems to be more variable (“noisier”), as there is a greater difference between the epithermal and thermal neutron intensity at the tower CRNS than the ground CRNS. This results in the tower CRNS having a higher (mean E/ mean T) value (7.1) compared to the ground CRNS (3.15). Therefore, using Equation (8), a greater daily variability in the neutron ratio is seen at the tower CRNS than the ground CRNS.
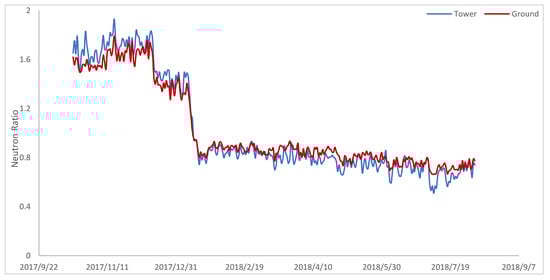
Figure 8.
Daily neutron ratio (thermal/epithermal) of the tower CRNS and ground CRNS in the Two-Streams Catchment from October 2017 to August 2018.
A scatterplot of the ground CRNS neutron ratio (x-axis) was plotted against the tower CRNS neutron ratio (y-axis) (Figure 9). The neutron ratios have a high correlation (R2 of 0.986). This indicated that the ratios were consistent, with regards to the variations in neutron intensities due to changes in biomass and variations in elevation.
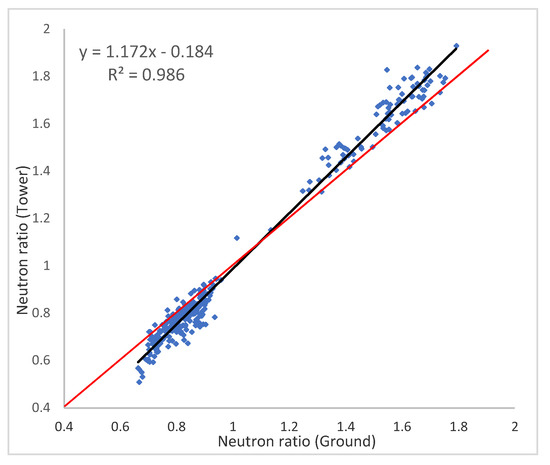
Figure 9.
Neutron ratio of the ground CRNS (x-axis) against the neutron ratio of the tower CRNS (y-axis), in the Two-Streams Catchment.
For the purpose of the next analysis, the ground CRNS ratio was used, since both CRNSs correlated well and the ground CRNS had the longer dataset. The use of remote sensing to monitor changes in biomass was evaluated against the neutron ratio, which was a measure of the biomass present. The variables derived by the Landsat 8 data in the ILWIS model were the NDVI and LAI. A time series of the NDVI and LAI was plotted against the CRNS ratio (Figure 10). There was a decrease in both the NDVI and LAI in the dry period before the clear-felling, which is consistent with the change in seasons (wet to dry). The trend in NDVI and LAI was similar due to the LAI being determined using the NDVI. The NDVI decreased from ~0.7 before the clear-felling to ~0.36 after the clear-felling. The LAI decreased from ~2 before the clear-felling to ~0.9 after the clear-felling. Fortunately, there were NDVI and LAI values a few weeks before (28th of December 2017) and during/after (13th of January 2018) the clear-felling.
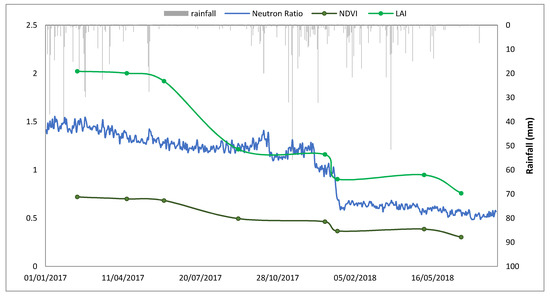
Figure 10.
Daily neutron ratio of the ground CRNS, NDVI, and LAI in the Two-Streams Catchment from January 2017 to August 2018.
Scatterplots of the neutron ratio (x-axis) and NDVI (y-axis), and neutron ratio (x-axis) and LAI (y-axis) are illustrated in Figure 11.
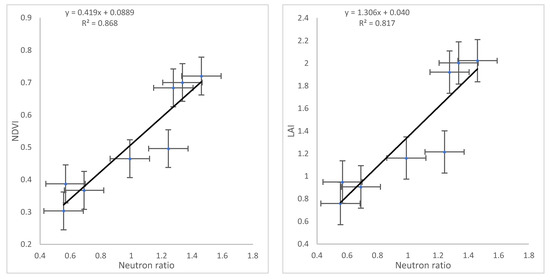
Figure 11.
Scatterplots of the ground CRNS neutron ratio (x-axis) against NDVI (y-axis), and the neutron ratio (x-axis) against LAI (y-axis).
There was a high correlation between the neutron ratio and NDVI (R2 of 0.868) and neutron ratio and LAI (R2 of 0.817); however, it should be noted that only very few observation points drive the regression line. This correlation showed the agreement in the biomass estimation between remote sensing variables and the CRNS as innovative tools to measure and monitor biomass (Figure 11).
A relationship between the neutron ratio and N0 was determined, which could assist with accounting for the temporal changes in biomass. For the purpose of this exercise, the neutron ratio from the bottom CRNS was utilized, along with the corresponding N0 values (for all four calibrations) to create a relationship between the two variables (Figure 12).
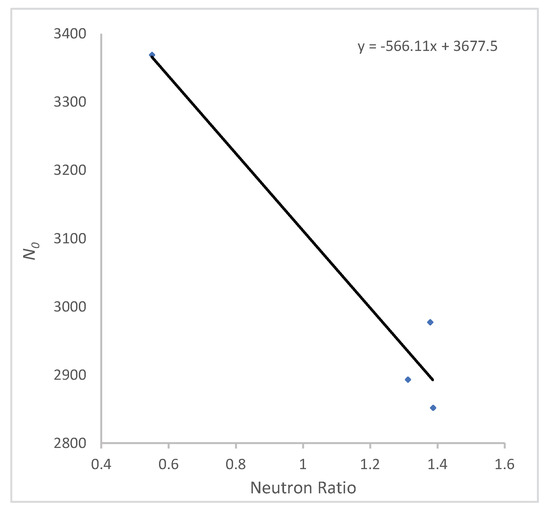
Figure 12.
Scatterplot of the ground CRNS neutron ratio (x-axis) against N0 (y-axis).
The trendline equation from Figure 12 (y = −566.11x + 3677.5) was then used to determine a daily N0 value using the daily neutron ratio values. The daily N0 values were then used to determine the CRNS’s soil water content estimates (Figure 13). The time series illustrates the CRNS soil water content estimates under three scenarios:
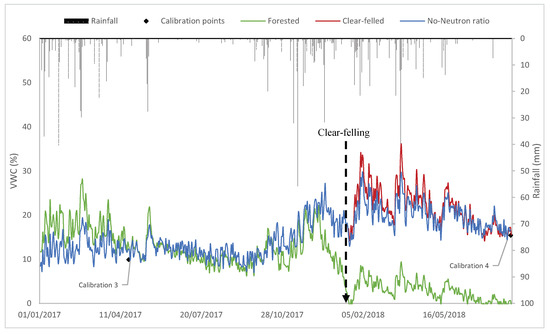
Figure 13.
Time series of the ground CRNS soil water content estimates using the conventional and N0–neutron ratio approaches in the Two-Streams Catchment from January 2017 to August 2018.
- Using the forested calibration value (forested);
- Using the clear-felled calibration value (clear-felled) and
- Using the calibration value derived from the N0–neutron ratio relationship.
The use of the N0–neutron ratio to provide CRNS soil water content estimates resulted in the general trend in soil water content seasonality being illustrated.
Both the forested and clear-felled CRNS soil water content estimates were considered reliable. However, the N0–neutron ratio approach resulted in soil water content estimates that correlated better with the conventional CRNS approach in the dry months than in the wet months. During the dry months, the difference between the N0–neutron ratio approach and the conventional approach was small, compared to the wet months, as the difference increased with rainfall. Therefore, the difference in soil water content estimates can potentially be attributed to:
The N0–neutron ratio underestimating the soil water content at the wet end.
The calibrations were conducted on non-rainfall days, which resulted in the relationship not being able to reliably predict the soil water content during periods of rainfall.
The N0–neutron ratio includes interception and ponding of rainfall, which does not necessarily result in an increase in the soil water content.
The N0–neutron ratio approach agreed with the calibration points during the study period and substantiated the expected increase in the soil water content due to the clear-felling. Due to the clear-felling and removal of biomass from the site being done in stages, the N0–neutron ratio approach appeared to estimate the soil water content according to the biomass present on site and did not show any sudden changes in the soil water content, which were not supplemented with the occurrence of rainfall.
The root mean squared error (RMSE), bias, and unbiased root mean square error (ubRMSE) were determined for the soil water content estimates determined by the N0–neutron ration approach against the conventional calibration approach scenarios (forested, clear-felled, and both) (Table 3). The N0–neutron ratio approach has a lower RMSE (2.320), bias (1.659), and ubRMSE (1.622) for the clear-felled conditions compared to the forested conditions (RMSE (4.128), bias (−2.003), ubRMSE (3.610)).
Table 3.
Error metrics of the N0–neutron ratio approach.
5. Conclusions
The use of the CRNS, as an innovative tool to estimate soil water content at an intermediate scale, has gained recognition on a global scale. The clear-felling at the Two-Streams site presented the unique opportunity to use the CRNS to continuously monitor soil water content and biomass simultaneously before, during, and after the clear-felling. The CRNS is affected by all sources of hydrogen within its measurement footprint. It is therefore important to account for variations in biomass to obtain reliable soil water content estimates. Biomass increases the hydrogen concentration in the CRNS’s footprint and results in the increase in epithermal neutron moderation and adsorption. The presence of the forest biomass reduced the epithermal neutron intensity by 12.43% and reduced the N0 value by 13.8%.
The dry above-ground biomass of the black wattle stand was determined to be 14.8 kg m−2 by past studies, using in situ sampling. The dry above-ground biomass estimation due to the change in epithermal neutron intensity was determined to be 13.8 kg m−2, and the dry above-ground biomass due to the change in N0 was determined to be 13.7 kg m−2. Therefore, both these methods used to estimate the dry above-ground biomass with the CRNS are consistent and provide reliable estimates. The use of the CRNS to monitor biomass showed that the CRNS could be used with confidence, as the changes in the neutron ratio were in good agreement with the changes in biomass. The neutron ratio also correlated well with the remote sensing vegetative indices and obtained R2 values of 0.868 and 0.817 with the NDVI and LAI, respectively.
The neutron ratio was used to provide daily N0 values, which were subsequently used to provide daily soil water content estimates. This approach seems promising in order to account for temporal changes in biomass (crop growth). However, this approach requires further investigation, as it underestimates soil water content during the wet season. The results of this study are promising and show the capability of the CRNS to monitor both soil water content and biomass simultaneously, at a field scale. As hypothesized, the removal of the forest biomass resulted in an increase in the surface soil water content at the site.
Future research should further investigate the capability of the CRNS to estimate biomass under different vegetation types and should also aim at using the CRNS to determine other hydrogen sources (rainfall and interception) within the CRNS’s measurement footprint. This will aid in increasing the accuracy of the CRNS’s soil water content estimates by removing the interception signal from the neutron intensity. Interception is a potential issue if not accounted for, especially in forested sites, as the water that is intercepted by the forest canopy and litter layer and subsequently evaporated is seen by the CRNS as an increase and subsequent decrease in the soil water content.
In order to make measured and modelled neutron intensities more comparable, research should also develop the use of the cadmium-difference method to obtain pure epithermal and thermal neutron intensities from the moderated and bare detectors. This study assumed that the epithermal and thermal footprints were the same when determining the neutron ratio. The epithermal neutron footprint has been characterized in past modelling studies, however, by the extent of the thermal footprint and the factors that influence it, which needs to be addressed in future research.
Author Contributions
All authors conceived and designed the experiments. C.S.E. and T.E.F. both provided supervision and funding acquisition. T.V. setup and calibrated the cosmic ray neutron sensors, processed the cosmic ray neutron data, obtained and processed the Landsat data. C.S.E. set up the cosmic ray neutron sensors, assisted in the field work, and reviewed and edited the research article. T.E.F. supported in the teaching of the cosmic ray neutron method (calibrations and data processing) and reviewed and edited the research article. All authors have read and agreed to the published version of the manuscript.
Funding
The authors gratefully acknowledge funding from the Partnerships for Enhanced Engagement in Research (USA); South African Agency for Science and Technology Advancement; United States Agency for International Development; University of KwaZulu-Natal; University of Pretoria; the National Research Foundation (NRF) of South Africa; the Department of Science and Technology (South African), the Water Research Commission (WRC) and the South African Environmental Observation Network (SAEON). T.E.F. acknowledges the financial support of The Daugherty Water Food Global Institute, the Global Engagement office of the University of Nebraska-Lincoln and the USDA National Institute of Food and Agriculture, Hatch project #1009760. T.E.F acknowledges the support provided by the Joint FAO/IAEA Programme of Nuclear Techniques in Food and Agriculture through the Coordinated Research Project (CRP) D1.50.17 “Nuclear Techniques for a Better Understanding of the Impact of Climate Change on Soil Erosion in Upland Agroecosystems” (2015-2020) and CRP D1.20.14 “Enhancing agricultural resilience and water security using Cosmic-Ray Neutron Sensor” (2019-2024).
Acknowledgments
The Landsat 8 data was obtained from EarthExplorer. The incoming cosmic ray neutron intensity data was obtained from the Neutron Monitor Database (NMDB).
Conflicts of Interest
The authors declare no conflict of interest. The funders had no role in the design of the study; in the collection, analyses, or interpretation of data; in the writing of the manuscript, or in the decision to publish the results.
References
- Bogena, H.R.; Huisman, J.A.; Baatz, R.; Hendricks Franssen, H.J.; Vereecken, H. Accuracy of the cosmic-ray soil water content probe in humid forest ecosystems: The worst case scenario. Water Resour. Res. 2013, 49, 5778–5791. [Google Scholar] [CrossRef]
- Jakobi, J.; Huisman, J.A.; Vereecken, H.; Diekkruger, B.; Bogena, H.R. Cosmic Ray Neutron Sensing for Simultaneous Soil Water Content and Biomass Quantification in Drought Conditions. Water Resour. Res. 2018, 54, 7383–7402. [Google Scholar] [CrossRef]
- Vather, T.; Everson, C.S.; Mengistu, M.G.; Franz, T.E. Cosmic ray neutrons provide innovative technique for estimating intermediate scale soil moisture. S. Afr. J. Sci. 2018, 114, 79–87. [Google Scholar] [CrossRef]
- Walker, J.; Dumedah, G.; Monerris, A.; Gao, Y.; Rüdiger, C.; Wu, X.; Panciera, R.; Merlin, O.; Pipunic, R.; Ryu, D.; et al. High Resolution Soil Moisture Mapping. In Digital Soil Assessments and Beyond, Proceedings of the Fifth Global Workshop on Digital Soil Mapping, Sydney, Australia, 10–13 April 2012; Minasny, B., Malone, B.P., McBratney, A.B., Eds.; CRC Press: Boca Raton, FL, USA, 2012; pp. 45–51. [Google Scholar] [CrossRef]
- Stevanato, L.; Baroni, G.; Cohen, Y.; Fontana, C.; Gatto, S.; Lunardon, M.; Marinello, F.; Moretto, S.; Morselli, L. A Novel Cosmic-Ray Neutron Sensor for Soil Moisture Estimation over Large Areas. Agriculture 2019, 9, 202. [Google Scholar] [CrossRef]
- Andreasen, M.; Jensen, K.H.; Desilets, D.; Zreda, M.; Bogena, H.R.; Looms, M.C. Cosmic-ray neutron transport at a forest field site: The sensitivity to various environmental conditions with focus on biomass. Hydrol. Earth Syst. Sci. 2017, 21, 1875–1894. [Google Scholar] [CrossRef]
- Vather, T.; Everson, C.; Franz, T.E. Calibration and Validation of the Cosmic Ray Neutron Rover for Soil Water Mapping within Two South African Land Classes. Hydrology 2019, 6, 65. [Google Scholar] [CrossRef]
- Zreda, M.; Desilets, D.; Ferre, T.P.A.; Scott, R.L. Measuring soil moisture content non-invasively at intermediate spatial scale using cosmic-ray neutrons. Geophys. Res. 2008, 35. [Google Scholar] [CrossRef]
- Hawdon, A.; Mcjannet, D.; Wallace, J. Calibration and correction procedures for cosmic-ray neutron soil moisture probes located across Australia. Water Resour. Res. 2014, 50, 5029–5043. [Google Scholar] [CrossRef]
- Baroni, G.; Oswald, S.E. A Scaling Approach for the Assessment of Biomass Changes and Rainfall Interception Using Cosmic-Ray Neutron Sensing. J. Hydrol. 2015, 525, 264–276. [Google Scholar] [CrossRef]
- Bauer-Marschallinger, B.; Freeman, V.; Cao, S.; Paulik, C.; Schaufler, S.; Stachl, T.; Modanesi, S.; Massari, C.; Ciabatta, L.; Brocca, L.; et al. Toward Global Soil Moisture Monitoring with Sentinel-1: Harnessing Assets and Overcoming Obstacles. IEEE Trans. Geosci. Remote Sens. 2019, 57, 520–539. [Google Scholar] [CrossRef]
- El Hajj, M.; Baghdadi, N.; Zribi, M.; Bazzi, H. Synergic Use of Sentinel-1 and Sentinel-2 Images for Operational Soil Moisture Mapping at High Spatial Resolution Over Agricultural Areas. Remote Sens. 2017, 9, 1292. [Google Scholar] [CrossRef]
- Strati, V.; Albéri, M.; Anconelli, S.; Baldoncini, M.; Bittelli, M.; Bottardi, C.; Chiarelli, E.; Fabbri, B.; Guidi, V.; Raptis, K.G.C.; et al. Modelling Soil Water Content in a Tomato Field: Proximal Gamma Ray Spectroscopy and Soil–Crop System Models. Agriculture 2018, 8, 60. [Google Scholar] [CrossRef]
- Avery, W.A.; Finkenbiner, C.; Franz, T.E.; Wang, T.; Nguy-Robertson, A.L.; Suyker, A.; Arkebauer, T.; Munoz-Arriola, F. Incorporation of globally available datasets into the roving cosmic-ray neutron probe method for estimating field-scale soil water content. Hydrol. Earth Syst. Sci. 2016, 20, 3859–3872. [Google Scholar] [CrossRef]
- Han, X.; Franssen, J.H.; Rosolem, R.; Jin, R.; Li, X.; Vereecken, H. Correction of systematic model forcing bias of CLM using assimilation of cosmic-ray Neutrons and land surface temperature: A study in the Heihe Catchment, China. Hydrol. Earth Syst. Sci. 2015, 19, 615–629. [Google Scholar] [CrossRef]
- Shuttleworth, W.J.; Zreda, M.; Zeng, X.; Zweck, C.; Ferre, T.P.A. The COsmic-Ray Soil Moisture Observing System (COSMOS): A Non-Invasive, Intermediate Scale Soil Moisture Measurement Network. British. Hydrol. Soc. 2010, 12, 14551. [Google Scholar]
- Franz, T.E.; Zreda, M.; Rosolem, R.; Ferre, T.P.A. A universal calibration function for determination of soil moisture with cosmic-ray neutrons. Hydrol. Earth Syst. Sci. 2013, 17, 453–460. [Google Scholar] [CrossRef]
- Andreasen, M.; Jensen, K.H.; Desilets, D.; Franz, T.E.; Zreda, M.; Bogena, H.R.; Looms, M.C. Status and Perspectives on the Cosmic-Ray Neutron Method for Soil Moisture Estimation and Other Environmental Science Applications. Vadose Zone J. 2017, 16. [Google Scholar] [CrossRef]
- Mcjannet, D.; Franz, T.; Hawdon, A.; Boadle, D.; Baker, B.; Almeida, A.; Silberstein, R.; Lambert, T.; Desilets, D. Field testing of the universal calibration function for determination of soil moisture with cosmic-ray neutrons. Water Resour. Res. 2014, 50, 5235–5248. [Google Scholar] [CrossRef]
- Rosolem, R.; Hoar, T.; Arellano, A.; Anderson, J.L.; Shuttleworth, W.J.; Zeng, X.; Franz, T.E. Translating aboveground cosmic-ray neutron intensity to high-frequency soil moisture profiles at sub-kilometer scale. Hydrol. Earth Syst. Sci. 2014, 18, 4363–4379. [Google Scholar] [CrossRef]
- Zreda, M. Land-surface hydrology with cosmic-ray neutrons: Principles and applications. J. Jpn. Soc. Soil Phys. 2016, 132, 25–30. [Google Scholar]
- Hornbuckle, B.; Irvin, S.; Franz, T.; Rosolem, R.; Zweck, C. The Potential of The Cosmos Network to be a Source of New Soil Moisture Information for SMOS and SMAP. In Proceedings of the 2012 IEEE International Geoscience and Remote Sensing Symposium, Munich, Germany, 22–27 July 2012. [Google Scholar]
- Franz, T.E.; Zreda, M.; Rosolem, R.; Hornbuckle, B.K.; Irvin, S.L.; Adams, H.; Kolb, T.E.; Zweck, C.; Shuttleworth, W.J. Ecosystem-scale measurements of biomass water using cosmic ray neutrons. Geophys. Res. Lett. 2013, 40, 3929–3933. [Google Scholar] [CrossRef]
- Baatz, R.; Bogena, H.R.; Franssen, J.H.; Huisman, J.A.; Montzka, C.; Vereecken, H. An empirical vegetation correction for soil water content quantification using cosmic ray probes. Water Resour. Res. 2015, 51, 2030–2046. [Google Scholar] [CrossRef]
- Franz, T.E.; Wang, T.; Avery, W.; Finkenbiner, C.; Brocca, L. Combined analysis of soil moisture measurements from roving and fixed cosmic ray neutron probes for multiscale real-time monitoring. Geophys. Res. Lett. 2015, 42, 3389–3396. [Google Scholar] [CrossRef]
- Tian, Z.; Li, Z.; Liu, G.; Li, B.; Ren, T. Soil Water Content Determination with Cosmic-ray Neutron Sensor: Correcting Aboveground Hydrogen Effects with Thermal/Fast Neutron Ratio. J. Hydrol. 2016, 540, 923–933. [Google Scholar] [CrossRef]
- Everson, C.S.; Clulow, A.D.; Becker, M.; Watson, A.; Ngubo, C.; Bulcock, H.; Mengistu, M.; Lorentz, S.; Demlie, M. The Long Term Impact of Acacia mearnsii Trees on Evaporation, Streamflow, Low Flows and Ground Water Resources. Phase II: Understanding the Controlling Environmental Variables and Soil Water Processes over a Full Crop Rotation; WRC Report (2022/1); Water Research Commission: Pretoria, South Africa, 2014. [Google Scholar]
- Everson, C.S.; Moodley, M.; Gush, M.; Jarmain, C.; Govender, M.; Dye, P. Can Effective Managment of Riparian Zone Vegetation Significantly Reduce the Cost of Catchment Management and Enable Greater Productivity of Land Resources; Division of Water Environment and Forestry Technology (ENVIRONMENTEK) CSIR: Durban, South Africa, 2005. [Google Scholar]
- Köhli, M.; Schrön, M.; Zreda, M.; Schmidt, U.; Dietrich, P.; Zacharias, S. Footprint characteristics revised for field-scale soil moisture monitoring with cosmic-ray neutrons. Water Resour. Res. 2015, 10, 5772–5790. [Google Scholar] [CrossRef]
- Dovey, S.; Du Toit, B. A General Review of Allometry, Biomass and Nutritional Sustainability of Acacia mearnsii. In ICFR Bulletin Series; ICFR: Pietermaritzburg, South Africa, 2003. [Google Scholar]
- Dovey, S.; Du Toit, B.; Smith, C.W. Allometry and Biomass of Acacia mearnsii across Four Ages and Tree Sites in the KwaZulu-Natal Midlands. In ICFR Bulletin Series; Institute for Commercial Forestry Research: Pietermaritzburg, South Africa, 2003. [Google Scholar]
- Dye, P.; Jarmain, C. Water use by black wattle (Acacia mearnsii): Implications for the link between removal of invading trees and catchment streamflow response. S. Afr. J. Sci. 2004, 100, 40–44. [Google Scholar]
- Zreda, M.; Shuttleworth, W.J.; Zeng, X.; Zweck, C.; Desilets, D.; Franz, T.; Rosolem, R. COSMOS: The COsmic-ray Soil Moisture Observing System. Hydrol. Earth Syst. Sci. 2012, 16, 4079–4099. [Google Scholar] [CrossRef]
- Andreasen, M.; Jensen, K.; Zreda, M.; Desilets, D.; Bogena, H.; Looms, M. Modeling cosmic ray neutron field measurements. Water Resour. Res. 2016, 52, 6451–6471. [Google Scholar] [CrossRef]
- Ochsner, T.E.; Cosh, M.H.; Cuenca, R.H.; Dorigo, W.A.; Draper, C.S.; Hagimoto, Y.; Kerr, Y.H.; Larson, K.M.; Njoku, E.G.; Small, E.E.; et al. State of the art in large-scale soil moisture monitoring. Soil Sci. Soc. Am. Inc. 2013, 77, 1888–1919. [Google Scholar] [CrossRef]
- Schrön, M.; Köhli, M.; Scheiffele, L.; Iwema, J.; Bogena, H.R.; Lv, L.; Martini, E.; Baroni, G.; Rosolem, R.; Weimar, J.; et al. Improving calibration and validation of cosmic-ray neutron sensors in the light of spatial sensitivity. Hydrol. Earth Syst. Sci. 2017, 21, 5009–5030. [Google Scholar] [CrossRef]
- Franz, T.E.; Zreda, M.; Ferre, T.P.A.; Rosolem, R.; Zweck, C.; Stillman, S.; Zeng, X.; Shuttleworth, W.J. Measurement depth of the cosmic ray soil moisture probe affected by hydrogen from various sources. Water Resour. Res. 2012, 48. [Google Scholar] [CrossRef]
- Rosolem, R.; Shuttleworth, W.J.; Zreda, M.; Franz, T.E.; Zeng, X.; Kurc, S.A. The Effect of Atmospheric Water Vapor on Neutron Count in the Cosmic-Ray Soil Moisture Observing System. J. Hydrometeorol. 2013, 2013, 1659–1671. [Google Scholar] [CrossRef]
- Desilets, D.; Zreda, M.; Ferre, T.P.A. Nature’s neutron probe: Land surface hydrology at an elusive scale with cosmic rays. Water Resour. Res. 2010, 46, 1–7. [Google Scholar] [CrossRef]
- Evans, J.G.; Ward, H.C.; Blake, J.R.; Hewitt, E.J.; Morrison, R.; Fry, M.; Ball, L.A.; Doughty, L.C.; Libre, J.W.; Hitt, O.E.; et al. Soil water content in southern England derived from a cosmic-ray soil moisture observing system—COSMOS-UK. Hydrol. Process. 2016, 30, 4987–4999. [Google Scholar] [CrossRef]
- Wahbi, A.; Dercon, G.; Heng, L. Cosmic Ray Neutron Sensing: Estimation of Agricultural Crop Biomass Water Equivalent; Springer International Publishing: Berlin/Heidelberg, Germany; International Atomic Energy Agency (IAEA): Cham, Switzerland, 2018; pp. 1–33. [Google Scholar] [CrossRef]


© 2020 by the authors. Licensee MDPI, Basel, Switzerland. This article is an open access article distributed under the terms and conditions of the Creative Commons Attribution (CC BY) license (http://creativecommons.org/licenses/by/4.0/).