Article

Statistical Analysis of Landslide Susceptibility, Macerata Province (Central Italy)

by
Matteo Gentilucci
*,
Marco Materazzi
and
Gilberto Pambianchi
Geology Division, School of Science and Technology, University of Camerino, 62032 Camerino, Italy
*
Author to whom correspondence should be addressed.
Hydrology 2021, 8(1), 5; https://doi.org/10.3390/hydrology8010005
Submission received: 1 December 2020 / Revised: 3 January 2021 / Accepted: 5 January 2021 / Published: 7 January 2021
(This article belongs to the Special Issue Rainfall-Induced Landslides Hazard)

Abstract

:
Every year, institutions spend a large amount of resources to solve emergencies generated by hydrogeological instability. The identification of areas potentially subject to hydrogeological risks could allow for more effective prevention. Therefore, the main aim of this research was to assess the susceptibility of territories where no instability phenomena have ever been detected. In order to obtain this type of result, statistical assessments of the problem cannot be ignored. In this case, it was chosen to analyse the susceptibility to landslide using a flexible method that is attracting great interest in the international scientific community, namely the Weight of Evidence (WoE). This model-building procedure, for calculating landslide susceptibility, used Geographic Information Systems (GIS) software by means of mathematical operations between rasters and took into account parameters such as geology, acclivity, land use, average annual precipitation and extreme precipitation events. Thus, this innovative research links landslide susceptibility with triggering factors such as extreme precipitation. The resulting map showed a low weight of precipitation in identifying the areas most susceptible to landslides, although all the parameters included contributed to a more accurate estimate, which is necessary to preserve human life, buildings, heritage and any productive activity.

1. Introduction

1.1. State of the Art
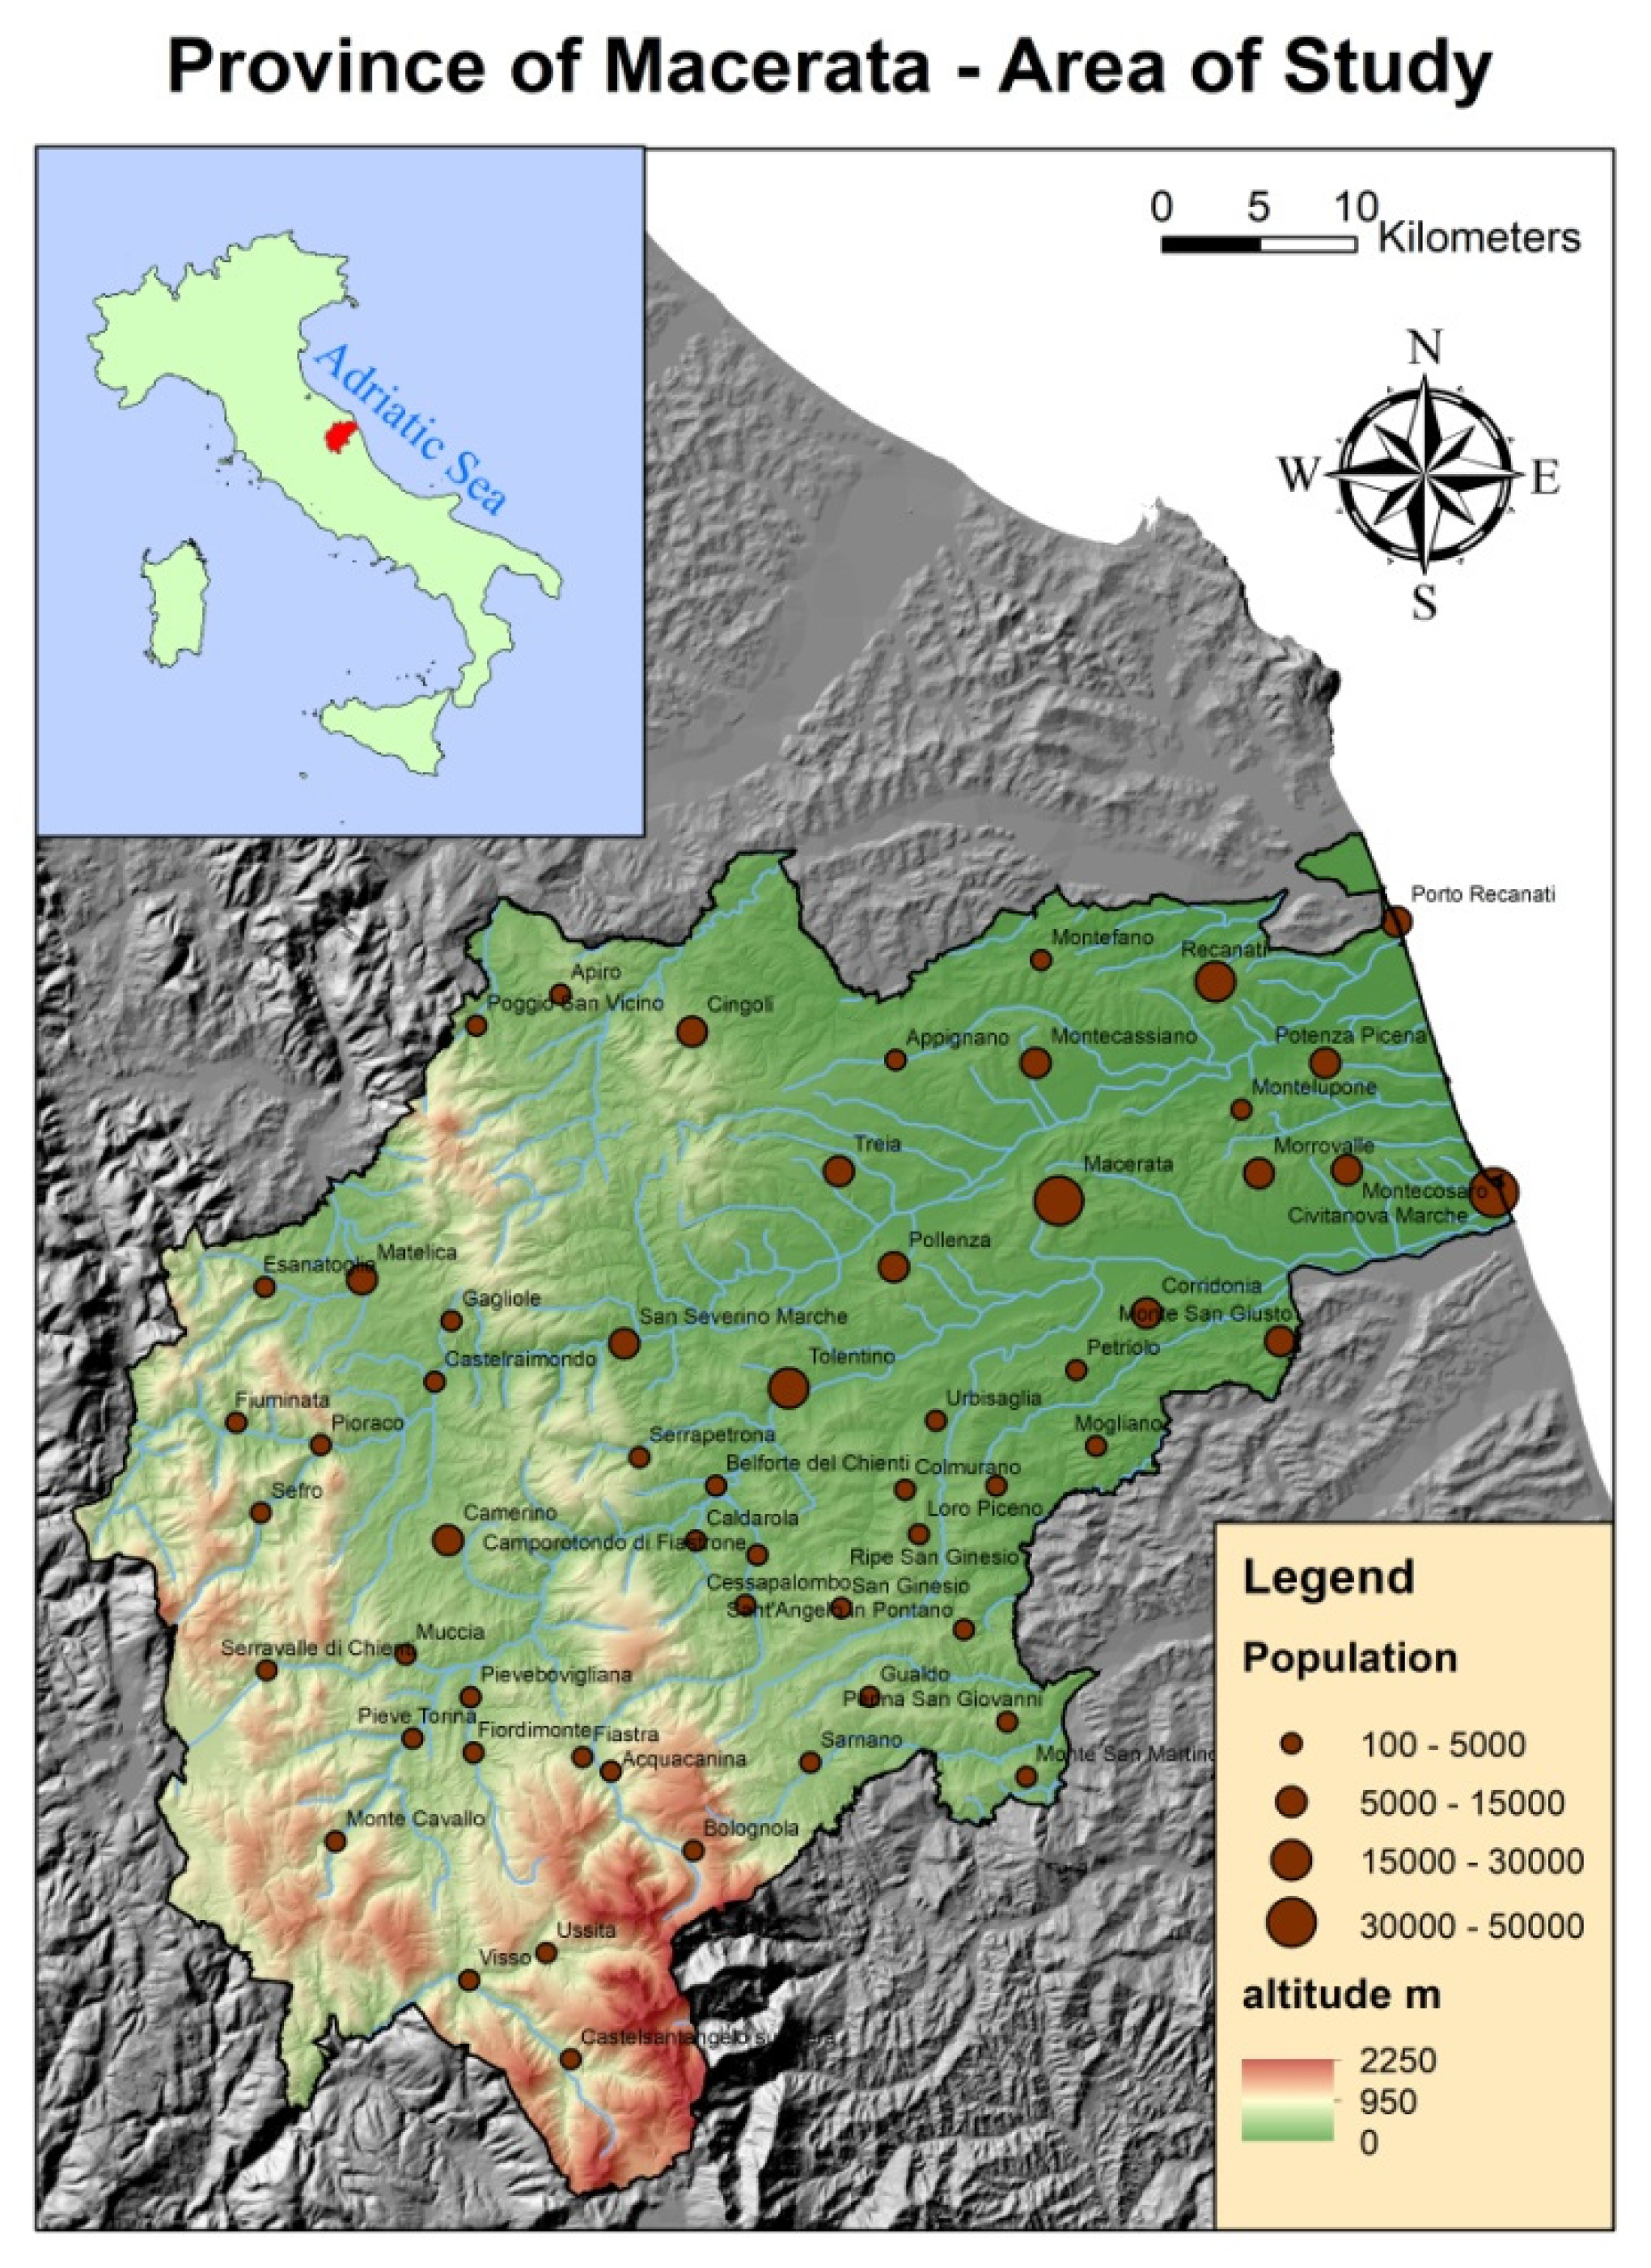
The Italian territory is subject to a high level of hydrogeological instability and also the province of Macerata is no exception with 7.3% [1] of the territory affected by landslide hazard of grade 3 and 4, where 4 represents the maximum hazard. It follows that landslides susceptibility, which is the statistical likelihood of a landslide occurring in an area, is a very important issue that needs to be studied in depth, also because of the huge resources that are absorbed to deal with emergencies. In this context, climate change is exacerbating the hydrogeological risk and this influence has been demonstrated in numerous studies [2,3]. Hydrogeological risk determines the risk related to the instability of slopes, due to particular geological and geomorphological aspects of these, or of watercourses due to the particular environmental conditions, with possible consequences on the safety of the population and the safety of services and activities on a given territory. Climate change is a trigger for increased hydrogeological risk, it is largely generated by an increase in greenhouse gases which absorbs heat and retain it by gradually releasing it [4], this energy growth, affects both precipitation and temperature. Obviously, it would be useful to work in upstream using countermeasures to contrast climate change by reducing CO2 emissions or reusing them [5]. However, it is necessary to take note of the current situation, where climate is increasingly the crucial issue. Recently, a lot of research has been carried out to study the impact of climate change on hydrogeological risk, especially landslides [6], although there are other factors that greatly influence terrain stability, such as land use [7]. It is precisely land use that can cause an amplification of the possibility of landslides due to the increase in erosion caused by anthropogenic changes, but also to natural phenomena such as the growth of vegetation or the properties of the soil itself [8]. Other factors influencing landslides include slope [9], lithology [10] and seismic risk [11]; these parameters which contribute to hydrogeological instability lead us to introduce another concept, that of “susceptibility”. Landslide susceptibility is the probability that a landslide will occur in a territory, depending on local conditions. It is a measure of the degree to which a territory may be affected by landslides, i.e., an estimate of “where” landslides may occur. There have been many attempts to obtain a probabilistic statistical model, that can allow a reliable assessment of susceptibility [12,13]. The comparison of statistical models for susceptibility calculation (certainty factor, weight of evidence, analytic hierarchy process, etc.) is aimed at defining the best model that allows a minimization of errors, based on landslides detected but deliberately not included in the model-building procedure [14,15]. In this case, the excellent results achieved in scientific literature by the Weight of Evidence (WoE), led to consider it as a reference model for this study. The WoE was originally introduced to assist mining research in identifying new deposits or more accurate reserve estimates [16,17]. The application of this method with the help of Geographic Information Systems (GIS) in the same way, has always been due to applications related to mining research [16]. The maps produced by GIS with the WoE methods, allow areas to be discriminated on the basis of factors that produce certain eventualities. In recent years, this method has been widely applied to landslides as a forecasting tool, with the help of GIS software all over the world [18,19]. Similarly, in Italy, this method has been considered and tests have been carried out in very localized areas [20] and in the mountainous areas of the Apennines and the Alps [21,22]. However the major problem in creating landslide susceptibility maps, is represented by a complete sampling of the factors that can cause instability. Most of the studies are based on small portions of homogeneous territory that obviously cannot be representative of the total and above all, that show many different combinations for example of lithologies, soils, land uses, etc. Instead, this study aims to sample a very large area, carrying out an analysis of the whole territory of the Macerata province, in central Italy. In this area, no studies have been carried out, using WoE and GIS software to obtain a susceptibility map. In any case, the most innovative part of this research lies in the inclusion of the extreme precipitation events, among the parameters that can cause instability. Therefore, this research could represent a link between a study on landslide susceptibility and a study on trigger thresholds. In fact, one of the factors triggering landslides is frequently rainfall, so it is essential to carry out in-depth climatic analyses of the area under investigation [23,24,25]. An in-depth analysis was carried out, in terms of variation and magnitude of average and extreme rainfall. [26]. Increasingly frequent extreme events dictated by climate change [27] lead to continuous adjustments of susceptibility maps. Forecasting areas of potential instability is of great interest firstly for the protection of human life, and secondly for the cost associated with emergency management. Furthermore, in this area of Italy there are valuable crops, such as vines [28], which can be adversely affected by slope instability and which must be protected to avoid economic consequences.

1.2. Study Area

The study area is the province of Macerata, it is located in central Italy and overlooking the Adriatic Sea, which is part of the Mediterranean Sea. The area is about 2779 Km2, 67% of the territory is hilly and the remaining 33% is mountainous. To the west, the territory of the province of Macerata (Figure 1) is bordered by the Sibillini mountains (South-western side of the province), part of the Apennine chain, which reach peaks higher than 2200 m a.s.l. Going eastwards there is a wide range of hills that gradually slopes down to the Adriatic coast. Almost all the rivers in the area have a west-east direction except for the Nera river, which crosses the municipalities of Visso and Castelsantangelo sul Nera, and one of its tributaries, the Ussita, both flowing into the Tyrrhenian Sea after joining the Tevere river (Figure 1). From a morphogenetic point of view, the structure of the Umbria-Marche Appenines is dominated by thrust faults, due to the collisional movement of the African tectonic plate with the European one, while in some internal areas (Tuscany) in the same period (Middle Miocene) there was an extensional tectonic and both are still active. The Umbria-Marche Appenines show an arc with East-facing convexity where it is possible to observe internal wrinkle ridges, an intermediate complex of synclines and external wrinkle ridges.The internal wrinkle ridges consist of various asymmetrical east-vergent thrusting folds, the middle complex of synclines goes from Urbania to Visso and it’s composed by east-vergent thrust sheets, while the external wrinkle ridges is an anticlinal structure thrusting over the foothills, named overthrust of the Sibillini Mountains [29]. Finally, going eastwards, the foothills can be divided into two geomorphologic structures: the “pedeappennino marchigiano”, characterised by anticlines with transpressive and normal faults, and the periadritic basin with small folds east-vergent.
From the point of view of landslides, the province of Macerata is a very heterogeneous territory, with movements of very different types, often grouped by homogeneous zones of acclivity or in relation to the geological substrate. In correspondence of mountain ridges and steep slopes characterised by predominantly calcareous rocks, collapse phenomena and deep-seated gravitational slope deformations (DGSD) are observed. Also in the high energy areas of the relief, there are frequent phenomena of slide, debris flow and debris avalanches, which involve eluvial colluvial deposits and clastic materials accumulated in previous morphoclimatic phases. In the areas with outcrops of Plio-Pleistocene sediments, mainly pelitic, and characterised by a lower gradient, the type of movement that prevails is that of earthflow. Less deep phenomena such as soliflux landslides and plastic deformations are also widespread in these areas. In the impluvial areas, where there are considerable thicknesses of altered and and eluvial deposits, there are frequent mudflows originated during heavy rainfall. In the hilly areas where the Plio-Pleistocene pelitic and pelitic-arenaceous sediments outcrop, the natural instability of these soils has been accelerated by poor land management and, above all, by less maintenance management and, above all, less maintenance of the surface water drainage network. Moreover, the profound changes in the production methods of the agricultural system, which can be summarised as a reduced anthropic presence in the area and a decrease in vegetation cover, have led to the breakdown of delicate natural balances over the last thirty years. The development of settlements and infrastructures, imposed by new socio-economic processes, has often taken place in an uncontrolled manner, occupying areas whose stability was considered precarious.
Moreover, in the last period, this area of Italy has suffered periodically from strong hydrogeological instability, due to two major seismic events in 1997 and 2016, which mainly generated deep-seated gravitational slope deformations (DGSD) and collapses. In addition, there have been extreme precipitation events such as the one in November 2013, which activated existing landslides and uncovered new ones, especially in hilly areas.

2. Materials and Methods

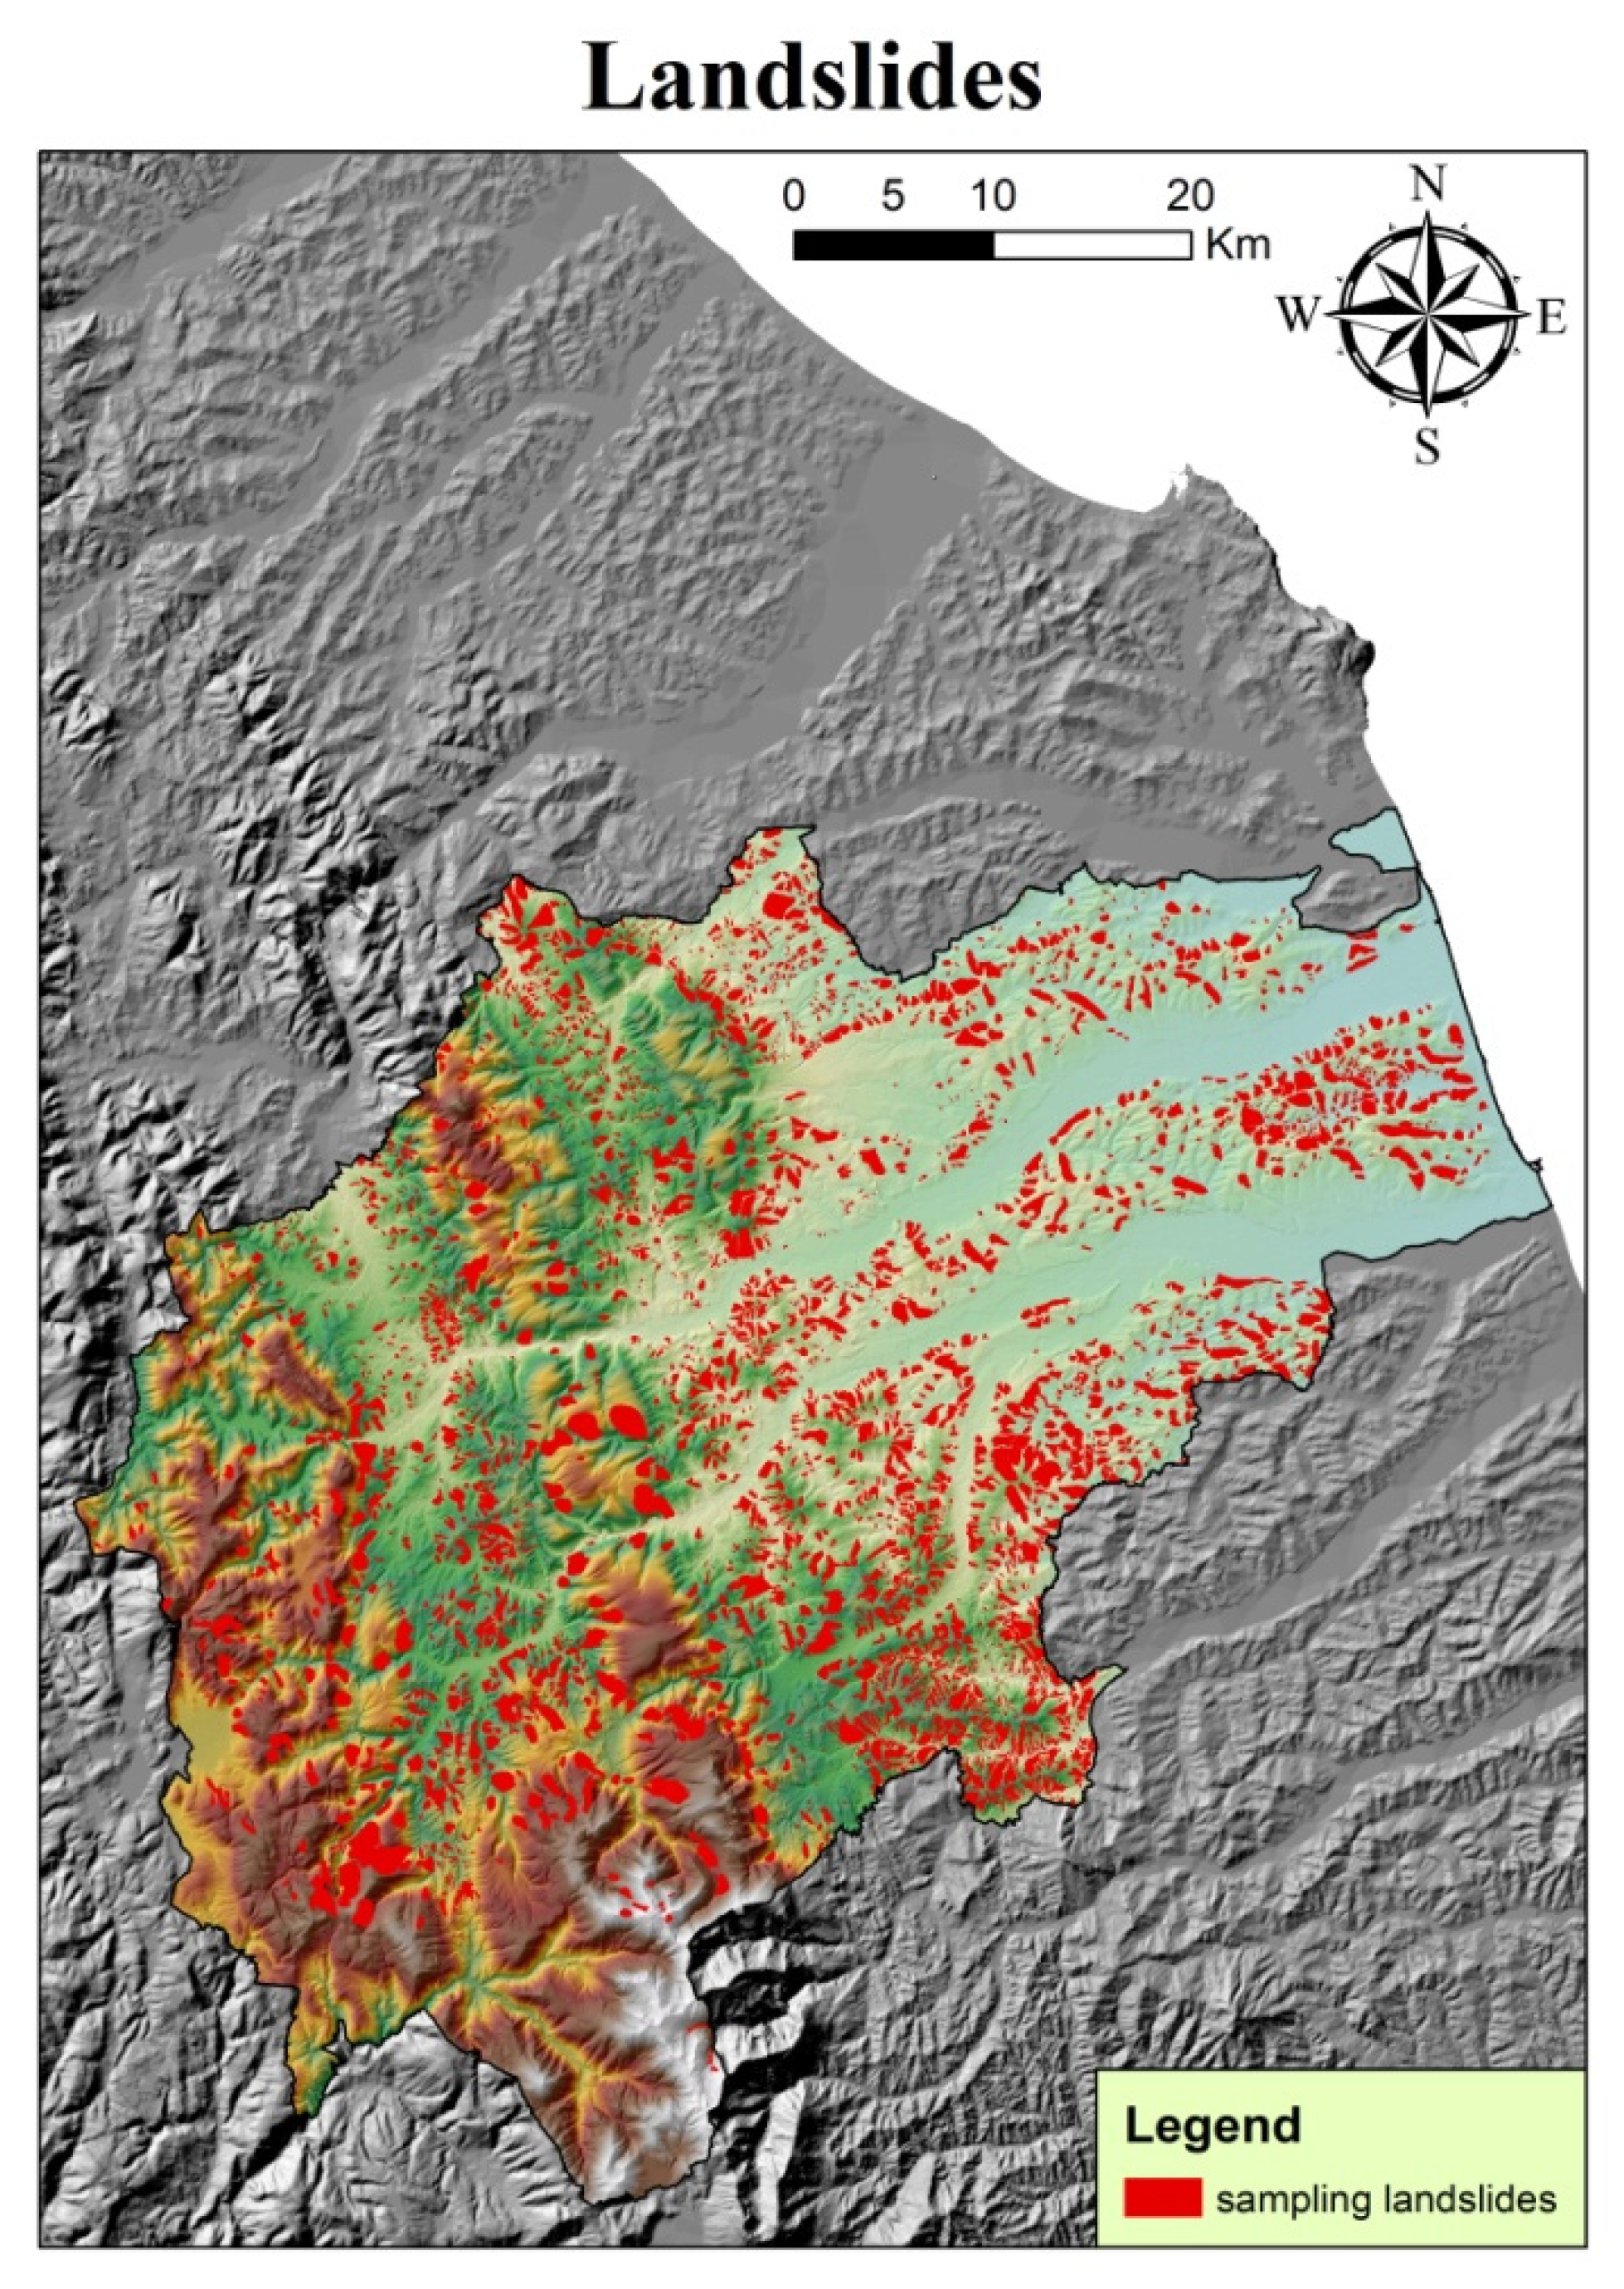
2.1. Data Sampling and Preparation

For the analysis of susceptibility through GIS software, a detailed digital elevation model (DEM) is primary, which was created with the help of the regional technical map (CTR) [30]. This DEM was prepared with a resolution of 5m and on this basis the slope map, which is very influential on landslide susceptibility, was obtained. The geological map was digitized and the landslide map was obtained from the “River Basin Authorities of the Marche Region”. The model validation was instead produced by introducing the landslides from the IFFI project (inventory of landslide phenomena in Italy). Deep-seated gravitational slope deformations (DGSD) and collapses were excluded from the landslide map, due to activation phenomena not directly linked to extreme precipitation events, thus the total number of landslides considered for this study was 4171 (Figure 2).
The land use map, on the other hand, was obtained from ISPRA (Istituto Superiore per la Protezione e la Ricerca Ambientale), the italian institute that distributes the Corine Land Cover for Italy, developed by Copernicus Global Land Services (CGLS), Europe’s leading Earth monitoring programme. In order to complete the parameters that are part of the model, the precipitation of the last 30 years were taken into account, through data of 10 rain gauges in the province of Macerata and another 10 outside. The rainfall data were collected by the Regional Civil Protection of the Marche Region and the Experimental Geophysical Observatory of Macerata (OGSM). Firstly, a complete validation and homogenisation of the climate data was carried out, following the guidelinesof the WMO (World Meteorological Organization). Interpolation was carried out throughout the province by means of ordinary cokriging based on altitude as an independent variable [31]. Ordinary cokriging (OCK), is a geostatistical method used in relation to one or more independent variables [32] that allow a better interpolation if there is a strong correlation between independent variable (known throughout the territory) and dependent one (only some sample values).
Z OCK ( u ) = α 1 = 1 n 1 ( u ) λ α 1 OCK ( u ) Z 1 ( u α 1 ) + α 2 = 1 n 2 ( u ) λ α 2 OCK ( u ) Z 1 ( u α 2 ) λ α 1 OCK ( u )   and   λ α 2 OCK ( u )   =   weights   of   the   data   Z 1 ( u α 1 )   and   Z 1 ( u α 2 )   =   primary   and   secondary   data
The altitude was chosen as an independent variable on the basis of a previous study showing that it is the most correlated topographical parameter for this area [33]. Furthermore, a complex study was performed to find out the amount of precipitation in case of extreme events. The method used to carry out the analysis was the Generalized Extreme Value (GEV), chosen after an assessment of the goodness of fit in relation to precipitation data. The GEV is a flexible model composed of three parameters: k for shape, σ for scale and µ for location.
f ( x ) = { 1 σ exp ( ( 1 + kz ) 1 / k ( 1 + kz ) 1 1 / k k 0 1 σ exp ( z exp ( z ) ) k = 0
where z = ( x μ ) σ
The domain of the GEV depends on k:
1 + k ( x μ ) σ > 0     k 0 < x < +    k = 0
In order to assess the goodness of fit for each rain gauge, it was used the R software with the package “extremes 2.0” analyzing the quantile plot and the histogram of frequency [34]. Even the same software was used to calculate the return period. In fact the return period 1 / p was obtained through the procedure of the maximum likelihood z p with a chance between 0 and 1:
z p = μ + σ k ( [ log ( 1 p ) ] k 1 )
Finally it was calculate the confidence interval of each return period in this way:
μ = z p + σ k { 1 [ log ( 1 p ) ] k }
However, although the altitude is optimally correlated with the rainfall, it is not at all correlated with the extreme rainfall events. Thus to have a good reliability, the rain gauges of extreme events in 24 h near to the location of the analysis were interpolated with an ordinary kriging (without altitude), instead of OCK. Ordinary kriging (OK) uses a semivariogram to express the strength of the spatial correlation as a function of distance and similarity.
Z OK ( u ) = µ + ε ( u )
µ = unknown constant, ε ( u ) = random error
The goodness of interpolations was evaluated with a cross-validation, performed with GIS softwares, considering some statistical operators as: Mean Error, Root Mean Square Error, Average Standard Error, Mean Standardized Error and Root Mean Square Error Standardized [23]. With regard to extreme climatic events, the analysis was conducted on a return time of 100 years for extreme climatic events considering time series of 50–60 years of precipitation data for the hours 1-3-6-12-24 (Table 1). The confidence interval were calculated through the “bootstrap” method, with 1000 attempt.
The results of the analysis are showed with the Extreme Rainfall Intesity-Duration-Frequency (IDF) curve (Figure 3), which relates the precipitation in millimeters to the return period in years.

2.2. Model Building

Following this in-depth climatic analysis, the most relevant environmental problems were identified, for this territory, according to databases obtained from the Basin Authority of the Marche Region and the Marche Region itself. Landslides detected in the investigation area have been mapped and subsequently combined with the following parameters: extreme events of precipitation, average annual precipitation, geology, land use and slope angle, in order to predict quiescent or potential landslides. The evidences were divided in classes and this analysis was based on the weight of each single class of values. Weight is a function of how many landslides are present in each class and the final aim is to produce a landslide susceptibility map. To create the susceptibility map, the classes of the various evidences climatic interpolations (average precipitation and extreme events), lithology, slope and land use become the subject of the WoE calculation (Figure 4). This calculation performed by means of math tool between raster with GIS software, produces positive and negative weights for each class (Figure 5). Weights are estimated to be proportional to the influence of each class on landslide and were calculated by the following equations [35]:
W + = ln ( Landslide   area   in   calss Total   landslide   area Stable   area   in   class Total   stable   area )
W = ln ( Total   landslide   area   outside   calss Total   landslide   area   stable   area   outside   class Total   stable   area )
The Equations (7) and (8) represents the start of the WoE method, which combine evidence in support of an hypothesis. In this way can be possible to calculate the degree of influence of each factors in the susceptibility analysis, with the aim of produce a map useful to protection. However in this calculation it is essential to know the prior probability ( O f ) to find the amount of study area affected by landslide ( A f ) over the whole study area ( A t ) [20]:
O f = A f A t 1 A f A t
Furthermore there is another very important parameter which is the contrast (C) that represents the differences between W + and W allowing the assessment if the investigated factor is significant and influence the distribution of landslides in the area. A value of “C” close to 0 determines that the parameter is of little significance, while a value of 2 attests a good correlation. The final susceptibility map was obtained from the weights of each parameter and the prior probability [20]:
Final   P . = EXP ( W + + ln O f )
Geology and Land use are categorized variable, therefore they did not need to be categorized. On the other hand, choices were made for both climatic parameters and slope gradients. Extreme precipitation events were divided into intervals of 5 mm of precipitation, while annual precipitation was divided into intervals of 150 mm of precipitation. The slopes were divided into four different classes, the first for assessing flat surfaces, the second for assessing medium-low slopes, the third for medium-high slopes and the fourth for high slopes. Obviously, these subdivisions are arbitrary and could influence the results of the model to a greater or lesser degree. The only way to assess the presence of more appropriate categories, would be to iteratively evaluate them.

3. Results

The landslide map (Figure 2) was overlapped with each influencing parameter in order to find a statistical correlation. The weight of each parameter is a function of the correlated density of instability. The sum of the different parameters determines a landslide susceptibility map. The various thematic maps were overlapped with the landslide map and the intersections obtained with GIS software, were assessed to calculate the weights and the odds for the whole Province of Macerata. The WoE were obtained from 5 parameters: Geology (Figure 5), Slope (Figure 6), Land use (Figure 7), Annual average precipitation (Figure 8), Extreme events (Figure 9).
It is important for the Figure 5, Figure 6, Figure 7, Figure 8 and Figure 9 (right) to observe the contrast (“C”) value, because a positive one determine that landslides occur more frequently in the given class. For geology (Figure 5) we have an high value of C for “Depositi Quaternari” (Quaternary deposits), and positive but lower for RSA, FCO, FSD, FAA and LAG [36]. All the other formations do not have a positive correlation of parameter C, which suggests that landslides do not occur very frequently in these geological formations.
The most frequent class of lanslides for the slope angle is between 5° and 30°, while C for all the other classes seems to be not very significant (Figure 6).
The land use (Figure 7 shows a higher contrast value for territories used for agricultural practice as expected. In fact, from the table (Figure 7) seems the agricultural working of the soil exposes it to problems of instability.
Average annual precipitation (Figure 8) not seem to be an highly correlated parameter, and the most influent can be considered for the band 850–1000 m a.s.l.. It is interesting to note a sort of inverse correlation between the amount of precipitation and the contrast, perhaps distorted by the presence of lithologies less susceptible to landslides.
Average annual precipitation and extreme events (Figure 9) do not show values that are decisive for the assessment of the landslide susceptibility, even if there are classes with higher values of contrast than others. In any case, a strong relationship between extreme precipitation and landslide susceptibility has not been found, which even highlighted areas with low extreme precipitation as the most susceptible.
At the end of this procedure, all the results have been overlapped in order to create a landslide susceptibility map; the value as specified in the methods was calculated on the basis of the Equation (10). The weight of evidence for the province of Macerata is represented by the map (Figure 10) in 5 levels of landslide susceptibility from S1 to S5 with each corresponding to a value between 0.0 and 1.0. Territories with a low probability of being affected by landslides were classified as S1 and S2, a result from S3 to S4 has a landslide susceptibility that starts to become important, while level S5 is an area subject to major hydrogeological instability.
It is important to note in the figure (Figure 10) that in the South-western area, the most mountainous one, the level of landslide susceptibility is unusually low, due to the weight geological formations which have a very low contrast (C), because of more coherent rocks, less prone to the investigated movements. In fact, as specified in the description of the most common movements for each zone of the study area, the mountainous zone shows deep-seated gravitational slope deformations (DGSD) and collapses, movements not analysed in this study. Similarly, the piedmont area has a susceptibility mainly between level 2 and level 3, which makes it an area of low criticality, although there are some areas where susceptibility reaches level 4–5 and therefore need to be managed appropriately. The riverbeds of the most important rivers obviously have a minimal susceptibility level due to the almost non-existent slope as do the coastal stretches in the eastern part. On the other hand, the territories where susceptibility is between S4 and S5 are located in the hilly part, in the centre part of the study area. These areas show pelitic or pelitic-arenaceous geological formations and a land use more oriented to agriculture which generate the most important instability conditions.
Finally, in order to validate the work, many landslides from the IFFI database that were not sampled to develop the model were included, amounting to a total landslide area of 1644.359 Km2. This validation led to the assessment that about 70% of the landslides introduced, are located in a territory with susceptibility level from 2 to 5, while only 30% are located in a territory with low landslide susceptibility, so they can be considered not predicted by the model.

4. Discussion

This study is an example of WoE for the creation of landslide susceptibility maps through the use of GIS softwares, with the addition of an accurate analysis of extreme precipitation. Extreme precipitation seems to have, in the literature, a great influence in the territory subject to slow-motion landslides [37,38], because this type of landslides are sensitive to soil saturation conditions. However, in this case, no statistically significant and systematic values of influence of extreme events or average precipitation on landslides were found. In particular, it is interesting to note that the C is greater in a low range of extreme events, such as 140–145, however further clustering of the variable should be tested in order to exclude this parameter from those influential for landslide susceptibility. There is no growth in C to the increase of precipitation, which is also a result of the geographical and geological characteristics of the area. This can lead to the assessment that the extreme events in the area are not so different that they become significant and can discriminate one area from another. The division into too many classes can be influential, but even reduced classes do not have much higher C values. In any case, a significance of the extreme event cannot be excluded, which is widely documented in the case of surface gravitational phenomena [39,40]. Among the discriminating and statistically significant parameters for the production of landslide movements, there are the slope gradient, which from 5 to 30° shows an excellent correlation, the agricultural terrain and the geological formation MUS, according to the relevant scientific literature [9,41,42]. The validation procedure allowed, the reliability of the model to be assessed at about 70%, in line with many other studies that used the same or different calculation methods [15,43]. Despite the apparent lack of significance of extreme events, the result was nevertheless achieved, in fact a reliable susceptibility map was created according to all the factors considered, which provides a priority for risk mitigation interventions.

5. Conclusions

This outcome, combined with the different parameters mentioned above (geology, slope angle, land use, average precipitation, extreme events), composes a model that leads to an automatic detection of possible landslide areas, in this case very focused on the movements that can be originated by heavy rainfall. It would be interesting to study this area further to evaluate other parameters to be included, in order to take into account all possible landslide movements, without discriminating against some of them. This consideration is very important because it allows to obtain a susceptibility map even where the movements are not clear or studied, but only on the basis of possible combinations. The susceptibility map of the province of Macerata, therefore, can lead to the use of this tool for many protection purposes. This tool could support technical decisions, in order to prioritise interventions in a scientific way. The assessment is currently carried out on the basis of previous evidence or emergencies. In this way it would be possible to prevent the emergencies, improving this map also with other important features like soil type, vegetation cover, etc. Obviously in the future it would be important to support this susceptibility map, with a landslide hazard map, in order to create a real operating system. Then the last step could be to create a risk map that takes into account people, heritage, buildings, but also valuable crops, making a detailed assessment of the stability model.

Author Contributions

Conceptualization, M.G., M.M., G.P.; methodology, M.G.; software, M.G., M.M.; validation, M.G.; formal analysis, M.G., G.P.; investigation, M.G., M.M., G.P.; data curation, M.G.; writing—original draft preparation, M.G., M.M.; writing—review and editing, M.M.; supervision, G.P. All authors have read and agreed to the published version of the manuscript.

Funding

This research received no external funding.

Institutional Review Board Statement

Not applicable.

Informed Consent Statement

Not applicable.

Data Availability Statement

Publicly available datasets were analyzed in this study. This data can be found here: Regione Marche—Sistema Informativo Regionale Meteo-Idro-Pluviometrico; Cartografia on line—IFFI (isprambiente.it).

Conflicts of Interest

The authors declare no conflict of interest.

References

  1. Trigila, A.; Iadanza, C.; Bussettini, M.; Lastoria, B. Dissesto Idrogeologico in Italia: Pericolosità e Indicatori di Rischio—Edizione; Rapporti 287/2018; ISPRAL: Rome, Italy, 2018. [Google Scholar]
  2. Gariano, S.L.; Guzzetti, F. Evaluating the Impact of Climate Change on Landslide Occurrence, Hazard, and Risk: From Global to Regional Scale. In Proceedings of the 19th EGU General Assembly Conference Abstracts, Austria, Vienna, 23–28 April 2017; Volume 19, p. 503. [Google Scholar]
  3. Winter, M.G.; Shearer, B. Climate change and landslide hazard and risk in Scotland. Eng. Geol. Soc. Territ. 2015, 1, 411–414. [Google Scholar]
  4. Crowley, T.J.; Berner, R.A. CO2 and climate change. Science 2001, 292, 870–872. [Google Scholar] [CrossRef] [PubMed]
  5. Falcinelli, S. Fuel production from waste CO2 using renewable energies. Catal Today 2020, 348, 95–101. [Google Scholar] [CrossRef]
  6. Ciabatta, L.; Camici, S.; Brocca, L.; Ponziani, F.; Stelluti, M.; Berni, N.; Moramarco, T. Assessing the impact of climate-change scenarios on landslide occurrence in Umbria Region, Italy. J. Hydrol. 2016, 541, 285–295. [Google Scholar] [CrossRef]
  7. Gariano, S.L.; Petrucci, O.; Rianna, G.; Santini, M.; Guzzetti, F. Impacts of past and future land changes on landslides in southern Italy. REG Environ. Chang. 2018, 18, 437–449. [Google Scholar] [CrossRef]
  8. Tasser, E.; Mader, M.; Tappeiner, U. Effects of land use in alpine grasslands on the probability of landslides. Basic Appl. Ecol. 2003, 4, 271–280. [Google Scholar] [CrossRef]
  9. Chowdhury, R.; Flentje, P. Role of slope reliability analysis in landslide risk management. B Eng. Geol. Environ. 2003, 62, 41–46. [Google Scholar] [CrossRef]
  10. Pachauri, A.K.; Pant, M. Landslide hazard mapping based on geological attributes. Eng. Geol. 1992, 32, 81–100. [Google Scholar] [CrossRef]
  11. Yin, Y.; Wang, F.; Sun, P. Landslide hazards triggered by the 2008 Wenchuan earthquake, Sichuan, China. Landslides 2009, 6, 139–152. [Google Scholar] [CrossRef]
  12. Yilmaz, I. Landslide susceptibility mapping using frequency ratio, logistic regression, artificial neural networks and their comparison: A case study from Kat landslides (Tokat—Turkey). Comput. Geosci. 2009, 35, 1125–1138. [Google Scholar] [CrossRef]
  13. Lee, S.; Min, K. Statistical analysis of landslide susceptibility at Yongin, Korea. Environ. Geol. 2001, 40, 1095–1113. [Google Scholar] [CrossRef]
  14. Pourghasemi, H.R.; Pradhan, B.; Gokceoglu, C.; Mohammadi, M.; Moradi, H.R. Application of weights-of-evidence and certainty factor models and their comparison in landslide susceptibility mapping at Haraz watershed, Iran. ARAB J. Geosci. 2013, 6, 2351–2365. [Google Scholar] [CrossRef]
  15. Vakhshoori, V.; Zare, M. Landslide susceptibility mapping by comparing weight of evidence, fuzzy logic, and frequency ratio methods. Geomat. Nat. Hazards Risk 2016, 7, 1731–1752. [Google Scholar] [CrossRef]
  16. Bonham-Carter, G.F. Integration of Geoscientific Data Using GIS. In Geographic Information Systems: Principles and Applications: Longman; Maguire, D.J., Goodchild, M.F., Rhind, D.W., Eds.; Longdom: Brussels, Belgium, 1991; Volume 2, pp. 171–184. [Google Scholar]
  17. Agterberg, F.P.; Bonham-Carter, G.F.; Cheng, Q.; Wright, D.F. Weights of Evidence Modeling and Weighted Logistic Regression in Mineral Potential Mapping. In Computers in Geology; Davis, J.C., Herzfeld, U.C., Eds.; Oxford University Press: New York, NY, USA, 1993; pp. 13–32. [Google Scholar]
  18. Regmi, N.R.; Giardino, J.R.; Vitek, J.D. Modeling susceptibility to landslides using the weight of evidence approach: Western Colorado, USA. Geomorphology 2010, 115, 172–187. [Google Scholar] [CrossRef]
  19. Kayastha, P.; Dhital, M.R.; De Smedt, F. Landslide susceptibility mapping using the weight of evidence method in the Tinau watershed, Nepal. Nat. Hazards 2012, 63, 479–498. [Google Scholar] [CrossRef]
  20. Barbieri, G.; Cambuli, P. The Weight of Evidence Statistical Method in Landslide Susceptibility Mapping of the Rio Pardu Valley (Sardinia, Italy). In Proceedings of the 18th World IMACS Congress and MODSIM09 International Congress on Modelling and Simulation: Interfacing Modelling and Simulation with Mathematical and Computational Sciences, Cairns, Australia, 13–17 July 2009; pp. 2658–2664. [Google Scholar]
  21. Piacentini, D.; Troiani, F.; Soldati, M.; Notarnicola, C.; Savelli, D.; Schneiderbauer, S.; Strada, C. Statistical analysis for assessing shallow-landslide susceptibility in South Tyrol (south-eastern Alps, Italy). Geomorphology 2012, 151, 196–206. [Google Scholar] [CrossRef]
  22. Cervi, F.; Berti, M.; Borgatti, L.; Ronchetti, F.; Manenti, F.; Corsini, A. Comparing predictive capability of statistical and deterministic methods for landslide susceptibility mapping: A case study in the northern Apennines (Reggio Emilia Province, Italy). Landslides 2010, 7, 433–444. [Google Scholar] [CrossRef]
  23. Gentilucci, M.; Barbieri, M.; Burt, P. Climatic Variations in Macerata Province (Central Italy). Water Sui 2018, 10, 1104. [Google Scholar] [CrossRef] [Green Version]
  24. Gentilucci, M.; Bisci, C.; Burt, P.; Fazzini, M.; Vaccaro, C. Interpolation of Rainfall through Polynomial Regression in the Marche Region (Central Italy). In The Annual International Conference on Geographic Information Science; Springer: Cham, Switzerland, 2018; pp. 55–73. [Google Scholar]
  25. Gentilucci, M.; Materazzi, M.; Pambianchi, G.; Burt, P.; Guerriero, G. Assessment of Variations in the Temperature-Rainfall Trend in the Province of Macerata (Central Italy), Comparing the Last Three Climatological Standard Normals (1961–1990; 1971–2000; 1981–2010) for Biosustainability Studies. Environ. Process. 2019, 6, 1–22. [Google Scholar] [CrossRef]
  26. Gentilucci, M.; Barbieri, M.; Lee, H.S.; Zardi, D. Analysis of Rainfall Trends and Extreme Precipitation in the Middle Adriatic Side, Marche Region (Central Italy). Water 2019, 11, 1948. [Google Scholar] [CrossRef] [Green Version]
  27. Beniston, M.; Stephenson, D.B.; Christensen, O.B.; Ferro, C.A.; Frei, C.; Goyette, S.; Halsnaes, K.; Holt, T.; Jylhä, K.; Koffi, B.; et al. Future extreme events in European climate: An exploration of regional climate model projections. Clim. Chang. 2007, 81, 71–95. [Google Scholar] [CrossRef] [Green Version]
  28. Gentilucci, M.; Barbieri, M.; Burt, P. Climate and Territorial Suitability for the Vineyards Developed Using GIS Techniques. In Exploring the Nexus of Geoecology, Geography, Geoarcheology and Geotourism: Advances and Applications for Sustainable Development in Environmental Sciences and Agroforestry Research; Springer: Cham, Switzerland, 2019; pp. 11–13. [Google Scholar]
  29. Dramis, F.; Farabollini, P.; Gentili, B.; Pambianchi, G. Neotectonics and Large-Scale Gravitational Phenomena in the Umbria–Marche Apennines, Italy. In Proceedings of the Seismically Induced Ground Ruptures and Large Scale Mass Movements. Field Excursion and Meeting, Apennines, Italy, 21–27 September 2001; Volume 4, pp. 17–30. [Google Scholar]
  30. Kweon, I.S.; Kanade, T. Extracting topographic terrain features from elevation maps. Cvgip Image Underst. 1994, 59, 171–182. [Google Scholar] [CrossRef]
  31. Ninyerola, M.; Pons, X.; Roure, J.M. A methodological approach of climatological modelling of air temperature and precipitation through gis techniques. Int. J. Clim. 2000, 20, 1823–1841. [Google Scholar] [CrossRef]
  32. Qin, Q.; Wang, H.; Lei, X.; Li, X.; Xie, Y.; Zheng, Y. Spatial variability in the amount of forest litter at the local scale in northeastern China: Kriging and cokriging approaches to interpolation. Ecol. Evol. 2020, 10, 778–790. [Google Scholar] [CrossRef] [Green Version]
  33. Gentilucci, M.; Barbieri, M.; Burt, P.; D’Aprile, F. Preliminary data validation and reconstruction of temperature and precipitation in Central Italy. Geosciences 2018, 8, 202. [Google Scholar] [CrossRef] [Green Version]
  34. Gilleland, E.; Katz, R.W. extRemes 2.0: An extreme value analysis package in R. J. Stat. Softw. 2016, 72, 1–39. [Google Scholar] [CrossRef] [Green Version]
  35. Sumaryono, D.M.; Sulaksana, N.; DasaTriana, Y. Weights of Evidence Method for Landslide Susceptibility Mapping in Tandikek and Damar Bancah, West Sumatra, Indonesia. Int. J. Sci. Res. (IJSR) 2015, 4, 1283–1290. [Google Scholar]
  36. Mattioli, M.; Pieruccini, P.; Pennacchioni, E.; Piergiovanni, A.; Sandroni, P.; Tosti, S.; Tramontana, M. PROGETTO CARG, Note Illustrative Della Carta Geologica d’Italia 1:50.000. 2002. Available online: https://www.facebook.com/PaginaUfficialeRegioneMarche/ (accessed on 1 November 2020).
  37. Macfarlane, D.F. Observations and predictions of the behaviour of large, slow-moving landslides in schist, Clyde Dam reservoir, New Zealand. Eng. Geol. 2009, 109, 5–15. [Google Scholar] [CrossRef]
  38. Ferlisi, S.; Peduto, D.; Gullà, G.; Nicodemo, G.; Borrelli, L.; Fornaro, G. The Use of DInSAR Data for the Analysis of Building Damage Induced by Slow-Moving Landslides. In Engineering Geology for Society and Territory-Volume 2; Springer: Cham, Switzerland, 2015; pp. 1835–1839. [Google Scholar]
  39. Clarke, M.L.; Rendell, H.M. Process–form relationships in Southern Italian badlands: Erosion rates and implications for landform evolution. Earth Surface Processes and Landforms. J. Br. Geomorphol. Res. Group 2006, 31, 15–29. [Google Scholar]
  40. Papathoma-Koehle, M.; Keiler, M.; Totschnig, R.; Glade, T. Improvement of vulnerability curves using data from extreme events: Debris flow event in South Tyrol. Nat. Hazards 2012, 64, 2083–2105. [Google Scholar] [CrossRef]
  41. Bordoni, M.; Galanti, Y.; Bartelletti, C.; Persichillo, M.G.; Barsanti, M.; Giannecchini, R.; Meisina, C. The influence of the inventory on the determination of the rainfall-induced shallow landslides susceptibility using generalized additive models. CATENA 2020, 193, 104630. [Google Scholar] [CrossRef]
  42. Pánek, T.; Brázdil, R.; Klimeš, J.; Smolková, V.; Hradecký, J.; Zahradníček, P. Rainfall-induced landslide event of May 2010 in the eastern part of the Czech Republic. Landslides 2011, 8, 507–516. [Google Scholar] [CrossRef]
  43. Polykretis, C.; Chalkias, C. Comparison and evaluation of landslide susceptibility maps obtained from weight of evidence, logistic regression, and artificial neural network models. Nat. Hazards 2018, 93, 249–274. [Google Scholar] [CrossRef]
Figure 1. Geography of the province of Macerata [23].
Hydrology 08 00005 g001
Figure 2. Map of sampled landslides.
Hydrology 08 00005 g002
Figure 3. IDF curve of Tolentino for the interval time of 24 h. Dotted line is the confidence interval after 1000 attempts. The black line is the one risulting from the analysis.
Hydrology 08 00005 g003
Figure 4. Model flow diagram.
Hydrology 08 00005 g004
Figure 5. (Left) Geological map of Macerata Province; (Right) The weights calculated for the geology parameter, (W+) positive weights, (W) negative weights, (C) contrast; formations are described by the CARG PROJECT [36].
Hydrology 08 00005 g005
Figure 6. (Left) Map of slope angle of Macerata province; (Right) The weights calculated for the slope parameter.
Hydrology 08 00005 g006
Figure 7. (Left) Land use of Macerata province, from Corinne Land Cover; (Right) The weights calculated for the land use parameter.
Hydrology 08 00005 g007
Figure 8. (Left) Annual average precipitation in Macerata Province; (Right) The weights calculated for annual average precipitation parameter.
Hydrology 08 00005 g008
Figure 9. (Left) Annual extreme events of the Macerata Province; (Right) The weights calculated for extreme events parameter.
Hydrology 08 00005 g009
Figure 10. (Left) Landslide susceptibility of the Province of Macerata; (Right) Area of landslides introduced as a result of the validation procedure, in relation to the landslide susceptibility level predicted by the model of this study.
Hydrology 08 00005 g010
Table 1. Example of calculation of return period 100 years of precipitation for Tolentino rain gauge.
Rain GaugeReturn Period 100 Years (mm)
Tolentino 1 h58.0
Tolentino 3 h72.3
Tolentino 6 h84.8
Tolentino 12 h108.8
Tolentino 24 h137.9
Publisher’s Note: MDPI stays neutral with regard to jurisdictional claims in published maps and institutional affiliations.

