Abstract
Global warming together with environmental pollution threatens marine habitats and causes an increasing number of environmental disasters. Periodic monitoring of coastal water quality is of critical importance for the effective management of water resources and the sustainability of marine ecosystems. The use of remote sensing technologies provides significant benefits for detecting, monitoring, and analyzing rapidly occurring and displaced natural phenomena, including mucilage events. In this study, five water indices estimated from cloud-free and partly cloudy Sentinel-2 images acquired from May to July 2021 were employed to effectively map mucilage aggregates on the sea surface in the Izmit Bay using the cloud-based Google Earth Engine (GEE) platform. Results showed that mucilage aggregates started with the coverage of about 6 km² sea surface on 14 May, reached the highest level on 24 May and diminished at the end of July. Among the applied indices, the Adjusted Floating Algae Index (AFAI) was superior for producing the mucilage maps even for the partly cloudy image, followed by Normalized Difference Turbidity Index (NDTI) and Mucilage Index (MI). To be more specific, indices using green channel were found to be inferior for extracting mucilage information from the satellite images.
1. Introduction
According to Global Risk Report 2020, the top five risks in terms of likelihood are extreme weather, climate action failure, natural disasters, biodiversity loss, and human-made environmental disasters. Water crises, including water pollution and other water issues, is ranked in the top 10 risks in terms of their impacts. In this regard, water pollution has become a major issue, particularly in developing countries. On the other hand, global warming and climate change, rising average temperatures causing extreme weather conditions, have become a major concern that has been investigated for their reasons and drastic outcomes. They have caused a surge in natural disasters, including melting glaciers, volcanic movements, forest fires, desertification, floods, and landslides. Marine mucilage also called “sea snot”, which usually outbreaks after the eutrophication period and is caused by stressed phytoplankton communities, is another harmful effect of global warming. The increased amount of domestic and industrial pollution, excessive fishing and the existence of invasive species in the aquatic environments may be given as other major factors for its occurrence [1]. Based on in situ observations, it is also reported that there is a strong relationship between the system that triggered the mucilage event and the high abundance of jelly-like organisms in the environment [2]. Mucilage events cause substantial economic losses and destroy the balance in the aquatic ecosystem, adversely affecting all species in the sea, particularly the ones on the seabed. Floating, sticky and mucilaginous macroaggregates can be found in different forms, colors, and dimensions, which are categorized into ten specific types in terms of their size ranging from centimeter to kilometer, and shape together with their relative position in the water [3].
Although marine mucilage events have been observed in the oceans since 1729, uncertainty remains about the reasons for their emergence under different water and environmental conditions. They generally appear after sudden changes in the biogeochemical properties of the water and occur with long-lasting calm weather conditions, weak water circulation in spring and fall terms, and reduced levels of nutrient (nitrogen and phosphorus) supply coming from rivers. Therefore, stability along the water column and sudden increase in water temperature can be given as the leading causes of mucilage events when intensive production processes and stable meteorological conditions exist [4,5,6,7]. For the continuity of mucilage events, temperature changes, wind speed, and amount of rainfall are the most effective factors [8].
With frequent appearances in the Adriatic and Tyrrhenian Seas, mucilage events have been observed in different parts of the world [7,9,10,11,12]. In the Turkish seas, after the first reported mucilage occurrence observed in the water column around Erdek Bay in 1992, a massive mucilage event occurred in the Sea of Marmara between October 2007 and February 2008, severely affecting the Bosporus and Dardanelles Straits [13,14,15]. In the Çanakkale Strait, mucilage events were also observed between September 2007 and July 2008, and then more severely in March 2021. Another mucilage outbreak was reported in the water column of the Dardanelles in December 2020 [16]. Following the extreme fishery activities in 2018, increased populations of Salpa colonies, Rhizostoma pulmo, Aurelia aurita species, and decreased phytoplankton and zooplankton populations were observed in the Sea of Marmara [2]. In Spring 2021, a major mucilage event was recorded in the Sea of Marmara that turned into a natural catastrophe. The organic structure of the mucilage cover was much more intense, and the effect was more severe compared to 2007–2008 [17]. Floating sticky and gelatinous mucilage aggregates controlled by the wind and currents accumulated on the coasts and diminished recreational suitability. Intensive fieldwork was conducted by both by Turkish Ministry of Environment, Urbanization and Climate Change (TMEUCC) and the municipalities to collect the aggregated from the sea surface (>11,000 m³). Underwater observations conducted for several months revealed that the mucilage was spread throughout the water column, decreasing the visibility, and then collapsed to the seabed.
The Sea of Marmara (11,350 km2) connecting the Black Sea with the Aegean Sea through the Straits of Bosporus and Dardanelles has an exceptional two-layer circulation system [18]. The hydrodynamics of the Sea of Marmara is much more complex than that of other seas in the world [19]. Its complex structure is caused by the water bodies moving in layers within the system. Since the salinity in the Black Sea is lower compared to the Aegean Sea, an upper stream of water with low salinity (~0–25 m) is formed from the Black Sea towards the North Aegean Sea. Similarly, a high salinity bottom water flow is observed in the opposite direction from the Mediterranean Sea to the Sea of Marmara. In addition to the salinity layers, there are also temperature layers that show seasonal changes due to the heating under the influence of solar radiation. It should be pointed out that its eutrophic-mesotrophic upper layer is highly prone to anthropogenic and natural disturbances [20]. Many anthropogenic activities including heavy industrialization, urbanization and intense fishing activities take place around the Sea of Marmara, which is surrounded by mega cities including Istanbul, Kocaeli, Bursa, and Çanakkale. These activities certainly have harmful effects on the welfare of the ecosystem. According to the official statistics provided by The Turkish State Meteorological Service, while the mean water temperature in the Sea of Marmara was 15 °C, it increased to 16.8 °C in the last decade (https://mgm.gov.tr, accessed on 10 March 2021). Considering the monthly mean temperatures between 1970 and 2021, the hottest May was in 2021 at 19 °C (https://mgm.gov.tr, accessed on 10 March 2021). Ref. [20] underline the potential risk of an increase in the number and extent of the phytoplankton blooms that may result in a total collapse of the water ecosystem. To protect and improve the ecosystem in the Sea of Marmara, TMEUCC declared a conservation action plan including 22 governmental actions.
In the case of Izmit Bay, which is selected for this study, heavy industrialization and urbanization have taken place during the past several decades [21]. The coast of the study site is full of industrial factories and facilities, including petroleum refineries, cement, fertilizer, metal, pesticides, detergent, and dye factories. The area is also subject to intense shipping activities all year round [14,22]. All these activities cause water pollution, resulting in frequent eutrophication events after the observation of potentially harmful species that have a tendency for blooming [23,24,25,26,27]. In fact, a series of red tides were observed in the Bay in 2015.
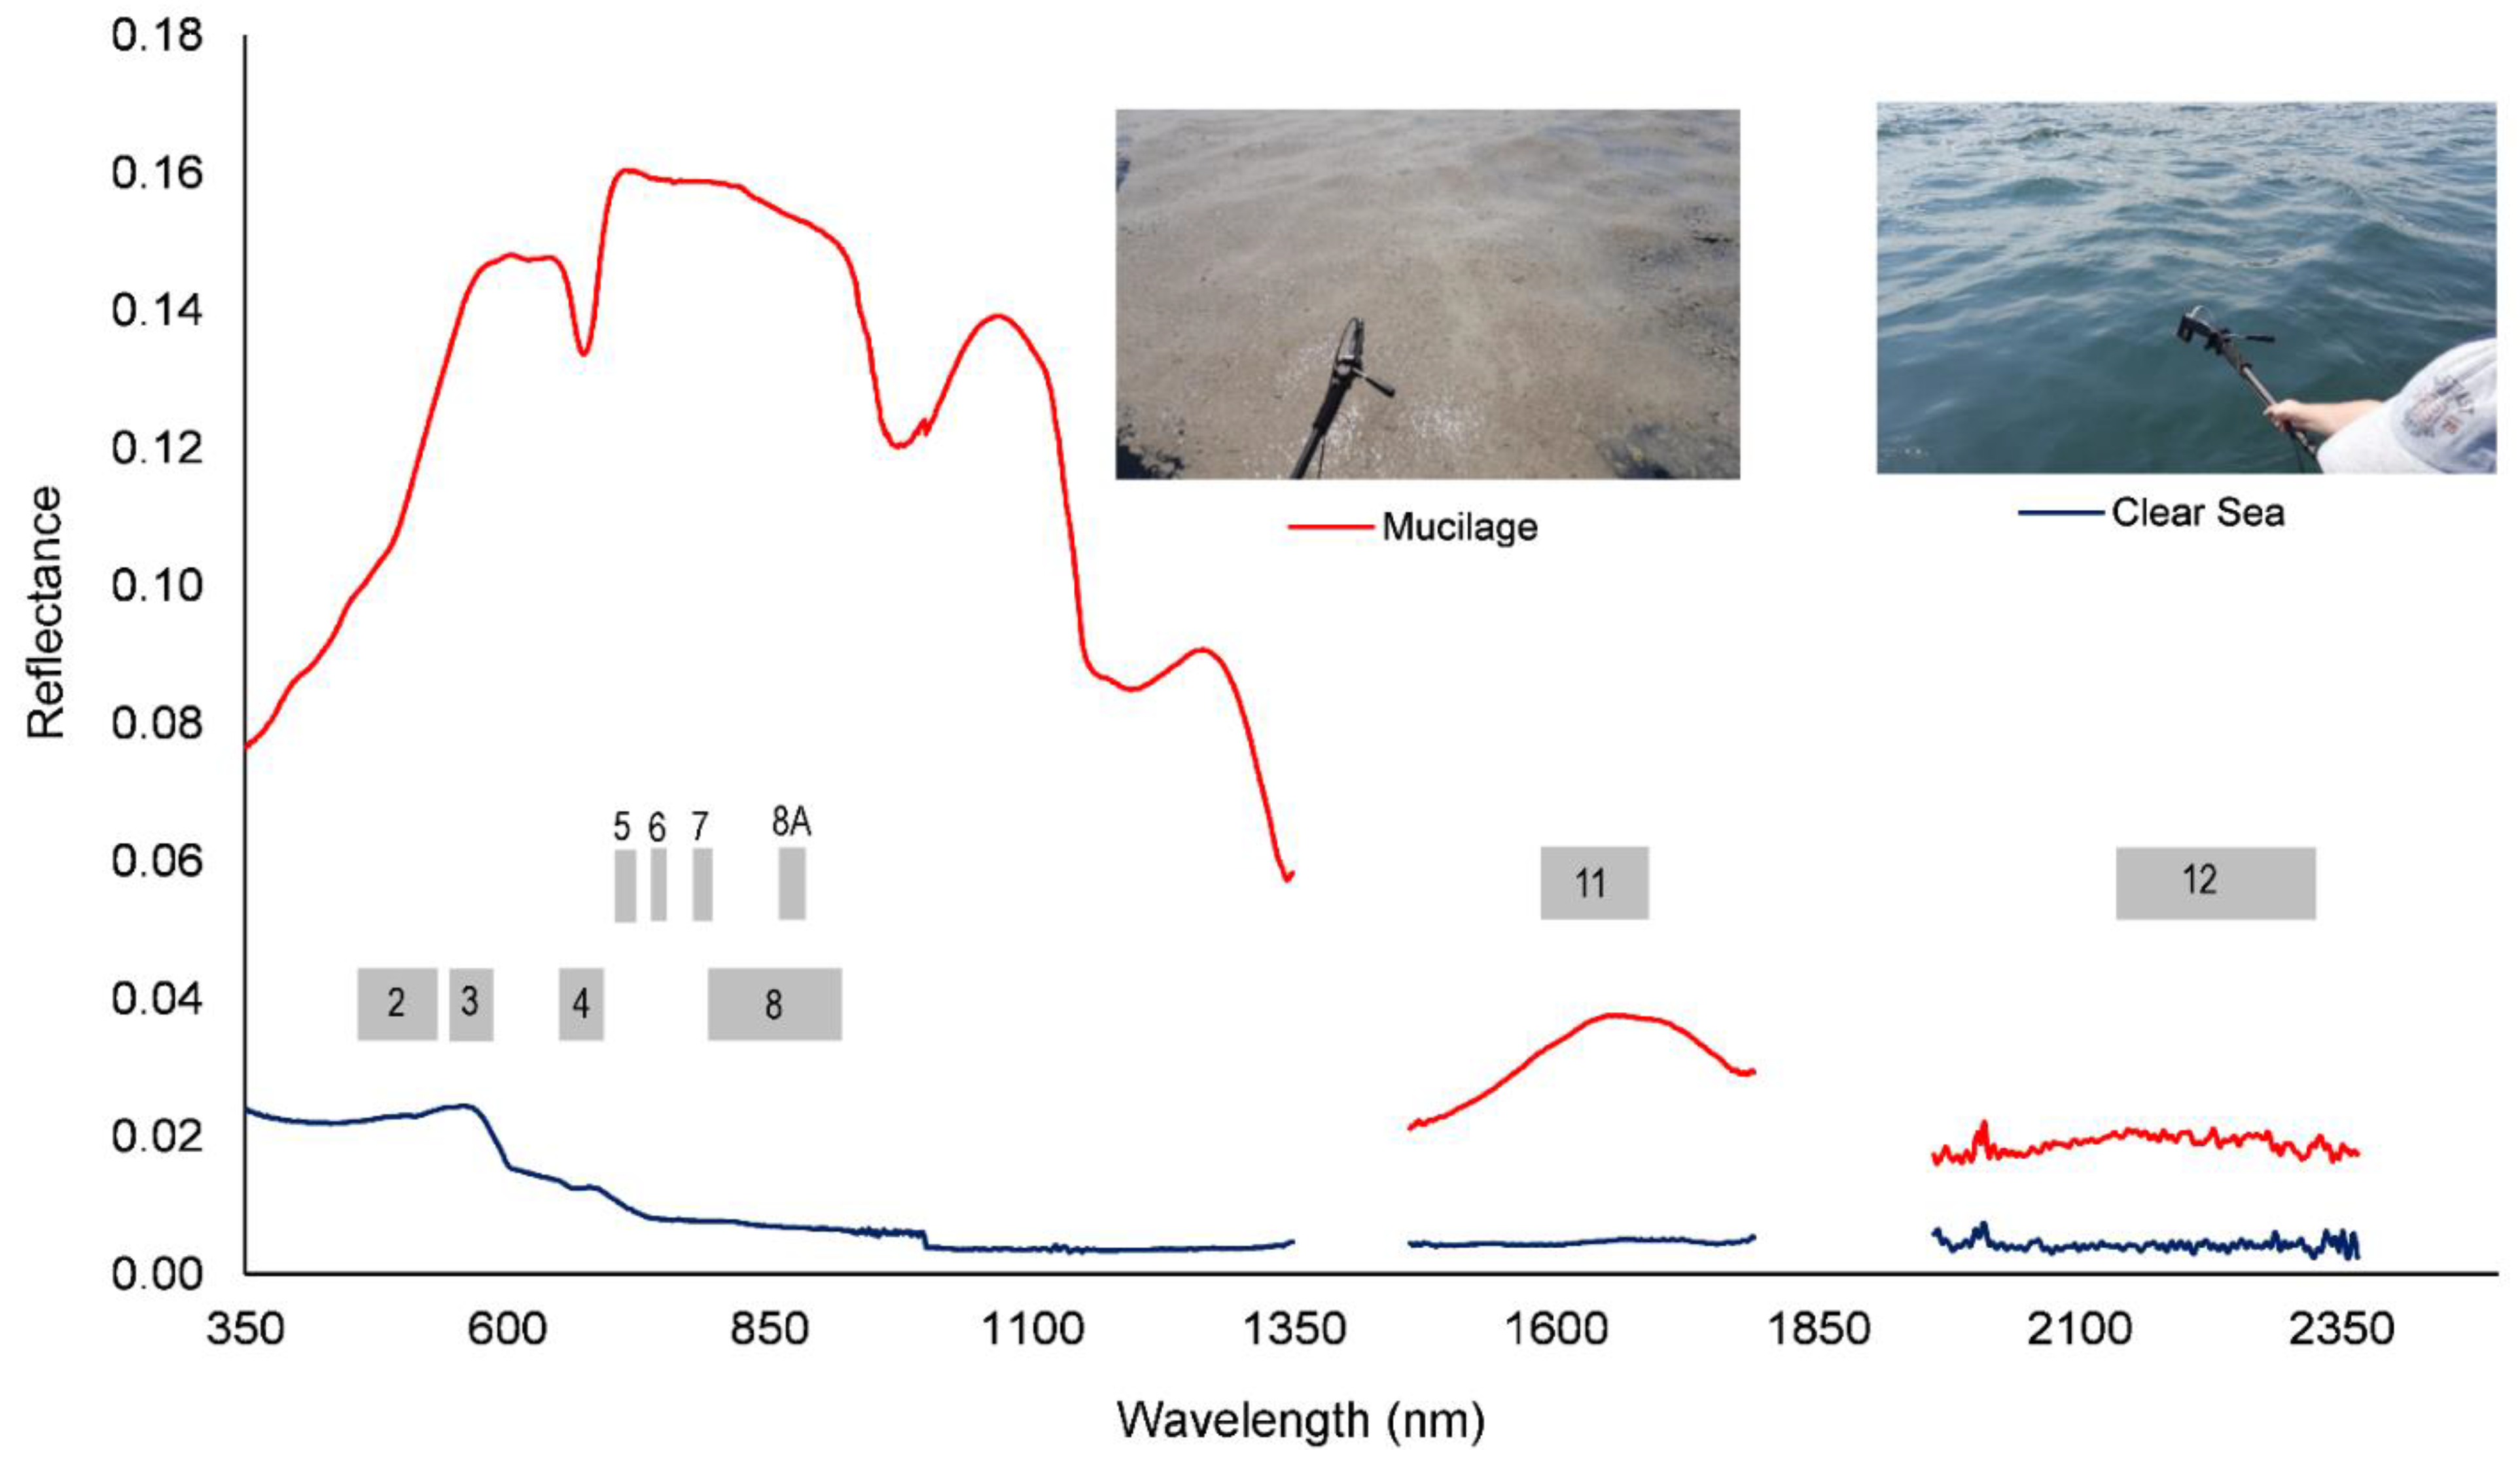
Monitoring sea surface mucilage and mapping its spatial distributions provide valuable information to the local authorities and decision-makers in developing prevention and rehabilitation strategies. Since the 1970s, remote sensing has been the most effective approach for detecting and monitoring water quality and water pollution. Spectral, spatial, temporal, and polarization signatures are major characteristics of the remote sensing sensors, helping to measure water characteristics [28]. Marine remote sensing is a subfield of remote sensing with a continuously expanding agenda. Various studies include ecosystem characterization, biodiversity assessment, oil spill detection, monitoring algal blooms, and modeling seasonal and annual ocean circulation patterns. With recently launched sensors, finer spatial resolutions, more spectral bands, higher radiometric resolutions, and shorter temporal resolutions can be achieved, opening new horizons for researchers to investigate biophysical aspects of the oceanic and nearshore environments. For detecting and monitoring water quality (i.e., dissolved organic matter, chlorophyll, and total suspended matter) the use of satellite data with visible and infrared spectra together with hyperspectral imagery has already been proposed by researchers (e.g., [28,29,30,31]). A recent study conducted by [31] presents the spectral signatures of clear water and floating mucilage in Izmit Bay (Figure 1). Band widths of Sentinel-2 imagery at 10 m and 20 m spatial resolution are shown on the figure. As can be seen from the curves, they are extremely distinct from each other. On the other hand, the spectral signature curve of mucilage resembles the reflectance of algal blooms with higher reflectance in the near-infrared channel.

Figure 1.
The spectral signature of clear water and floating mucilage. Note that 2, 3 …, 12 represent the locations of the Sentinel-2 bands used in this study.
In recent years, there have been noteworthy developments in storing, processing, and analyzing data in cloud computing systems. Cloud-based Google Earth Engine (GEE) is a new technology platform that enables planet-scale monitoring, measurement, and analysis of changes in the Earth with its extensive data catalog, and large-scale computation system optimized for parallel processing of geospatial data. It provides a basis for studies in many fields due to its large data archive, code editor interface programmed to develop algorithms, and online access without being connected to a single computer. In this study, the GEE platform was used to produce mucilage maps of the Izmit Bay by applying water and mucilage indices. Six cloud-free and one cloudy Sentinel-2 images for the period of May to July 2021 acquired at 5-day intervals when mucilage outbreak was observed in the Sea of Marmara were obtained from the Copernicus hub and employed for further analyses. In-house JavaScript codes were developed in the GEE environment for retrieving, processing, and mapping the Sentinel-2 images using the selected water and mucilage indices.
2. Study Area and Data
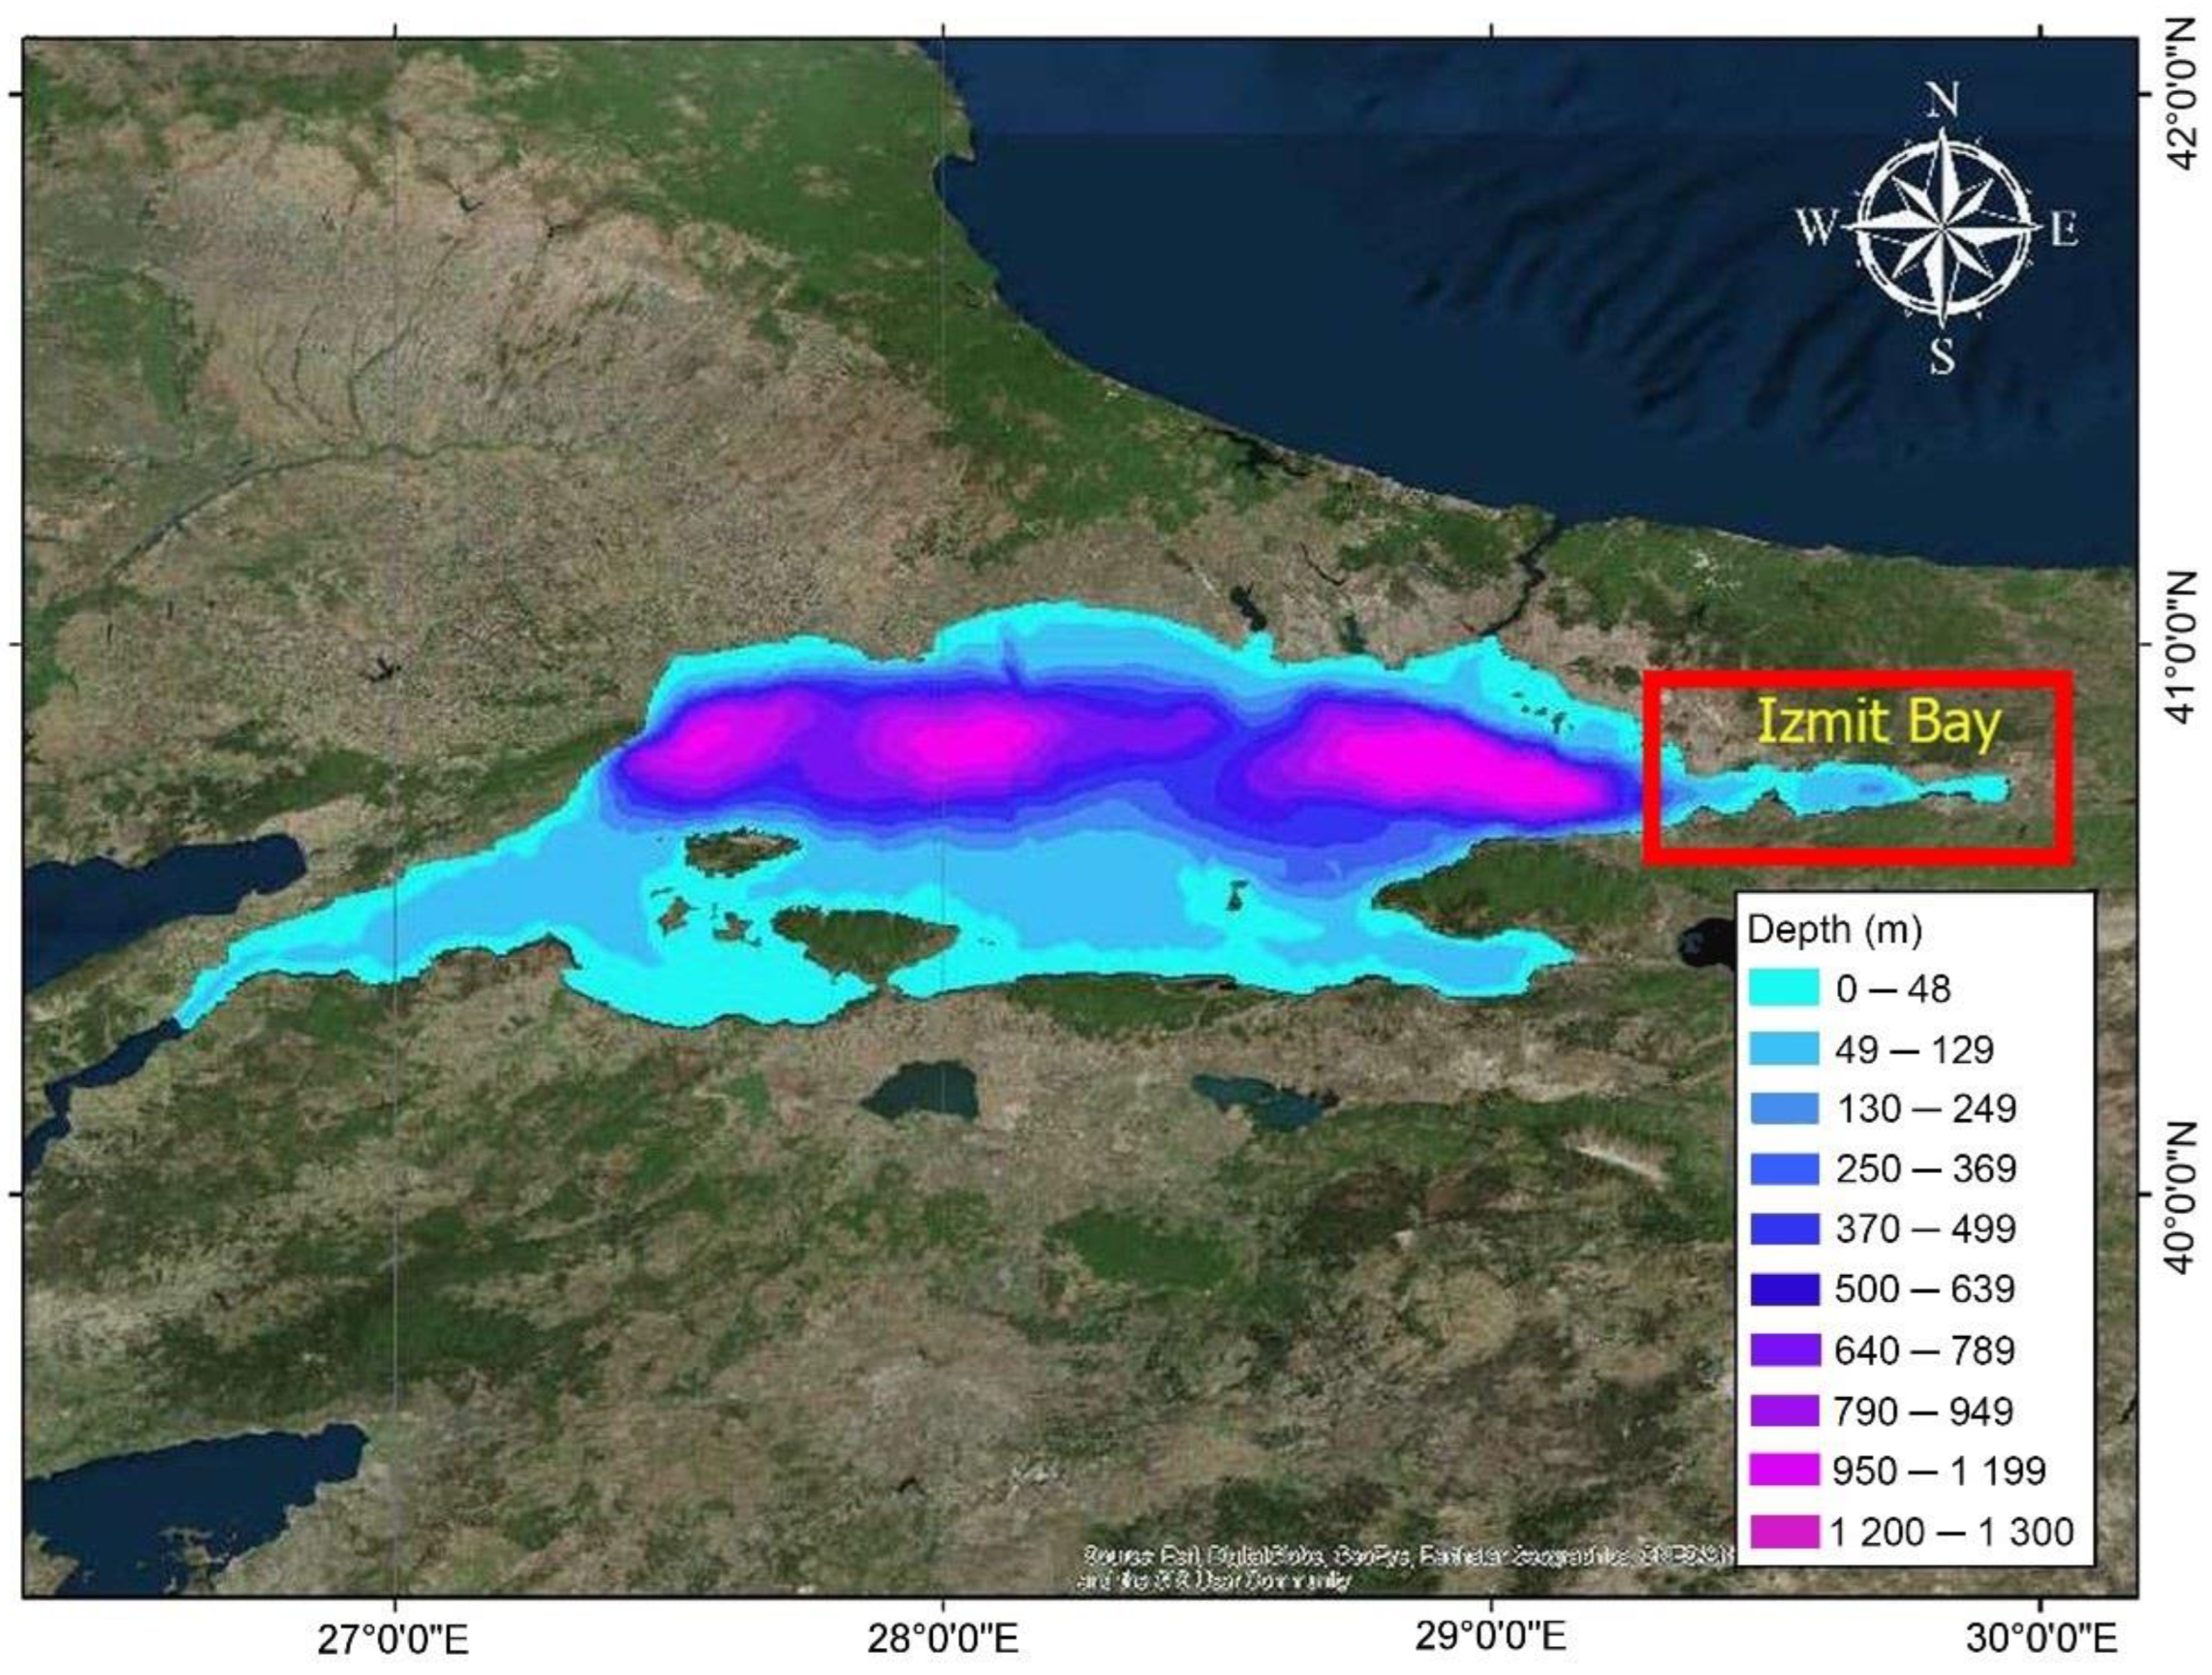
The Marmara Sea, which is a semi-closed basin, has a two-layer water system formed as a result of the water exchange between the Black Sea and the Aegean Sea. Since the salinity levels in neighboring seas are different, the salinity of the Black Sea waters flows in the thin layer on the surface of Marmara (0–25m), and below this layer, salty waters enter from the Aegean Sea. Surrounded by highly urbanized and industrialized cities, the Sea of Marmara, located on the main transportation route is under high pressure from household and industrial pollution. For several decades poorly treated wastewater of mega cities has been discharged into the sea. As selected for this study, Izmit Bay, located in the east part of the Sea of Marmara (Figure 2), is under the constant pressure of pollution. The Bay has a weaker circulation compared to the other parts of the Marmara Sea [32]. The deepest point is 208 m, located in the central part of the Bay. The main reason for the low oxygen content in the Bay is a load of organic matter deposited from the upper layer and the oxygen consumed because of the metabolic activities of the organisms in the lower layer [2].
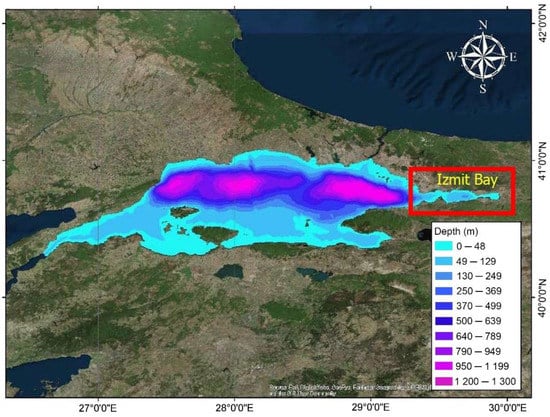
Figure 2.
Bathymetry of Marmara Sea [33].
In this study, Sentinel-2 images acquired by European Space Agency (ESA) were used as the main data source. The Sentinel-2 mission started in 2015 and has a twin satellite constellation providing images at 5-day intervals. Both satellites carry Multi-Spectral Instrument (MSI) providing 4-bands at 10 m spatial resolution, 6-bands at 20 m spatial resolution, and 3-bands at 60 m spatial resolution with 12-bit radiometric resolution (Table 1). Radiometrically and atmospherically corrected Level-2A images acquired on May 14, 19, 24, and July 13, 18 and 28 having no clouds and June 13 having thin clouds were obtained from Sentinel’s Scientific Data Hub (https://scihub.copernicus.eu/dhus/#/home, accessed on 30 July 2021). It should be mentioned that June 2021 was generally cloudy and rainy, which makes optical satellite images impossible to be used in such a study. Due to these weather conditions and 5-day satellite acquisition frequency, cloud-free images could not be obtained for June 2021. However, for testing the effectiveness of considered indices in the delineation of mucilage-covered areas when thin or small clouds exist, an image acquired on 13 June 2021, was employed in this research.

Table 1.
Technical specifications of Sentinel-2 products.
3. Methodology
This study was carried out on the cloud-based GEE platform, using the JavaScript coding language. In the first step of the study, satellite images acquired in May, June and July 2021 were selected and downloaded from the hub considering the cloud ratio. Since both cloud and mucilage may give spectrally similar reflectances, obstructing the separation via spectral indices and classifiers, cloud-free images were firstly downloaded from the database. In addition, an image including clouds was employed to test the performances of the considered water indices. For this purpose, five water-related indices were employed to extract mucilage-covered areas from the Sentinel-2 images.
3.1. Google Earth Engine
Launched by Google towards the end of 2010, Google Earth Engine (GEE) is an open-access cloud computing platform that primarily enables the management, processing, and analysis of publicly available big geospatial data. The GEE platform contains more than 40 years of remotely sensed raster data up to petabytes (e.g., Landsat, Sentinel, MODIS and ALOS) [34] as well as vector-based spatial data representing some social and demographic information [35]. The users take advantage of the high-speed parallel processing of Google system architecture without needing a high-performance supercomputer system. With an online code editor, which is one of the important components of the platform, users can write scripts, develop complex file commands, and debug them. In addition, the system API allows users to employ a series of operational tools such as machine learning algorithms, data visualization, and feature collection through client libraries within the Python and JavaScript programming languages.
Until now, the GEE platform has been actively utilized in many geospatial data science and remote sensing practices, including wetland mapping and monitoring [36], albedo trend [37], land use land cover mapping [38], crop yield estimation [39], natural disaster identification and prediction [40], and drought monitoring [41], chiefly because of its promising prospects mentioned above. In this regard, Ref. [42] reported that the use of this cloud-based platform has significantly increased in recent years, and it is expected that this upward trend will continue in the future due to the potential engagement in different domains [43].
3.2. Spectral Water-Related Indices
In remote sensing, many water-related indices (e.g., ABDI, ANDWI, AWE, FAI, MNDWI, NDAVI, NDCI, NDTI, SWI, WI) have been proposed and applied by researchers for the extraction of different characteristics of water. While some of them focus on the detection of algal blooms, some others focus on the clarity or turbidity of the water. Considering the research question in this study, separation of mucilage, particularly low-density mucilage, from the clear water surface and algal types is a difficult task due to the spectral similarity, revisit frequency, and spatial resolution of the sensors. It should be also mentioned that mucilage is commonly observed in thin and long lines or tracks on the water surface.
Attempts have been made by researchers to analyze the color of the oceans and extract information about the objects on the top layer of the water. Since researchers usually study the colors of open oceans, indices were mainly developed for lower spatial resolution imagery, particularly for MODIS imagery. To the best of the author’s knowledge, the spectral index solely developed for detecting mucilage formation in the literature was the Mucilage Index (MI) proposed by [44] who successfully applied the index to the MODIS images of the Adriatic Sea to map mucilage events occurring in the summer of 2004. The numerator of the formula enhances the decrease of reflectance typical of mucilaginous material in the channel 3 compared to the average values of the channels 2 and 4. The low reflectance in the band 3 (459–479 nm) and the highest reflectance in band 4 (545–565 nm) are confirmed by measurements in situ with radiometers made in previous studies. The channel 6 in the formula is at the denominator because it usually has a very high value in case of the clouds and very low in case of mucilage [7]. It was reported by [44] that MI values ranging from 0 to 5 correspond to the occurrence of mucilage. However, Ref. [7] determined the optimal MI range as between 0.05 and 0.45 applying to the ARPA Campania dataset. At this point, it should be mentioned that the MI index and Floating Algae Index (FAI) [45] were originally developed for MODIS data. However, they can be easily adapted to Sentinel-2 imagery by considering the bandwidths of the corresponding bands. An improved version of FAI called adjusted FAI (AFAI) proposed by Ref. [46] was also employed in this study. The formulation is different to FAI, where the center wavelength is ignored since algae floating on the water surface have higher reflectance in the NIR than in other bands. On the other hand, recent indices including Normalized Difference Water Index (NDWI) and Normalized Difference Turbidity Index (NDTI) were developed and applied to higher resolution imagery. Green and NIR bands are employed in the estimation of NDWI with similar formulation to NDVI. Green and NIR wavelengths were selected to: (1) maximize the typical reflectance of water features by using green light wavelengths; (2) minimize the low reflectance of NIR by water features; and (3) take advantage of the high reflectance of NIR by terrestrial vegetation and soil features [47]. Although the NDWI may not distinguish between suspended sediments and chlorophyll a, it can provide information about the overall turbidity. On the other hand, clear water has a distinct reflectance of weak response in the green, very small in the red and almost zero response in the near infrared wavelength. Green and red wavelengths were used in the NDTI formulation to estimate different degrees of turbidity.
In this study, surface mucilage aggregates were mapped using the above-mentioned spectral indices. The formulations of these indices with corresponding references are given in Table 2. It should be mentioned that two versions of NDWI proposed by [47,48] were employed in this research. Quantitative and qualitative assessments were performed on the thematic maps produced by applying index equations to the selected Sentinel-2 images.
Table 2.
Water-related indices formulated with Sentinel-2 spectral bands and used in this study.
4. Results
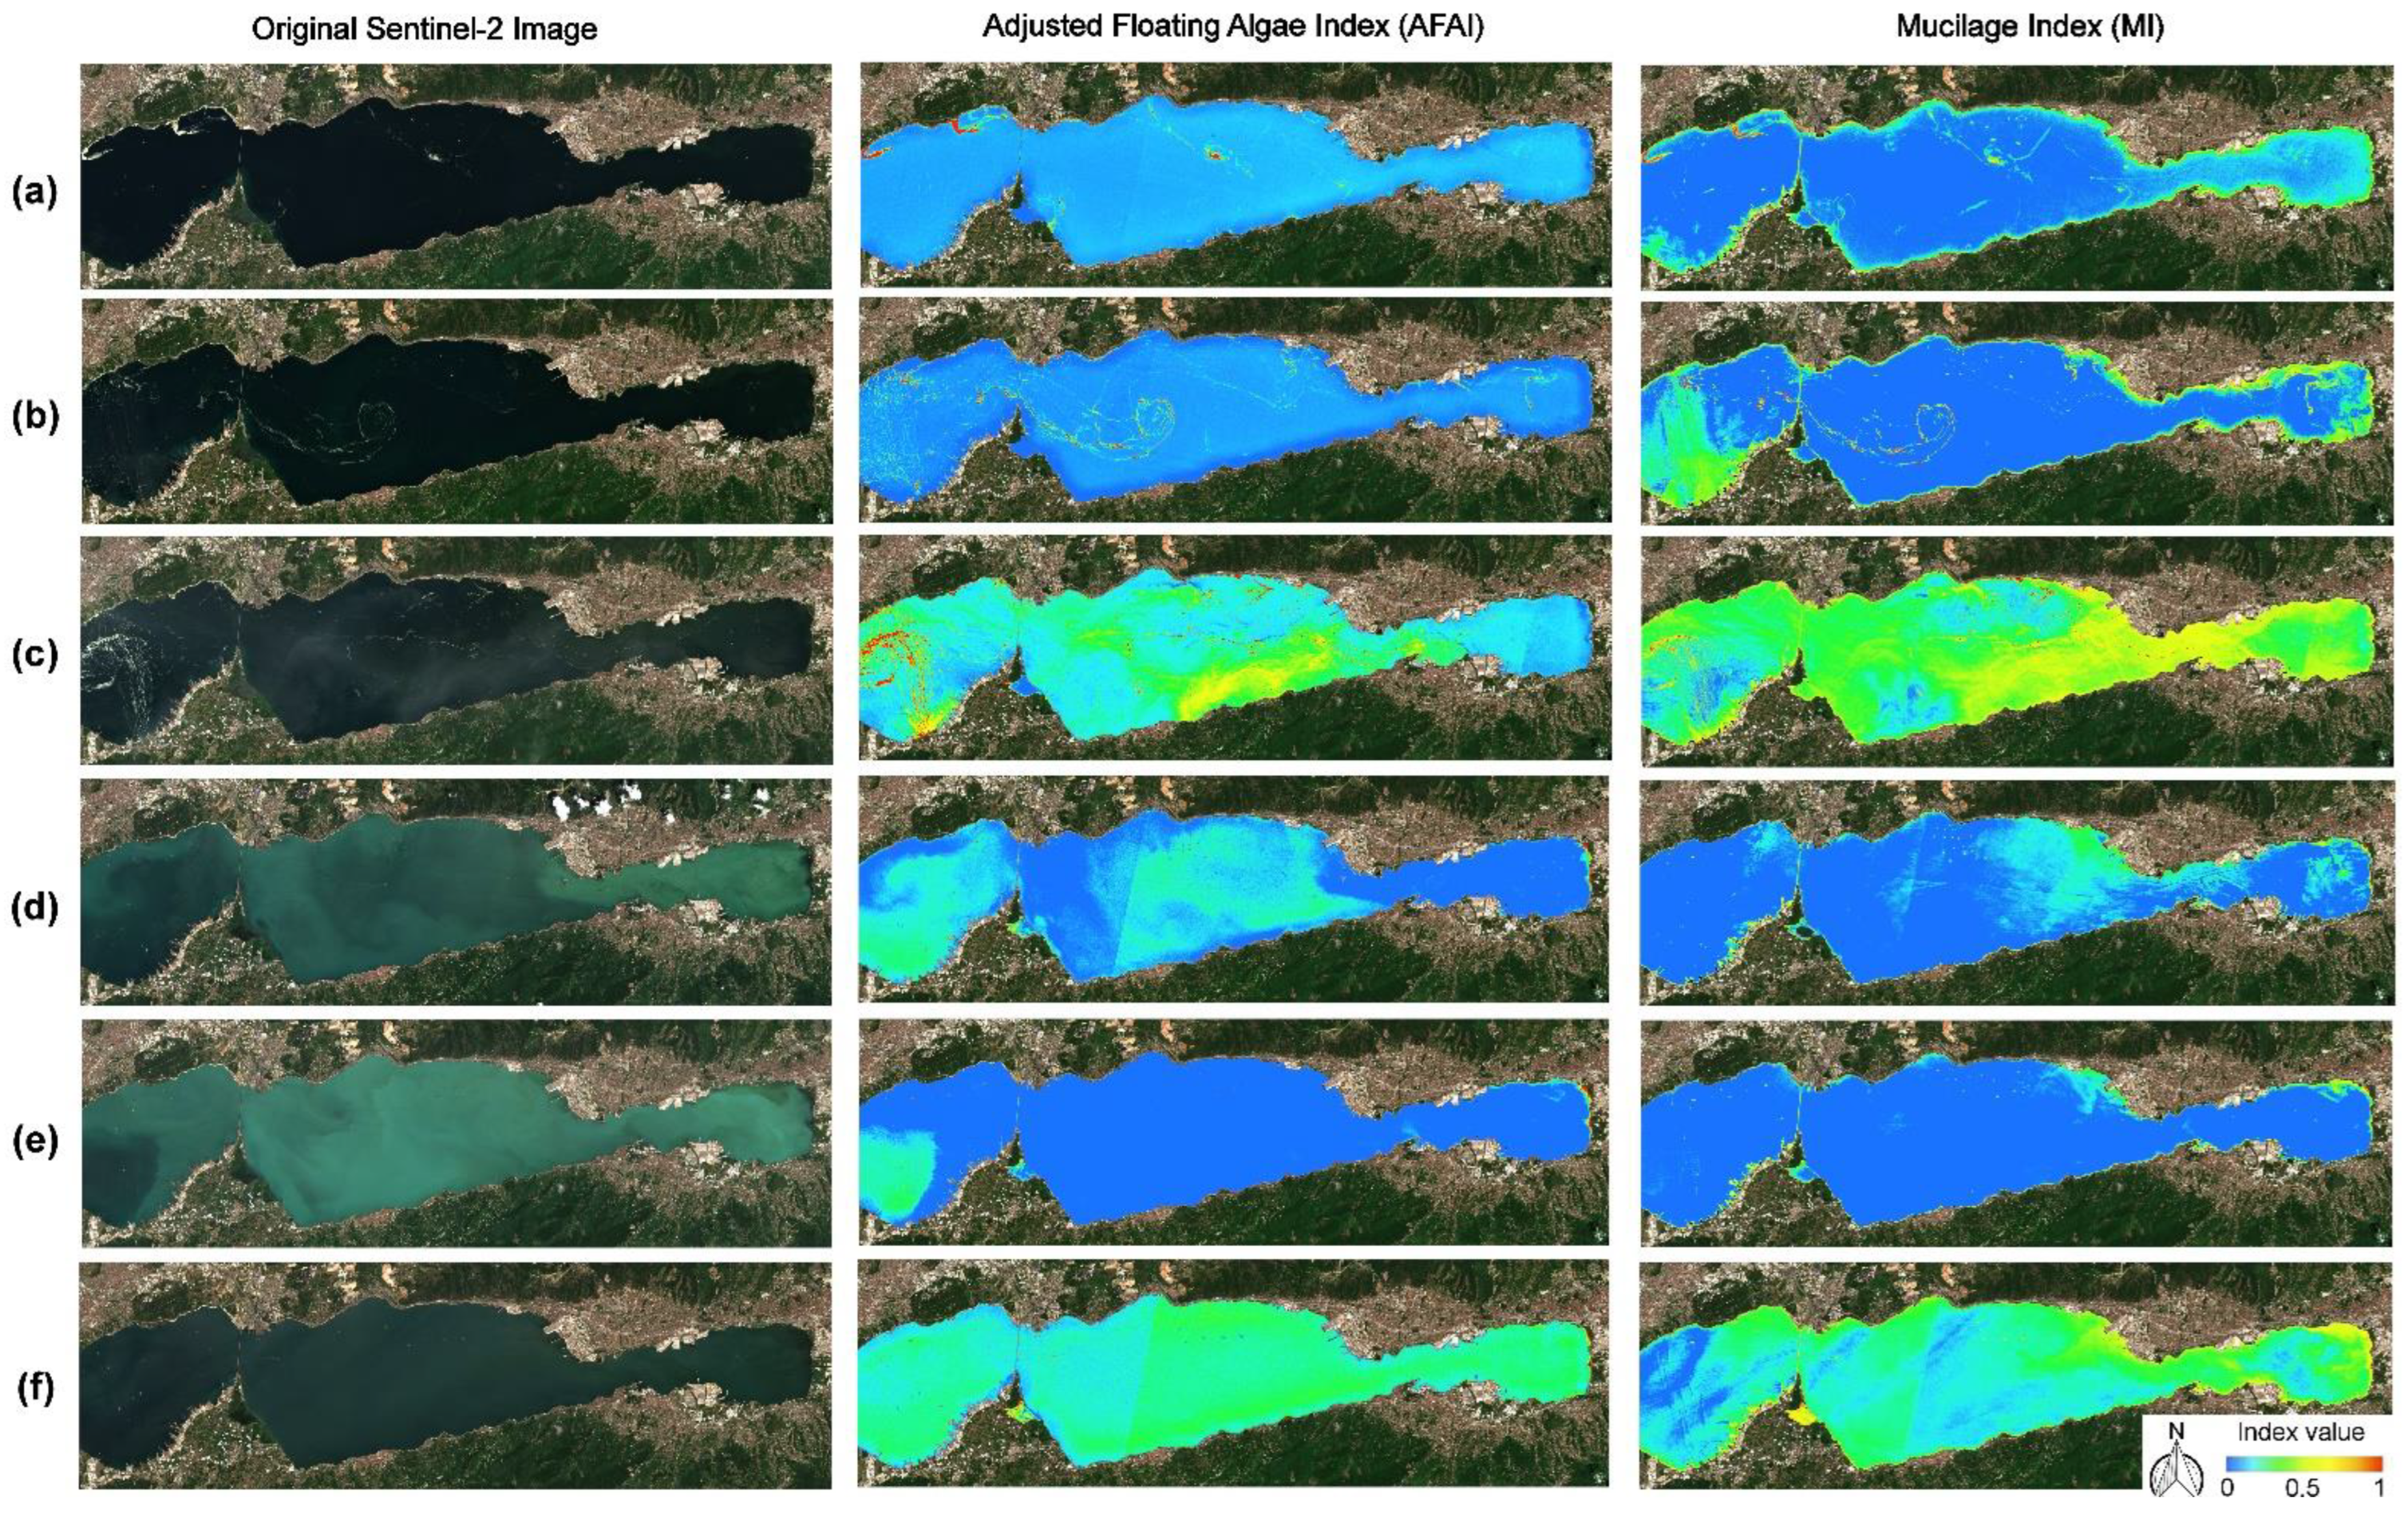
To meet the objectives of this study, five spectral indices were firstly derived from six cloud-free Sentinel-2 images obtained in May and July 2021. The indices were calculated using equations given in Table 2 for all the images on the Google Earth Engine platform. Specific GEE code was developed to produce the index map and then reclassify the pixel values into 0-1 range, which ensured standardized representation of all figures with the same scale. Whilst pixel values of 0 represent no mucilage, values of 1 show high mucilage density shown with red color. Through the developed code, all index maps were created separately and then combined to make common analyses and interpretations. Whilst the thematic maps of AFAI and MI are given in Figure 3, those of NDTI, NDWI, and NDWIGao are shown in Figure 4. It should be noted that some thematic maps have a diagonal line, resulting from the combination of different tracks by the Sentinel data center.

Figure 3.
Estimated thematic maps of AFAI and MI from Sentinel-2 images acquired on (a) 14 May; (b) 19 May; (c) 24 May; (d) 13 July; (e) 18 July; (f) 28 July 2021.
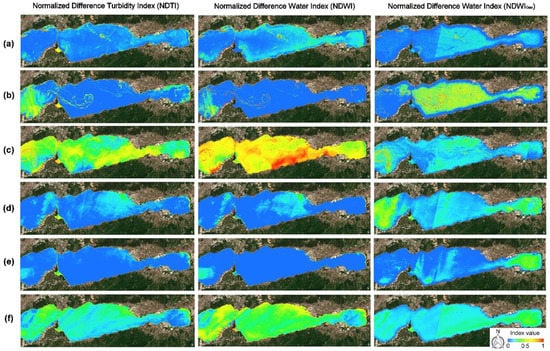
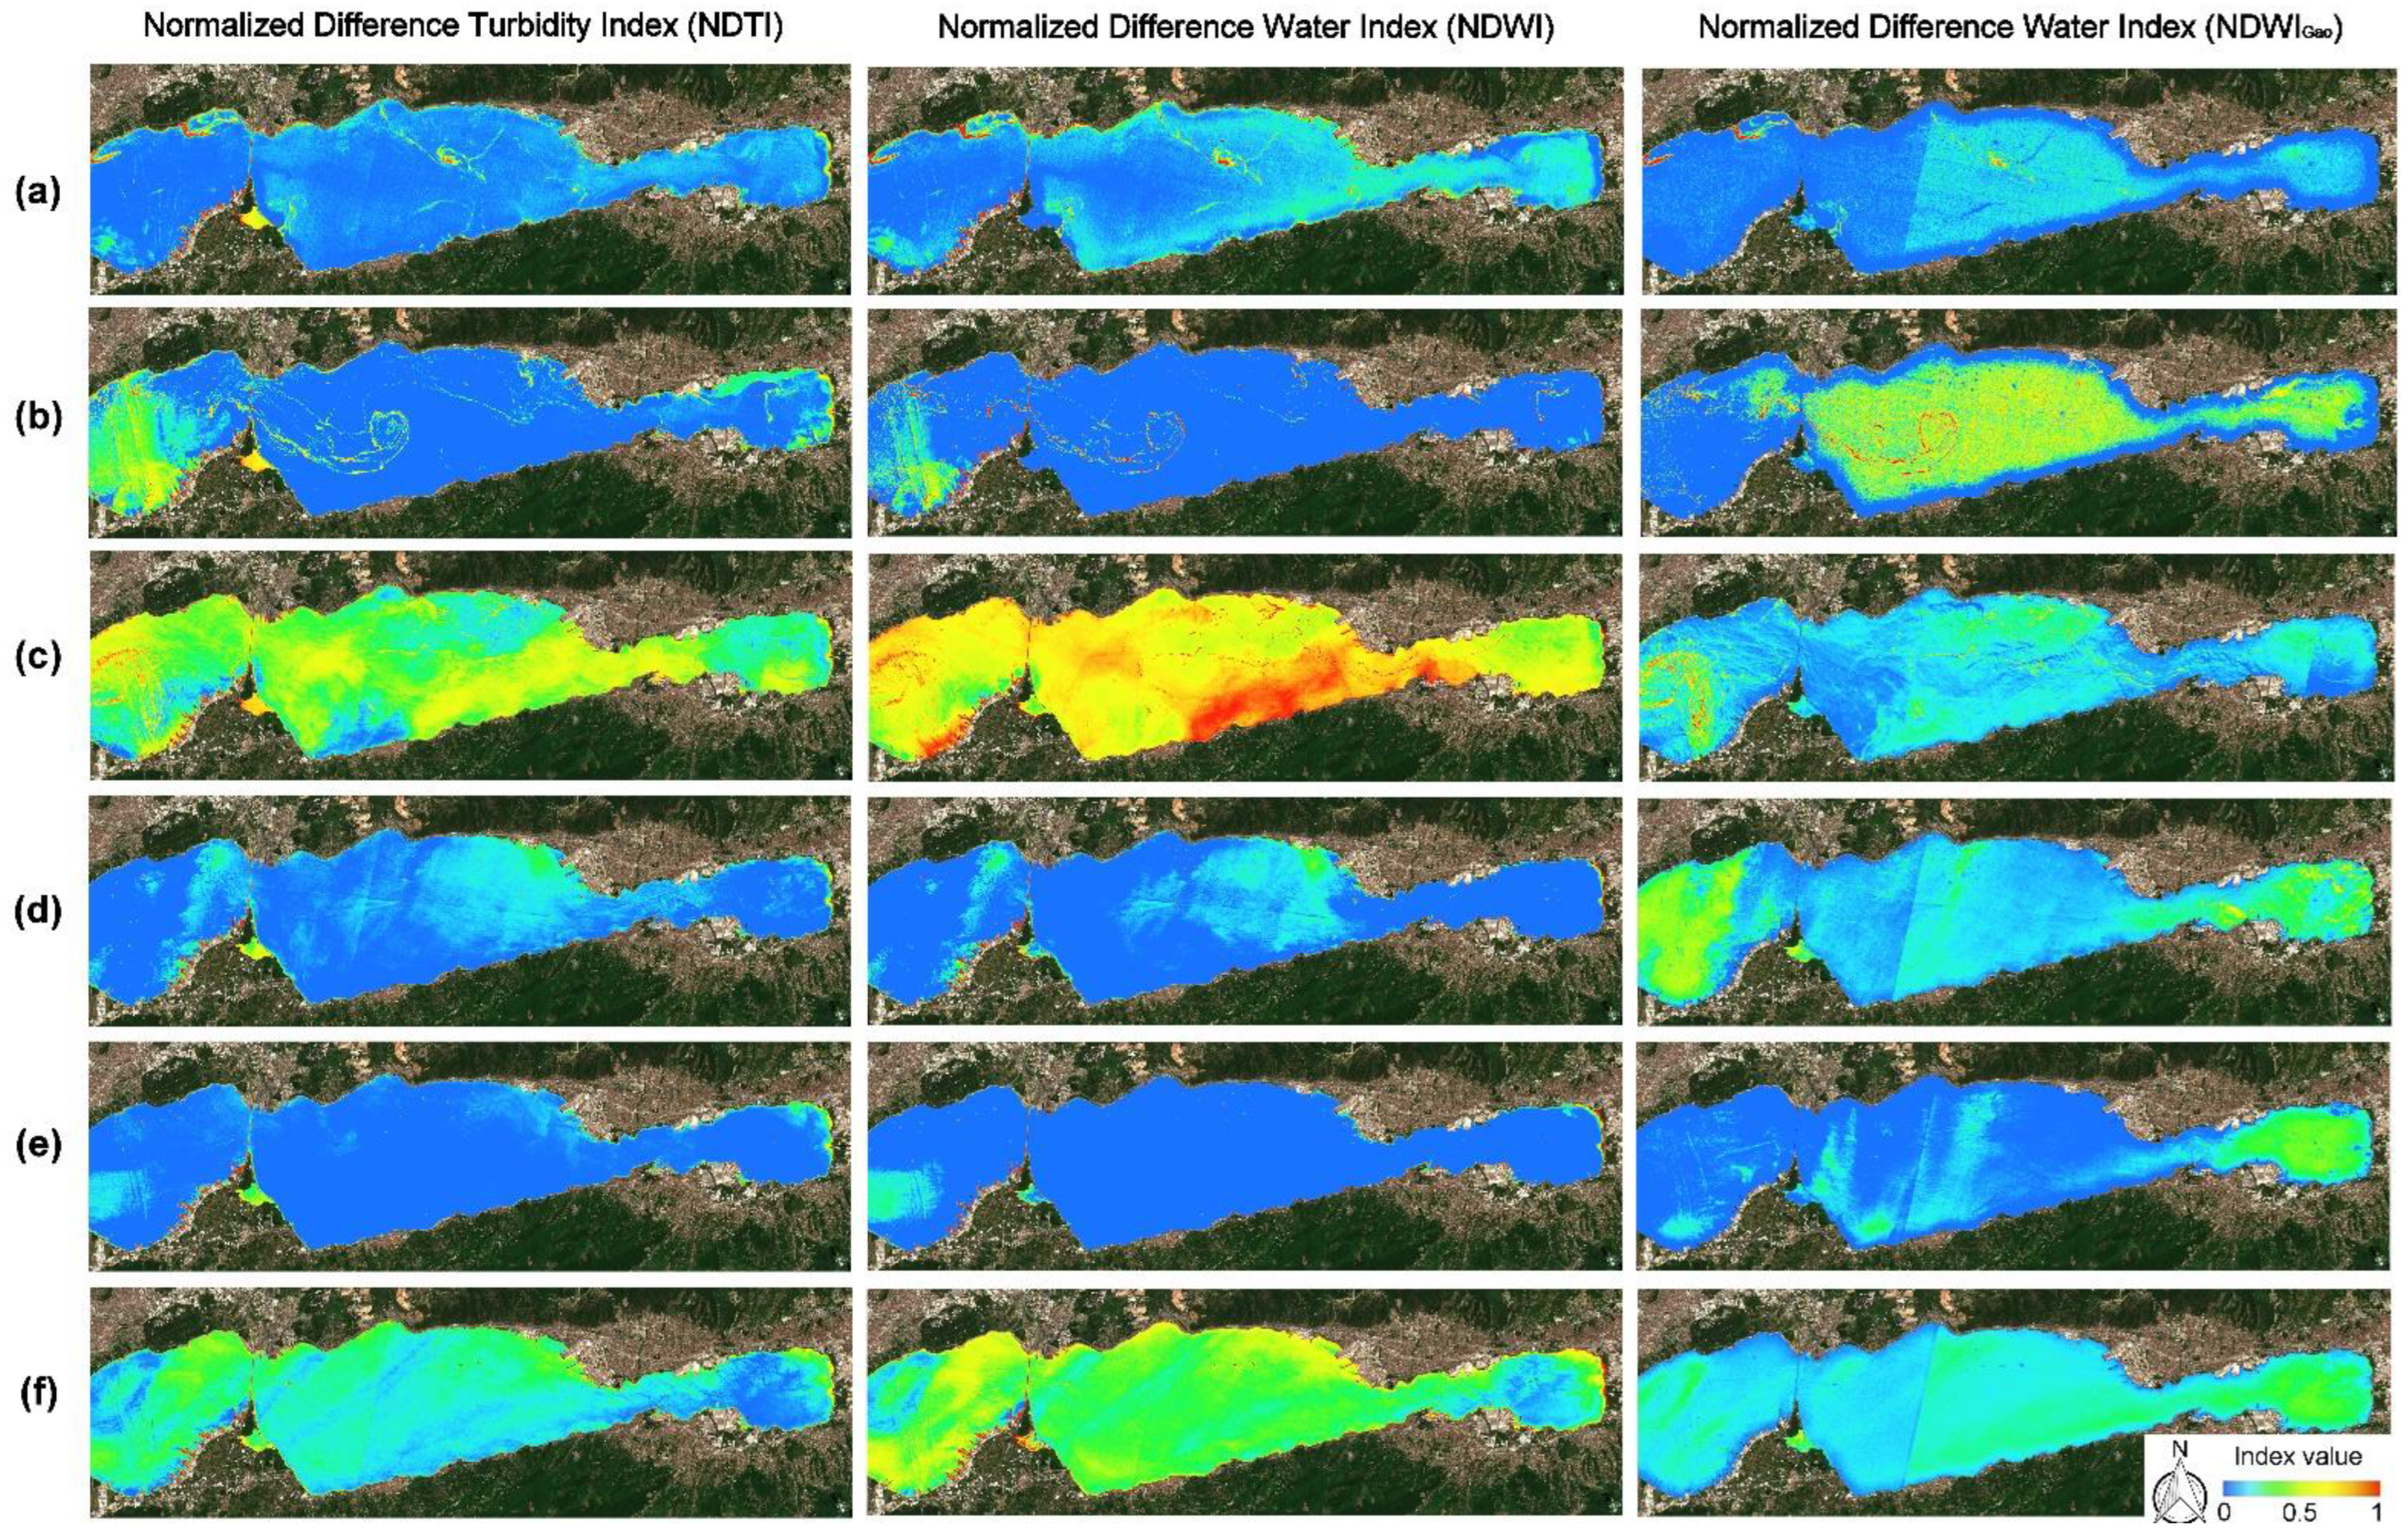
Figure 4.
Estimated thematic maps of NDTI, NDWI and NDWIGao from Sentinel-2 images acquired on (a) 14 May; (b) 19 May; (c) 24 May; (d) 13 July; (e) 18 July; (f) 28 July 2021.
Thematic maps produced for the 14 and 19 May images showed a starting stage of mucilage bloom densified in several locations in the Bay. For these particular days, the clearest detection of mucilage aggregates was performed by the AFAI. Although the MI detected the same locations much more clearly, it identified more mucilage accumulated on the east coast (Figure 4). According to the results, the highest mucilage coverage was on May 24, when the whole Bay was under the severe effect of a mucilage bloom. Once again, the thematic map produced by FAI indicated the dense population of mucilage more correctly. It was also observed that the NDWI index detected denser mucilage formations accumulated in the southern part of the Bay. When the thematic maps produced for July 13 and 18 were considered, it was noticed that the mucilage bloom diminished although the images show high turbidity, which can result from winds. Due to the existence of turbidity in the water, NDTI produced the most acceptable results for these days. Compared with these images, the image taken on July 28 was clearer and had very limited turbidity. However, all indices detected distinct features on the water surface, which could be high algal concentrations just after the mucilage appearance. It can be concluded from the produced results that the index of AFAI produced the clearest maps of mucilage for both high-and low-density mucilage coverages, especially in the blooming period. Although the index of MI was proposed especially for the detection of mucilage-covered areas, it was found to be inferior to AFAI. Another important result is that the indices using the green channel in their formulations (i.e., MI, NDTI, NDWI) had confusion in the separation of mucilage and algal bloom pixels since they have similar reflectances in the green channel compared to the blue and red channels.
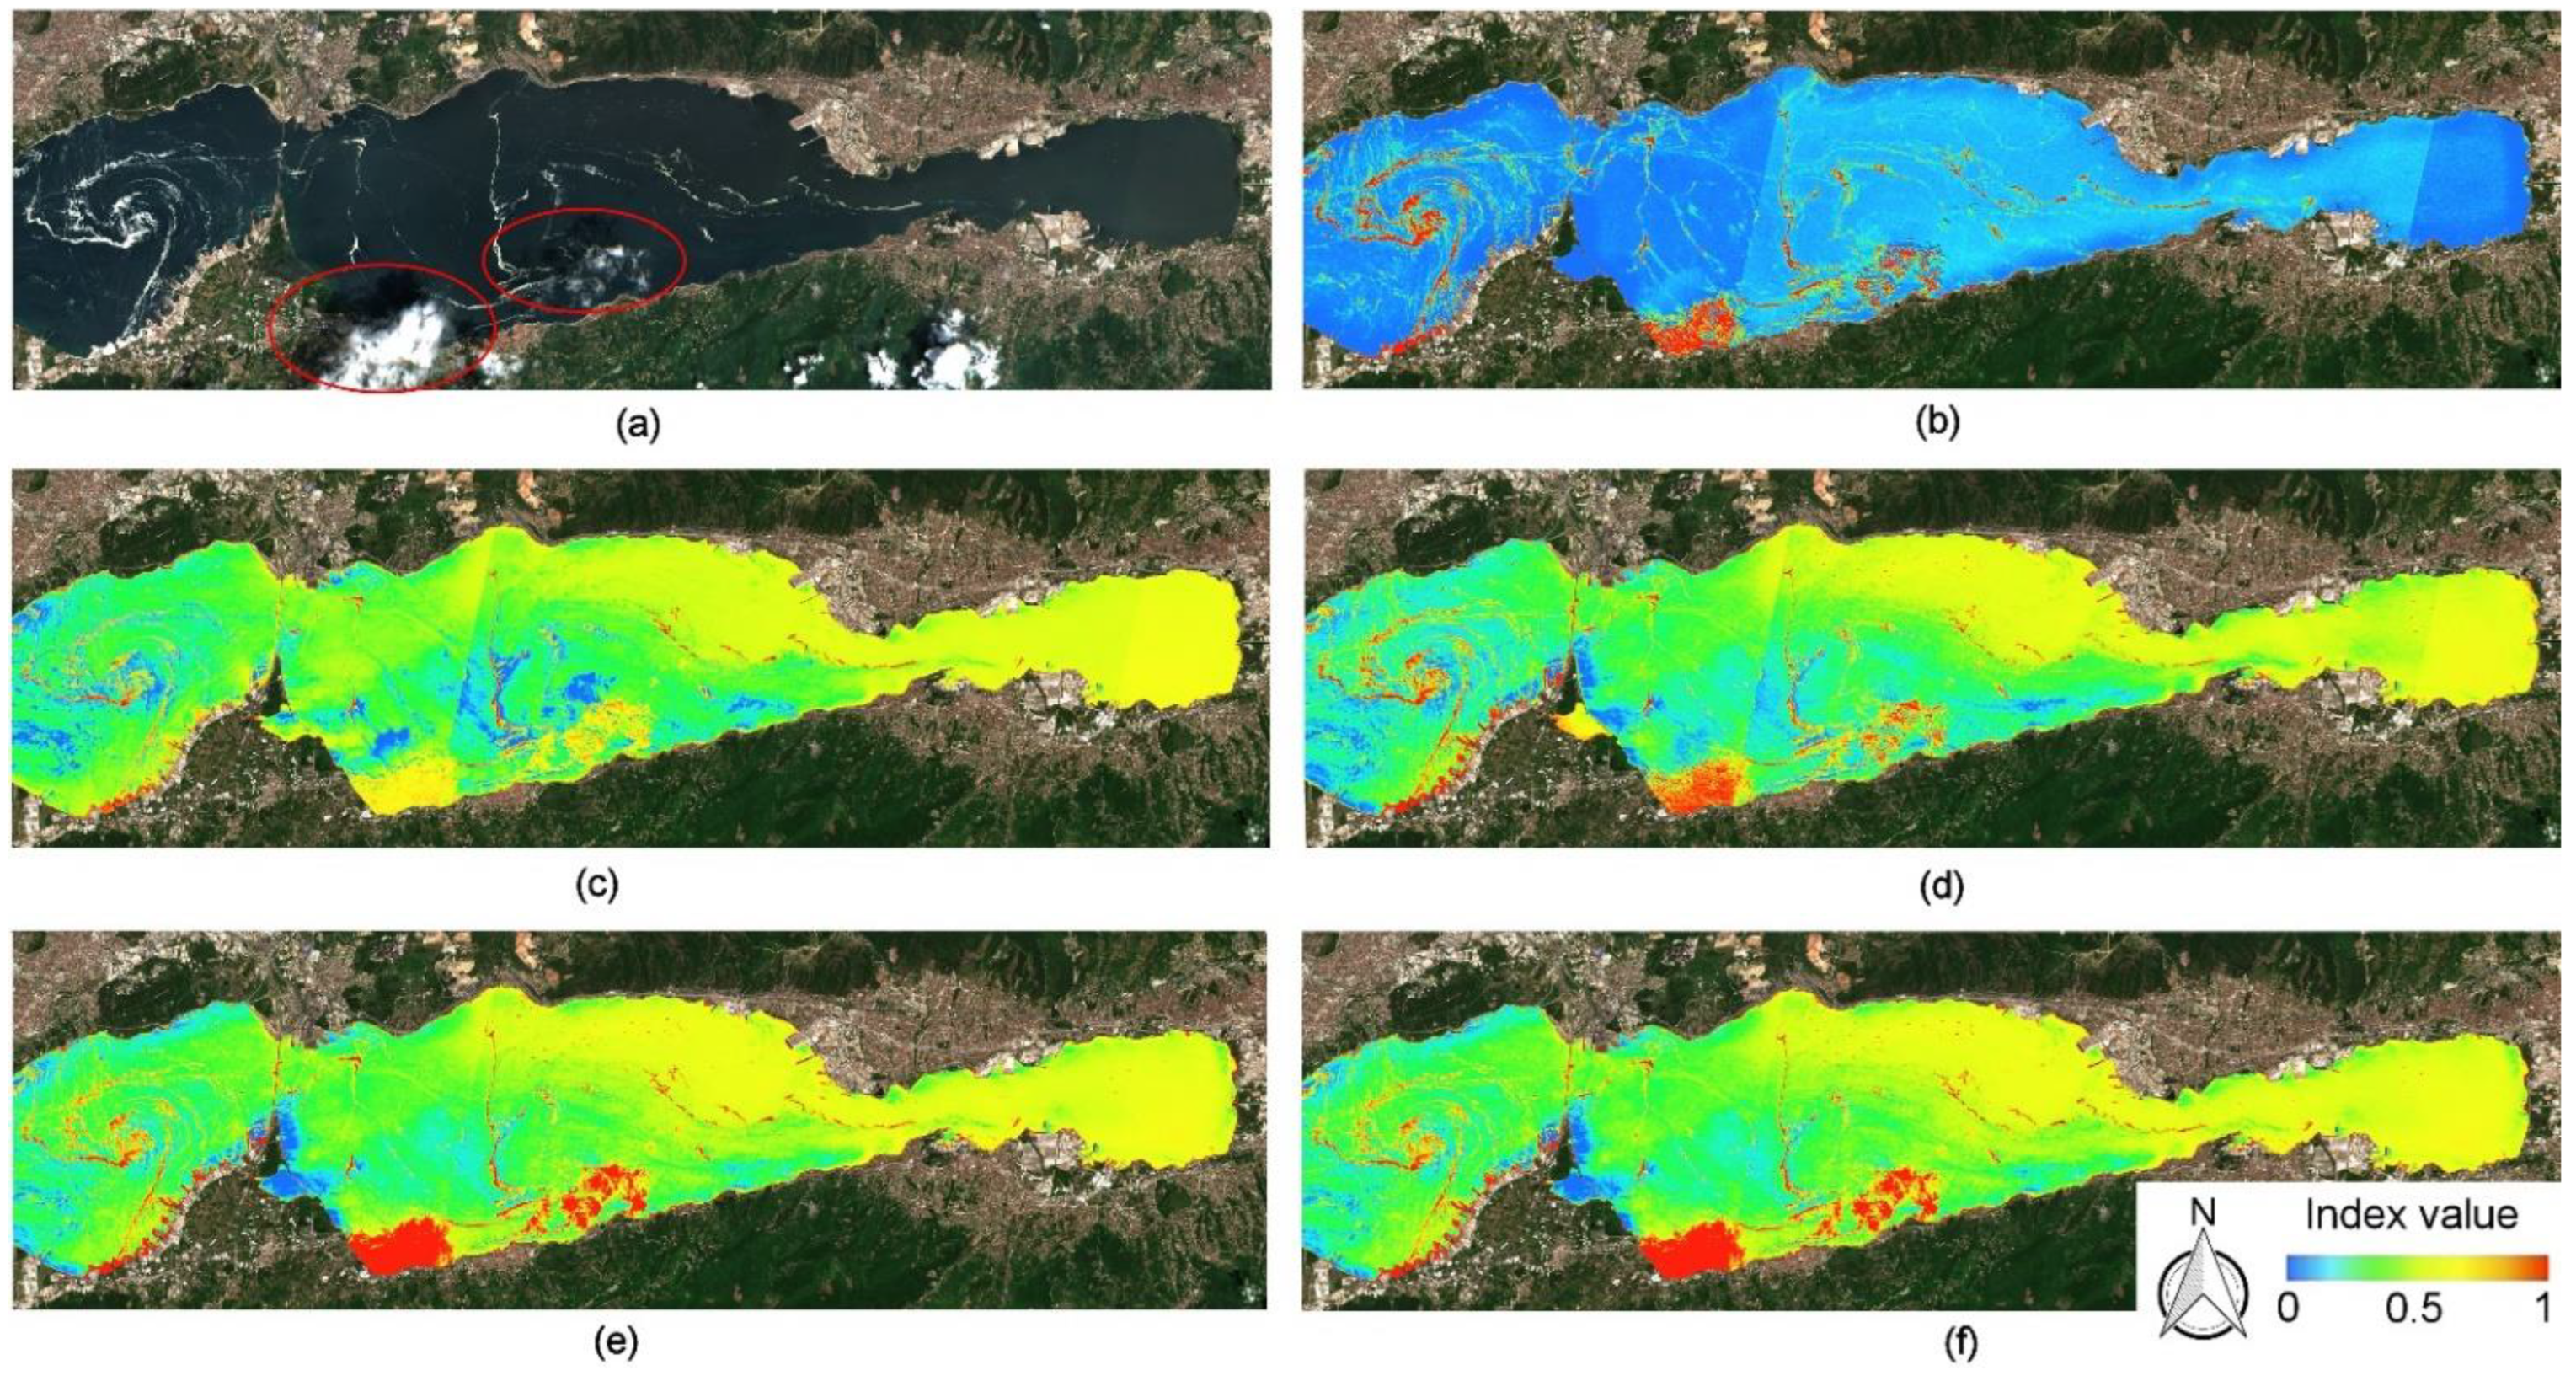
For the second part of the study that aimed toe test the performance of indices for an image including clouds and their shadows, an image taken on 13 June 2021 was employed. There were two groups of cumulus clouds on the southern part of the Izmit Bay, which are indicated by red circles. In addition to the clouds, their shadows also created problems when extracting information underneath. All index formulations were applied to the image and the results were thus produced (Figure 5). All indices except for AFAI detected clouds as dense mucilage coverage and the whole area was defined as mucilage at different degrees of densities. Considering that the index values over 0.5 represent moderate and high densities of mucilage aggregates, almost the whole Bay was under the effect of mucilage bloom. In the thematic maps produced by the NDWI and NDWIGao indices, cloud-covered areas were determined as solid polygons with the highest density of mucilage. On the other hand, compared with the original image by visual interpretation, the AFAI index correctly detected the mucilage formations with high density, and other parts of the Bay were described as very low risk of mucilage coverage. In terms of its performance in cloud-covered areas, while disregarding the shadow effect, it identified dense cloudy zones as high-density mucilage. Overall, the best performance was again performed by the AFAI index compared to the performances of the other indices.

Figure 5.
Thematic maps produced for (a) cloudy 13 July Sentinel-2 imagery using (b) AFAI; (c) MI; (d) NDTI; (e) NDWI; (f) NDWIGao.
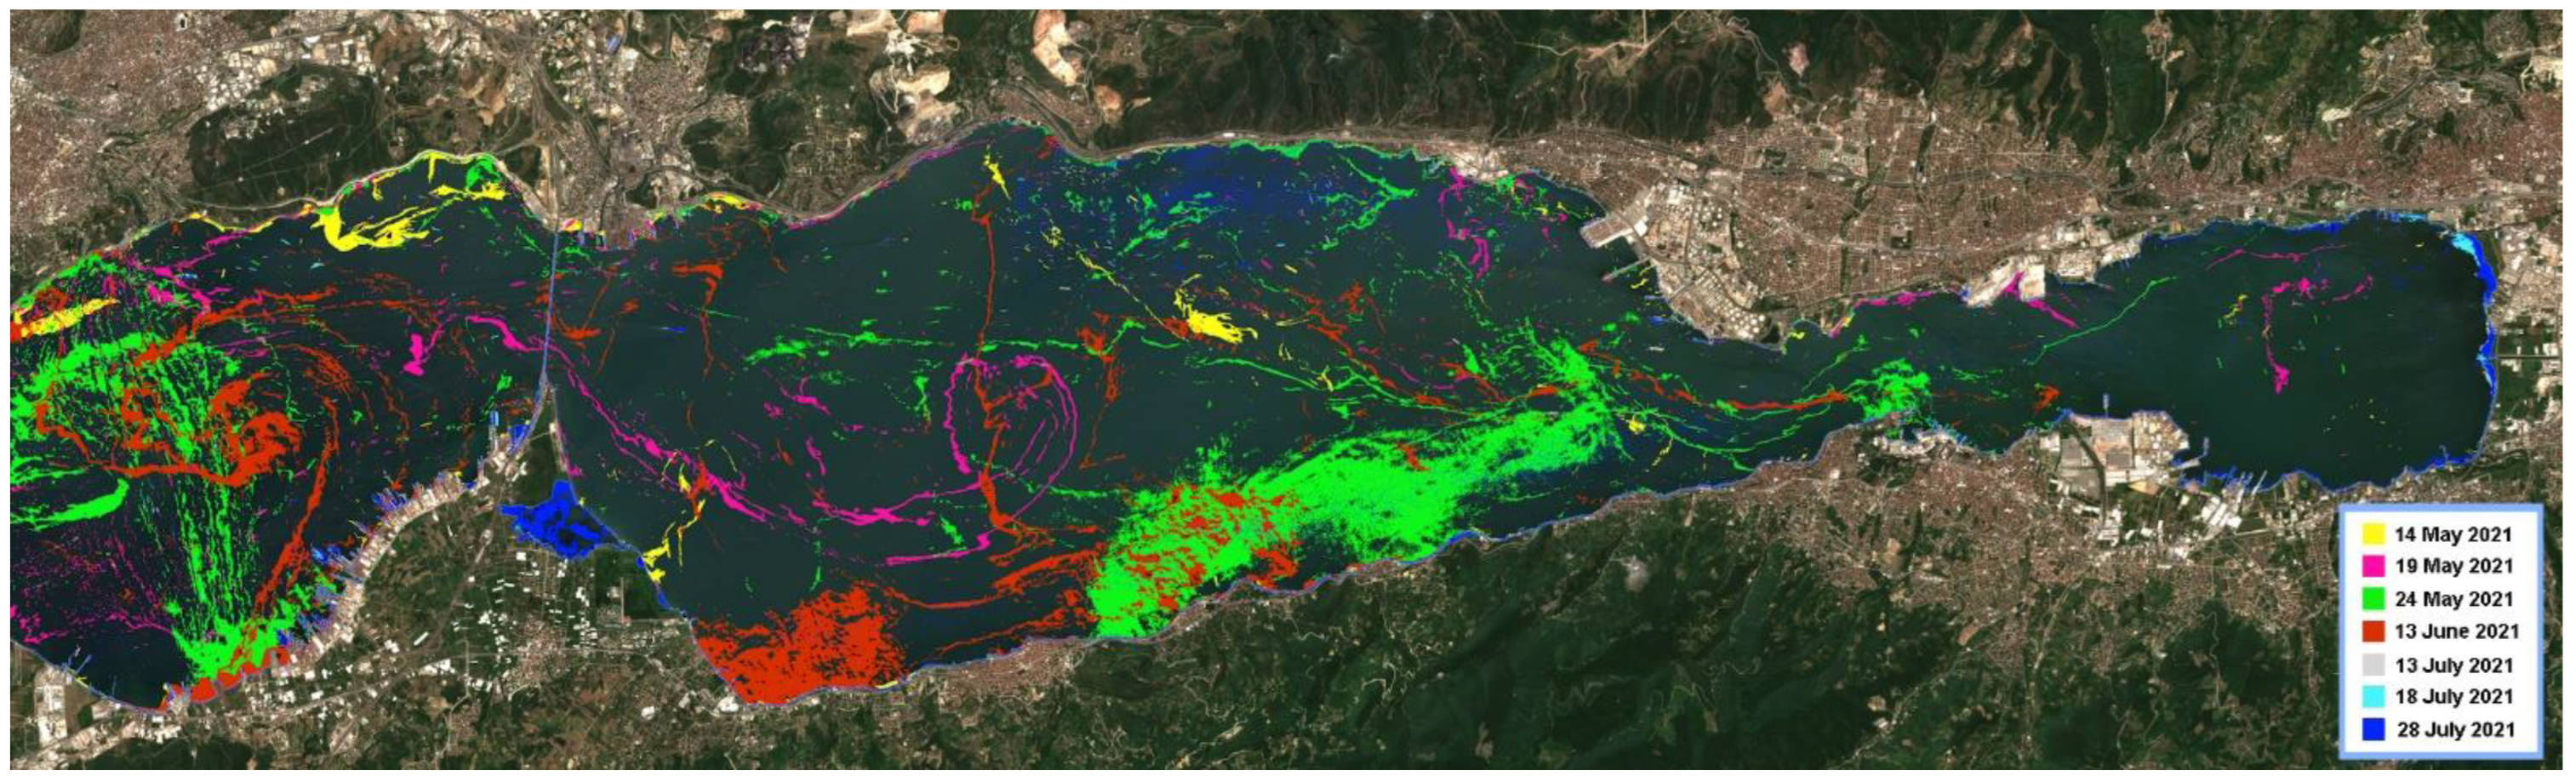
Temporal analysis of mucilage coverage on Izmit Bay was conducted using the best performing AFAI index by merging the detected mucilage areas on the seven dates considered in this study (Figure 6). Since the results were overlaid to each other, areas detected as mucilage by different indices were shown with the color of the latest date, which results in suppression of previous dates. For instance, eastern coastal areas were shown with blue color showing the mucilage-covered areas on 28 July, but these zones were also detected by the index from the 13 and 18 July images. As shown in the figure, a mucilage bloom was mostly observed on the north-west coast of the Bay, and then a thin creamy surface layer with a few kilometers long appeared throughout the Bay on 19 May. On 24 May, mucilage reached its maximum level covering a large proportion of the water surface.

Figure 6.
Temporal analysis of mucilage coverage on Izmit Bay using AFAI index.
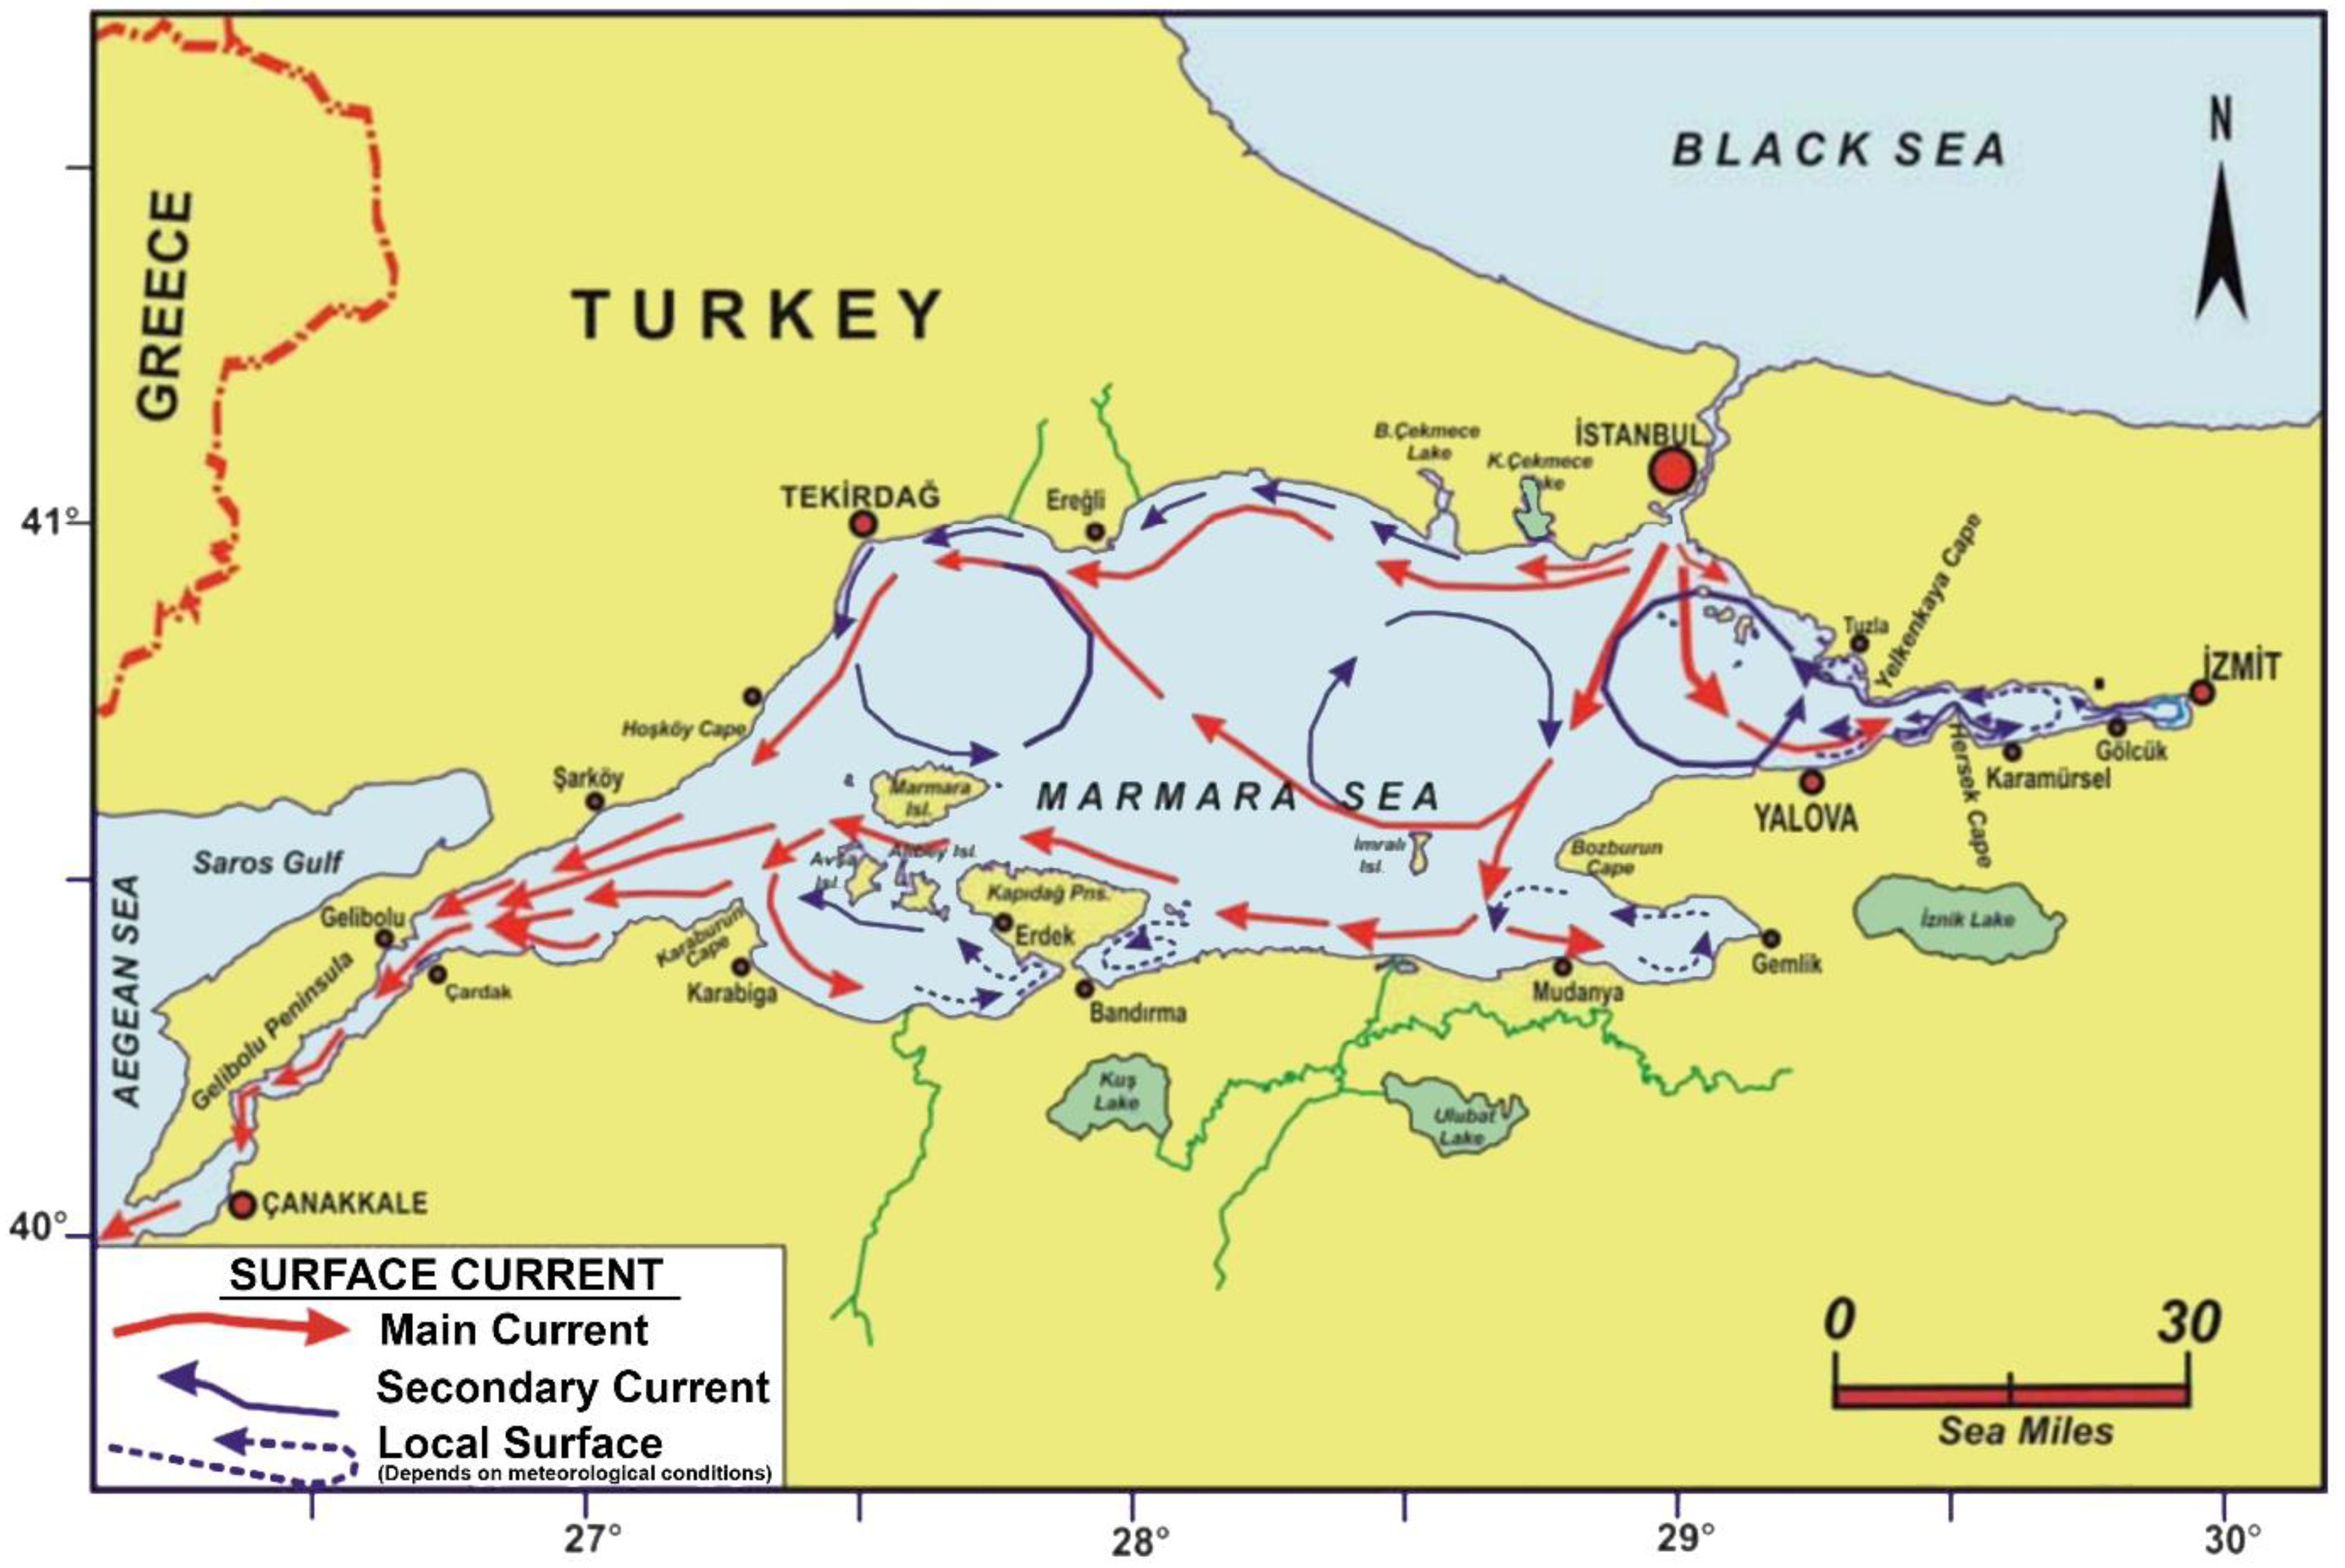
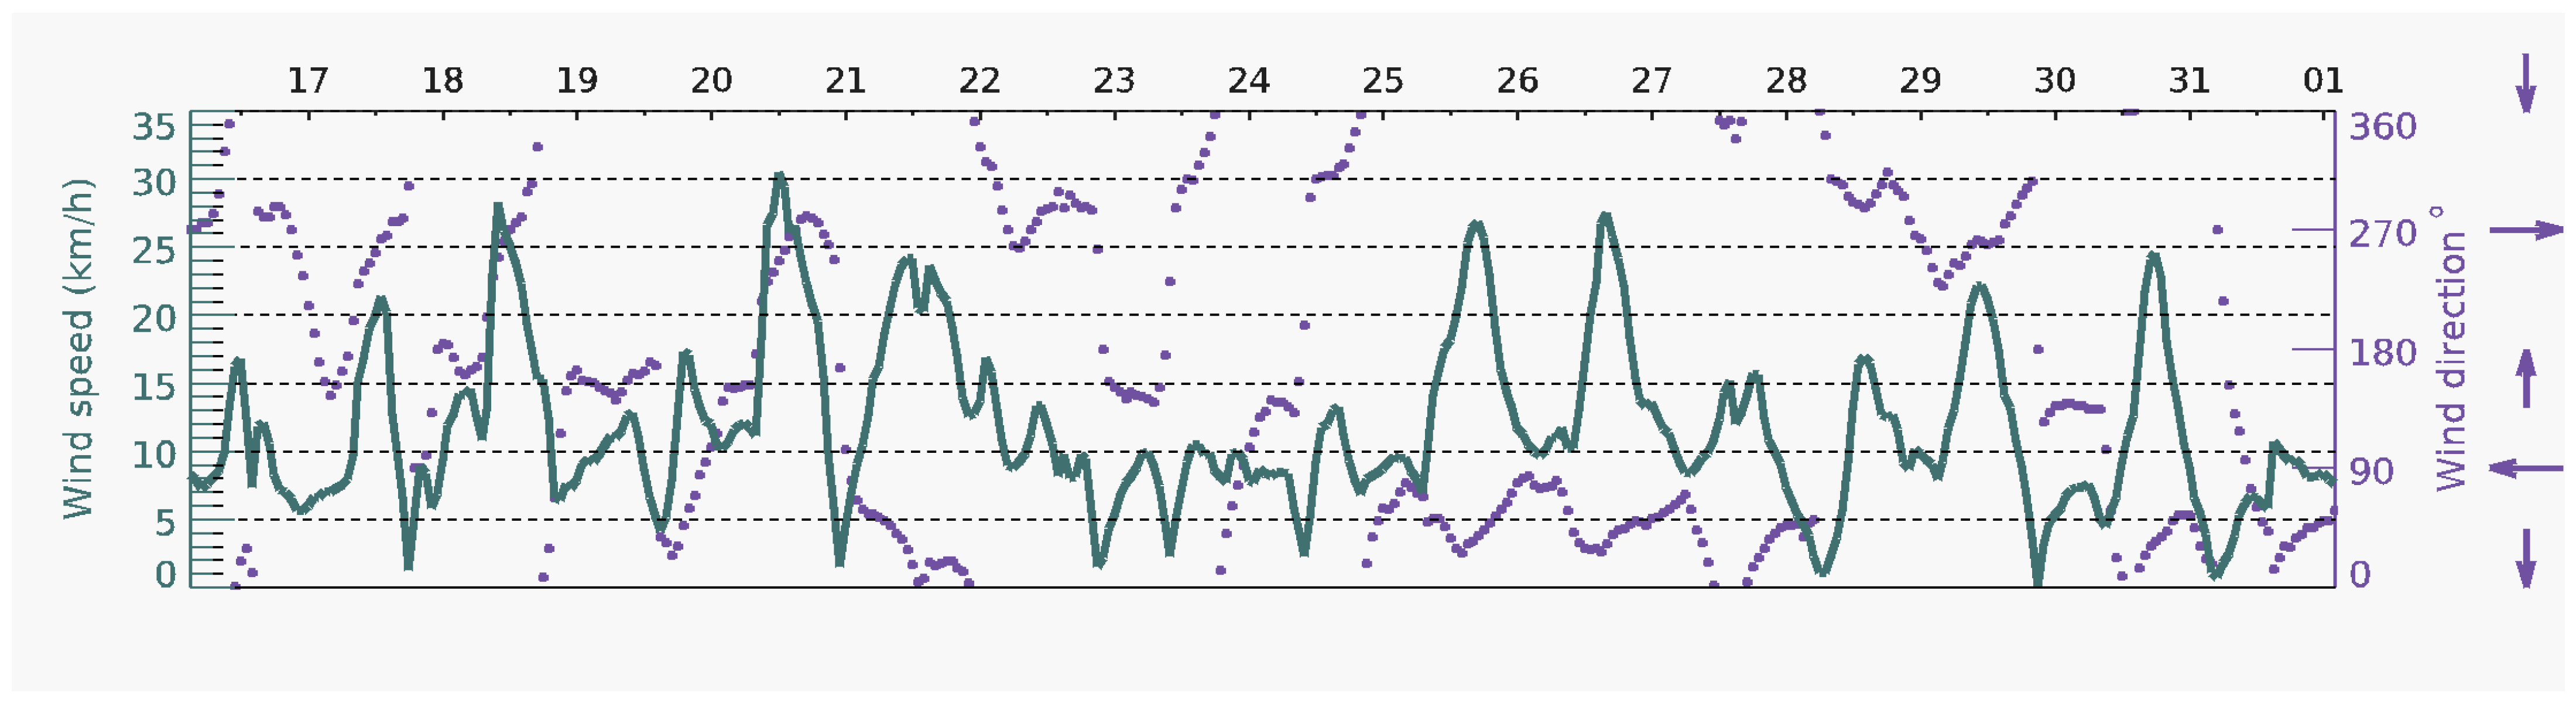
Mucilage entrance to the Bay from the Sea of Marmara due to the dominant streams and winds should be particularly mentioned for this time period. According to the map of currents in the Sea of Marmara (Figure 7), main current enters the Izmit Bay and secondary currents leaves the Bay, which can explain the movement of mucilage towards the Bay. Wind speed gradually increased mainly in the eastern direction between 19 and 21 May, then started to increase again after 21st of May. Irregularly changing its direction, winds were mostly in the eastern and southern directions between 22 and 24 May, which resulted in the movement of mucilage towards the Bay (Figure 8). Although the mucilage in the shape of waves continued to enter the Bay from the Sea of Marmara, the AFAI index failed to properly discriminate the clouds from mucilage; thus, cloud covered areas were detected as mucilage on the coasts of Karamursel district of Kocaeli on the image acquired on 13 June. After this date, mucilage lost its effect, particularly on the open waters, but gathered on the shores of the Izmit Bay.
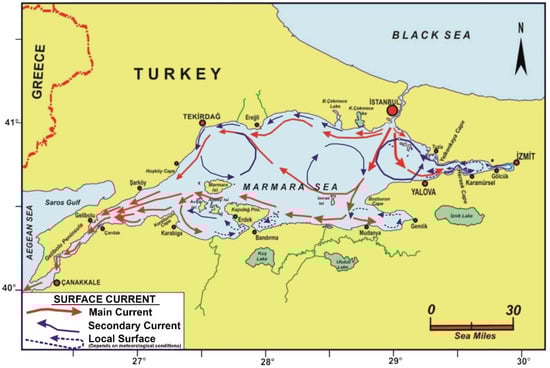
Figure 7.
Surface currents in Sea of Marmara ([50]).
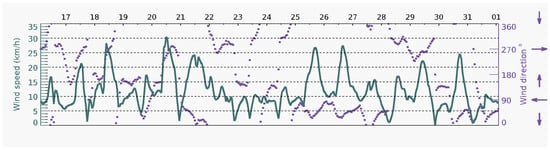
Figure 8.
Wind speed and direction information for Izmit Bay between 17 May 2021 and 31 May 2021 (source: www.meteoblue.com, accessed on 15 June 2022).
After the production of index maps, areal estimations for coverage of mucilage aggregates were conducted by considering index values over 0.5 as mucilage and values lower than 0.5 as water. In addition to acreages, ratios of mucilage areas in relation to the whole water surface of Izmit Bay were estimated (Table 3). According to the results, whilst the highest mucilage concentration was found on the 24 May image, which corresponds to almost 13% of the whole study area, the least mucilage coverage was detected on 18 July, corresponding to approximately 1% of the study area. It is interesting to notice that the amount of mucilage formations slightly increased (by about 4 km²) after 18 July. At this point, it should be noted that a similar amount of mucilage was estimated for 13 July and 18 July images. Considering the cloudy image taken on 13 June, about 20 km² of the water surface was identified as high-density mucilage. With the elimination of cloud-covered regions on the image, about 16 km² of the water surface was calculated to be mucilage covered.
Table 3.
Mucilage-covered areas estimated from index maps. * Note that all images except for the image taken on 13 June were cloud-free images.
5. Discussion
The literature review revealed that almost all indices related to water were designed either to delineate surface water bodies, such as rivers, lakes, and reservoirs from satellite images (e.g., [51,52,53,54]), or to determine the quality of the water in lakes or rivers (e.g., [55,56]). Except for the MI index, no index was proposed to specifically extract areas covered with mucilage formations. The results of this study revealed that the performance of MI, originally developed for MODIS imagery, was inferior, especially when compared to the results of AFAI. Since the spectral reflectances of algal blooms and mucilage are similar in green bands, water indices using green bands fail to discriminate between mucilage and algal blooms. This can cause a major problem since mucilage occurs in water conditions that are suitable for algal blooms. In some cases, it is reported that they follow each other in their occurrences.
Finding an optimal threshold is a crucial step to identify algal blooms in clear water bodies. In general, visual interpretation has been usually conducted in many scenarios [46]. Similarly, the major problem encountered was determining the threshold level to decide on high-density mucilage in the determination of mucilage-covered water surfaces using water indices. Although a fixed threshold level of 0.5 was set to estimate mucilage aggregates on the water surface, it is best to design a daily in situ measurement on the study area to calibrate the optimal threshold value. As it was noticed that each index extracts different features on the water surface, the threshold optimization or determination process must be performed for each method separately. Whilst [57] investigated the NDWIs to determine the best performing index and to establish appropriate thresholds for clearly identifying water features, Ref. [46] suggested different threshold levels for Landsat (0.01–0.02) and MODIS (0.05–0.12) in the application of AFAI instead of a single threshold on all images.
For the delineation of mucilage-covered areas, validation of the results is a major concern since floating gelatinous materials move fast on the sea surface, making the in situ collection of ground reference data an impossible task. To be exact, the problem is not similar to the ground reference data collection for land use and land cover classification (e.g., for vegetation types). The analyst is faced with either measuring the locations of high mucilage covered areas accurately (e.g., using a GPS) on the sea surface at the same time as the satellite acquires the image or collecting mucilage-covered areas from the satellite image using the spectral reflectance information when it is available through spectral signature analysis of pixels. The first option is not likely to be feasible for a study analyzing dynamic or moving objects on the water surface. For such cases, the best option is to collect pixels as samples using spectral signatures of the features when a spectral library is available. In the spectral library approach, fieldwork is not required at the time of image acquisition since preliminary spectral information is available [58]. As underlined by [59], knowing the spectral characteristics of a cover or species allows the use of different classification methods, based on the identification of those specific characteristics previously identified in the signatures. The possibility of identifying these characteristics is maximized when detailed spectral information is available. For instance, supervised image classification for detecting mucilage-covered areas was conducted by [60] for Izmit Bay by collecting sample pixels using spectral signatures of clear water and mucilage. Their results showed that whilst mucilage covered an area of 15.13 km² on 19 May, it covered an area of 20.13 km² on 24 May. On the other hand, Ref. [61] employed supervised classification on the GEE platform for mucilage mapping in the Sea of Marmara using visually selected water and mucilage pixels in that they used histogram analysis for the collected samples. It was reported that thematic maps with very high accuracy (over 98%) were produced.
Since the satellite programs have different visiting frequencies, it is difficult to find cloud-free images to study the suddenly appearing natural phenomenon of mucilage bloom. As it is well-known that mucilage events occur in spring or fall terms with the fast-changing weather temperatures, it is likely to have cloudy or rainy days that hinder the usability of optical satellite images. Therefore, to eliminate the effects of clouds and their shadows from the images, either a preprocessing stage or a new water index suppressing the disruptive effects is required to produce reliable and valid thematic maps and areal estimations. In the current study, the performance of the AFAI index was more successful than the other indices for the areas covered with clouds and shadows. In fact, the thematic maps produced with the AFAI index revealed its effectiveness in disregarding the shadow effects on the water pixels.
After visual interpretation of the produced water index maps, the AFAI index produced the clearest maps of mucilage-covered areas, followed by the MI index, which is developed for the purpose of mucilage mapping. NDTI index produced similar results to the MI index. However, the NDWI index was not found to be effective for extracting mucilage formations as it was mainly identifying other features of water, especially algal bloom concentrations. This finding suggests the development of more sophisticated indices or analysis tools for mucilage mapping.
6. Conclusions
In this study, five popular water indices were employed to extract non-water items (i.e., mucilage aggregates) to unroll the extent of the natural disaster of the extensive mucilage outbreak witnessed in spring 2021 in the Sea of Marmara. The results of this study revealed some important conclusions about the effectiveness of water indices for mucilage mapping and GEE performance in terms of coding and processing performance. Firstly, differences in the thematic maps for the detection of mucilage on the GEE platform showed varying performances of the considered water indices. Among the considered water indices, the AFAI index was superior, followed by the NDTI and MI indices. Performances of NDWI and NDWIGao indices were inferior as they detected more features in the water, particularly the existence of algal blooms. It should be stated that the NDWI index detected more pixels as mucilage than the others. Secondly, temporal variation of mucilage in Izmit Bay was also analyzed through areal estimations. According to the findings, after starting to bloom on 14 May, the mucilage event reached its peak point on 24 May, then started to disappear day by day. Considering that the 13 June image included two sections with clouds and shadows, the mucilage-covered water surface was about 15 km² (about 5 km² was disregarded). Furthermore, mucilage formations covered about 2 km² on 13 and 18 July. Although mucilage slightly increased on the image taken on 28 July, it was not detected in the following images, that is, no mucilage was detected afterward. Another finding in this study is that mucilage and algal blooms show higher reflectance in the green band compared to blue and red bands due to the chlorophyll concentration. This could be the main reason that the available water indices considering green bands in their formulas detect areas covered with algae concentrations as mucilage formations. Because of this, thematic maps of AFAI were the best ones representing the mucilage-covered areas and to some extent distinguishing areas covered with algal blooms. On the other hand, generated mucilage maps showed variation in the amount of mucilage aggregates on the sea surface, which validates the high sensitivity of phytoplankton to atmospheric and environmental conditions.
With the developed JavaScript code, mucilage aggregates on the sea surface together with other objects (algal bloom, platform, etc.) can be extracted in a very short time in the cloud environment of the GEE without downloading any large-sized imagery. It should be also pointed out that the basic level of hardware is sufficient to perform the operations and run the code, and no remote sensing software is required for pre-processing the imagery or applying the indices and other estimations and reporting procedures. It provides the opportunity to work in different computer environments at any time. This study introduces a novel methodology including all steps for extracting mucilage-covered areas from Sentinel-2 imagery. The written code can be easily adapted to produce the thematic maps of other water indices and conduct other image processing tools or methods. The analysis of Sentinel-2 images with water indices on the GEE cloud computing platform can offer new opportunities to users at different experience levels for providing cost-effective and timely production of mucilage maps. The GEE platform provided convenience at all stages of the application with its ready-to-use tools and flexibility in developing customized codes. The results of this study convey the weakness of the considered water indices for mapping mucilage-covered areas as they did not coincide with each other, nor with the results of [60], who employed image classification with machine learning algorithms. Therefore, it is concluded that more research supported by in situ measurements is needed to develop new models or indices to accurately map mucilage aggregates on the water surface, which is of critical importance for mitigation studies conducted by authorities.
Author Contributions
Conceptualization, T.K.; methodology, T.K. and M.G.; formal analysis, T.K. and M.G.; investigation, T.K. and M.G.; resources, T.K. and M.G.; data curation, M.G.; writing—original draft preparation, T.K.; writing—review and editing, T.K.; visualization, T.K. and M.G..; supervision, T.K. All authors have read and agreed to the published version of the manuscript.
Funding
This research received no external funding.
Data Availability Statement
Not applicable.
Acknowledgments
This study was a part of MSc thesis of Merve Goral under the supervision of Taskin Kavzoglu in Gebze Technical University, Turkey.
Conflicts of Interest
The authors declare no conflict of interest.
References
- Paerl, H.W.; Valdes-Weaver, L.M.; Joyner, A.R.; Winkelmann, V. Phytoplankton Indicators of Ecological Change in the Eutrophying Pamlico Sound System, North Carolina. Ecol. Appl. 2007, 17, 88–101. [Google Scholar] [CrossRef] [Green Version]
- Yüksek, A. The Reasons for Occurrence of Sea Snot/Mucilage in the Sea of Marmara. In Ecology of the Marmara Sea: Formation and Interactions of Marine Mucilage, and Recommendations for Solutions; Öztürk, İ., Şeker, M., Eds.; Turkish Academy of Science: Ankara, Turkey, 2021; pp. 85–104. [Google Scholar]
- Precali, R.; Giani, M.; Marini, M.; Grilli, F.; Ferrari, C.R.; Pečar, O.; Paschini, E. Mucilaginous Aggregates in the Northern Adriatic in the Period 1999–2002: Typology and Distribution. Sci. Total Environ. 2005, 353, 10–23. [Google Scholar] [CrossRef]
- Degobbis, D.; Malej, A.; Umani, S.F. The Mucilage Phenomenon in the Northern Adriatic Sea. A Critical Review of the Present Scientific Hypotheses. Ann. Ist. Super. Sanita 1999, 35, 373–381. [Google Scholar]
- Rinaldi, A.; Vollenweider, R.A.; Montanari, G.; Ferrari, C.R.; Ghetti, A. Mucilages in Italian Seas: The Adriatic and Tyrrhenian Seas, 1988-1991. Sci. Total Environ. 1995, 165, 165–183. [Google Scholar] [CrossRef]
- Tomasino, M.G. Is It Feasible to Predict “Slime Blooms” or “Mucilage” in the Northern Adriatic Sea? Ecol. Modell. 1996, 84, 189–198. [Google Scholar] [CrossRef]
- Gigliotti, A. Extracting Temporal and Spatial Distributions Information about Marine Mucilage Phenomenon Based on Modis Satellite Images: A Case Study of the Tyrrhenian and the Adriatic Sea, 2010–2012. Master’s Thesis, Universidade Nova, Lisbon, Portugal, 2013. [Google Scholar]
- Yentür, R.E.; Büyükateş, Y.; Özen, Ö.; Altin, A. The Environmental and Socio-Economical Effects of a Biologic Problem: Mucilage. Mar. Sci. Technol. Bull. 2013, 2, 13–15. [Google Scholar]
- Gotsis-Skretas, O. Mucilage Appearances in Greek Waters during 1982–1994. Sci. Total Environ. 1995, 165, 229–230. [Google Scholar] [CrossRef]
- Innamorati, M.; Nuccio, C.; Massi, L.; Mori, G.; Melley, A. Mucilages and Climatic Changes in the Tyrrhenian Sea. Aquat. Conserv. Mar. Freshw. Ecosyst. 2001, 11, 289–298. [Google Scholar] [CrossRef]
- MacKenzie, L.; Sims, I.; Beuzenberg, V.; Gillespie, P. Mass Accumulation of Mucilage Caused by Dinoflagellate Polysaccharide Exudates in Tasman Bay, New Zealand. Harmful Algae 2002, 1, 69–83. [Google Scholar] [CrossRef]
- Fukao, T.; Kimoto, K.; Yamatogi, T.; Yamamoto, K.; Yoshida, Y.; Kotani, Y. Marine Mucilage in Ariake Sound, Japan, Is Composed of Transparent Exopolymer Particles Produced by the Diatom Coscinodiscus Granii. Fish. Sci. 2009, 75, 1007–1014. [Google Scholar] [CrossRef]
- Aktan, Y.; Dede, A.; Ciftci, P.S. Mucilage Event Associated with Diatoms and Dinoflagellates in Sea of Marmara, Turkey. Harmful Algae News 2008, 1–3, 36. [Google Scholar]
- Tüfekçi, V.; Balkıs, N.; Polat Beken, Ç.; Ediger, D.; Mantıkçı, M. Phytoplankton Composition and Environmental Conditions of a Mucilage Event in the Sea of Marmara. Turkish J. Biol. 2010, 34, 199–210. [Google Scholar] [CrossRef]
- İşinibilir Okyar, M.; Üstün, F.; Orun, D.A. Changes in Abundance and Community Structure of the Zooplankton Population during the 2008 Mucilage Event in the Northeastern Marmara Sea. Turkish J. Zool. 2015, 39, 28–38. [Google Scholar] [CrossRef] [Green Version]
- Özalp, H.B. First Massive Mucilage Event Observed in Deep Waters of Çanakkale Strait (Dardanelles), Turkey. J. Black Sea / Mediterr. Environ. 2021, 27, 49–66. [Google Scholar]
- Balkıs-Ozdelice, N.; Durmus, T.; Balcı, M. A Preliminary Study on the Intense Pelagic and Benthic Mucilage Phenomenon Observed in the Sea of Marmara. Int. J. Environ. Geoinform. 2021, 8, 414–422. [Google Scholar] [CrossRef]
- Beşiktepe, Ş.T.; Sur, H.İ.; Özsoy, E.; Latif, M.A.; Oǧuz, T.; Ünlüata, Ü. The Circulation and Hydrography of the Marmara Sea. Prog. Oceanogr. 1994, 34, 285–334. [Google Scholar] [CrossRef]
- Alpar, B.; Yüce, H. Sea-Level Variations and Their Interactions Between the Black Sea and the Aegean Sea. Estuar. Coast. Shelf Sci. 1998, 46, 609–619. [Google Scholar] [CrossRef]
- Tas, S.; Kus, D.; Yilmaz, I.N. Temporal Variations in Phytoplankton Composition in the Northeastern Sea of Marmara: Potentially Toxic Species and Mucilage Event. Mediterr. Mar. Sci. 2020, 21, 668–683. [Google Scholar] [CrossRef]
- Kavzoglu, T. Determination of Environmental Degradation Due to Urbanization and Industrialization in Gebze, Turkey. Environ. Eng. Sci. 2008, 25, 429–438. [Google Scholar] [CrossRef]
- Ergül, H.A.; Aksan, S.; İpşiroğlu, M. Assessment of the Consecutive Harmful Dinoflagellate Blooms During 2015 in the Izmit Bay (the Marmara Sea). Acta Oceanol. Sin. 2018, 37, 91–101. [Google Scholar] [CrossRef]
- Artüz, M.I.; Baykut, F. Hydrography of the Sea of Marmara and Scientific Research on Pollution. Istanbul University Appl. Res. Cent. Environ. Publ 1986, 3, 138. [Google Scholar]
- Aktan, Y.; Tüfekçi, V.; Tüfekçi, H.; Aykulu, G. Distribution Patterns, Biomass Estimates and Diversity of Phytoplankton in İzmit Bay (Turkey). Estuar. Coast. Shelf Sci. 2005, 64, 372–384. [Google Scholar] [CrossRef]
- Ergul, H.; Aksan, S.; Ipsiroglu, M.; Baysal, A. Assessment of Consecutive Phytoplankton Blooms on March and April 2014 in Izmit Bay (the Marmara Sea). In Proceedings of the HydroMedit 2014, Volos, Greece, 13–15 November 2014; pp. 127–131. [Google Scholar]
- Ergul, H.A.; Aksan, S.; Ipsiroglu, M.; Kucuk, A. Assessment of the Spring 2015 Phytoplankton Blooms in Izmit Bay (the Marmara Sea). In Proceedings of the 3rd Science for the Environment Conference, Aarhus, Denmark, 1–2 October 2015. [Google Scholar]
- Taş, S.; Ergül, H.; Balkıs, N. Harmful Algal Blooms (HABs) and Mucilage Formations in the Sea of Marmara. In The Sea of Marmara: Marine biodiversity, Fisheries, Conservation and Governance; Özsoy, E., Cağatay, M., Balkis, N., Özturk, B., Eds.; Turkish Marine Research Foundation: Istanbul, Turkey, 2016; pp. 768–786. [Google Scholar]
- Kavzoglu, T.; Colkesen, I.; Sefercik, U.G. Detection and Monitoring of the Mucilage Occurrence in the Marmara Sea with Remote Sensing Technologies. In Ecology of the Marmara Sea: Formation and Interactions of Marine Mucilage, and Recommendations for Solutions; Turkish Academy of Science: Ankara, Turkey, 2021; pp. 199–224. [Google Scholar] [CrossRef]
- Tassan, S. An Algorithm for the Detection of the White-Tide (“mucilage”) Phenomenon in the Adriatic Sea Using AVHRR Data. Remote Sens. Environ. 1993, 45, 29–42. [Google Scholar] [CrossRef]
- Kavzoglu, T.; Tonbul, H.; Colkesen, İ.; Sefercik, U.G. The Use of Object-Based Image Analysis for Monitoring 2021 Marine Mucilage Bloom in the Sea of Marmara. Int. J. Environ. Geoinform. 2021, 8, 529–536. [Google Scholar] [CrossRef]
- Yagci, A.L.; Colkesen, I.; Kavzoglu, T.; Sefercik, U.G. Daily Monitoring of Marine Mucilage Using the MODIS Products: A Case Study of 2021 Mucilage Bloom in the Sea of Marmara, Turkey. Environ. Monit. Assess. 2022, 194, 170. [Google Scholar] [CrossRef]
- Isinibilir, M. Changes in Jellyfish Populations during Mucilage Event in Izmit Bay (the Northeastern Marmara Sea). In Proceedings of the ICES Annual Science Conference 2014: Sustainability in a Changing Ocean, A Coruna, Spain, 15–19 September 2014; Available online: https://www.ices.dk/sites/pub/CM%20Doccuments/CM-2014/Theme%20Session%20A%20contributions/A1914.pdf (accessed on 20 June 2022).
- Erdik, T.; Beji, S. Wave Climate in the Sea of Marmara. In Oil Spill along the Turkish Straits Sea Area; Accidents, Environmental Pollution, Socio-Economic Impacts and Protection; Ünlü, S., Alpar, B., Öztürk, B., Eds.; Turkish Marine Research Foundation (TUDAV): Istanbul, Turkey, 2018; p. 92. [Google Scholar]
- Tamiminia, H.; Salehi, B.; Mahdianpari, M.; Quackenbush, L.; Adeli, S.; Brisco, B. Google Earth Engine for Geo-Big Data Applications: A Meta-Analysis and Systematic Review. ISPRS J. Photogramm. Remote Sens. 2020, 164, 152–170. [Google Scholar] [CrossRef]
- Mutanga, O.; Kumar, L. Google Earth Engine Applications. Remote Sens. 2019, 11, 591. [Google Scholar] [CrossRef] [Green Version]
- Fekri, E.; Latifi, H.; Amani, M.; Zobeidinezhad, A. A Training Sample Migration Method for Wetland Mapping and Monitoring Using Sentinel Data in Google Earth Engine. Remote Sens. 2021, 13, 4169. [Google Scholar] [CrossRef]
- Chrysoulakis, N.; Mitraka, Z.; Gorelick, N. Exploiting Satellite Observations for Global Surface Albedo Trends Monitoring. Theor. Appl. Climatol. 2019, 137, 1171–1179. [Google Scholar] [CrossRef]
- Saah, D.; Johnson, G.; Ashmall, B.; Tondapu, G.; Tenneson, K.; Patterson, M.; Poortinga, A.; Markert, K.; Quyen, N.H.; San Aung, K.; et al. Collect Earth: An Online Tool for Systematic Reference Data Collection in Land Cover and Use Applications. Environ. Model. Softw. 2019, 118, 166–171. [Google Scholar] [CrossRef]
- Lobell, D.B.; Thau, D.; Seifert, C.; Engle, E.; Little, B. A Scalable Satellite-Based Crop Yield Mapper. Remote Sens. Environ. 2015, 164, 324–333. [Google Scholar] [CrossRef]
- Singh, P.; Maurya, V.; Dwivedi, R. Pixel Based Landslide Identification Using Landsat 8 and GEE. In Proceedings of the 2021 IEEE International Geoscience and Remote Sensing Symposium IGARSS, Brussels, Belgium, 11–16 July 2021; pp. 8444–8447. [Google Scholar]
- Mehravar, S.; Amani, M.; Moghimi, A.; Dadrass Javan, F.; Samadzadegan, F.; Ghorbanian, A.; Stein, A.; Mohammadzadeh, A.; Mirmazloumi, S.M. Temperature-Vegetation-Soil Moisture-Precipitation Drought Index (TVMPDI); 21-Year Drought Monitoring in Iran Using Satellite Imagery within Google Earth Engine. Adv. Sp. Res. 2021, 68, 4573–4593. [Google Scholar] [CrossRef]
- Zhao, Q.; Yu, L.; Li, X.; Peng, D.; Zhang, Y.; Gong, P. Progress and Trends in the Application of Google Earth and Google Earth Engine. Remote Sens. 2021, 13, 3778. [Google Scholar] [CrossRef]
- Amani, M.; Ghorbanian, A.; Ahmadi, S.A.; Kakooei, M.; Moghimi, A.; Mirmazloumi, S.M.; Moghaddam, S.H.A.; Mahdavi, S.; Ghahremanloo, M.; Parsian, S.; et al. Google Earth Engine Cloud Computing Platform for Remote Sensing Big Data Applications: A Comprehensive Review. IEEE J. Sel. Top. Appl. Earth Obs. Remote Sens. 2020, 13, 5326–5350. [Google Scholar] [CrossRef]
- Vescovi, F.D.; Merletto, V.; Montanari, G. Monitoraggio MODIS Di Mucillagini Nel Mare Adriatico. In Proceedings of the Atti della VII Conferenza nazionale ASITA, Verona, Italy, 28–31 October 2003; pp. 28–31. [Google Scholar]
- Hu, C. A Novel Ocean Color Index to Detect Floating Algae in the Global Oceans. Remote Sens. Environ. 2009, 113, 2118–2129. [Google Scholar] [CrossRef]
- Fang, C.; Song, K.S.; Shang, Y.X.; Ma, J.H.; Wen, Z.D.; Du, J. Remote Sensing of Harmful Algal Blooms Variability for Lake Hulun Using Adjusted FAI (AFAI) Algorithm. J. Environ. Informatics 2019, 34, 108–122. [Google Scholar] [CrossRef]
- McFeeters, S.K. The Use of the Normalized Difference Water Index (NDWI) in the Delineation of Open Water Features. Int. J. Remote Sens. 1996, 17, 1425–1432. [Google Scholar] [CrossRef]
- Gao, B. NDWI—A Normalized Difference Water Index for Remote Sensing of Vegetation Liquid Water from Space. Remote Sens. Environ. 1996, 58, 257–266. [Google Scholar] [CrossRef]
- Lacaux, J.P.; Tourre, Y.M.; Vignolles, C.; Ndione, J.A.; Lafaye, M. Classification of Ponds from High-Spatial Resolution Remote Sensing: Application to Rift Valley Fever Epidemics in Senegal. Remote Sens. Environ. 2007, 106, 66–74. [Google Scholar] [CrossRef]
- Meriç, E.; Yokes, M.B.; Yümün, Z.Ü.; Eryılmaz, M.; Yücesoy-Eryılmaz, F. Alien Benthic Foraminifers from Turkish Strait System. Int. J. Environ. Geoinform. 2018, 5, 68–75. [Google Scholar] [CrossRef]
- Feyisa, G.L.; Meilby, H.; Fensholt, R.; Proud, S.R. Automated Water Extraction Index: A New Technique for Surface Water Mapping Using Landsat Imagery. Remote Sens. Environ. 2014, 140, 23–35. [Google Scholar] [CrossRef]
- Xu, H. Modification of Normalised Difference Water Index (NDWI) to Enhance Open Water Features in Remotely Sensed Imagery. Int. J. Remote Sens. 2006, 27, 3025–3033. [Google Scholar] [CrossRef]
- Wang, Z.; Liu, J.; Li, J.; Zhang, D.D. Multi-Spectral Water Index (MuWI): A Native 10-m Multi-Spectral Water Index for Accurate Water Mapping on Sentinel-2. Remote Sens. 2018, 10, 1643. [Google Scholar] [CrossRef] [Green Version]
- Jiang, W.; Ni, Y.; Pang, Z.; Li, X.; Ju, H.; He, G.; Lv, J.; Yang, K.; Fu, J.; Qin, X. An Effective Water Body Extraction Method with New Water Index for Sentinel-2 Imagery. Water 2021, 13, 1647. [Google Scholar] [CrossRef]
- Flores-Anderson, A.I.; Griffin, R.; Dix, M.; Romero-Oliva, C.S.; Ochaeta, G.; Skinner-Alvarado, J.; Ramirez Moran, M.V.; Hernandez, B.; Cherrington, E.; Page, B.; et al. Hyperspectral Satellite Remote Sensing of Water Quality in Lake Atitlán, Guatemala. Front. Environ. Sci. 2020, 8, 7. [Google Scholar] [CrossRef]
- Zhang, F.; Chan, N.W.; Liu, C.; Wang, X.; Shi, J.; Kung, H.-T.; Li, X.; Guo, T.; Wang, W.; Cao, N. Water Quality Index (WQI) as a Potential Proxy for Remote Sensing Evaluation of Water Quality in Arid Areas. Water 2021, 13, 3250. [Google Scholar] [CrossRef]
- Lei, J.; Li, Z.; Bruce, W. Analysis of Dynamic Thresholds for the Normalized Difference Water Index. Photogramm. Eng. Remote Sens. 2009, 11, 1307–1317. [Google Scholar] [CrossRef]
- Kutser, T.; Miller, I.; Jupp, D.L.P. Mapping coral reef benthic substrates using hyperspectral space-borne images and spectral libraries. Estuar. Coast. Shelf Sci. 2006, 70, 449–460. [Google Scholar] [CrossRef]
- Olmedo-Masat, O.M.; Raffo, M.P.; Rodríguez-Pérez, D.; Arijón, M.; Sánchez-Carnero, N. How Far Can We Classify Macroalgae Remotely? An Example Using a New Spectral Library of Species from the South West Atlantic (Argentine Patagonia). Remote Sens. 2020, 12, 3870. [Google Scholar] [CrossRef]
- Colkesen, I.; Ozturk, M..; Kavzoglu, T.; Sefercik, U.G. Determination of Sea Surface Mucilage Formations Using Multitemporal Sentinel-2 Imagery. In Proceedings of the the 42nd Asian Conference on Remote Sensing (ACRS2021), Can Tho City, Vietnam, 22–24 November 2021. [Google Scholar]
- Acar, U.; Yılmaz, O.A.; Çelen, M.; Ateş, A.M.; Gülgen, F.; Şanlı, F.B. Determination of Mucilage in The Sea of Marmara Using Remote Sensing Techniques with Google Earth Engine. Int. J. Environ. Geoinfo. 2021, 8, 423–434. [Google Scholar] [CrossRef]
Publisher’s Note: MDPI stays neutral with regard to jurisdictional claims in published maps and institutional affiliations. |
© 2022 by the authors. Licensee MDPI, Basel, Switzerland. This article is an open access article distributed under the terms and conditions of the Creative Commons Attribution (CC BY) license (https://creativecommons.org/licenses/by/4.0/).