Article

Temporal Statistical Relationship between Regional Cerebral Oxygen Saturation (rSO2) and Brain Tissue Oxygen Tension (PbtO2) in Moderate-to-Severe Traumatic Brain Injury: A Canadian High Resolution-TBI (CAHR-TBI) Cohort Study

1
Department of Human Anatomy and Cell Science, Rady Faculty of Health Sciences, University of Manitoba, Winnipeg, MB R3T 2N2, Canada
2
Section of Neurosurgery, Department of Surgery, Rady Faculty of Health Sciences, University of Manitoba, Winnipeg, MB R3T 2N2, Canada
3
Department of Anesthesiology, Pharmacology & Therapeutics, University of British Columbia, Vancouver, BC V6T 1Z4, Canada
4
Biomedical Engineering, Faculty of Engineering, University of Manitoba, Winnipeg, MB R3T 2N2, Canada
5
Department of Neurology, Karolinska University Hospital, 171 76 Stockholm, Sweden
6
Department of Clinical Neuroscience, Karolinska Institutet, 171 76 Stockholm, Sweden
7
Department of Neurosurgery, University of Helsinki and Helsinki University Hospital, FI-00029 Helsinki, Finland
8
Department of Intensive Care, Maastricht University Medical Center, 6229 Maastricht, The Netherlands
9
School of Mental Health and Neurosciences, University Maastricht, 6211 Maastricht, The Netherlands
10
Section of Neurosurgery, Department of Clinical Neurosciences, University of Calgary, Calgary, AB T2N 1N4, Canada
11
Department of Clinical Neurosciences, University of Calgary, Calgary, AB T2N 1N4, Canada
12
Hotchkiss Brain Institute, University of Calgary, Calgary, AB T2N 1N4, Canada
13
Section of Critical Care, Department of Medicine, University of Montreal, Montreal, QC H3T 1J4, Canada
14
Department of Critical Care Medicine, University of Calgary, Calgary, AB T2N 1N4, Canada
15
Centre on Aging, University of Manitoba, Winnipeg, MB R3T 2N2, Canada
16
Division of Anaesthesia, Department of Medicine, Addenbrooke’s Hospital, University of Cambridge, Cambridge CB2 1TN, UK
*
Author to whom correspondence should be addressed.
Bioengineering 2023, 10(10), 1124; https://doi.org/10.3390/bioengineering10101124
Submission received: 30 June 2023 / Revised: 18 September 2023 / Accepted: 22 September 2023 / Published: 25 September 2023

Abstract

:
Brain tissue oxygen tension (PbtO2) has emerged as a cerebral monitoring modality following traumatic brain injury (TBI). Near-infrared spectroscopy (NIRS)-based regional cerebral oxygen saturation (rSO2) can non-invasively examine cerebral oxygen content and has the potential for high spatial resolution. Past studies examining the relationship between PbtO2 and NIRS-based parameters have had conflicting results with varying degrees of correlation. Understanding this relationship will help guide multimodal monitoring practices and impact patient care. The aim of this study is to examine the relationship between PbtO2 and rSO2 in a cohort of TBI patients by leveraging contemporary statistical methods. A multi-institutional retrospective cohort study of prospectively collected data was performed. Moderate-to-severe adult TBI patients were included with concurrent rSO2 and PbtO2 monitoring during their stay in the intensive care unit (ICU). The high-resolution data were analyzed utilizing time series techniques to examine signal stationarity as well as the cross-correlation relationship between the change in PbtO2 and the change in rSO2 signals. Finally, modeling of the change in PbtO2 by the change in rSO2 was attempted utilizing linear methods that account for the autocorrelative nature of the data signals. A total of 20 subjects were included in the study. Cross-correlative analysis found that changes in PbtO2 were most significantly correlated with changes in rSO2 one minute earlier. Through mixed-effects and time series modeling of parameters, changes in rSO2 were found to often have a statistically significant linear relationship with changes in PbtO2 that occurred a minute later. However, changes in rSO2 were inadequate to predict changes in PbtO2. In this study, changes in PbtO2 were found to correlate most with changes in rSO2 approximately one minute earlier. While changes in rSO2 were found to contain information about future changes in PbtO2, they were not found to adequately model them. This strengthens the body of literature indicating that NIRS-based rSO2 is not an adequate substitute for PbtO2 in the management of TBI.

1. Introduction

Traumatic brain injury (TBI) is the preeminent form of neurotrauma globally and is a leading cause of death and disability worldwide [1,2]. Contemporary management of TBI largely focuses on guideline-based management aimed at global arterial blood pressure (ABP), intracranial pressure (ICP), and cerebral perfusion pressure (CPP) treatment thresholds to try to minimize the ongoing brain injury that occurs in the acute period following the initial event [3,4]. While there have been multiple iterations of this paradigm, there has been little progress in further improving outcomes following TBI [5]. Given the large global burden of this disease, different approaches to the management of TBI are being explored. Attention has shifted towards a precision-medicine-based approach to the management of TBI that incorporates multi-modal cerebral monitoring [6,7,8,9].
The most widely adopted of these a”xili’ry modalities is brain tissue oxygen tension (PbtO2), with recent guidelines incorporating its use into treatment algorithms [4]. Additionally, at least three large phase 3 randomized control trials are underway to evaluate the ability of PbtO2 monitoring to improve outcomes following TBI [10,11,12]. PbtO2 measures diffusible oxygen content in the extracellular space through a Clarke-type electrode. As a result, it is speculated that it has a slower response to physiologic variations than other monitoring modalities. This also necessitates its invasive placement into viable brain tissue and results in its ability to only sample a small volume of brain tissue [13].
Near-infrared spectroscopy (NIRS) as a cerebral monitoring modality, in the setting of TBI, has grown for the past three decades [14]. The non-invasive nature, ease of application, and potential for high spatial resolution of NIRS monitoring are significant advantages of this modality. While there is a robust body of evidence supporting its quantitative relationship with cerebral blood flow, its precise relationship with PbtO2 is much less clear, with some studies concluding a strong linear correlation between the modalities in retrospective observational studies [15,16,17,18,19]. Other retrospective observational studies failed to identify any statistical relationship [20,21,22].
One possible etiology of this discrepancy is a failure to leverage time series analysis techniques that allow for the utilization of high-resolution data streams while accounting for the autocorrelative and hierarchical nature of this type of physiologic data. Without accounting for hierarchical and autocorrelation structures in the data, the assumptions of the regression methods utilized in these studies, mainly the independence of samples, is not entirely valid. It can be hypothesized that this may have resulted in an erroneously strong correlation between these parameters. Presented here is a study utilizing the Canadian High-Resolution Traumatic Brain Injury (CAHR-TBI) Research Collaborative database, which is a multi-institutional database of moderate-to-severe TBI patients. A highly unique feature of this dataset is its concurrently measured high-resolution PbtO2 and rSO2 data, the likes of which have not previously been reported in the literature. The primary objective of this study is to utilize contemporary time series analysis techniques to better characterize the relationship between PbtO2 and NIRS-based regional cerebral oxygen saturation (rSO2). The secondary objective of this study is to determine if PbtO2 can be adequately modeled by rSO2 in the setting of moderate-to-severe TBI.

2. Materials and Methods

2.1. Study Design

Using data from the Canadian High Resolution TBI (CAHR-TBI) Research Collaborative, a retrospective multicenter cohort study utilizing a prospectively collected database of critically ill TBI patients was performed, similar to recently published work from this group. Retrospective analysis was determined to be appropriate based on availability of data. Additionally, given the exploratory and observational nature of the study, an entirely prospective study would not be particularly beneficial at this time. Patients included in this study were admitted to one of the following university-affiliated hospitals: Vancouver General Hospital (University of British Columbia), Foothills Medical Centre (University of Calgary), and Health Sciences Centre Winnipeg (University of Manitoba). Institutions collaborating in this research have committed to prospective collection of high-resolution physiologic data in TBI patients. Research ethics approval at the University of Manitoba has been obtained for this database (H2017:181 and H2017:188). Additionally, ethics approval was obtained for retrospective access to the database, as well as for anonymous data transfer between centers (H2020:118, H20-03759 and REB20-0482).

2.2. Patient Population

The CAHR-TBI database is composed of moderate-to-severe TBI patients (defined as having a Glasgow Coma Scale ranging from 3 to 12) treated at an adult intensive care unit (ICU). All patients in this database had invasive ICP and ABP monitoring and were cared for using management strategies based on Brain Trauma Foundation (BTF) guidelines [3]. PbtO2 was managed based on local practice norms which varied from aggressive management to purely observational. PbtO2 monitors were placed into viable brain tissues based on CT scans or under direct inspection in the operating room. NIRS-based rSO2 was not actively used to guide management at any of the institutions. While granular patient-specific data are not available, similar vasopressor, sedative, and hyperosmolar/hypertonic agents were utilized at all participating institutions. Patient data were entered into the database from 2011 to 2022.
Included in this study were all patients in the CAHR-TBI database that had concurrent invasive PbtO2 monitoring and NIRS-based rSO2 monitoring. Those without PbtO2 or NIRS monitoring were excluded. Age, biological sex, admission Glasgow Coma Score (GCS), admission pupil exam, and follow-up Glasgow Outcome Score (GOS) were extracted. Sample size calculations were not possible and therefore not performed due to the exploratory nature of this study.

2.3. High-Resolution Physiologic Data Collection

High-resolution physiologic data-streams included ICP, ABP, and PbtO2, as well as left and right rSO2. ABP was measured utilizing radial arterial lines. ICP was monitored using intra-parenchymal strain gauge probes (Codman ICP MicroSensor; Codman & Shurtlef Inc., Raynham, MA, USA) placed in the frontal lobe or using external ventricular drains (Medtronic, Minneapolis, MN, USA). PbtO2 was measured using intra-parenchymal brain tissue oxygenation probes (Licox Brain Tissue Oxygen Monitoring System; Integra LifeSciences Corp., Plainsboro, NJ, USA) placed in viable frontal lobe tissue. rSO2 was measured using NIRS regional cerebral oximetry of both the left and right frontal lobes (Covidien INVOS 5100C or 7100) when possible.
Data streams were recorded in digital high-frequency time series (≥100 Hz for ABP and ICP, 1 Hz for PbtO2 and rSO2) using analogue-to-digital signal converters (Data Translations, DT9804 or DT9826) when required. This digitized data were linked and stored in time series using Intensive Care Monitoring (ICM+) software (Version 8.5, Cambridge Enterprise Ltd., Cambridge, UK). For the purposes of this study ICP and ABP were included for the sake of cohort characterization and were not utilized in subsequent data analysis.

2.4. Physiologic Data Cleaning and Processing

High-resolution physiologic data were artifact-cleared manually by a qualified clinician utilizing ICM+ software. Artifacts were determined through the examination of waveforms for ICP and ABP. Additionally, sudden drops in PbtO2 and rSO2 to zero were deemed artifactual. All data were cleaned without knowledge of patient demographics or study objectives.
All high-resolution data streams were processed into both 10-seconds-by-10-seconds and minute-by-minute data utilizing ICM+ software. Data were then exported as comma-separated value (CSV) files for data analysis. The minute-by-minute data were utilized throughout the analysis as it is generally considered the standard for cerebral multimodal monitoring signal analytics as it provides a good balance between data size/computational time and temporal resolution [23,24]. The exception was the cross-correlative analysis, where the 10-seconds-by-10-seconds data were also used to confirm the findings from the minute-by-minute data and in the impulse response function plots to evaluating the data at a temporal resolution and frequency in keeping with vasomotion [25]. Due to the side of PbtO2 probe placement not being available for all patients, rSO2 values on the right were utilized for analysis, unless not available, in which case rSO2 values from the left were utilized.

2.5. Physiologic Data Analysis and Statistical Methods

2.5.1. Overview

The data analysis was performed using R statistical software (Version 4.2.2, R Foundation for Statistical Computing, Vienna, Austria) with the following packages: astsa, blandr, forecast, lmtest, nlme, tidyverse, tseries, and zoo. The Intel oneAPI Math Kernel Library (Intel Corp., Santa Clara, CA, USA) was utilized for the Basic Linear Algebra Subprograms (BLAS) and the Linear Algebra Package (LAPACK) to improve computational performance. Data streams were further filtered to exclude PbtO2 values less than 0 mmHg and greater than 60 mmHg, as these values were felt likely to be erroneous based on clinical expertise. rSO2 values less than 25% were excluded, as this is the lower limit of output for the INVOS devices used. This, along with the previously mentioned manual artifact clearing, resulted in discontinuities in the data streams. As subsequent time series analysis required continuous data streams, discontinuities were filled through basic linear interpolation through the approx() function. For all models, alpha was set to 0.05 without correction for multiple comparisons. Additionally, no sample size or power calculations were performed. This was due to the exploratory nature of this study, which leveraged available data sets.
In this study, the relationship between PbtO2 and rSO2 was characterized through time series analysis and inferential statistical modeling. Linear regression assumes independent sampling. In the setting of frequent resampling from individual subjects, as is the case in all high-frequency cerebral physiologic monitoring, this assumption is invalid in two regards. Resampling from the same subject in a cohort leads to a hierarchical structure, as samples from the same subject are likely to be more similar than those taken between subjects. This is because intrasubject sampling has random unaccounted-for effects held constant that are not constant in intersubject sampling. Beyond this, when samples are taken with a high frequency, there is a tendency for samples to be correlated with previously taken samples from the same subject. This is known as autocorrelation. The simplest means by which to reinstitute the validity of these assumptions of linear regression is to average the data over large epochs of time (i.e., such as daily or over the entire recording period) for each subject and then regress over these averages. In the dynamic setting of the critically ill TBI patient, this can result in a significant loss of information.
Fortunately, there are statistical methods to account for these deviations from the assumption of independent sampling. In this study, two such methodologies were utilized. First, hierarchical linear modeling, also known as linear mixed-effects modeling, can help account for the random effects experienced by each subject. Additionally, time series-based autoregressive integrative moving average (ARIMA) modeling can account for the autocorrelative structure of the modeled data stream, in this case PbtO2. The details of this analysis are described further in the subsequent sections. However, an in-depth review of the theoretical background of these methodologies is beyond the scope of this paper. We refer the interested reader to previous works on this subject [26,27,28,29], and literature applying such methodologies to cerebral physiologic data [30].

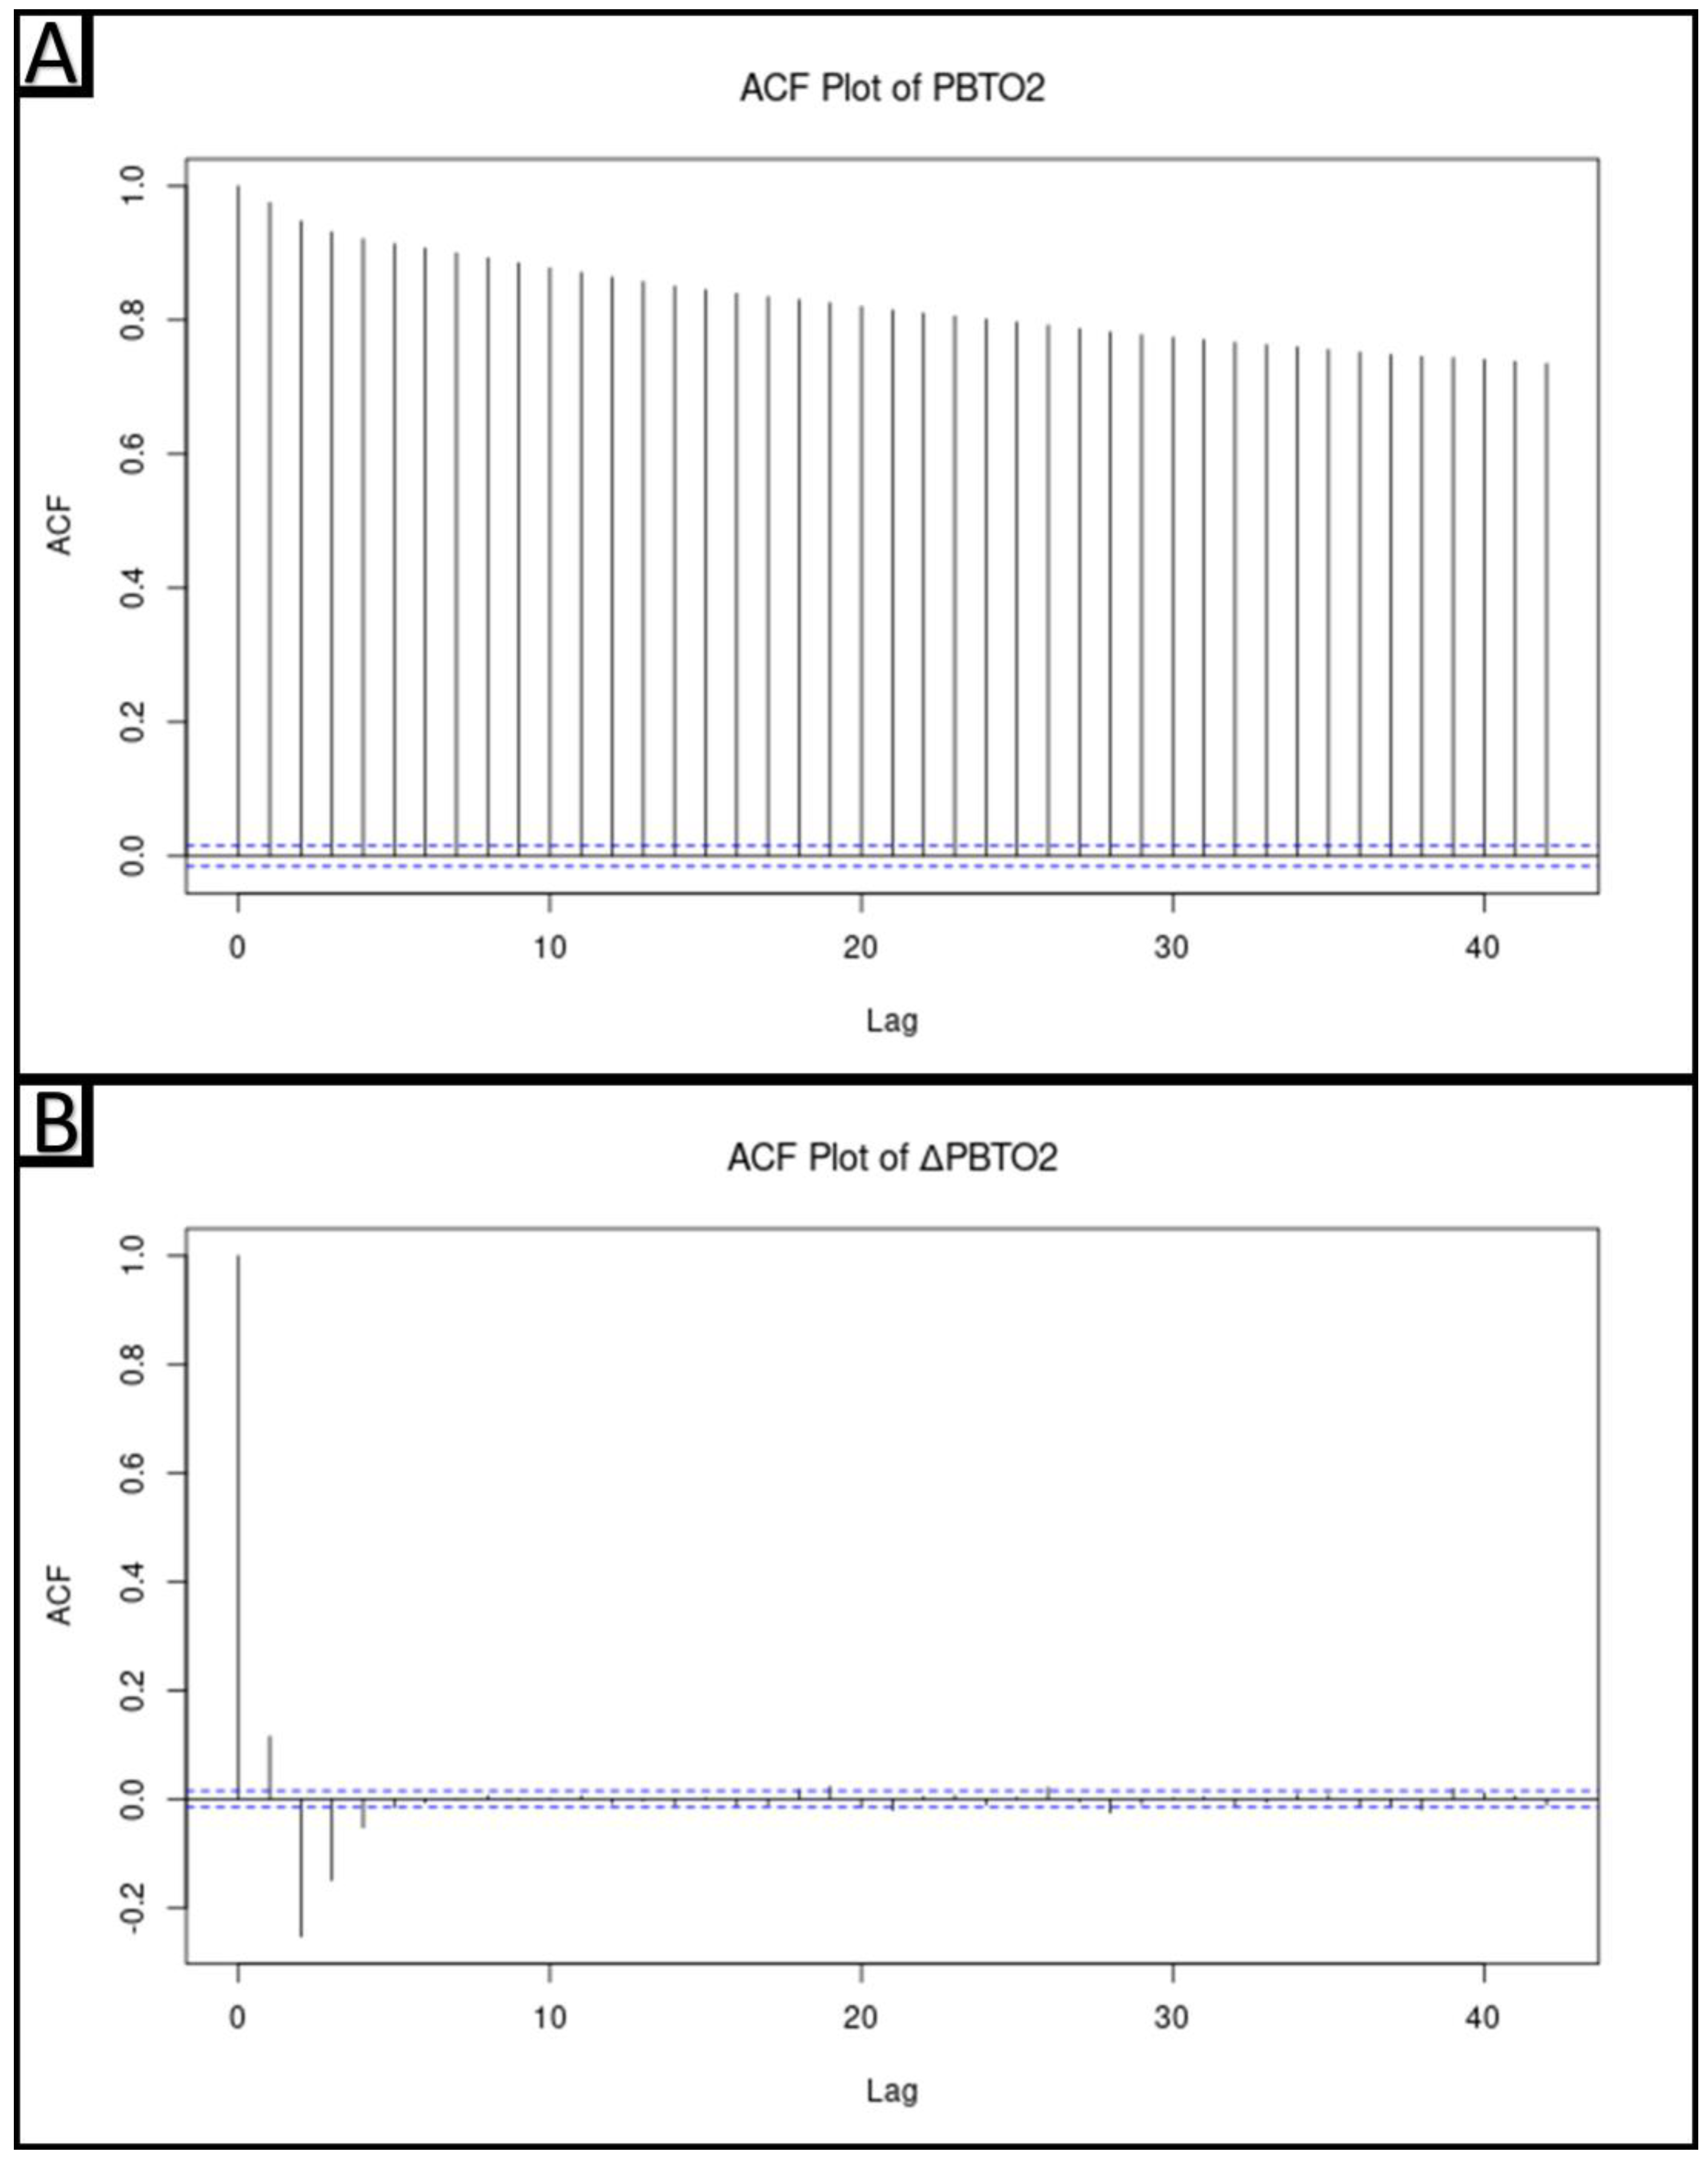
2.5.2. Determination of Stationarity of Physiologic Data

Prior to performing time series modeling and analysis, it was necessary to determine if the response data streams of interest, PbtO2, were stationary. This is necessary, as there is an assumption of signal stationarity in the utilized time series modeling techniques. If signals are not stationary, they must be transformed to be made stationary prior to any modeling. Testing of signal stationarity was accomplished through examination of the autocorrelative function (ACF) plots for each patient’s PbtO2 data. For all ACF plots, significance levels were set to a correlation level of +/−(2/N1/2), where N is the number of samples. Generally, for each patient, there was no rapid drop off to zero in lag significance, indicative of non-stationarity of the series. This was confirmed with the Augmented Dicky–Fuller (ADF) and Kwiatkowski–Phillips–Schmidt–Shin (KPSS) testing for stationarity.
To make the series stationary, the first difference was taken for each data series. Following first differencing, the stationarity of the data streams was confirmed through inspection of the ACF plots which now showed rapid decay in the significance of subsequent lags. Additionally, ADF and KPSS testing both confirmed stationarity of the first differenced signals. Physiologically, the data streams can now be thought of as the change in PbtO2 (ΔPbtO2) and the change in rSO2 (ΔrSO2). While this is not the same as PbtO2 and rSO2, it was felt that the data obtained from examining how ΔPbtO2 relates to ΔrSO2 would provide insight into the relationship between these physiologic parameters.

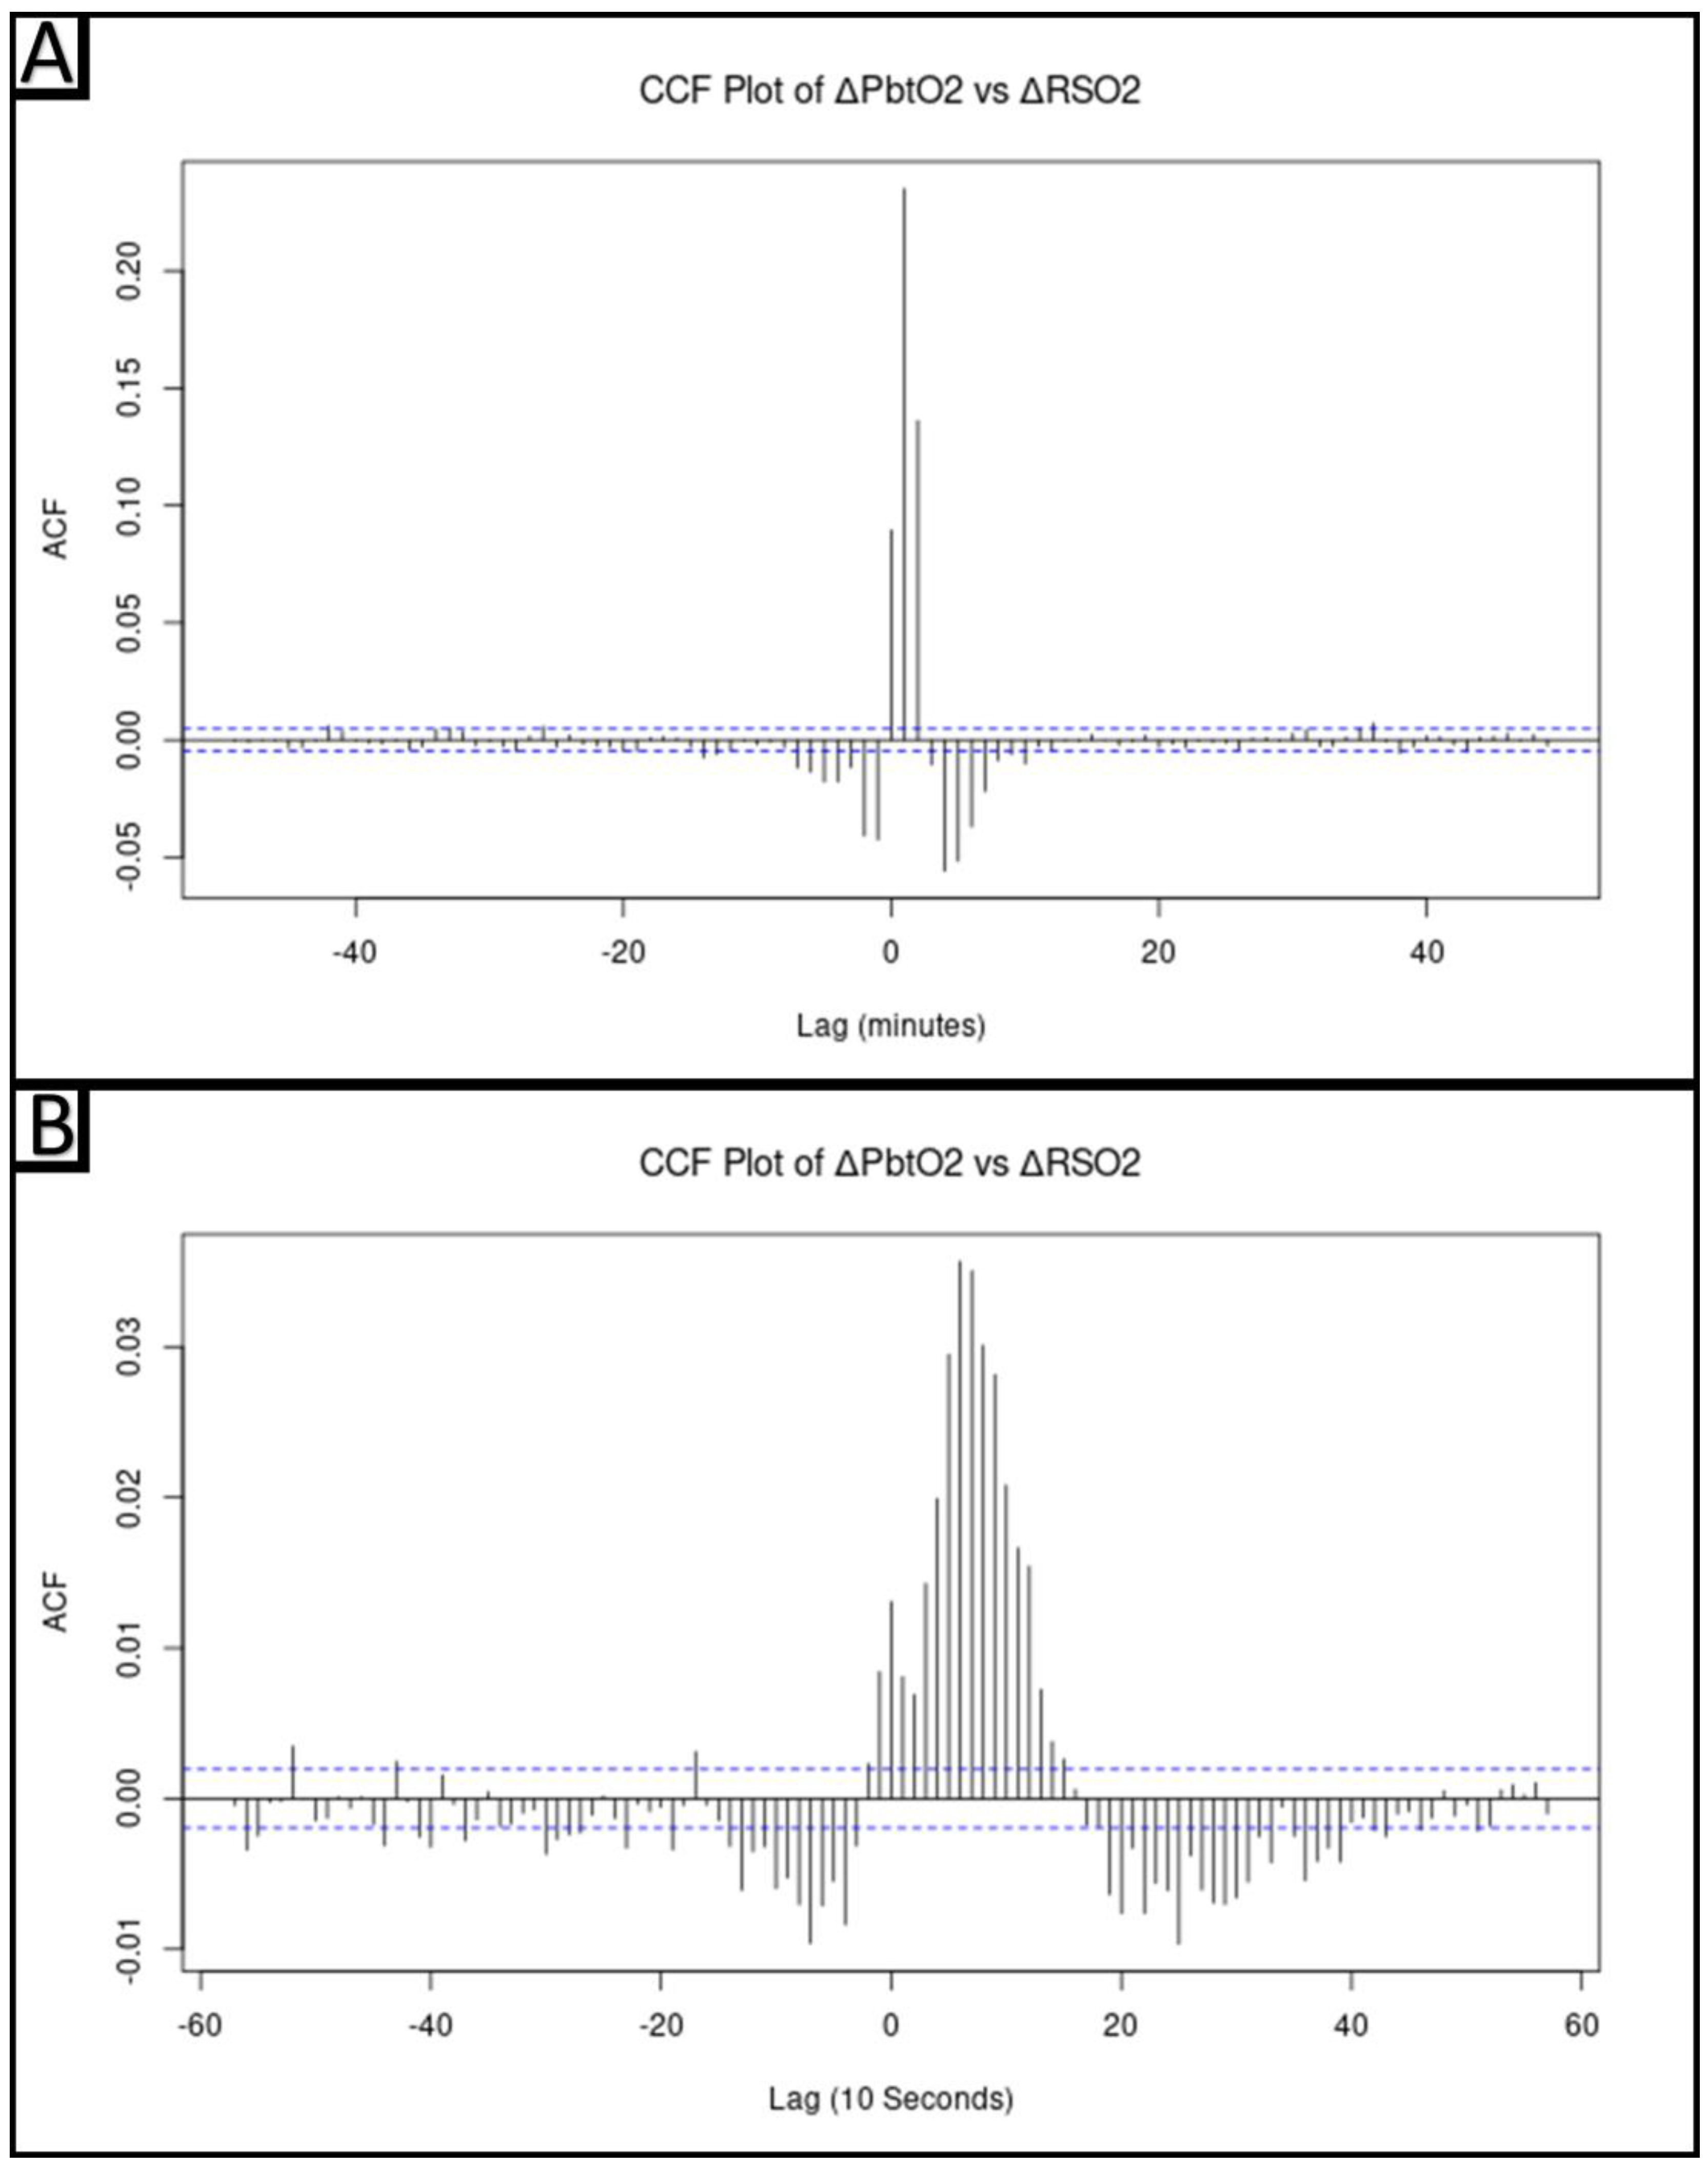
2.5.3. Cross-Correlative Relationship between ΔPbtO2 and ΔrSO2

Given that PbtO2 samples the extracellular fluid of brain parenchyma and NIRS-based rSO2 reflects changes in the brain microvasculature, it is conceivable that changes in these parameters would be asynchronous [31,32]. To identify and examine this potential asynchrony, a cross-correlative analysis was carried out between ΔPbtO2 and ΔrSO2, utilizing the minute-by-minute data over the entire cohort. The cross-correlation function (CCF) of the minute-by-minute data shows the largest correlative magnitude at a lag of 1 (ΔrSO2Lag1). This can be interpreted as ΔrSO2 being most strongly correlated with ΔPbtO2 a minute later. The CCF plot of the 10-seconds-by-10-seconds data reinforces this conclusion, as the most significant lag is seen at lag 6, corresponding to a one-minute delay between ΔrSO2 and ΔPbtO2. Since ΔrSO2Lag1 was found to contain the most information about ΔPbtO2, it was used in subsequent linear modeling.

2.5.4. Vector Autoregressive Modeling and Impulse–Response Function Plots

To further provide insights into the relationship between ΔrSO2 and ΔPbtO2, impulse–response function (IRF) plots were created based on a multivariate vector autoregressive (VAR) model. These plots examine the modeled response of ΔrSO2 and ΔPbtO2 to a sudden impulse of ΔABP. The high-frequency 10-seconds-by-10-seconds data streams of interest (ΔABP, ΔICP, ΔPbtO2, and ΔrSO2) were utilized as the cerebral vasoactive response was being examined in this analysis and acts on a frequency scale of approximately 0.1 Hz [23,33]. Given the non-stationarity of the original data streams, the differenced data were used. These parameters were used going forward for VAR modeling and generation of the IRF plots.
To determine the appropriate autoregressive order of the VAR model, the Akaike Information Criterion (AIC) was determined for vector autoregressive models of order 1 to 15. There was diminishing marginal improvement in AIC as model order increased past 6. As such, following the principle of parsimony, a VAR model of order 6 was constructed utilizing the VAR() function in R. Finally, using the irf() function in R, this VAR model was utilized to model and plot the response in ΔPbtO2 as well as ΔrSO2 of an orthogonal impulse in ΔABP over the subsequent 10 lags.

2.5.5. Hierarchical Linear Modeling of ΔPbtO2 from ΔrSO2Lag1

Given the hierarchical nature of this dataset, a linear mixed-effects model with random slope and intercept, utilizing the lme() function, was performed with ΔPbtO2 as the dependent variable and ΔrSO2Lag1 as the independent variable. Next, to evaluate whether there was any autocorrelation of the model’s residuals, ACF and partial autocorrelative function (PACF) plots were made of these residuals. As with the ACF plots, for all PACF plots, significance levels were set to a correlation level of +/−(2/N1/2), where N is the number of samples. There was an autocorrelative structure to the residuals, indicating that there was unaccounted for autocorrelation in the response variable, ΔPbtO2.

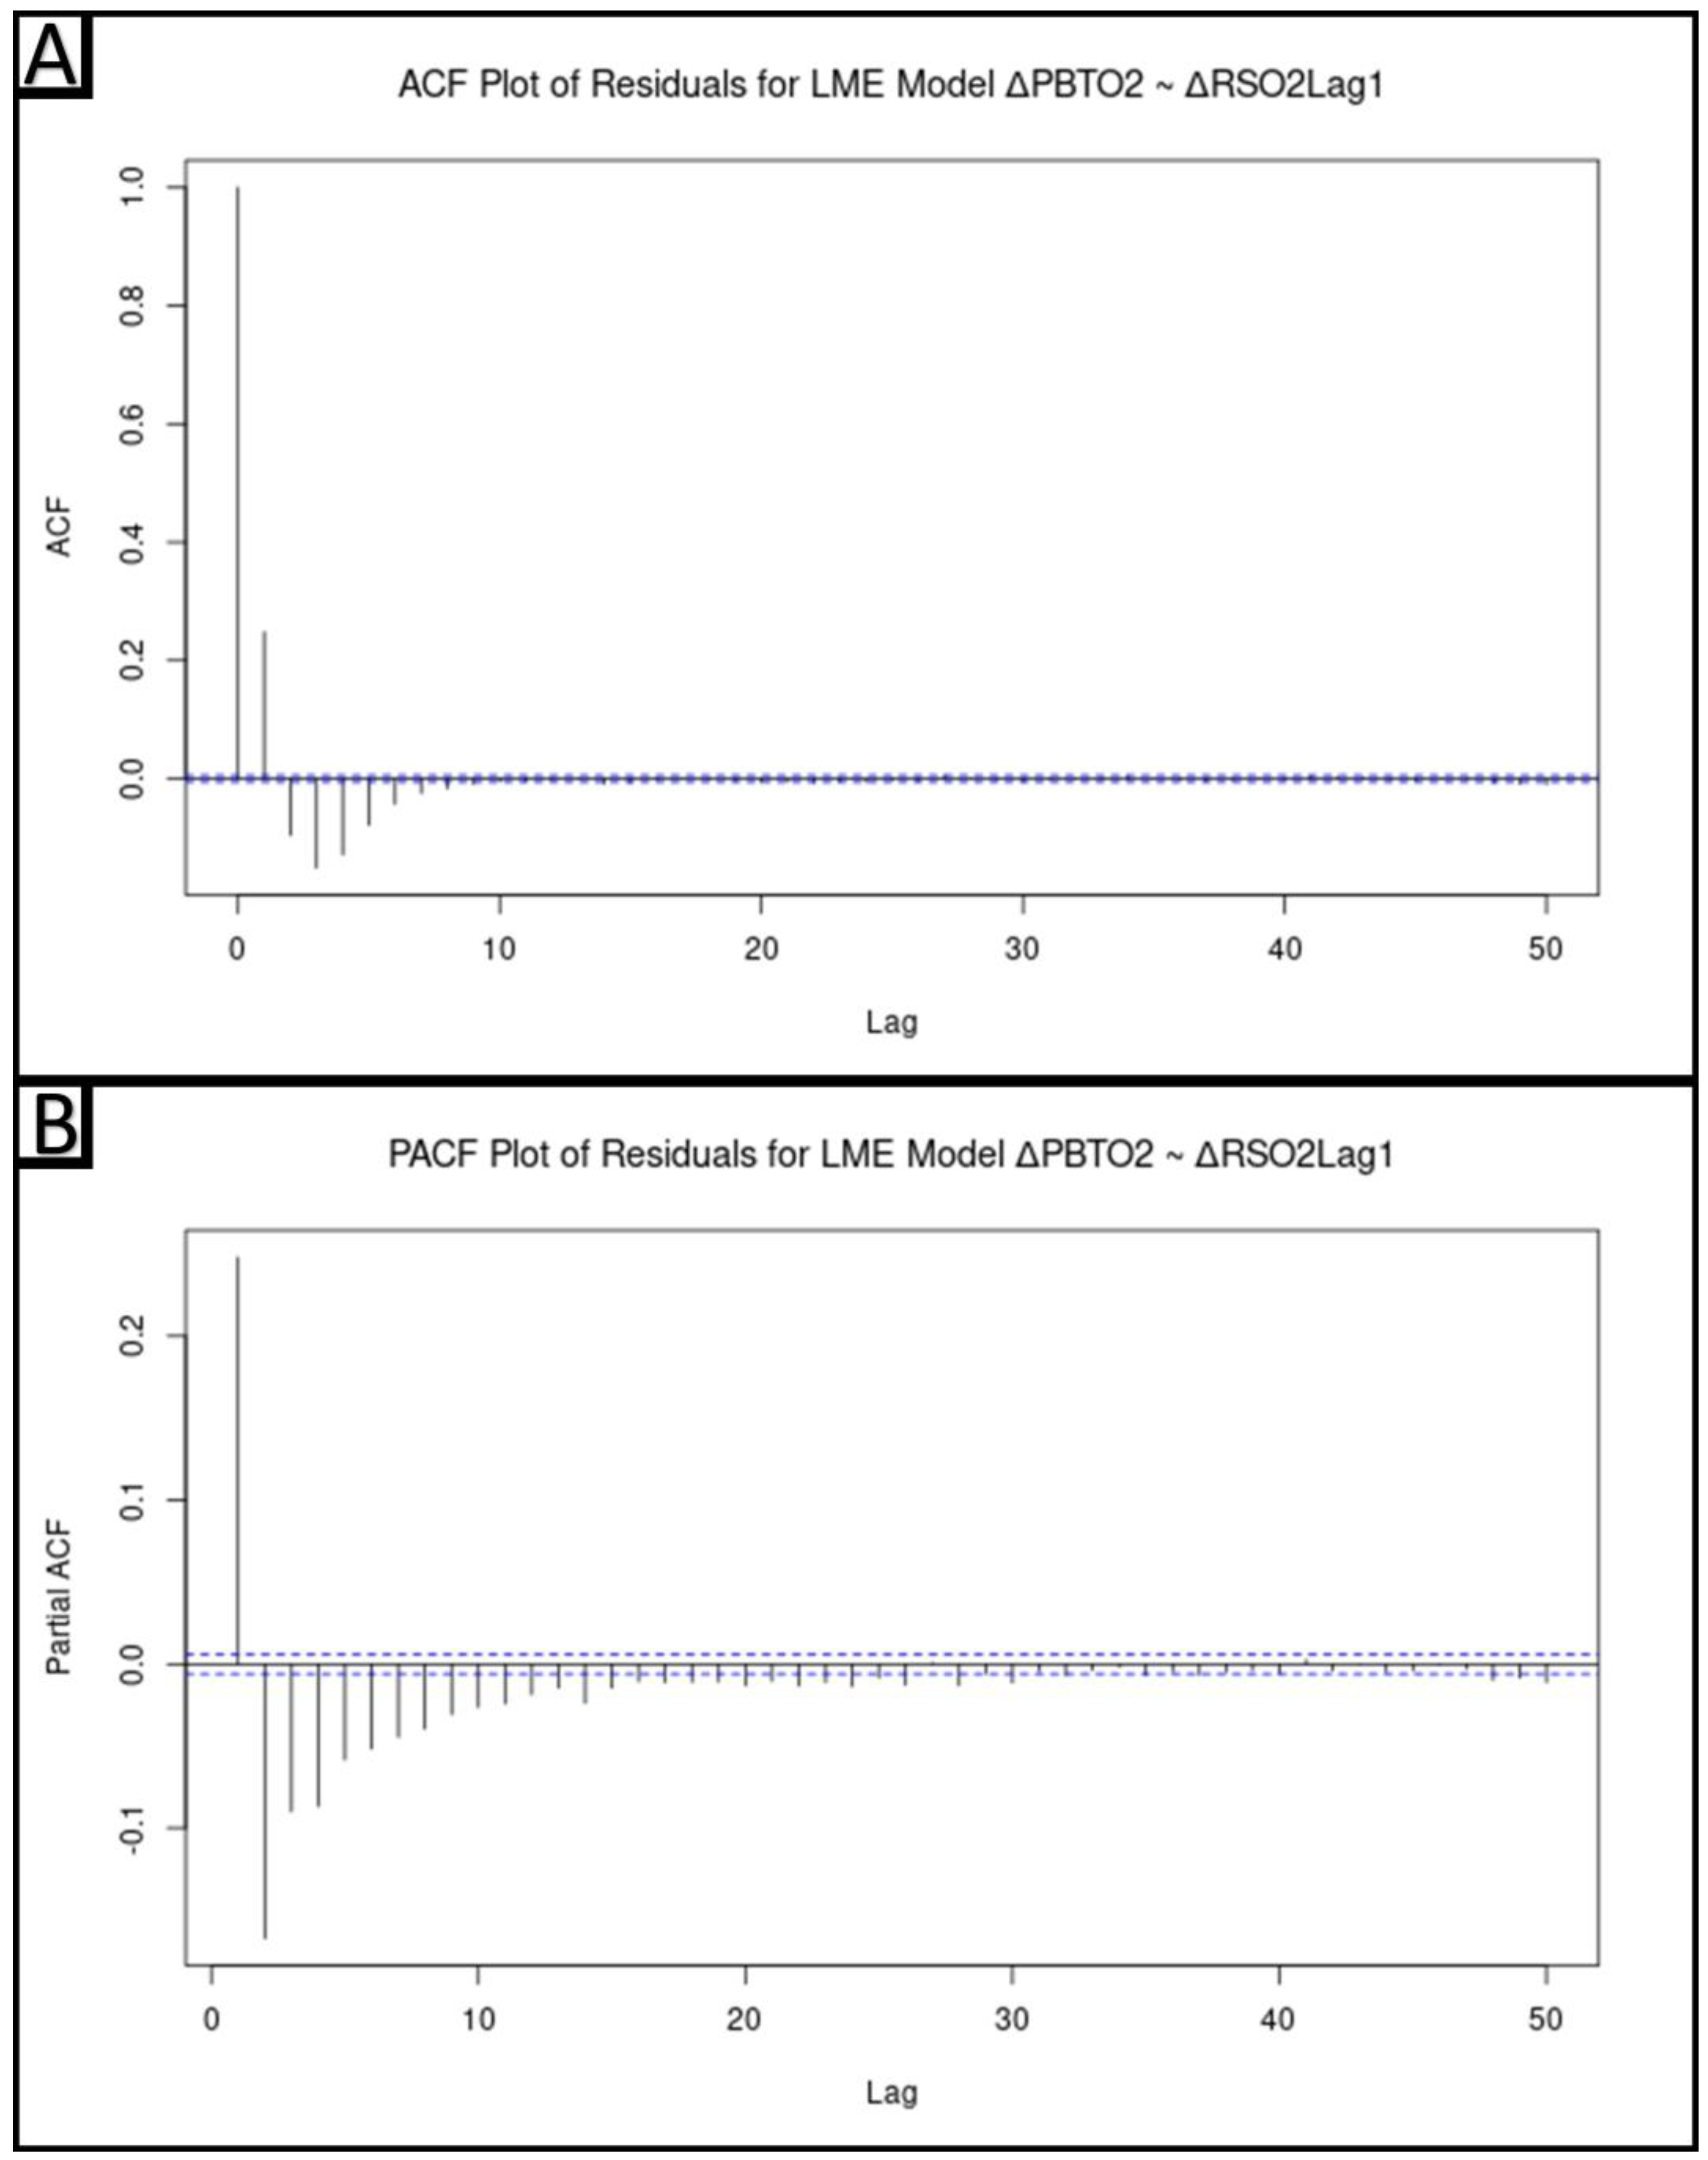
2.5.6. Modeling of ΔPbtO2 from ΔrSO2Lag1 Accounting for Autocorrelative Structure

Population-level linear mixed-effects models that incorporated the autocorrelative structure of ΔPbtO2 were constructed, as has been done in previous cerebral physiology studies [34]. However, given the size of this dataset, the computational times were unacceptably long, with models failing to converge even after weeks of computation. As a result, it was determined that the next best option was to construct a linear model that accounted for the autocorrelative structure of ΔPbtO2 for each individual subject and make inferences about the relationship between PbtO2 and rSO2 based on the general findings of these models.
For each subject, an initial simple linear regression was performed with ΔPbtO2 as the dependent variable and ΔrSO2Lag1 as the independent variable. In order to account for the autocorrelative nature of ΔPbtO2, the ARIMA structure of the residuals needed to be determined. This was done through the auto.arima() function for the residuals of the linear model in each subject. Next, the autoregressive and moving average orders were utilized in the arima() and sarima() functions, with ΔPbtO2 as the response variable and ΔrSO2Lag1 as the external regressor, to produce a linear model that accounted for the autocorrelative structure of ΔPbtO2. For each subject, the significance the ΔrSO2Lag1 coefficient was determined. Additionally, for each model, ACF and PACF plots of the residuals were examined to determine if there was any remaining autocorrelative structure.

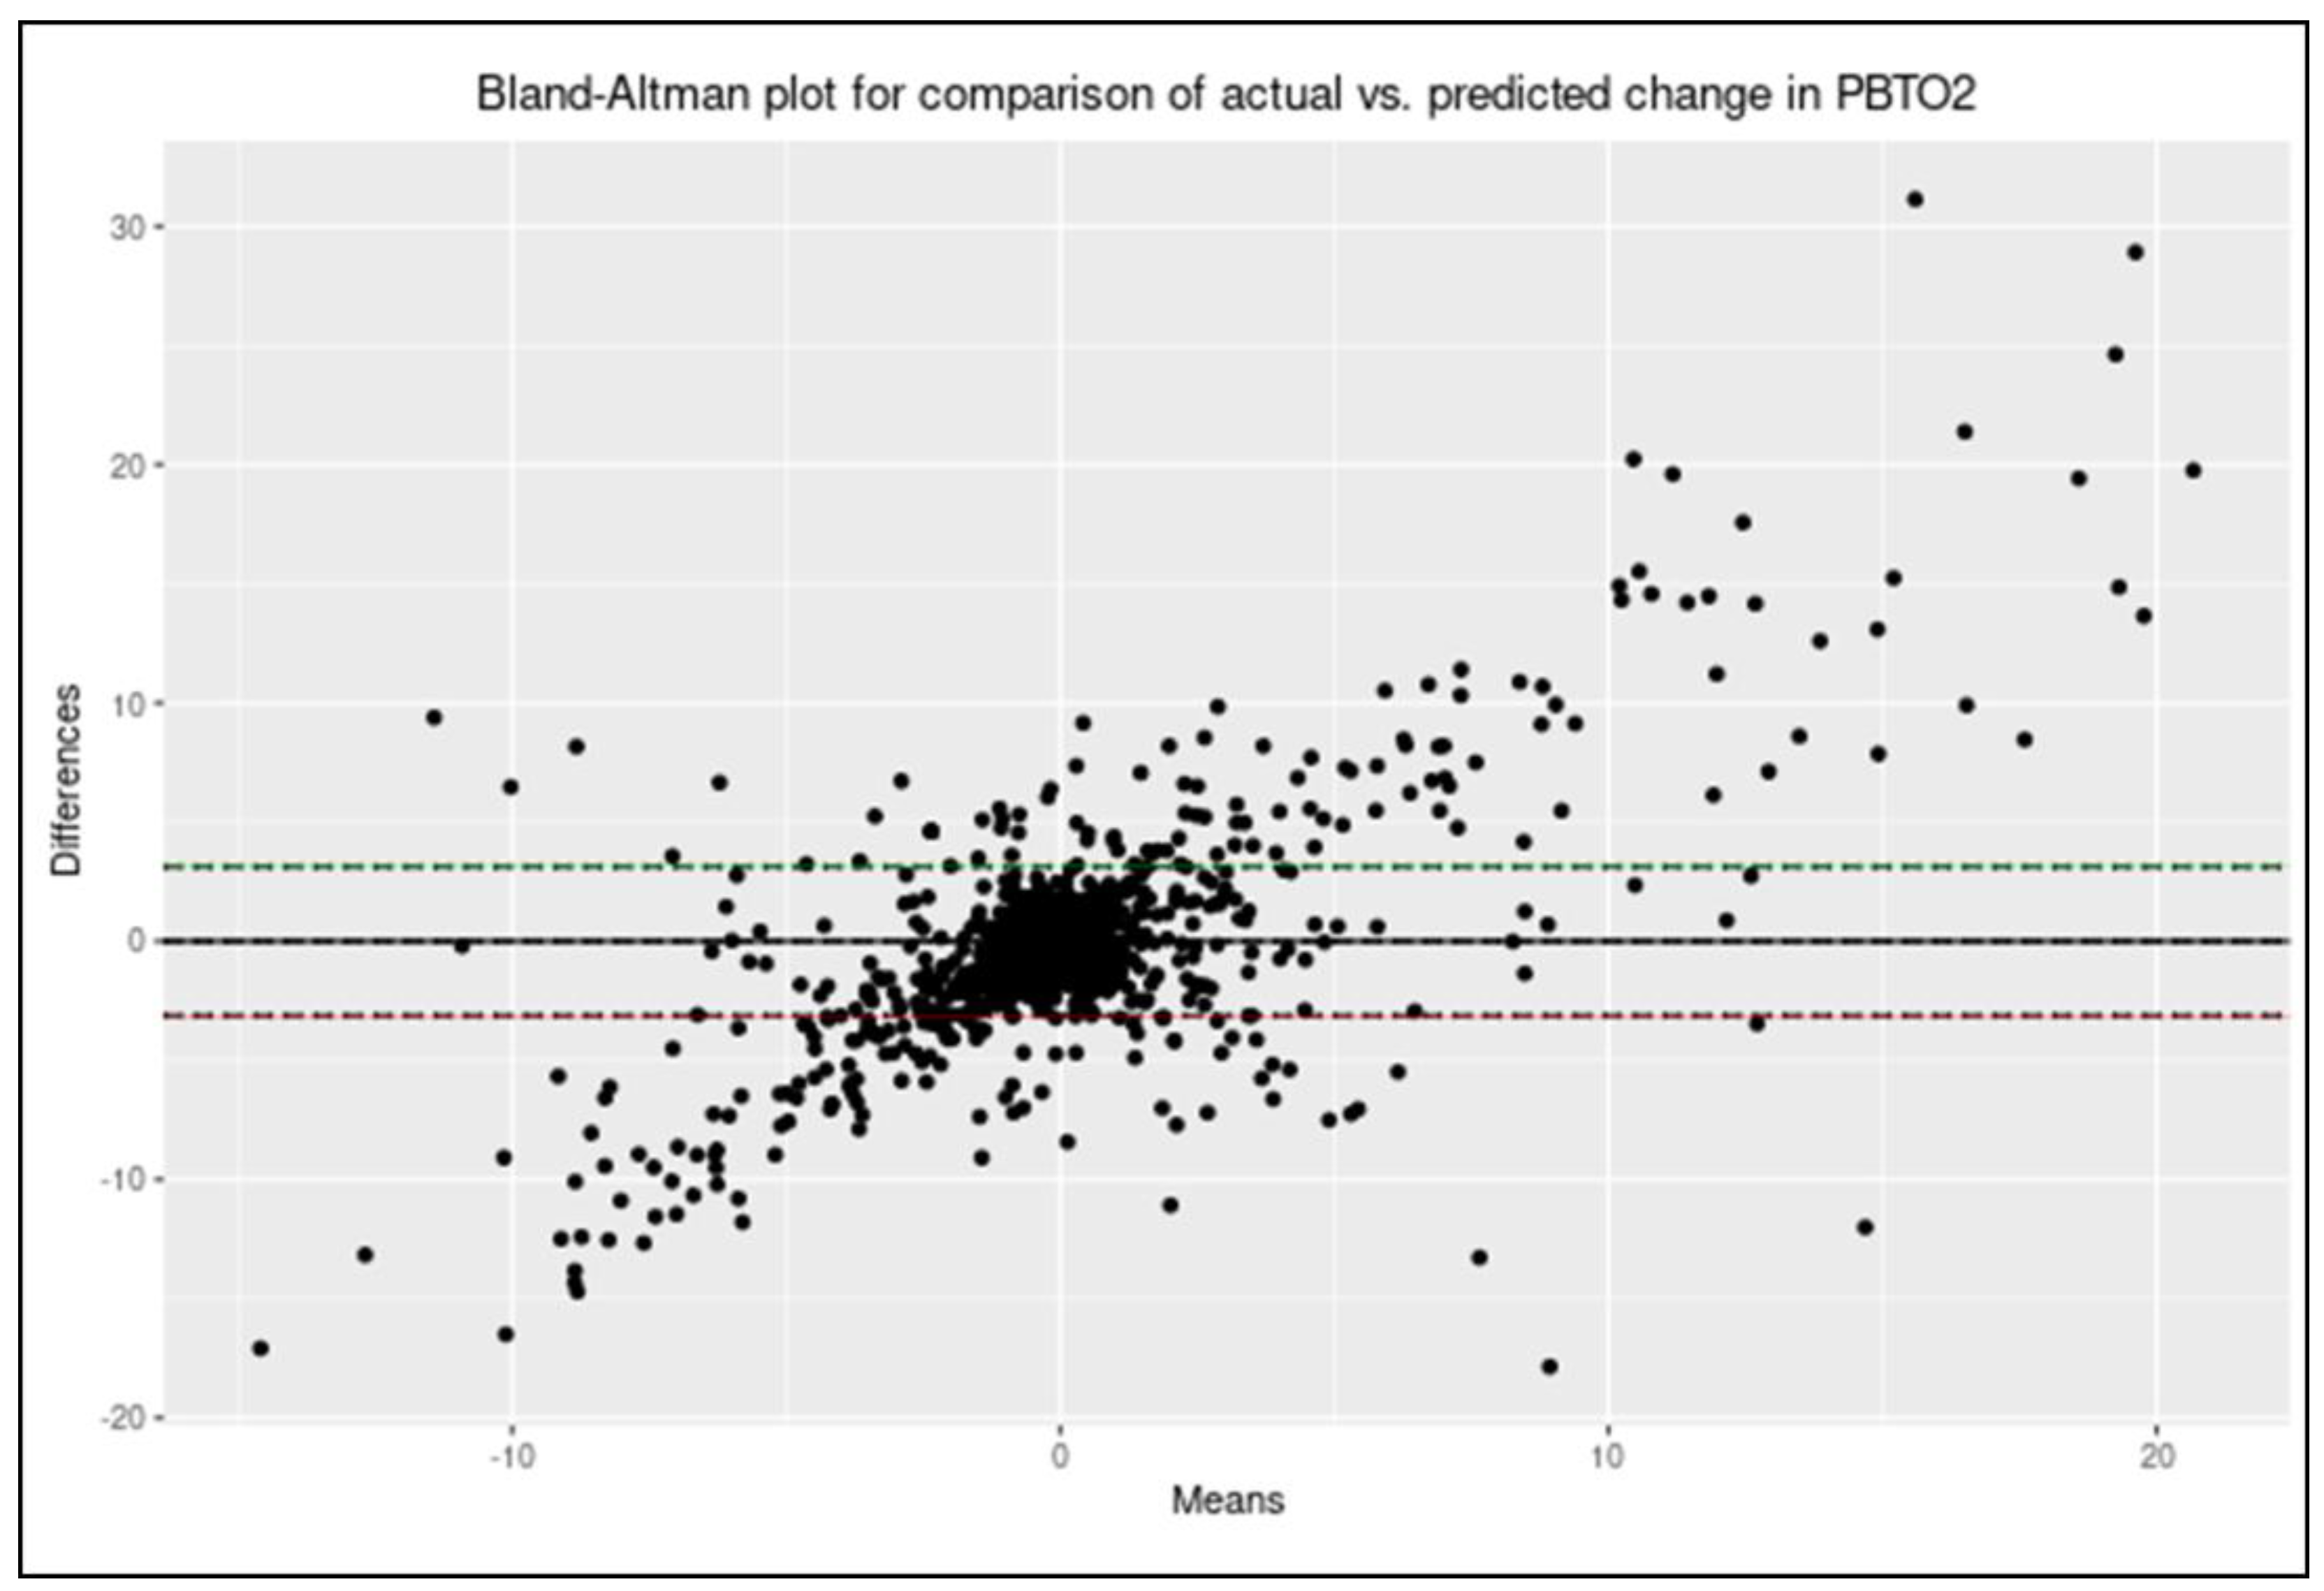
2.5.7. Evaluating Model Correlation and Agreement

To examine the correlation between the predicted values of ΔPbtO2 and actual values of ΔPbtO2 for each subject, a Pearson correlation coefficient was obtained. Next, a Bland–Altman plot was produced to evaluate agreement between the predicted values of ΔPbtO2 and actual values of ΔPbtO2.

3. Results

3.1. Cohort Demographics

A total of 20 subjects were included in the study, with a total of 114,136 min of time with concurrent PbtO2 and rSO2 measurements without interpolation. The full demographic data of the cohort can be found in Table 1.

3.2. Determination of the Stationarity of the Physiologic Data

The ACF plots, as well as the ADF and KPSS test results for each patient’s PbtO2 data, can be found in Supplementary File S1. ACF plots did not show a rapid drop-off of significant lags, indicating non-stationarity. An example of an ACF plot can be seen in Figure 1A. KPSS testing for each patient’s PbtO2 data also uniformly indicated non-stationarity. In most patients, ADF testing indicated no presence of a unit root. As such, a transformation to the data was required before the assumption of stationarity could be fulfilled and time series models of the data constructed. This pattern of ACF plots and KPSS and ADF testing results is consistent with a difference stationary series, and so the first-order difference of the data was taken to transform the data.
The ACF plots, as well as the ADF and KPSS test results for each patient’s ΔPbtO2 data, can be found in Supplementary File S1. Once the first difference was taken, each patient’s ACF plots showed a rapid decline in the significance of lags, indicating stationarity. An example of an ACF plot can be seen in Figure 1B. Consistent with this, KPSS testing indicated stationarity of the ΔPbtO2 data for each patient. This indicated that the first-order-differenced data fulfilled the assumptions of stationarity. As a result, subsequent analysis was carried out using both ΔPbtO2 and ΔrSO2 data.

3.3. Cross-Correlative Relationship between ΔPbtO2 and ΔrSO2

Cross-correlation analysis between ΔPbtO2 and ΔrSO2, over the entire cohort, indicated the ΔPbtO2 was most strongly correlated with ΔrSO2 one minute earlier. In other words, ΔPbtO2 and ΔrSO2Lag1 shared the strongest cross-correlation. In the 10-seconds-by-10-seconds data, a similar pattern was seen with ΔPbtO2 correlating with ΔrSO2 six lags earlier, equivalent to one minute earlier. The CCF plots of the minute-by-minute data and 10-seconds-by-10-seconds data can be seen in Figure 2A and Figure 2B, respectively. As a result of this finding, ΔPbtO2 and ΔrSO2Lag1 were utilized for modeling.

3.4. Vector Autoregressive Modeling and Impulse–Response Function Plots

The AIC for the multivariate VAR models from order 1 to 15 can be seen in Figure 3. It is clear that there is a clear drop off in marginal improvements in AIC for VAR models with an order greater than 6. As such, a VAR model incorporating ΔABP, ΔICP, ΔPbtO2, and ΔrSO2 with an order of 6 was utilized to construct the IRF plots. The IRF plots of the modeled response in ΔrSO2 and ΔPbtO2 to a sudden impulse in ΔABP can be seen in Figure 4A and Figure 4B, respectively. The modeled response of ΔrSO2 indicates an almost instantaneous response to an impulse in ΔABP followed by a sharp decrease and eventual return to equilibrium by approximately lag 6. This is in contrast to ΔPbtO2, where an impulse in ΔABP results in a delayed and prolonged response that only peaks at approximately lag 6 or 7.

3.5. Hierarchical Linear Modeling of ΔPbtO2 from ΔrSO2Lag1

The linear mixed-effects model (population level model) with random slope and intercept did find ΔrSO2Lag1 to be a significant positive linear regressor of ΔPbtO2 (0.35, S.E. 0.10, p = 0.0002). However, the ACF and PACF plots can be seen in Figure 5A and Figure 5B, respectively. There is a clear demonstration of autocorrelation of the residuals, indicating an unaccounted-for autocorrelative structure of ΔPbtO2. This indicates that the autocorrelative structure of ΔPbtO2 needs to be accounted for, prior to valid inferences being made about the relationship between ΔPbtO2 and ΔrSO2Lag1.

3.6. Modeling of ΔPbtO2 from ΔrSO2Lag1 Accounting for Autocorrelative Structure

Attempts to create a linear mixed-effects model that adequately incorporated the autocorrelative structure of ΔPbtO2 at the population level were unsuccessful. This was due to computational complexity with failure to converge. Creating independent inferential linear models for each patient was more successful. The details of these models can be found in Table 2. Of note, ΔrSO2 was found to be a significant regressor in 16 of the 20 patients. However, in three of these patients, the coefficient was negative, which is not consistent with the expected relationship between rSO2 and PbtO2. Examination of the ACF and PACF plots, found in Supplementary File S2, showed minimal autocorrelative structure remaining in the residuals of these models. This confirms model adequacy.

3.7. Evaluating Model Correlation and Agreement

The results of the correlation analysis between actual and predicted values of ΔPbtO2 are also summarized in Table 2. Notably, correlation coefficients were generally poor for each subject-based model ranging from 0.04 to 0.57. Scatter plots of actual and predicted values of ΔPbtO2 for each subject can be found in Supplementary File S3.
An example of a Bland–Altman plot for a single model can be seen in Figure 6, with the full series available in Supplementary File S4. Uniformly, agreement was poor throughout all individual subject models of ΔPbtO2 from ΔrSO2Lag1.

4. Discussion

A statistically rigorous exploration of the relationship between the change in PbtO2 and change in NIRS-based rSO2 was performed in this multi-institutional cohort of 20 moderate-to-severe TBI patients. There are three key insights brought about by this study. First, changes in PbtO2 are correlated with changes in rSO2 that occur one minute earlier. Second, changes in rSO2, in a linear way, contain information about changes in PbtO2 that occur one minute later. Finally, while changes in rSO2 have this delayed linear relationship with changes in PbtO2, changes in rSO2 are not adequate for predicting changes in PbtO2.
In this study, changes in PbtO2 are often best correlated with changes in rSO2 one minute earlier. This finding is both consistent with the theoretical mechanisms of each modality and previous findings in the literature. In a study of 42 TBI patients, Budohoski and colleagues noted that NIRS reacted earlier to changes in ABP and ICP as compared to PbtO2 [35]. This was recapitulated here in the findings of the VAR-modeled IRF plot. From these plots it can be seen that the response in change in PbtO2 is both delayed and prolonged. In the case of change in rSO2, it is probable that the initial step rise, subsequent overcorrection, and eventual return to equilibrium may be reflective of cerebrovascular reactivity. The delayed and prolonged nature of the change in PbtO2 may explain why continuous cerebrovascular reactivity metrics based on PbtO2 have been found to be so dissimilar to those based on more responsive surrogates of cerebral blood flow or volume [36]. As for the mechanism of this delay, PbtO2 is a measure of the extracellular content of oxygen in brain tissue as it only measures dissolved oxygen in the interstitial fluid of the brain. NIRS-based rSO2 measures microvascular oxygen saturation over a volume of brain as it utilizes deoxyhemoglobin (DeOxHgB) and oxyhemoglobin (OxHgB) as chromophores to scatter and the NIR light [31,32]. Oxygen is primarily delivered to the brain in the form of OxHgB through the brain’s microvasculature. An increase in OxHgB in the brain’s microvasculature would be detected through the absorption of near-infrared light. However, prior to observing a change in oxygen content of the extracellular space of the brain, and therefore PbtO2, oxygen would need to disassociate from the OxHgB and diffuse into this extracellular space. A similar delay in decreases in cerebral oxygen content might also be explained by this mechanism. This mechanism is consistent with the findings of changes in PbtO2 being correlated with changes in rSO2 that occurred one minute earlier. This is a significant finding that may help guide further research into the flow of oxygen through the cerebral microenvironment.
This study found that changes in rSO2 may, in a linear way, contain information about a change in PbtO2 approximately one minute later. The statistical significance of this relationship held true even when the autocorrelative structure of PbtO2 was accounted for. While this was not found in every patient, there are several reasons why this may be the case, the most obvious of which is that NIRS-based rSO2 is prone to interference from extravascular blood collections, such as those seen in subgaleal, epidural, and subdural hematomas, as well as intraparenchymal hematomas. In the setting of TBI, these forms of interference are common.
Finally, this study indicates that changes in NIRS-based rSO2 are inadequate on their own to predict upcoming changes in PbtO2. Despite using a methodology that may tend towards overfitting of the models, measures of change in rSO2 were unable to reasonably predict changes in PbtO2. This was primarily evident when examining the degree of agreement between actual values of change in PbtO2 and predicted values. This adds to the body of evidence that indicates rSO2 is not an adequate alternative to PbtO2 [20,21,22]. Once again, while rSO2 and PbtO2 are in some ways measures of cerebral oxygenation, they interrogate entirely different compartments. There are likely several factors that influence changes in PbtO2 that were not utilized in the models in this study. Hemoglobin concentrations (HgB), cerebral metabolic rate of oxygen (CMRO2), partial pressure of oxygen in the arterial blood (PaO2), and microvascular cerebral blood flow velocity (CBFV) are all factors that may modulate how changes in rSO2 relate to changes in PbtO2. It is understandable why, despite containing information about upcoming changes in PbtO2, changes in rSO2 could not adequately predict changes in PbtO2 in this cohort.
The findings of this study have significant clinical implications. The first is that rSO2 and PbtO2 provide related but not equivalent information about brain physiology, and as such, rSO2, as a raw parameter, is not a viable non-invasive alternative to PbtO2 for the monitoring of TBI patients. Further work is needed to better elucidate the potential role of rSO2 in the multimodal monitoring of critically ill TBI patients. The related nature of rSO2 and PbtO2 may be leveraged in the future to improve care, such as in the prehospital setting where invasive monitoring is not possible. Secondly, given the identifiably delayed reaction of PbtO2 to changes in ABP as compared to rSO2, as demonstrated in the CCF analysis and IRF plots, it is likely that rSO2 is better suited for continuous indices of cerebrovascular reactivity. These indices require response parameters that react quickly to changes in ABP. There is a significant degree of interest evolving in the area of continuous cerebrovascular reactivity indices in the monitoring and management of moderate-to-severe TBI.

4.1. Limitations

There are limitations to this study that need consideration when interpreting its findings. The first is the relatively small size of the cohort in this study, with only 20 patients included. This necessitates the validation of these findings in a larger cohort before the findings can be fully incorporated into patient care as generalizability might be limited. However, concurrent NIRS-based rSO2 and PbtO2 monitoring is relatively uncommon, with this study being the first such analysis of high-resolution concurrent recordings in the literature. This cohort represents less than 7% of the full CAHR-TBI database indicating the rarity of simultaneous recordings of these parameters. This likely reflects both the relatively recent global adoption of PbtO2 as a means of cerebral monitoring in TBI and the paucity of evidence for the use of NIRS in monitoring moderate-to-severe TBI.
A second limitation, brought on by the type of analysis performed, was the need to interpolate data. This, obviously, injects some inherent uncertainty into the study findings. Another limitation of this study is that information about factors that may interfere with rSO2 measurements, such as extravascular blood collections, was not available. Additionally, the side of PbtO2 monitor placement needed to be assumed, as this was also not available for all patients.
Finally, the models utilized in this analysis assumed a linear relationship between changes in rSO2 and changes in PbtO2. This was done due to the lack of evidence suggesting a more appropriate alternative structure to this relationship. It is possible that a mathematically more complex model may prove more suited to describing this relationship. Complex supervised machine learning algorithms might be an obvious method to map this relationship better. While more complex mathematical models might provide an accurate prediction of PbtO2 values based on rSO2 levels, they are likely to increase computational complexity. This may limit utility at the bedside if computations are not possible in real time due to this increased complexity.

4.2. Future Work

The findings of this work lay the groundwork for additional research. First, these findings need to be validated in a larger multi-institutional cohort, where information about sources of NIRS interference is also available. Ideally, additional parameters, including CMRO2, PaO2, HgB concentration, and microvascular CBFV, would also be concurrently measured to fully elucidate the relationship between these two modalities. With a larger cohort and better characterized physiology, the complexity of this relationship may be better captured.
While NIRS-based rSO2 has not gained traction as a stand-alone parameter in the management of TBI, there is increased interest in leveraging NIRS as a means of non-invasively interrogating cerebrovascular reactivity in TBI [37,38,39,40]. This may mean larger datasets with concurrent rSO2 and PbtO2 monitoring may become available in the future. In such complex multimodal monitoring datasets, supervised and unsupervised classification and regression machine learning algorithms may provide additional insights into how these parameters interact with one another. While complex computational models may not be deployable at the bedside, they may act as inferential models to drive our understanding further. This may ultimately lead to new treatment paradigms in the management of moderate and severe TBI in the acute phase, including specific molecular targets.

5. Conclusions

In this multi-institutional exploratory analysis of a cohort of 20 TBI patients with concurrent rSO2 and PbtO2 monitoring, changes in PbtO2 were found to correlate most significantly with changes in rSO2 approximately one minute earlier. Through mixed-effects and time series modeling, changes in rSO2 were found to often have a statistically significant linear relationship with changes in PbtO2 that occurred one minute later. This was the case even when the hierarchical and autocorrelative structure of the data was considered. However, changes in rSO2 were inadequate on their own to predict changes in PbtO2 based on the poor agreement between modeled and actual changes in PbtO2. Given the uniqueness of this dataset, only a small number of subjects were available for analysis, limiting the confidence of these findings. In the future, a larger cohort, with additional parameters that influence cerebral oxygenation, is required to validate and better explain these findings.

Supplementary Materials

The following supporting information can be downloaded at: https://www.mdpi.com/article/10.3390/bioengineering10101124/s1, Supplementary File S1: Evaluation of Stationarity of PbtO2 Signals, Supplementary File S2: Evaluation of residuals of the linear ΔPbtO2~ΔrSO2Lag1 models to ensure autocorrelative structure was accounted for, Supplementary File S3: Scatter plots of actual vs. predicted values of ΔPbtO2 for each subject, Supplementary File S4: Bland–Altman plots to evaluate model agreement.

Author Contributions

A.G. aided in study conception, data collection, preparation, and analysis as well as preparation and editing of the manuscript. D.G. aided in data collection and editing of the manuscript. L.F. aided in data collection and analysis as well as editing of the manuscript. E.Y. aided in data collection and editing of the manuscript. E.P.T. aided in editing the manuscript. R.R. aided in editing the manuscript. M.A. aided in editing of the manuscript. C.G. aided in data collection and editing of the manuscript. F.B. aided in editing the manuscript. A.H.K. aided in data collection and editing of the manuscript. F.A.Z. aided in study conception, data collection, and editing of the manuscript. All authors have read and agreed to the published version of the manuscript.

Funding

This work was directly supported through the Endowed Manitoba Public Insurance (MPI) Chair in Neuroscience, and NSERC (DGECR-2022-00260, RGPIN-2022-03621, ALLRP-578524-22, ALLRP-576386-22, ALLRP 586244-23).

Institutional Review Board Statement

Research ethics approval at the University of Manitoba has been obtained for this database (H2017:181 and H2017:188). Additionally, ethics approval was obtained for retrospective access of the database as well as for anonymous data transfer between centers (H2020:118, H20-03759 and REB20-0482).

Informed Consent Statement

Patient consent was waived by the research ethics board due to the observational and non-invasive nature of the study and the adherence to current standards of care.

Data Availability Statement

The raw data supporting the conclusions of this article will be made available by the authors, without undue reservation.

Acknowledgments

FAZ is supported through the Endowed Manitoba Public Insurance (MPI) Chair in Neuroscience/TBI Research Endowment, NSERC (DGECR-2022-00260, RGPIN-2022-03621, ALLRP-578524-22, ALLRP-576386-22, I2IPJ 586104–23, and ALLRP 586244-23), Canadian Institutes of Health Research (CIHR), the MPI Neuroscience Research Operating Fund, the Health Sciences Centre Foundation Winnipeg, the Canada Foundation for Innovation (CFI) (Project #: 38583), Research Manitoba (Grant #: 3906 and 5429) and the University of Manitoba VPRI Research Investment Fund (RIF)."AG is supported through the University of Manitoba Clinician Investigator Program and a Canadian Institutes of Health Research (CIHR) Fellowship (Grant #: 472286). LF is supported through the University of Manitoba—Biomedical Engineering (BME) Fellowship Grant, Research Manitoba—Health Sciences PhD Studentship, NSERC (ALLRP-576386-22) and the University of Manitoba Graduate Enhancement of Tri-Agency Stipend (GETS) program. EPT acknowledges funding support from Strategic Research Area Neuroscience (StratNeuro, Karolinska Institutet), The Erling-Persson Family Foundation and Region Stockholm Clinical Research Appointment (ALF Klinisk Forskare, FoUI-955376). RR acknowledges funding support from Svenska Kulturfonden, Medicinska Understödsföreningen Liv & Hälsa and Finska Läkaresällskapet.

Conflicts of Interest

The authors declare no conflict of interest.

References

  1. Maas, A.I.R.; Marmarou, A.; Murray, G.D.; Teasdale, S.G.M.; Steyerberg, E.W. Prognosis and Clinical Trial Design in Traumatic Brain Injury: The IMPACT Study. J. Neurotrauma 2007, 24, 232–238. [Google Scholar] [CrossRef]
  2. Maas, A.I.; Stocchetti, N.; Bullock, R. Moderate and Severe Traumatic Brain Injury in Adults. Lancet Neurol. 2008, 7, 728–741. [Google Scholar] [CrossRef]
  3. Carney, N.; Totten, A.M.; O’Reilly, C.; Ullman, J.S.; Hawryluk, G.W.J.; Bell, M.J.; Bratton, S.L.; Chesnut, R.; Harris, O.A.; Kissoon, N.; et al. Guidelines for the Management of Severe Traumatic Brain Injury, Fourth Edition. Neurosurgery 2017, 80, 6–15. [Google Scholar] [CrossRef] [PubMed]
  4. Chesnut, R.; Aguilera, S.; Buki, A.; Bulger, E.; Citerio, G.; Cooper, D.J.; Arrastia, R.D.; Diringer, M.; Figaji, A.; Gao, G.; et al. A Management Algorithm for Adult Patients with Both Brain Oxygen and Intracranial Pressure Monitoring: The Seattle International Severe Traumatic Brain Injury Consensus Conference (SIBICC). Intensive Care Med. 2020, 46, 919–929. [Google Scholar] [CrossRef] [PubMed]
  5. Donnelly, J.; Czosnyka, M.; Adams, H.; Cardim, D.; Kolias, A.G.; Zeiler, F.A.; Lavinio, A.; Aries, M.; Robba, C.; Smielewski, P.; et al. Twenty-Five Years of Intracranial Pressure Monitoring After Severe Traumatic Brain Injury: A Retrospective, Single-Center Analysis. Neurosurgery 2019, 85, E75–E82. [Google Scholar] [CrossRef] [PubMed]
  6. Le Roux, P.; Menon, D.K.; Citerio, G.; Vespa, P.; Bader, M.K.; Brophy, G.M.; Diringer, M.N.; Stocchetti, N.; Videtta, W.; Armonda, R.; et al. Consensus Summary Statement of the International Multidisciplinary Consensus Conference on Multimodality Monitoring in Neurocritical Care: A Statement for Healthcare Professionals from the Neurocritical Care Society and the European Society of Intensive Care Medicine. Neurocrit. Care 2014, 21, 1–26. [Google Scholar] [CrossRef]
  7. Maas, A.I.R.; Menon, D.K.; Adelson, P.D.; Andelic, N.; Bell, M.J.; Belli, A.; Bragge, P.; Brazinova, A.; Büki, A.; Chesnut, R.M.; et al. Traumatic Brain Injury: Integrated Approaches to Improve Prevention, Clinical Care, and Research. Lancet Neurol. 2017, 16, 987–1048. [Google Scholar] [CrossRef]
  8. Steyerberg, E.W.; Wiegers, E.; Sewalt, C.; Buki, A.; Citerio, G.; De Keyser, V.; Ercole, A.; Kunzmann, K.; Lanyon, L.; Lecky, F.; et al. Case-Mix, Care Pathways, and Outcomes in Patients with Traumatic Brain Injury in CENTER-TBI: A European Prospective, Multicentre, Longitudinal, Cohort Study. Lancet Neurol. 2019, 18, 923–934. [Google Scholar] [CrossRef]
  9. Maas, A.I.R.; Menon, D.K.; Manley, G.T.; Abrams, M.; Åkerlund, C.; Andelic, N.; Aries, M.; Bashford, T.; Bell, M.J.; Bodien, Y.G.; et al. Traumatic Brain Injury: Progress and Challenges in Prevention, Clinical Care, and Research. Lancet Neurol. 2022, 21, 1004–1060. [Google Scholar] [CrossRef]
  10. ACTRN12619001328167 The BONANZA Trial—A Randomised Controlled Trial That Is Testing Whether a Management Strategy Guided by Early Brain Tissue Oxygen Monitoring in Patients in with Severe Traumatic Brain Injury Improves Long Term Neurological and Functional Outcomes. 2019. Available online: https://trialsearch.who.int/Trial2.aspx?TrialID=ACTRN12619001328167 (accessed on 29 June 2023).
  11. Payen, J.-F.; Richard, M.; Francony, G.; Audibert, G.; Barbier, E.L.; Bruder, N.; Dahyot-Fizelier, C.; Geeraerts, T.; Gergele, L.; Puybasset, L.; et al. Comparison of Strategies for Monitoring and Treating Patients at the Early Phase of Severe Traumatic Brain Injury: The Multicentre Randomised Controlled OXY-TC Trial Study Protocol. BMJ Open 2020, 10, e040550. [Google Scholar] [CrossRef]
  12. Bernard, F.; Barsan, W.; Diaz-Arrastia, R.; Merck, L.H.; Yeatts, S.; Shutter, L.A. Brain Oxygen Optimization in Severe Traumatic Brain Injury (BOOST-3): A Multicentre, Randomised, Blinded-Endpoint, Comparative Effectiveness Study of Brain Tissue Oxygen and Intracranial Pressure Monitoring versus Intracranial Pressure Alone. BMJ Open 2022, 12, e060188. [Google Scholar] [CrossRef] [PubMed]
  13. Stewart, C.; Haitsma, I.; Zador, Z.; Hemphill, J.C.; Morabito, D.; Manley, G.; Rosenthal, G. The New Licox Combined Brain Tissue Oxygen and Brain Temperature Monitor: Assessment of in Vitro Accuracy and Clinical Experience in Severe Traumatic Brain Injury. Neurosurgery 2008, 63, 1159–1164. [Google Scholar] [CrossRef] [PubMed]
  14. Kirkpatrick, P.J.; Smielewski, P.; Czosnyka, M.; Menon, D.K.; Pickard, J.D. Near-Infrared Spectroscopy Use in Patients with Head Injury. J. Neurosurg. 1995, 83, 963–970. [Google Scholar] [CrossRef] [PubMed]
  15. Holzschuh, M.; Woertgen, C.; Metz, C.; Brawanski, A. Dynamic Changes of Cerebral Oxygenation Measured by Brain Tissue Oxygen Pressure and near Infrared Spectroscopy. Neurol. Res. 1997, 19, 246–248. [Google Scholar] [CrossRef]
  16. Brawanski, A.; Faltermeier, R.; Rothoerl, R.D.; Woertgen, C. Comparison of Near-Infrared Spectroscopy and Tissue p(O2) Time Series in Patients after Severe Head Injury and Aneurysmal Subarachnoid Hemorrhage. J. Cereb. Blood Flow. Metab. 2002, 22, 605–611. [Google Scholar] [CrossRef]
  17. Rothoerl, R.D.; Faltermeier, R.; Burger, R.; Woertgen, C.; Brawanski, A. Dynamic Correlation between Tissue PO2 and near Infrared Spectroscopy. Acta Neurochir. Suppl. 2002, 81, 311–313. [Google Scholar] [CrossRef]
  18. McLeod, A.D.; Igielman, F.; Elwell, C.; Cope, M.; Smith, M. Measuring Cerebral Oxygenation during Normobaric Hyperoxia: A Comparison of Tissue Microprobes, near-Infrared Spectroscopy, and Jugular Venous Oximetry in Head Injury. Anesth. Analg. 2003, 97, 851–856. [Google Scholar] [CrossRef]
  19. Leal-Noval, S.R.; Cayuela, A.; Arellano-Orden, V.; Marín-Caballos, A.; Padilla, V.; Ferrándiz-Millón, C.; Corcia, Y.; García-Alfaro, C.; Amaya-Villar, R.; Murillo-Cabezas, F. Invasive and Noninvasive Assessment of Cerebral Oxygenation in Patients with Severe Traumatic Brain Injury. Intensive Care Med. 2010, 36, 1309–1317. [Google Scholar] [CrossRef]
  20. Büchner, K.; Meixensberger, J.; Dings, J.; Roosen, K. Near-Infrared Spectroscopy—Not Useful to Monitor Cerebral Oxygenation after Severe Brain Injury. Zentralblatt Neurochir. 2000, 61, 69–73. [Google Scholar] [CrossRef]
  21. Esnault, P.; Boret, H.; Montcriol, A.; Carre, E.; Prunet, B.; Bordes, J.; Simon, P.; Joubert, C.; Dagain, A.; Kaiser, E.; et al. Assessment of Cerebral Oxygenation in Neurocritical Care Patients: Comparison of a New Four Wavelengths Forehead Regional Saturation in Oxygen Sensor (EQUANOX®) with Brain Tissue Oxygenation. A Prospective Observational Study. Minerva Anestesiol. 2015, 81, 876–884. [Google Scholar]
  22. de Courson, H.; Proust-Lima, C.; Tuaz, E.; Georges, D.; Verchère, E.; Biais, M. Relationship Between Brain Tissue Oxygen and Near-Infrared Spectroscopy in Patients with Nontraumatic Subarachnoid Hemorrhage. Neurocrit. Care 2022, 37, 620–628. [Google Scholar] [CrossRef] [PubMed]
  23. Howells, T.; Johnson, U.; McKelvey, T.; Enblad, P. An Optimal Frequency Range for Assessing the Pressure Reactivity Index in Patients with Traumatic Brain Injury. J. Clin. Monit. Comput. 2015, 29, 97–105. [Google Scholar] [CrossRef] [PubMed]
  24. Thelin, E.P.; Raj, R.; Bellander, B.-M.; Nelson, D.; Piippo-Karjalainen, A.; Siironen, J.; Tanskanen, P.; Hawryluk, G.; Hasen, M.; Unger, B.; et al. Comparison of High versus Low Frequency Cerebral Physiology for Cerebrovascular Reactivity Assessment in Traumatic Brain Injury: A Multi-Center Pilot Study. J. Clin. Monit. Comput. 2020, 34, 971–994. [Google Scholar] [CrossRef] [PubMed]
  25. Mayhew, J.E.; Askew, S.; Zheng, Y.; Porrill, J.; Westby, G.W.; Redgrave, P.; Rector, D.M.; Harper, R.M. Cerebral Vasomotion: A 0.1-Hz Oscillation in Reflected Light Imaging of Neural Activity. Neuroimage 1996, 4, 183–193. [Google Scholar] [CrossRef] [PubMed]
  26. Lütkepohl, H. New Introduction to Multiple Time Series Analysis; Springer: New York, NY, USA; Berlin, Germany, 2005; ISBN 978-3-540-40172-8. [Google Scholar]
  27. Chatfield, C.; Xing, H. The Analysis of Time Series: An Introduction with R, 7th ed.; Chapman & Hall/CRC texts in statistical science series; CRC Press: Boca Raton, FL, USA; Taylor and Francis Group: Boca Raton, FL, USA, 2019; ISBN 978-1-351-25944-6. [Google Scholar]
  28. Mills, T.C. Applied Time Series Analysis: A Practical Guide to Modeling and Forecasting; Academic Press: London, UK, 2019; ISBN 978-0-12-813117-6. [Google Scholar]
  29. Percival, D.B.; Walden, A.T. Spectral Analysis for Univariate Time Series, 1st ed.; Cambridge University Press: Cambridge, UK, 2020; ISBN 978-1-139-23572-3. [Google Scholar]
  30. Klein, S.P.; Fieuws, S.; Meyfroidt, G.; Depreitere, B. Effects of Norepinephrine, Propofol, and Hemoglobin Concentration on Dynamic Measurements of Cerebrovascular Reactivity in Acute Brain Injury. J. Neurotrauma 2021, 38, 506–512. [Google Scholar] [CrossRef]
  31. Ponce, L.L.; Pillai, S.; Cruz, J.; Li, X.; Julia, H.; Gopinath, S.; Robertson, C.S. Position of Probe Determines Prognostic Information of Brain Tissue PO2 in Severe Traumatic Brain Injury. Neurosurgery 2012, 70, 1492–1502. [Google Scholar] [CrossRef]
  32. Gomez, A.; Sainbhi, A.S.; Froese, L.; Batson, C.; Alizadeh, A.; Mendelson, A.A.; Zeiler, F.A. Near Infrared Spectroscopy for High-Temporal Resolution Cerebral Physiome Characterization in TBI: A Narrative Review of Techniques, Applications, and Future Directions. Front. Pharmacol. 2021, 12, 719501. [Google Scholar] [CrossRef]
  33. Fraser, C.D.; Brady, K.M.; Rhee, C.J.; Easley, R.B.; Kibler, K.; Smielewski, P.; Czosnyka, M.; Kaczka, D.W.; Andropoulos, D.B.; Rusin, C. The Frequency Response of Cerebral Autoregulation. J Appl Physiol 2013, 115, 52–56. [Google Scholar] [CrossRef]
  34. Zeiler, F.A.; Smielewski, P.; Stevens, A.; Czosnyka, M.; Menon, D.K.; Ercole, A. Non-Invasive Pressure Reactivity Index Using Doppler Systolic Flow Parameters: A Pilot Analysis. J. Neurotrauma 2019, 36, 713–720. [Google Scholar] [CrossRef]
  35. Budohoski, K.P.; Zweifel, C.; Kasprowicz, M.; Sorrentino, E.; Diedler, J.; Brady, K.M.; Smielewski, P.; Menon, D.K.; Pickard, J.D.; Kirkpatrick, P.J.; et al. What Comes First? The Dynamics of Cerebral Oxygenation and Blood Flow in Response to Changes in Arterial Pressure and Intracranial Pressure after Head Injury. Br. J. Anaesth. 2012, 108, 89–99. [Google Scholar] [CrossRef]
  36. Zeiler, F.A.; Donnelly, J.; Menon, D.K.; Smielewski, P.; Zweifel, C.; Brady, K.; Czosnyka, M. Continuous Autoregulatory Indices Derived from Multi-Modal Monitoring: Each One Is Not Like the Other. J. Neurotrauma 2017, 34, 3070–3080. [Google Scholar] [CrossRef]
  37. Lee, J.K.; Kibler, K.K.; Benni, P.B.; Easley, R.B.; Czosnyka, M.; Smielewski, P.; Koehler, R.C.; Shaffner, D.H.; Brady, K.M. Cerebrovascular Reactivity Measured by Near-Infrared Spectroscopy. Stroke 2009, 40, 1820–1826. [Google Scholar] [CrossRef]
  38. Steiner, L.A.; Pfister, D.; Strebel, S.P.; Radolovich, D.; Smielewski, P.; Czosnyka, M. Near-Infrared Spectroscopy Can Monitor Dynamic Cerebral Autoregulation in Adults. Neurocrit. Care 2009, 10, 122–128. [Google Scholar] [CrossRef] [PubMed]
  39. Smielewski, P.; Czosnyka, M.; Zweifel, C.; Brady, K.; Hogue, C.; Steiner, L.; Hutchinson, P.; Mennon, D.; Pickard, J. Multicentre Experience of Using ICM+ for Investigations of Cerebrovascular Dynamics with Near-Infrared Spectroscopy. Crit. Care 2010, 14, P348. [Google Scholar] [CrossRef]
  40. Zweifel, C.; Castellani, G.; Czosnyka, M.; Helmy, A.; Manktelow, A.; Carrera, E.; Brady, K.M.; Hutchinson, P.J.A.; Menon, D.K.; Pickard, J.D.; et al. Noninvasive Monitoring of Cerebrovascular Reactivity with near Infrared Spectroscopy in Head-Injured Patients. J. Neurotrauma 2010, 27, 1951–1958. [Google Scholar] [CrossRef] [PubMed]
Figure 1. An example autocorrelative function (ACF) plot of PbtO2 can be seen in Panel (A), indicating non-stationarity, as correlations do not reach zero. Conversely, in Panel (B), the ACF plot of ΔPbtO2 for the same subject shows a rapid decline in the significant lags, indicating stationarity. The dashed blue line represents the significance levels which were set to a correlation level of +/−(2/N1/2), where N is the number of samples. ACF = Autocorrelative Function, ΔPbtO2 = Change in brain tissue oxygen tension, PbtO2 = Brain tissue oxygen tension.
Bioengineering 10 01124 g001
Figure 2. In Panel (A), the plot of the cross-correlative function (CCF) of ΔPbtO2 vs. ΔrSO2 for the minute-by-minute data of the cohort can be seen, with the most significant lag occurring at lag 1 (i.e., 1 min). In Panel (B), the plot of the cross-correlative function of ΔPbtO2 vs. ΔrSO2 for the 10-seconds-by-10-seconds data for the data of the cohort can be seen, with the most significant lag occurring at lag 6 (i.e., at 1 min). The dashed blue line represents the significance levels, which were set to a correlation level of +/−(2/N1/2), where N is the number of samples. CCF = Cross-correlative function, ΔPbtO2 = Change in brain tissue oxygen tension, ΔrSO2 = Change in region cerebral oxygen saturation.
Bioengineering 10 01124 g002
Figure 3. A plot of Akaike information criterion (AIC) versus autoregressive order of the multi-variate vector autoregressive (VAR) model. There is limited improvement in AIC beyond an order of 6.
Bioengineering 10 01124 g003
Figure 4. Panel (A) shows the modeled resulting response in change in regional cerebral oxygen saturation (ΔrSO2) to an orthogonal impulse in change in arterial blood pressure (ΔABP); black solid line. Panel (B) shows the modeled resulting response in change in regional cerebral oxygen saturation (ΔPbtO2) to an orthogonal impulse in change in arterial blood pressure (ΔABP); black solid line. The 95% confidence intervals are indicated by the red dashed line. Note that in both plots there is an initial rise followed by subsequent decline; however, this is prolonged in the response of ΔPbtO2.
Bioengineering 10 01124 g004
Figure 5. In Panel (A), the autocorrelative function (ACF) plot for the residuals of the linear mixed-effects (LME) model (ΔPbtO2~ΔrSO2Lag1) with random slope and intercept are seen. In Panel (B), the partial autocorrelative function (PACF) plot is seen. In both plots, a significant correlation is seen. This is in keeping with a model that has not accounted for the autocorrelative structure of its response variable. The dashed blue line represents the significance levels which were set to a correlation level of +/−(2/N1/2), where N is the number of samples. CCF = Cross-correlative function, ΔPbtO2 = Change in brain tissue oxygen tension, ΔrSO2Lag1 = The one-minute lagged change in regional cerebral oxygen saturation.
Bioengineering 10 01124 g005
Figure 6. An example from a single subject of the Bland-Altman plot comparing actual and predicted values of ΔPbtO2 from the linear ΔPbtO2~ΔRSO2Lag1 model with autocorrelative structure accounted for. Generally poor agreement can be seen. PbtO2 = Brain tissue oxygen tension, ΔPbtO2 = Change in brain tissue oxygen tension, and ΔrSO2Lag1 = The one-minute lagged change in regional cerebral oxygen saturation.
Bioengineering 10 01124 g006
Table 1. Patient demographics for the cohort.
Demographic ParameterMedian or Number of Subjects
Age (IQR)41 (34.8–49.3)
GenderMale subjects (%)15 (75)
Female subjects (%)4 (20)
N/A (%)1 (5)
Admission GCSEye (IQR)1 (1–1)
Verbal (IQR)1 (1–1)
Motor (IQR)2 (1–4)
Total (IQR)6 (3–7)
Admission PupilsBilaterally Reactive (%)13 (65)
Unilaterally Reactive (%)3 (15)
Bilaterally Unreactive (%)3 (15)
N/A (%)1 (5)
Marshall CT ClassificationI (%)0 (0)
II (%)5 (25)
III (%)8 (40)
IV (%)0 (0)
V (%)4 (20)
VI (%)0 (0)
N/A, n (%)3 (15)
Follow-up GOS1 (%)4 (20)
2 (%)0 (0)
3 (%)1 (5)
4 (%)8 (40)
5 (%)3 (15)
N/A, n (%)4 (20)
ABP (IQR)87.0 mmHg (78.6–96.70)
ICP (IQR)11.0 mmHg (6.7–15.0)
PbtO2 (IQR)24.2 mmHg (17.3–32.3)
rSO2 (IQR)69.6% (63.6–76.8)
PaO2 (IQR) *108 mmHg (88.5–141)
PaCO2 (IQR) *38 mmHg (36–41)
ABP = Arterial Blood Pressure, CT = Computerized Tomography, GCS = Glasgow Coma Scale, GOS = Glasgow Outcome Scale, ICP = Intracranial Pressure, IQR = Interquartile range, N/A = Not available, PbtO2 = Brain Tissues Oxygen Tension, and rSO2 = Regional Cerebral Oxygen Saturation. * PaO2 and PaCO2 values were only available for 10 patients.
Table 2. Summary of the linear ΔPbtO2~ΔrSO2Lag1 models with autocorrelative structure accounted for.
Subject IDSide of rSO2Model Autoregressive OrderModel Moving Average OrderCoefficient of ΔrSO2Lag1 as a Regressor (Standard Error)p-Value of ΔrSO2Lag1 as a RegressorPearson Correlation Coefficient of Actual vs. Predicted ΔPbtO2
(95% CI)
1Right03−0.012 (0.007)0.0890.11 (0.05–0.17)
2Right510.392 (0.017)<0.0010.28 (0.25–0.30)
3Right600.080 (0.052)0.1250.08 (0.02–0.13)
4Right220.246 (0.034)<0.0010.12 (0.10–0.15)
5Right330.242 (0.019)<0.0010.19 (0.16–0.21)
6Right121.065 (0.081)<0.0010.45 (0.40–0.49)
7Right51−0.101 (0.015)<0.0010.04 (0.01–0.07)
8Right43−0.059 (0.031)0.0550.10 (0.05–0.16)
9Right210.131 (0.031)<0.0010.10 (0.7–0.14)
10Right32−0.059 (0.018)0.0010.09 (0.05–0.12)
11Right02−0.112 (0.032)<0.0010.03 (−0.03–0.09)
12Right431.072 (0.019)<0.0010.57 (0.56–0.59)
13Right130.003 (0.002)0.1590.14 (0.12–0.15)
14Left140.555 (0.031)<0.0010.47 (0.43–0.50)
15Right220.055 (0.015)<0.0010.13 (0.11–0.17)
16Right320.168 (0.017)<0.0010.13 (0.12–0.16)
17Right220.051 (0.013)<0.0010.08 (0.06–0.10)
18Right310.134 (0.001)<0.0010.18 (0.16–0.20)
19Right130.760 (0.028)<0.0010.40 (0.38–0.41)
20Right220.353 (0.020)<0.0010.27 (0.25–0.29)
CI = confidence interval, ΔPbtO2 = change in brain tissue oxygen tension, rSO2 = regional cerebral oxygen saturation, and ΔrSO2Lag1 = the one-minute lagged change in regional cerebral oxygen saturation.
Disclaimer/Publisher’s Note: The statements, opinions and data contained in all publications are solely those of the individual author(s) and contributor(s) and not of MDPI and/or the editor(s). MDPI and/or the editor(s) disclaim responsibility for any injury to people or property resulting from any ideas, methods, instructions or products referred to in the content.

