1. Introduction
Cystic lesions of the sellar-suprasellar region are a group of pathological changes in the pituitary glands or their adjacent structures. They could be primary lesions, including Rathke’s cleft cysts, cystic craniopharyngiomas, abscesses, arachnoid cysts, etc., or secondary changes from substantial lesions, including cystic pituitary adenomas (cysticA) and pituitary apoplexy [
1]. In a random autopsy study involving 1000 cases, 113 cases of Rathke’s cleft cyst were found, with 37 cases with a diameter of at least 2 mm, which is higher than pituitary adenomas (31 cases) [
2].
Although Transsphenoidal surgery is the primary surgical approach for treating sellar lesions, different surgical strategies are required for various sellar lesions. In addition, the optimistic therapeutic pathways remain controversial [
3,
4] and the pathological type is the basis of clinical decision-making. For cystic pituitary adenomas, total resection is the primary surgical approach. However, for Rathke’s cleft cysts and arachnoid cysts, it is recommended to perform fenestration and partial resection. In the case of cystic craniopharyngiomas, surgery should involve the removal of the cystic wall structure to prevent recurrence [
4,
5,
6].
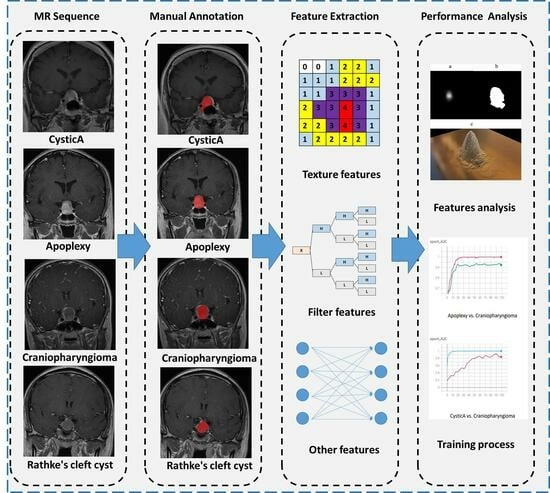
The pituitary gland, as an endocrine organ in the human body, can be differentially diagnosed for sellar lesions through blood hormone screening. However, in the case of cystic lesions in the sellar region, they typically present as cystic masses without causing abnormal hormone secretion levels, which increases the difficulty of making a differential diagnosis. As shown in
Figure 1, different cystic lesions in the sellar region performed similarly in the MR image. Nonetheless, this requires clinical physicians to have sufficient experience, and currently, achieving an accurate preoperative diagnosis remains challenging.
Current research on sellar cystic lesions focuses more on the qualitative description of MRI, which is also the most widely used method in clinical practice. Different components (such as differences in protein percentage) in lesions show different signal strengths [
7]. These known imaging features are the basis for the feasibility of automatic identification through quantitative analysis.
Radiomics, a recently emerging technique, extracts high-throughput features from digital imaging to quantitatively describe lesion characteristics, which builds a bridge between medical imaging and tumor phenotypes [
8,
9]. With the help of machine learning algorithms and artificial neural networks, investigating the intrinsic characteristics of high-throughput image features is easier and more systematic. Previous studies focused on malignant central nervous tumors with radiomic approaches, which showed charming performances on molecular subtype distinguishment [
10,
11]. Previous studies have investigated the use of radiomics in pituitary diseases, while few studies have focused specifically on cystic sellar lesions [
12,
13].
The present study aims to differentiate between the four most common types of cystic sellar lesions, namely Rathke’s cleft cysts, cystic craniopharyngiomas, cystic pituitary adenomas, and pituitary apoplexy, using radiomics and machine learning. The main contributions are as follows:
A large number of patients diagnosed with cystic sellar lesions were enrolled to fill the gap in the existing literature and provide a non-invasive method for accurately differentiating between these lesions.
Paired imaging differentiations were performed on four subtypes, and the model achieved an average AUC value of 0.7685.
The model achieved an average accuracy of 0.7532, which outperformed the traditional clinical knowledge-based model by approximately 8%.
3. Materials and Methods
3.1. Patients
This study retrospectively included pathologically and intraoperatively confirmed patients with cystic sellar lesions diagnosed at Peking Union Medical College Hospital (PUMCH) from June 2005 to November 2020. The included pathology types were Rathke’s cleft cysts, cystic craniopharyngiomas, cystic pituitary adenomas, and pituitary apoplexy. The criteria included the following: (1) adults with intraoperatively and histopathologically confirmed Rathke’s cleft cysts, cystic craniopharyngiomas, cystic pituitary adenomas, or pituitary apoplexy; (2) preoperative contrast-enhanced T1 (T1-CE)-weighted and T2-weighted MRI; This study design was approved by the Institutional Review Board, and all patients provided informed consent. Finally, 390 patients met the inclusion criteria.
3.2. MRI Data Acquisition and Preprocessing
Most preoperative MRI examinations were performed on a 3.0-T MRI scanner (Discovery MR750, Chicago, IL, USA). A minority of patients were examined with a 1.5-T MRI scanner. T1-weighted images (gadolinium chelate, PUMCH standard half dose 0.05 mmol/kg; slice thickness 3–6 mm for 5–20 slices; 10 patients were scanned with 0.5–1.5 mm thickness for 16–75 slices; echo time, 7.264–17 ms; inversion time, 400–613 ms) and T2-weighted images (slice thickness 3.5–6 mm; 7–21 slices; repetition time, 3437–4860 ms; echo time, 79.92–107.648 ms) were obtained. All MR images have a minimum resolution of at least 256 × 256. The original DICOM data were converted to NIfTI format for later processing and anonymity.
3.3. Image Segmentation
T2-weighted images were coregistered to T1-CE images for a clear delineation of the tumor boundary as well as the elimination of head movement with ANTs (v2.3.5-30, compiled under Ubuntu 20.04.2 LTS on amd64 architecture) [
19]. The registration parameter was the default for rigid bodies. All registered images were checked manually.
The three-dimensional region of interest (ROI), which included the cysts’ wall and the cysts’ fluid, was automatically segmented initially with in-house software based on U-Net. Cystic pituitary lesions in T1 contrast-enhanced images were manually segmented to build a training set. The model was trained with PyTorch 1.6.0 (
https://pytorch.org/) and Python 3.8.8.
All of the automatic segmentations were manually corrected. They were manually delimitated by two neurosurgeons using the ITK-SNAP software (
http://www.itksnap.org/pmwiki/pmwiki.php) (accessed on 17 October 2023) [
20].
Figure 1 shows the segmentation sample. The ROI was then evaluated by senior neuroradiologists. If the difference between ROIs was ≤5% for the two neurosurgeons, the final ROIs were defined by the overlapping area of the initial ROIs; if the difference between ROIs was >5%, the neuroradiologist made the final decision.
3.4. Feature Extraction
The brightness of the T1-CE and T2-weighted images was normalized by centering the voxels at the mean value with standard deviation (SD) based on all gray values using the preset module of PyRadiomics (3.0.1,
http://www.radiomics.io/) [
21].
We extracted the radiomic features from both 3D images and the slices with maximum lesions with a 2D feature calculation. Considering the thickness of the slices, 3D feature extraction was finished after a resampling of 3mm. Therefore, the Laplace of Gaussian (LoG) filtering should have a sigma greater than 3.0. The resampling size of 2D images was 2mm. The sigma values for 3D images were 3.0 and 5.0, and the values for 2D images were 2.0, 3.0, 4.0, and 5.0.
Wavelet filtering (Coif 1) and LoG filtering were applied. A total of 1037 radiomics features were extracted from the ROIs of three-dimensional images [
21]. All radiomics features were scaled based on the SD of the training set to avoid fluctuation.
3.5. Feature Selection, Model Construction, and Validation
Radiomics features were selected by the least absolute shrinkage and selection operator (LASSO) in the training dataset with code constructed using Scikit-learn (v0.24.1,
http://scikit-learn.org) [
22].
The four types of cystic lesions were grouped in pairs. Four types of feature sets were investigated (with or without filtering and 2D or 3D). The machine learning algorithms were support vector machine (SVM), random forest, and AdaBoost (with a decision tree or SVM as its basis).
We used five-fold cross-validation for evaluation. The average area under the receiver operating characteristic curves (AUC) was assessed.
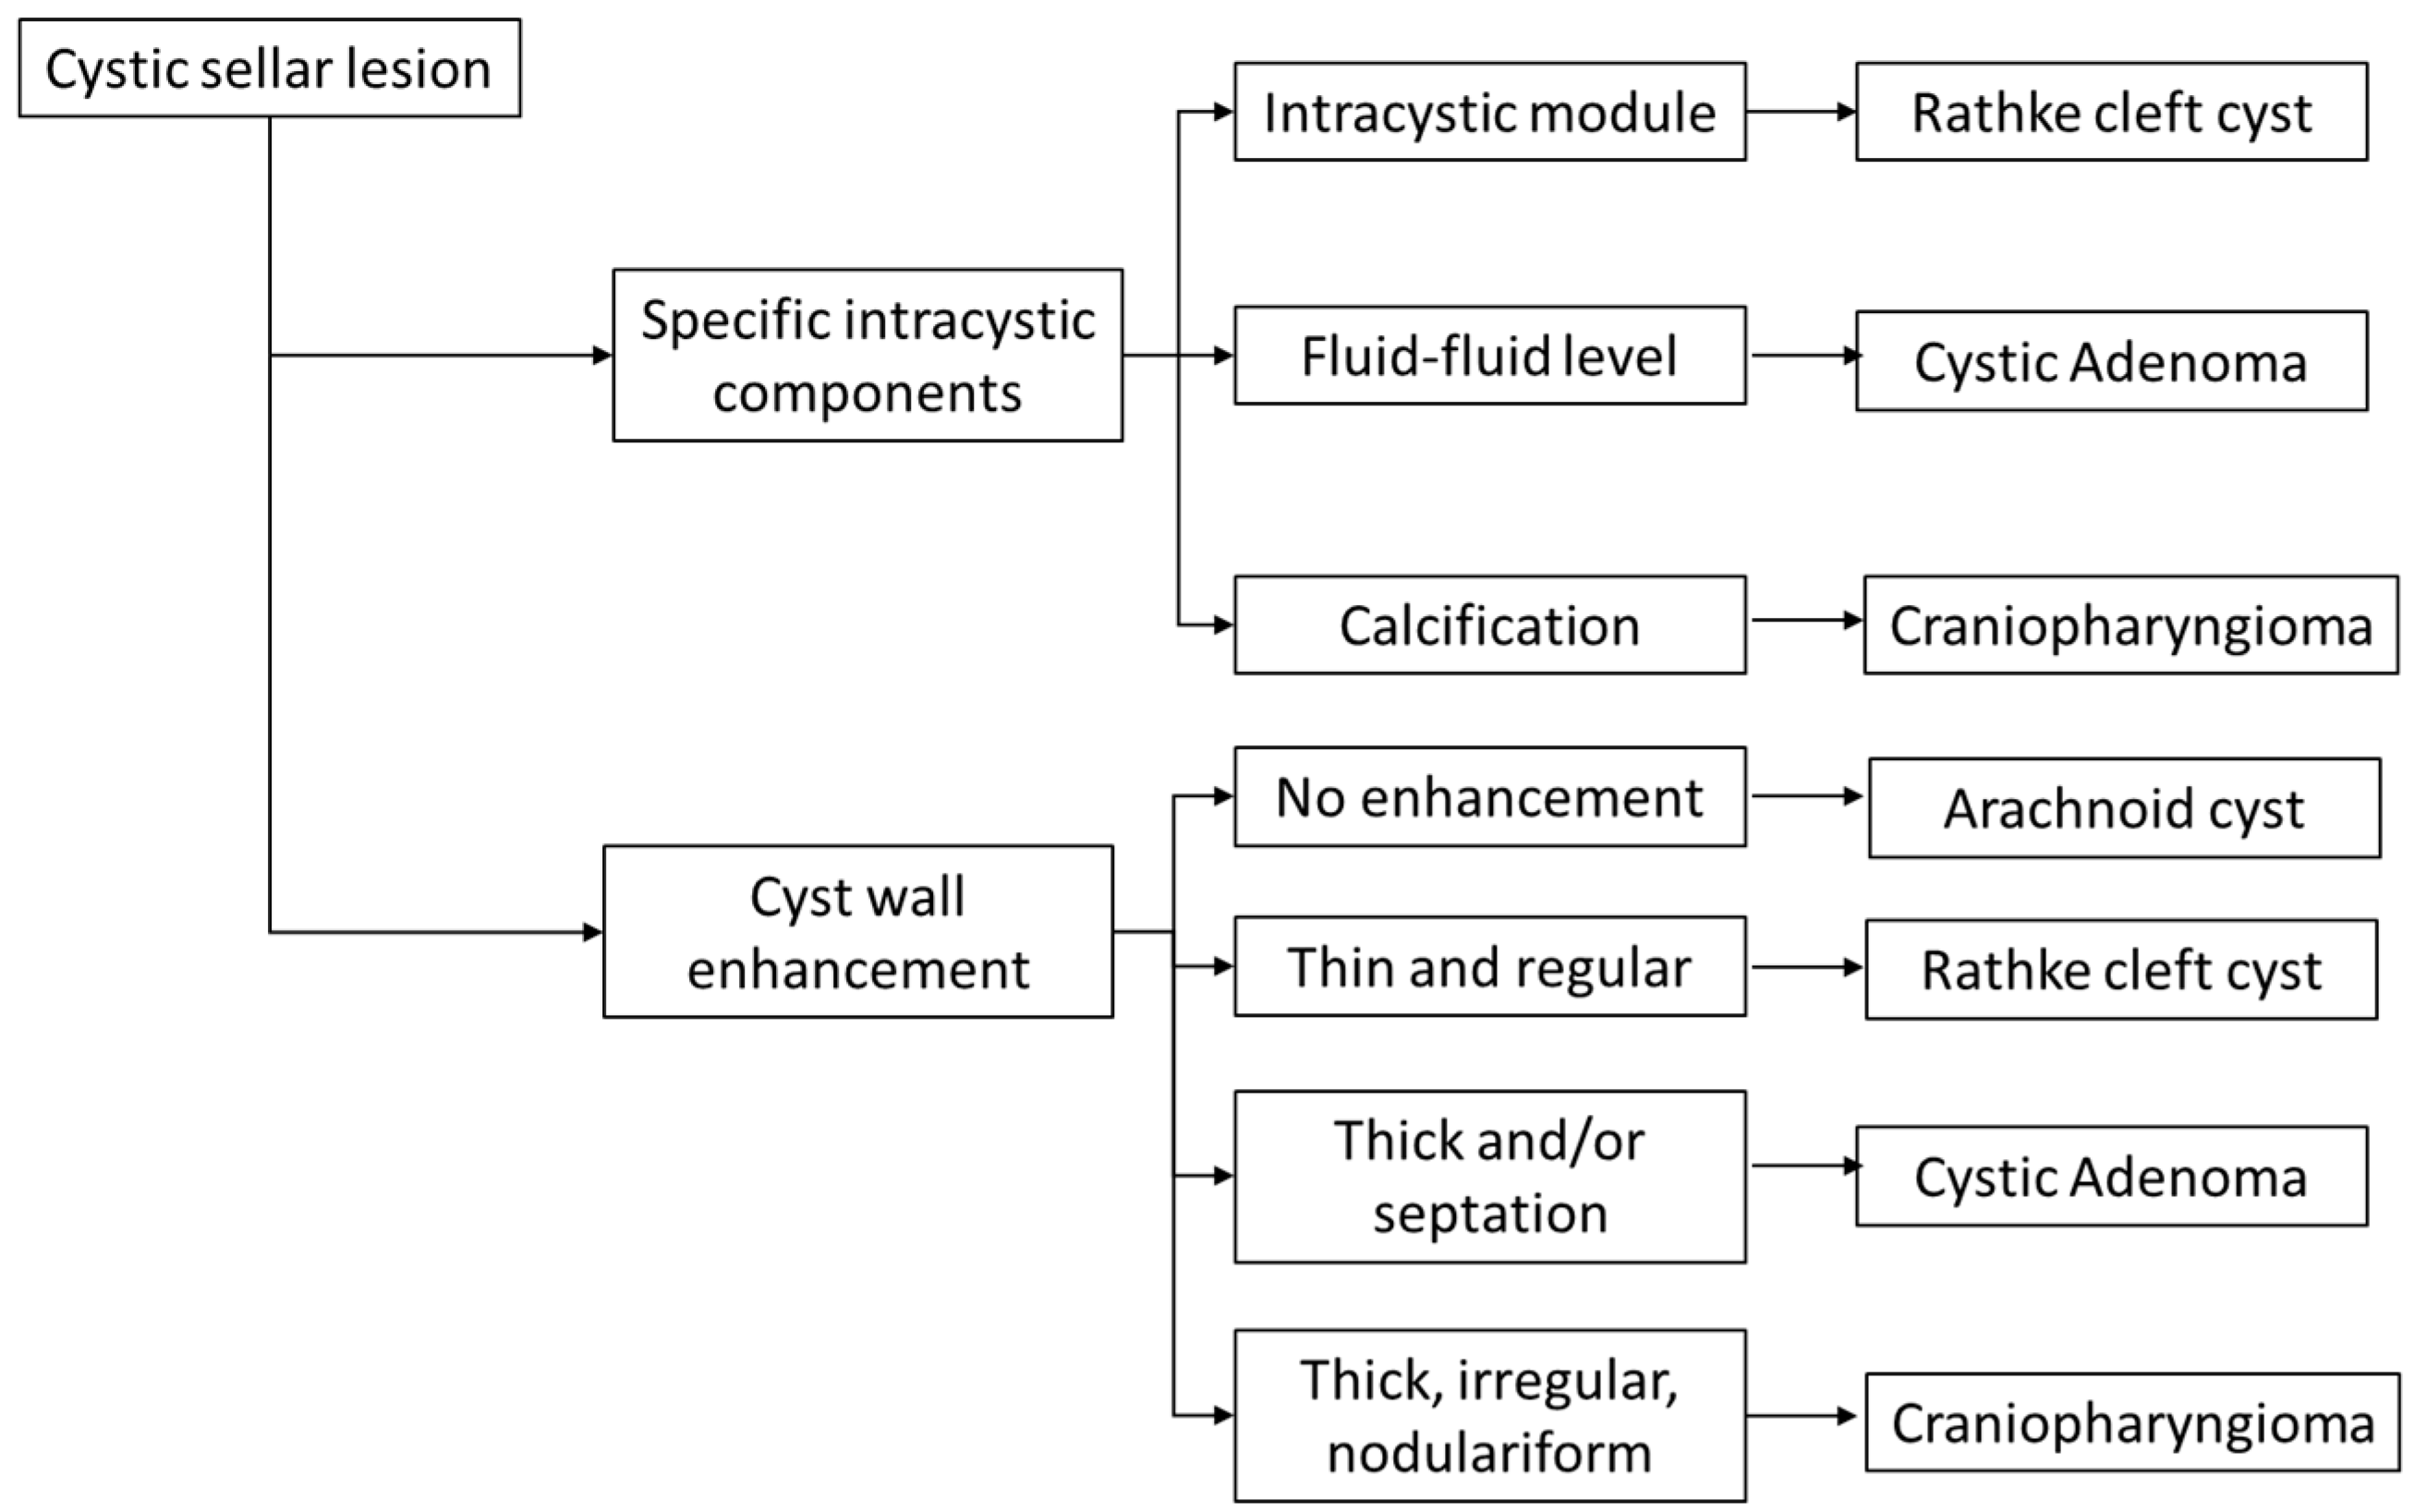
3.6. Establishment of Clinical Knowledge-Based Method
Because doctors with different clinical experiences may have variations in their judgments, we have simply designed this model as a multi-stage model to obtain a general diagnosis (
Figure 2). First, doctors were required to assess intracystic components. According to the recent study [
11], cysts with calcifications are classified as craniopharyngiomas, those with a high fluid level as cystic pituitary adenomas, and those with intracystic nodules as Rathke’s cleft cysts. Then, doctors were required to provide cyst wall enhancement features: absence of enhancement indicates arachnoid cysts; thin and regular enhancement suggests Rathke’s cleft cysts; thick-walled enhancement with septations suggests cystic pituitary adenomas; and thick, irregular, and nodulariform enhancement is indicative of craniopharyngiomas.
3.7. Statistical Analysis
5. Discussion
Among the various basic statistical machine learning algorithms, AUC values > 0.70 can be achieved in the identification of most lesions. Support vector machine-based models performed the best in each comparison group, whether they were used directly or integrated with AdaBoost or Bagging methods. Logistic regression was performed secondary to the support vector machine. It suggested that classical machine learning algorithms still performed stably and reliably. Decision tree-based algorithms performed relatively poorly. They are accompanied by the disadvantage of overfitting [
23]. This was responsible for their relatively poor performance in this study.
The preoperative diagnosis of cystic lesions in the sellar region is crucial for surgical planning. For arachnoid cysts and Rathke’s cleft cysts, sometimes only fenestration and partial resection are necessary. However, for pituitary adenomas and craniopharyngiomas, total resection is the primary surgical approach, aiming to achieve a high rate of complete removal to reduce tumor recurrence. Craniopharyngiomas, in comparison to pituitary adenomas, have a less fixed location but possess a distinct capsule structure that allows for complete excision along the capsule. The preoperative diagnostic accuracy in clinical practice is only 0.67, indicating ongoing challenges in the differential diagnosis of such conditions. This study compared clinical knowledge-based methods and found that the proposed machine learning model based on radiomics outperformed clinical doctors’ diagnostic criteria across all tasks. This suggests that the model can assist in clinical diagnosis to a certain extent and aid in formulating surgical plans.
In traditional machine learning models of each group, Rathke’s cleft cyst and cystic craniopharyngioma, cystic pituitary adenoma, and craniopharyngioma were relatively easy to identify by all algorithms. Rathke cleft cyst and cystic pituitary adenoma, pituitary apoplexy, and Rathke cleft cyst, pituitary apoplexy, and craniopharyngioma performed moderately. It is hard to distinguish pituitary apoplexy from cystic pituitary adenoma in any model. The average accuracy values of different models for various lesion combinations evaluated in leave-one-out validation (LOOV) were consistent with the model performance and effect ranking of five-fold cross-validation.
Among the comparison groups, it is very difficult to differentiate cystic pituitary adenoma from pituitary apoplexy, and the performances of all models were poor. Necrosis and cystic degeneration occur in 5–18% of pituitary tumors, a process often associated with apoplexy [
24,
25]. In studies of cystic fluid components in cystic pituitary adenomas, most cystic fluids have detectable levels of hemoglobin, and some cystic fluids have a high level of hormones [
26]. Secretory cystic degeneration and hemorrhagic cystic degeneration may coexist in cystic pituitary adenomas. In a study including 14 patients initially evaluated as having cystic pituitary adenomas, after careful verification, only 2 were finally confirmed to have cystic pituitary adenomas without hemorrhagic changes, and the remaining patients’ lesions had hemorrhagic components [
27]. This finding suggests that a large proportion of cystic pituitary adenomas may have hemorrhagic manifestations, which is also consistent with the diagnosis of pituitary apoplexy in pathology. Based on these previous studies and the difficulties in image identification in this study, we hypothesize that some cystic pituitary adenomas form gradually after apoplexy, and the other components may arise from the secretion of the cyst wall. Therefore, cystic pituitary adenomas and pituitary apoplexy were hard to distinguish from MRI.
Cystic craniopharyngioma and Rathke’s cleft cyst, cystic craniopharyngioma, and cystic pituitary adenoma performed well in most predictive models. These results suggest that there are clear differences in their imaging. Previous studies have described the image identification of craniopharyngioma in terms of volume, calcification, and shape [
28]. That is the basis for its outstanding differences in radiomic features. Generally, it is believed that the volume of the craniopharyngioma is important for identification. Although a considerable number of craniopharyngiomas in this study are larger in size than Rathke’s cleft cysts, their main volume distribution ranges are similar.
In this study, the traditional machine learning models construct four feature groups according to the dimension, with/without LoG processing or wavelet filtering. The performance of each group of models for discrimination is roughly similar, and the trend of the difficulty of discriminating different combinations of lesions is the same. This indicates that although the 3D features cover more layers and more information, the information provided by the 2D maximum layer is sufficient for radiomic identification.
Possible future research directions in this field include a more detailed description of lesions and the differentiation of pathological subtypes. If more molecular markers could be found in the future, their imaging manifestations are also expected to be further investigated. Recently, there have been many advances in digital image processing methods, such as attention mechanisms and capsule networks [
29,
30]. Because of the lagging of their applications in clinical medicine, these methods have not been fully utilized. If they can be properly used in image analysis of cystic lesions of the sellar region, it will hopefully unearth more information and make more accurate predictions.
6. Limitations
There are several limitations to this study. First, this study is a retrospective study rather than a prospective one. This could introduce various biases, including selection bias and confounding bias. For example, all included patients were required to undergo MRI scans at our hospital, while those with MRI scans conducted at external institutions were excluded from this study. As a result, the included population consisted primarily of newly diagnosed patients. Second, this study focused only on preoperative imaging features, without prognosis. Third, some rare but non-negligible pathological types were not covered in this study. Fourth, patients were collected from a single center, and an external dataset should be collected for future study and evaluation.


