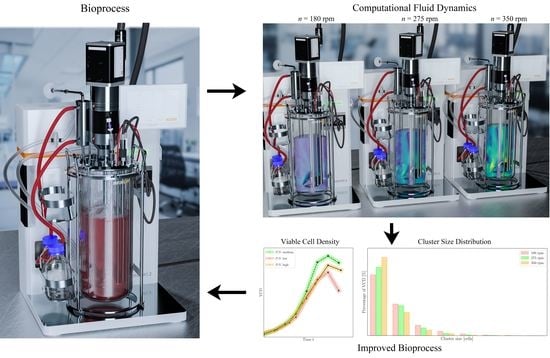
Improvement of HEK293 Cell Growth by Adapting Hydrodynamic Stress and Predicting Cell Aggregate Size Distribution
Abstract
1. Introduction
| Product Name | Application | Producer |
| Abecma® | CAR T therapy against multiple myeloma | Bristol-Myers Squibb a,b |
| Alprolix® | Factor IX replacement against haemophilia B | Swedish Orphan Biovitrum a/Sanofi b |
| Breyanzi® | CAR T therapy against blood cancer | Bristol-Myers Squibb a,b |
| Elocta®/ Eloctate® | Factor VIII–Fc fusion protein against haemophilia A | Swedish Orphan Biovitrum a/Sanofi b |
| Glybera® | Cell-based gene therapy against lipoprotein lipase deficiency | UniQure biopharma c |
| Kymriah® | CAR T therapy against lymphoblastic leukaemia and lymphoma | Novartis a,b |
| Luxturna® | Adeno-associated virus-based RPE65 gene therapy against Leber congenital amaurosis | Novartis a/Spark Therapeutics b |
| Nuwiq®/ Vihuma® | Recombinant anti-hemophilic factor VIII against haemophilia A | Octapharma a,b |
| Strimvelis® | Cell-based gene therapy against severe combined immunodeficiency due to adenosine deaminase deficiency | Orchard Therapeutics a |
| Trulicity® | Glucagon-like peptide-1 receptor linked to IgG against type 2 diabetes | Eli Lilly a,b |
| Vaxzevria® | Adenovirus-based spike protein vaccine against COVID-19 | AstraZeneca a |
| Yescarta® | CAR T therapy against large B-cell lymphoma | Kite Pharma a,b |
| Xigris® | Recombinant active protein C against sepsis | Eli Lilly c,d |
| Zalmoxis® | Retrovirus-based gene therapy against leukaemia | MolMed c |
| Zolgensma® | Adeno-associated vector housing the survival motor neuron against spinal muscular atrophy | Novartis a,b |
| Zynteglo® | Lentivirus-based gene therapy against -thalassemia | Bluebird bio c |
2. Materials and Methods
2.1. Computational Fluid Dynamics
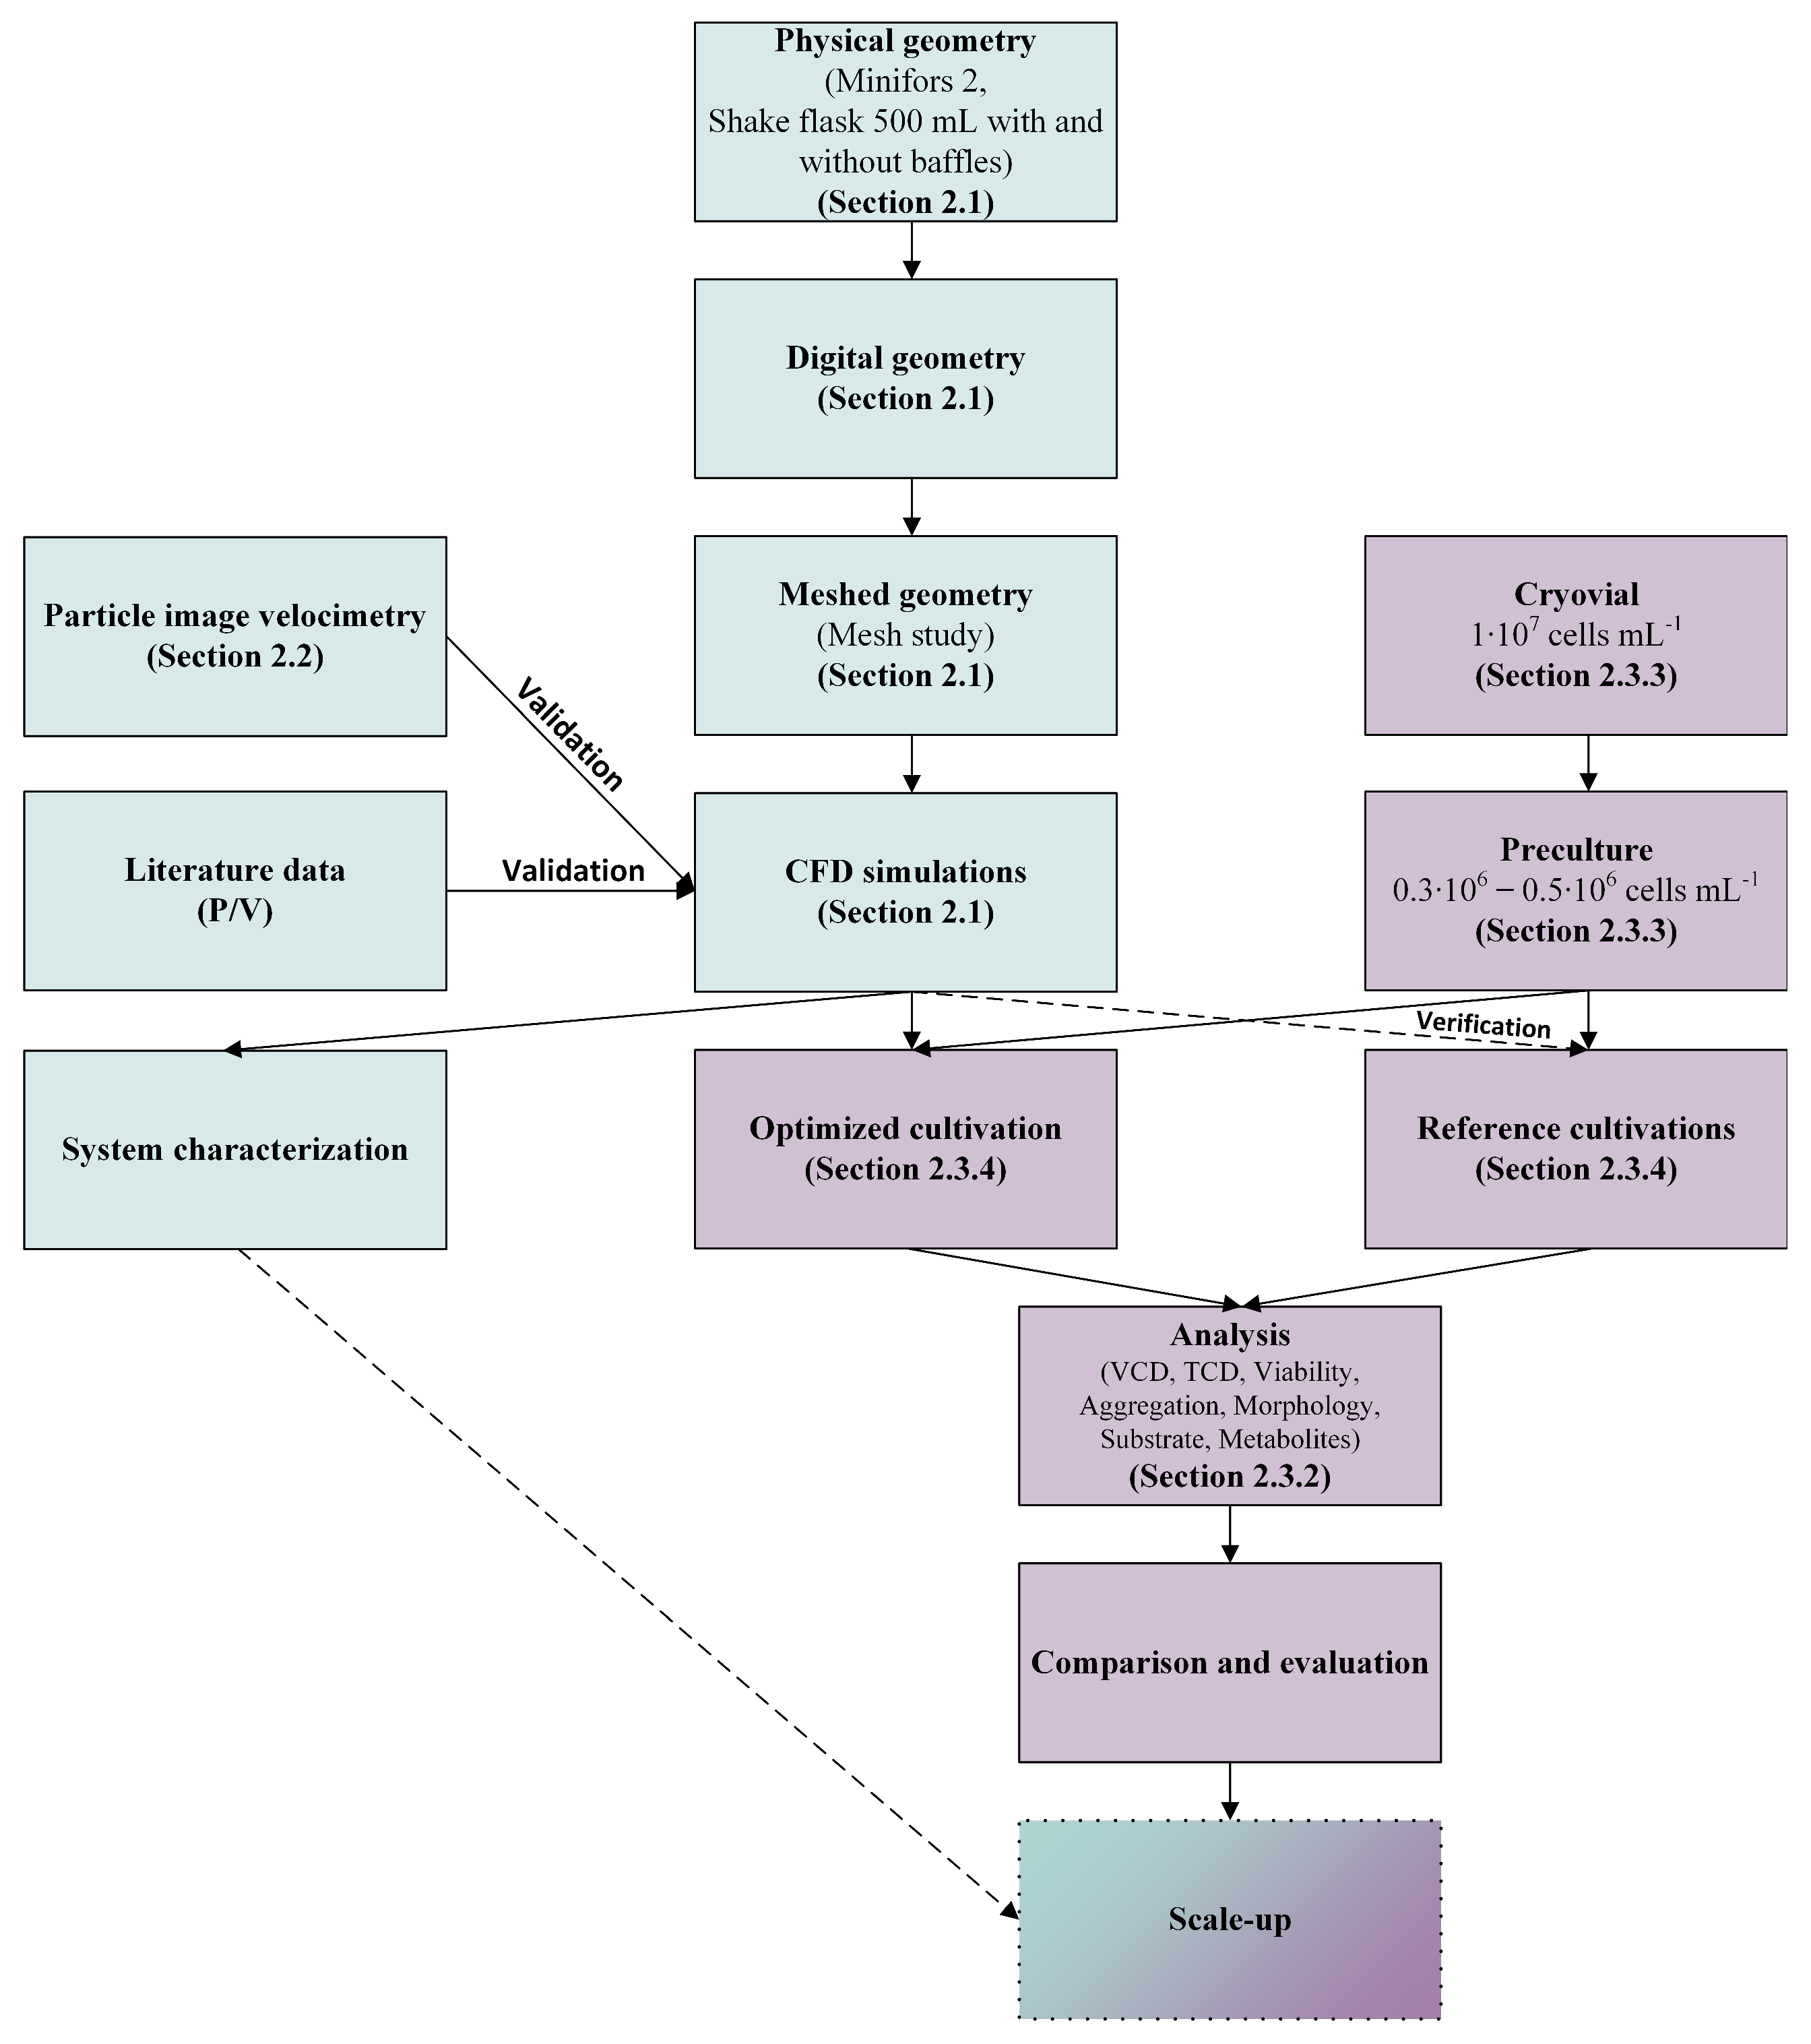
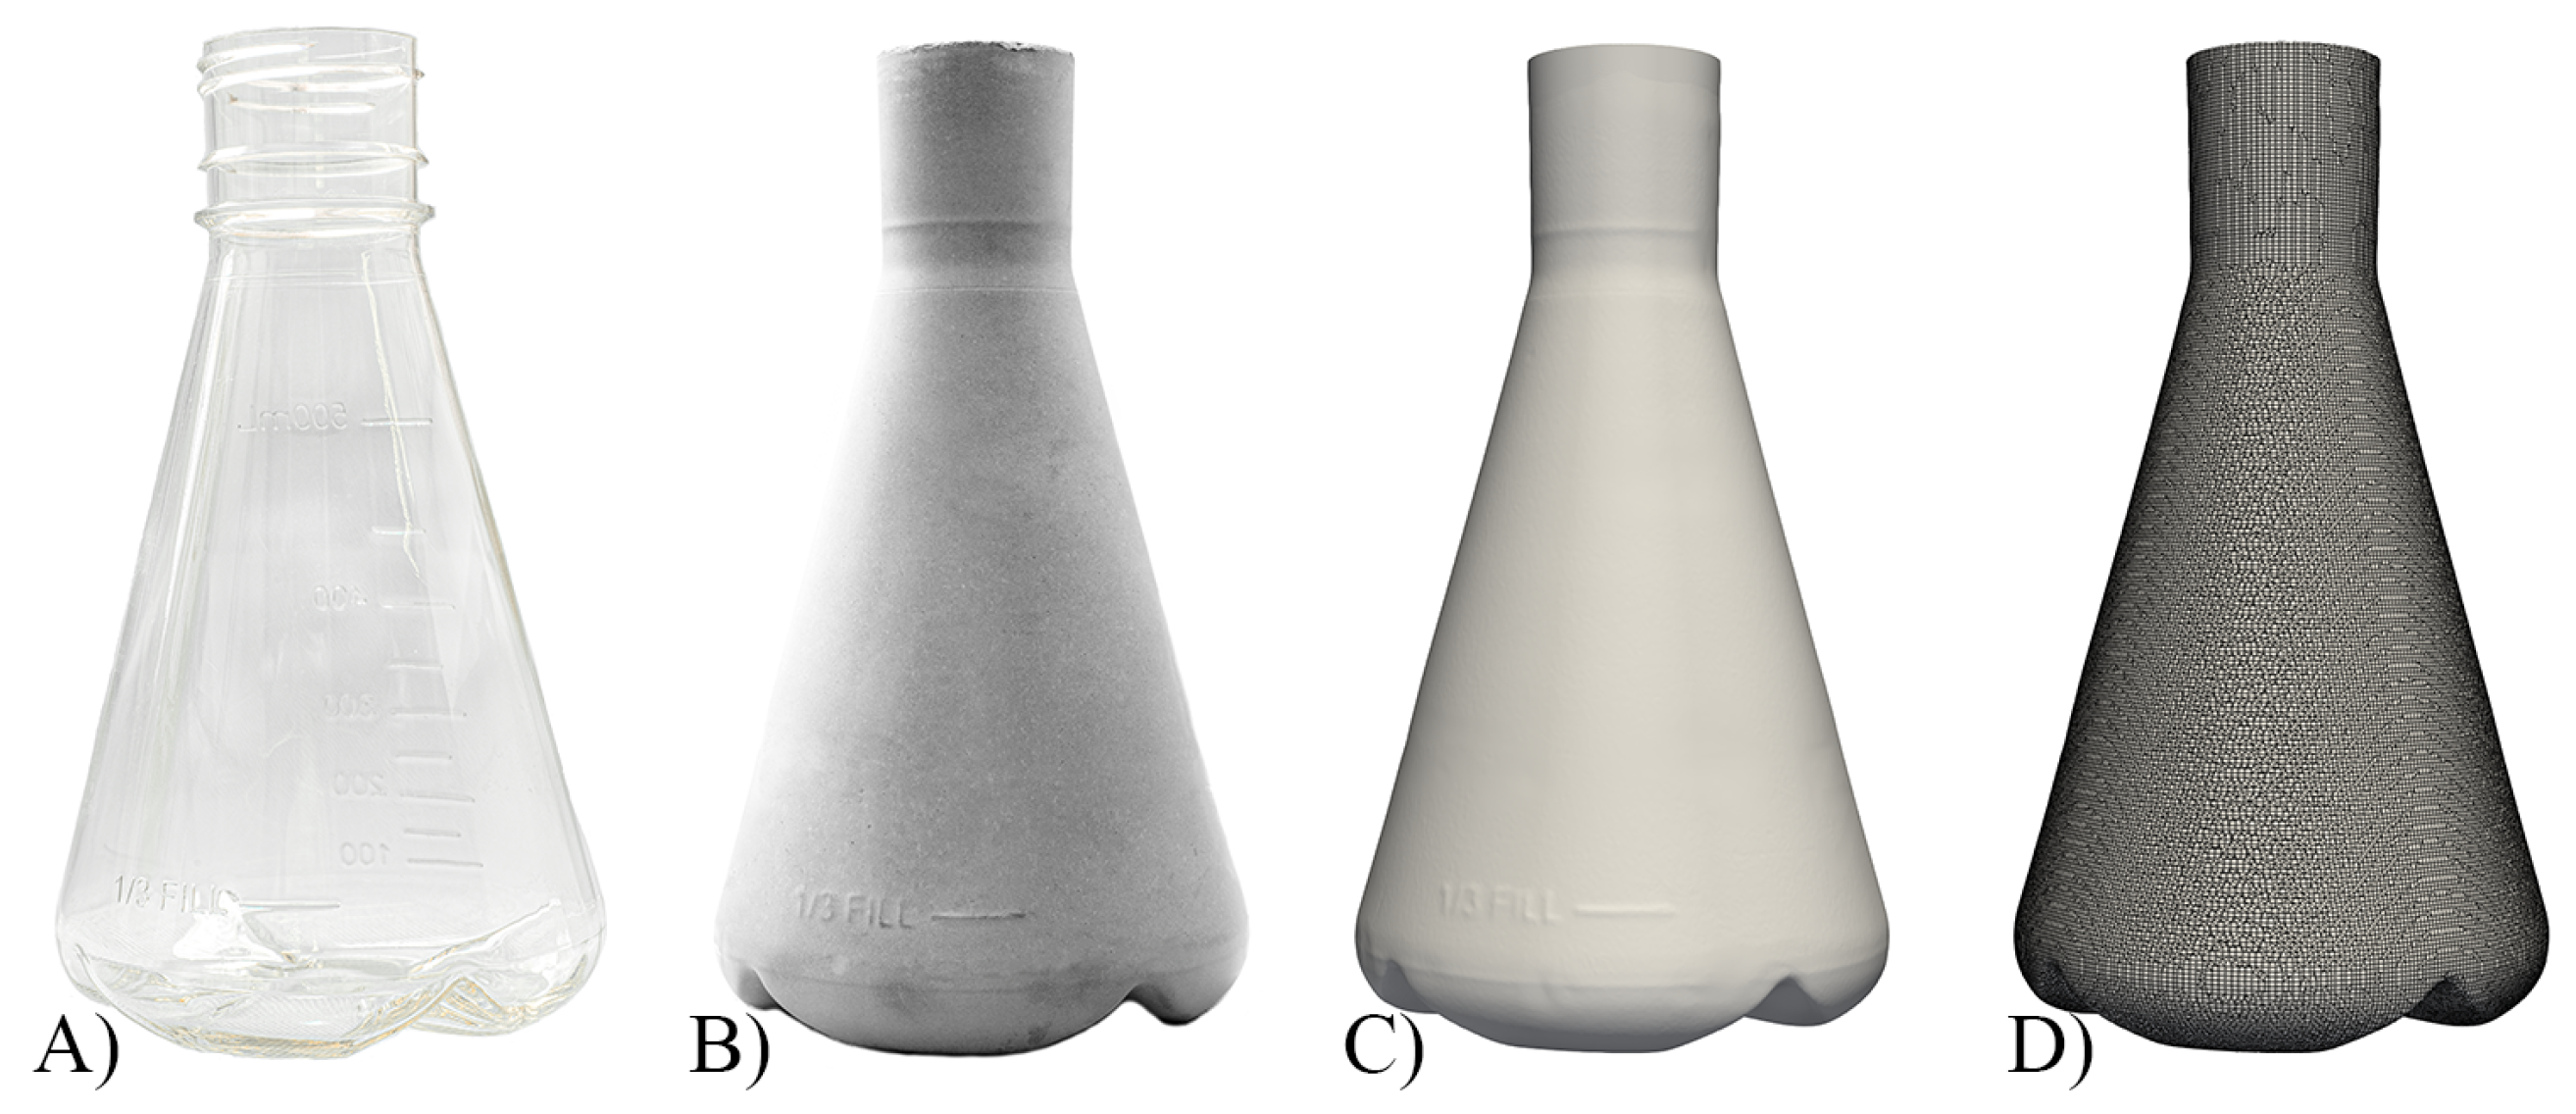
2.2. Particle Image Velocimetry
2.3. Cultivation
2.3.1. Cell Line and Medium
2.3.2. Analytics
2.3.3. Inoculum Production
2.3.4. Cultivation Systems and Cultivation
3. Results and Discussion
3.1. CFD for Shake Flasks
3.2. Cultivations in Shake Flasks
3.3. CFD for Stirred Bioreactor
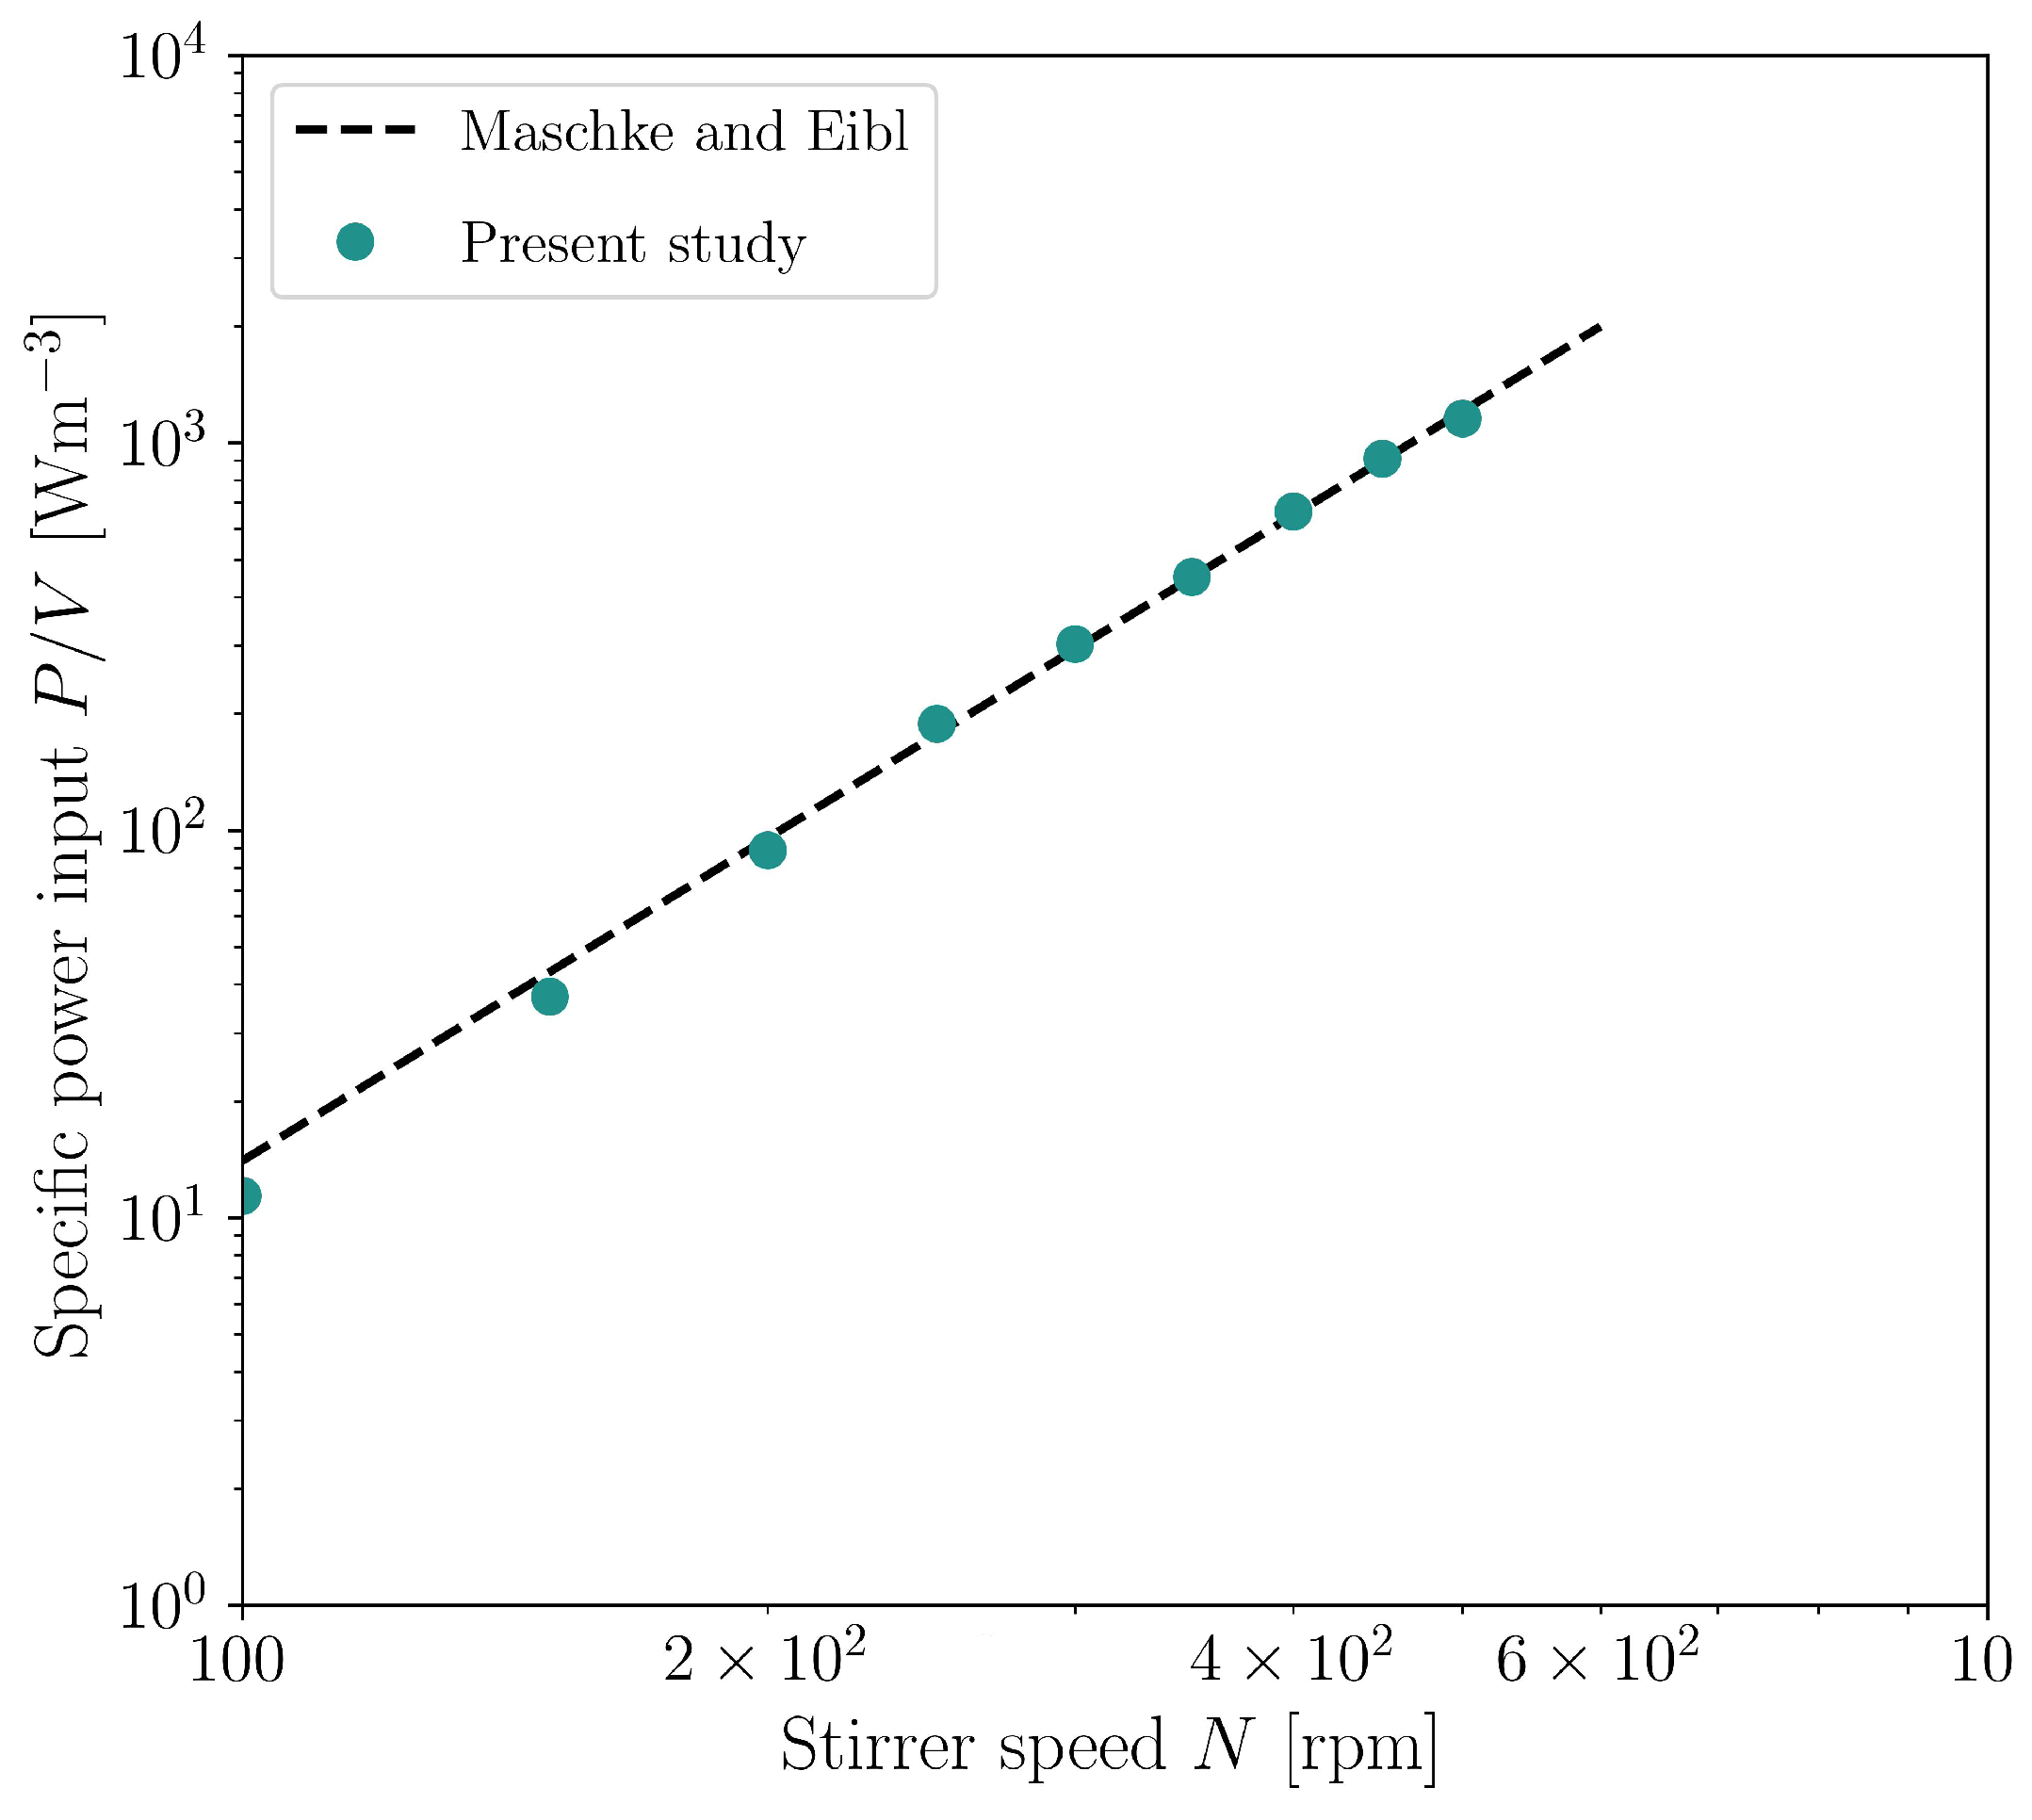
3.4. Cultivations in Stirred Bioreactor
4. Conclusions
Author Contributions
Funding
Informed Consent Statement
Data Availability Statement
Acknowledgments
Conflicts of Interest
Abbreviations
| CAR | Chimeric antigen receptor |
| CCD | Charge-coupled device |
| CFD | Computational fluid dynamics |
| CFL | Courant-Friedrichs-Lewy |
| CGI | Computer generated image |
| CHO | Chinese hamster ovary |
| DAPI | 4’,6-Diamidino-2-phenylindol |
| EMA | European Medicines Agency |
| FDA | Food and Drug Administration |
| GCI | Grid convergence index |
| HEK | Human embryonic kidney |
| HEp-2 | Human epithelioma-2 |
| MDCK | Madin-Darby canine kidney |
| MRF | Multiple reference frame |
| NADPH | Reduced nicotinamide adenine dinucleotide phosphate |
| NADP+ | Nicotinamide adenine dinucleotide phosphate |
| Nd:YAG | Neodymium-doped yttrium aluminum garnet |
| PISO | Pressure implicit with splitting of operator |
| PIV | Particle image velocimetry |
| PLIC | Piece-wise linear interface calculation |
| PMMA | Poly(methyl methacrylate) |
| RANS | Reynolds-averaged Navier–Stokes |
| SIMPLE | Semi-Implicit Method for Pressure Linked Equations |
| SST | Shear stress transport |
| VOF | Volume of fluid |
Nomenclature
| Latin symbols | ||
| Model constant in Equation (A1) | [-] | |
| Concentration of CO in the shaking incubator | [%] | |
| Dissolved oxygen concentration at the gas liquid interphase | [] | |
| Dissolved oxygen concentration in the liquid bulk | [] | |
| Cell density | [ ] | |
| Positive portion of cross-diffusion in Equation (A3) | [-] | |
| d | Maximum inner diameter | [] |
| Cell diameter | [] | |
| Shaking amplitude | [] | |
| Stirrer diameter | [] | |
| DO | Dissolved oxygen concentration | [%] |
| f | Geometric function | [-] |
| Surface tension force | [] | |
| Safety factor | [-] | |
| Blending function in Equation (A3) | [-] | |
| Blending function in Equation (A1) | [-] | |
| Axial Froude number | [-] | |
| Gravitational acceleration | [] | |
| h | Optical height | [] |
| Null hypothesis | [-] | |
| I | Second order identity tensor | [-] |
| k | Turbulent kinetic energy | [/] |
| Local turbulent kinetic energy | [/] | |
| Volumetric oxygen mass transfer coefficient | [] | |
| L | Test statistic of the Levene-test | [-] |
| M | Moment/Torque | [] |
| Surface normal vector | [-] | |
| Unit vector in normal direction | [-] | |
| Unit vector in tangential direction | [-] | |
| N | Shaking/Stirring speed | [rpm] |
| n | Aggregate/Cluster size | [-] |
| Number of mesh cells | [-] | |
| Number of HEK293 cells | [-] | |
| Number of cultivation runs | [-] | |
| Ne | Power (Newton) number | [-] |
| OTR | Oxygen transfer rate | [mol /] |
| OUR | Oxygen uptake rate | [mol /] |
| Ph | Phase number | [-] |
| P | Power | [] |
| p | Free parameter of the geometric distribution | [-] |
| Maximum likelihood estimation of p | [-] | |
| Formal order of accuracy | [-] | |
| Observed order of accuracy | [-] | |
| Production of turbulent kinetic energy | [/] | |
| Pressure | [] | |
| p-value | [-] | |
| Specific power input | [/] | |
| Q | Second invariant of the velocity gradient tensor | [] |
| Cell specific oxygen uptake rate | [] | |
| r | Mesh refinement factor | [-] |
| Coefficient of determination | [-] | |
| Modified Reynolds number | [-] | |
| Relative humidity | [%] | |
| Normalized radial distance | [-] | |
| S | Vorticity magnitude | [] |
| Reynolds stress tensor | [m] | |
| T | Temperature | [] |
| t | Time | [] |
| Test statistic of the t-test | [-] | |
| Time at VCD | [] | |
| TCD | Total cell density | [ ] |
| V | Volume | [] |
| Control volume | [] | |
| Velocity | [] | |
| Stirrer tip speed | [ ] | |
| VCD | Viable cell density | [ ] |
| VCD | Maximum viable cell density | [ ] |
| W | Test statistic of the Shapiro-Wilk-test | [-] |
| x | Spatial coordinate | [] |
| y | Nearest distance to surface | [] |
| Greek symbols | ||
| Model constant in Equation (A3) | [-] | |
| Volume fraction of substance i | [-] | |
| Significance level | [-] | |
| Model constant in Equation (A3) | [-] | |
| Constant for the k--model | [-] | |
| Difference | [-] | |
| Energy dissipation rate | [/] | |
| Spacial maximum energy dissipation rate | [/] | |
| Local energy dissipation rate | [/] | |
| Volume-averaged energy dissipation rate | [/] | |
| Relative error | [%] | |
| Dynamic viscosity of substance i | [ ] | |
| Contact angle of substance i | [] | |
| Local interface curvature | [] | |
| Kolmogorov length scale | [] | |
| Local Kolmogorov length scale | [] | |
| Volume-averaged Kolmogorov length scale | [] | |
| Mean value | [-] | |
| Maximum specific growth rate | [] | |
| Effective viscosity | [/] | |
| Kinematic viscosity of substance i | [/] | |
| Turbulent eddy viscosity | [/] | |
| Density of substance i | [/] | |
| Standard deviation | [-] | |
| Model constant in Equation (A2) | [-] | |
| Model constant in Equation (A3) | [-] | |
| Model constant in Equations (A3), (A6), and (A7) | [-] | |
| Surface tension of water and air | [/] | |
| Turbulent stress tensor | [m] | |
| Hydrodynamic heterogeneity | [-] | |
| Generic model constant | [-] | |
| Generic model constant from k--model | [-] | |
| Generic model constant from k--model | [-] | |
| Mixed fluid properties | [-] | |
| Test statistic of the Bartlett-test | [-] | |
| Specific dissipation rate | [] | |
| Local specific dissipation rate | [] | |
| Indices | ||
| a | Air | |
| i | Generic index | |
| j | Generic index | |
| glass | Glass | |
| pc | Polycarbonate | |
| PMMA | PMMA | |
| w | Water |
Appendix A

Appendix B
References
- Casademunt, E.; Martinelle, K.; Jernberg, M.; Winge, S.; Tiemeyer, M.; Biesert, L.; Knaub, S.; Walter, O.; Schröder, C. The first recombinant human coagulation factor VIII of human origin: Human cell line and manufacturing characteristics. Eur. J. Haematol. 2012, 89, 165–176. [Google Scholar] [CrossRef]
- Arena, T.A.; Chou, B.; Harms, P.D.; Wong, A.W. An anti-apoptotic HEK293 cell line provides a robust and high titer platform for transient protein expression in bioreactors. mAbs 2019, 11, 977–986. [Google Scholar] [CrossRef]
- Tan, E.; Chin, C.S.H.; Lim, Z.F.S.; Ng, S.K. HEK293 Cell Line as a Platform to Produce Recombinant Proteins and Viral Vectors. Front. Bioeng. Biotechnol. 2021, 9, 796991. [Google Scholar] [CrossRef]
- Lin, Y.C.; Boone, M.; Meuris, L.; Lemmens, I.; Van Roy, N.; Soete, A.; Reumers, J.; Moisse, M.; Plaisance, S.; Drmanac, R.; et al. Genome dynamics of the human embryonic kidney 293 lineage in response to cell biology manipulations. Nat. Commun. 2014, 5, 4767. [Google Scholar] [CrossRef]
- Hacker, D.L.; Durrer, L.; Quinche, S. CHO and HEK293 Cultivation and Transfection in Single-Use Orbitally Shaken Bioreactors. In Recombinant Protein Expression in Mammalian Cells: Methods and Protocols; Humana: New York, NY, USA, 2018; pp. 123–131. [Google Scholar] [CrossRef]
- Croset, A.; Delafosse, L.; Gaudry, J.P.; Arod, C.; Glez, L.; Losberger, C.; Begue, D.; Krstanovic, A.; Robert, F.; Vilbois, F.; et al. Differences in the glycosylation of recombinant proteins expressed in HEK and CHO cells. J. Biotechnol. 2012, 161, 336–348. [Google Scholar] [CrossRef]
- Shaw, G.; Morse, S.; Ararat, M.; Graham, F.L. Preferential transformation of human neuronal cells by human adenoviruses and the origin of HEK 293 cells. FASEB J. Off. Publ. Fed. Am. Soc. Exp. Biol. 2002, 16, 869–871. [Google Scholar] [CrossRef]
- Nettleship, J.E.; Watson, P.J.; Rahman-Huq, N.; Fairall, L.; Posner, M.G.; Upadhyay, A.; Reddivari, Y.; Chamberlain, J.M.G.; Kolstoe, S.E.; Bagby, S.; et al. Transient Expression in HEK 293 Cells: An Alternative to E. coli for the Production of Secreted and Intracellular Mammalian Proteins. In Insoluble Proteins, 1st ed.; García-Fruitós, E., Ed.; Humana: New York, NY, USA, 2015; pp. 209–222. [Google Scholar] [CrossRef]
- Chin, C.L.; Goh, J.B.; Srinivasan, H.; Liu, K.I.; Gowher, A.; Shanmugam, R.; Lim, H.L.; Choo, M.; Tang, W.Q.; Tan, A.H.M.; et al. A human expression system based on HEK293 for the stable production of recombinant erythropoietin. Sci. Rep. 2019, 9, 16768. [Google Scholar] [CrossRef]
- Ghani, K.; Garnier, A.; Coelho, H.; Transfiguracion, J.; Trudel, P.; Kamen, A. Retroviral vector production using suspension-adapted 293GPG cells in a 3L acoustic filter-based perfusion bioreactor. Biotechnol. Bioeng. 2006, 95, 653–660. [Google Scholar] [CrossRef]
- Ansorge, S.; Lanthier, S.; Transfiguracion, J.; Henry, O.; Kamen, A. Monitoring lentiviral vector production kinetics using online permittivity measurements. Biochem. Eng. J. 2011, 54, 16–25. [Google Scholar] [CrossRef]
- Le Ru, A.; Jacob, D.; Transfiguracion, J.; Ansorge, S.; Henry, O.; Kamen, A.A. Scalable production of influenza virus in HEK-293 cells for efficient vaccine manufacturing. Vaccine 2010, 28, 3661–3671. [Google Scholar] [CrossRef]
- Cervera, L.; Gutiérrez-Granados, S.; Martínez, M.; Blanco, J.; Gòdia, F.; Segura, M.M. Generation of HIV-1 Gag VLPs by transient transfection of HEK 293 suspension cell cultures using an optimized animal-derived component free medium. J. Biotechnol. 2013, 166, 152–165. [Google Scholar] [CrossRef]
- Fontana, D.; Kratje, R.; Etcheverrigaray, M.; Prieto, C. Immunogenic virus-like particles continuously expressed in mammalian cells as a veterinary rabies vaccine candidate. Vaccine 2015, 33, 4238–4246. [Google Scholar] [CrossRef]
- Abaandou, L.; Quan, D.; Shiloach, J. Affecting HEK293 Cell Growth and Production Performance by Modifying the Expression of Specific Genes. Cells 2021, 10, 1667. [Google Scholar] [CrossRef]
- Stepanenko, A.; Dmitrenko, V. HEK293 in cell biology and cancer research: Phenotype, karyotype, tumorigenicity, and stress-induced genome-phenotype evolution. Gene 2015, 569, 182–190. [Google Scholar] [CrossRef]
- Huber, T.; Steininger, P.; Irrgang, P.; Korn, K.; Tenbusch, M.; Diesch, K.; Achenbach, S.; Kremer, A.E.; Werblow, M.; Vetter, M.; et al. Diagnostic performance of four SARS-CoV-2 antibody assays in patients with COVID-19 or with bacterial and non-SARS-CoV-2 viral respiratory infections. Eur. J. Clin. Microbiol. Infect. Dis. 2021, 40, 1983–1997. [Google Scholar] [CrossRef]
- Dogan Onugoren, M.; Deuretzbacher, D.; Haensch, C.A.; Hagedorn, H.J.; Halve, S.; Isenmann, S.; Kramme, C.; Lohner, H.; Melzer, N.; Monotti, R.; et al. Limbic encephalitis due to GABA B and AMPA receptor antibodies: A case series. J. Neurol. Neurosurg. Psychiatry 2015, 86, 965–972. [Google Scholar] [CrossRef]
- Malm, M.; Saghaleyni, R.; Lundqvist, M.; Giudici, M.; Chotteau, V.; Field, R.; Varley, P.G.; Hatton, D.; Grassi, L.; Svensson, T.; et al. Evolution from adherent to suspension: Systems biology of HEK293 cell line development. Sci. Rep. 2020, 10, 18996. [Google Scholar] [CrossRef]
- Liu, X.M.; Liu, H.; Wu, B.C.; Li, S.C.; Ye, L.L.; Wang, Q.W.; Huang, P.T.; Chen, Z.L. Suspended aggregates as an immobilization mode for high-density perfusion culture of HEK 293 cells in a stirred tank bioreactor. Appl. Microbiol. Biotechnol. 2006, 72, 1144–1151. [Google Scholar] [CrossRef]
- Liu, H.; Liu, X.M.; Li, S.C.; Wu, B.C.; Ye, L.L.; Wang, Q.W.; Chen, Z.L. A high-yield and scaleable adenovirus vector production process based on high density perfusion culture of HEK 293 cells as suspended aggregates. J. Biosci. Bioeng. 2009, 107, 524–529. [Google Scholar] [CrossRef]
- Faust, C.; Beil, C.; Dittrich, W.; Rao, E.; Langer, T. Impact of lipopolysaccharides on cultivation and recombinant protein expression in human embryonal kidney (HEK-293) cells. Eng. Life Sci. 2021, 21, 778–785. [Google Scholar] [CrossRef]
- Henry, O.; Durocher, Y. Enhanced glycoprotein production in HEK-293 cells expressing pyruvate carboxylase. Metab. Eng. 2011, 13, 499–507. [Google Scholar] [CrossRef] [PubMed]
- Jang, M.; Pete, E.S.; Bruheim, P. The impact of serum-free culture on HEK293 cells: From the establishment of suspension and adherent serum-free adaptation cultures to the investigation of growth and metabolic profiles. Front. Bioeng. Biotechnol. 2022, 10. [Google Scholar] [CrossRef]
- Liste-Calleja, L.; Lecina, M.; Cairó, J.J. HEK293 cell culture media study towards bioprocess optimization: Animal derived component free and animal derived component containing platforms. J. Biosci. Bioeng. 2014, 117, 471–477. [Google Scholar] [CrossRef]
- Fuge, G. New Approaches for Characterizing and Monitoring Mammalian Cell Cycle and Specific Growth Rate in Production Cell Lines. Ph.D. Thesis, Technische Universität Hamburg, Hamburg, Germany, 2018. [Google Scholar] [CrossRef]
- Schwarz, H.; Zhang, Y.; Zhan, C.; Malm, M.; Field, R.; Turner, R.; Sellick, C.; Varley, P.; Rockberg, J.; Chotteau, V. Small-scale bioreactor supports high density HEK293 cell perfusion culture for the production of recombinant Erythropoietin. J. Biotechnol. 2020, 309, 44–52. [Google Scholar] [CrossRef]
- Girard, P.; Derouazi, M.; Baumgartner, G.; Bourgeois, M.; Jordan, M.; Jacko, B.; Wurm, F.M. 100-liter transient transfection. Cytotechnology 2002, 38, 15–21. [Google Scholar] [CrossRef]
- Kretzmer, G. Industrial processes with animal cells. Appl. Microbiol. Biotechnol. 2002, 59, 135–142. [Google Scholar] [CrossRef]
- Tuvesson, O.; Uhe, C.; Rozkov, A.; Lüllau, E. Development of a generic transient transfection process at 100 L scale. Cytotechnology 2008, 56, 123–136. [Google Scholar] [CrossRef]
- Grieger, J.C.; Soltys, S.M.; Samulski, R.J. Production of Recombinant Adeno-associated Virus Vectors Using Suspension HEK293 Cells and Continuous Harvest of Vector From the Culture Media for GMP FIX and FLT1 Clinical Vector. Mol. Ther. 2016, 24, 287–297. [Google Scholar] [CrossRef]
- Napoleone, A.; Laurén, I.; Linkgreim, T.; Dahllund, L.; Persson, H.; Andersson, O.; Olsson, A.; Hultqvist, G.; Frank, P.; Hall, M.; et al. Fed-batch production assessment of a tetravalent bispecific antibody: A case study on piggyBac stably transfected HEK293 cells. New Biotechnol. 2021, 65, 9–19. [Google Scholar] [CrossRef]
- Liang, Z.; Li, F.; Xu, Z.; Minglong, Z.; Wensong, T. The role of microenvironment in aggregation of 293-human embryonic kidney cells. Korean J. Chem. 2007. [Google Scholar] [CrossRef]
- Schoofs, G.; Monica, T.J.; Ayala, J.; Horwitz, J.; Montgomery, T.; Roth, G.; Castillo, F.J. A high-yielding serum-free, suspension cell culture process to manufacture recombinant adenoviral vectors for gene therapy. Cytotechnology 1998, 28, 81–89. [Google Scholar] [CrossRef] [PubMed]
- Pulix, M.; Lukashchuk, V.; Smith, D.C.; Dickson, A.J. Molecular characterization of HEK293 cells as emerging versatile cell factories. Curr. Opin. Biotechnol. 2021, 71, 18–24. [Google Scholar] [CrossRef] [PubMed]
- Dumont, J.; Euwart, D.; Mei, B.; Estes, S.; Kshirsagar, R. Human cell lines for biopharmaceutical manufacturing: History, status, and future perspectives. Crit. Rev. Biotechnol. 2016, 36, 1110–1122. [Google Scholar] [CrossRef]
- Walsh, G.; Walsh, E. Biopharmaceutical benchmarks 2022. Nat. Biotechnol. 2022, 40, 1722–1760. [Google Scholar] [CrossRef] [PubMed]
- Maschke, R.W.; Seidel, S.; Bley, T.; Eibl, R.; Eibl, D. Determination of culture design spaces in shaken disposable cultivation systems for CHO suspension cell cultures. Biochem. Eng. J. 2022, 177, 108224. [Google Scholar] [CrossRef]
- Werner, S.; Kaiser, S.C.; Kraume, M.; Eibl, D. Computational fluid dynamics as a modern tool for engineering characterization of bioreactors. Pharm. Bioprocess. 2014, 2, 85–99. [Google Scholar] [CrossRef]
- Seidel, S.; Maschke, R.W.; Kraume, M.; Eibl-Schindler, R.; Eibl, D. CFD Modelling of a wave-mixed bioreactor with complex geometry and two degrees of freedom motion. Front. Chem. Eng. 2022, 4, 1–19. [Google Scholar] [CrossRef]
- Karimi Alavijeh, M.; Baker, I.; Lee, Y.Y.; Gras, S.L. Digitally enabled approaches for the scale up of mammalian cell bioreactors. Digit. Chem. Eng. 2022, 4, 100040. [Google Scholar] [CrossRef]
- Kaiser, S.C.; Werner, S.; Jossen, V.; Blaschczok, K.; Eibl, D. Power Input Measurements in Stirred Bioreactors at Laboratory Scale. J. Vis. Exp. 2018, 135. [Google Scholar] [CrossRef]
- Büchs, J.; Maier, U.; Milbradt, C.; Zoels, B. Power consumption in shaking flasks on rotary shaking machines: I. Power consumption measurement in unbaffled flasks at low liquid viscosity. Biotechnol. Bioeng. 2000, 68, 589–593. [Google Scholar] [CrossRef]
- Blender—A 3D Modelling and Rendering Package. Available online: https://www.blender.org/ (accessed on 20 February 2023).
- Menter, F. Zonal Two Equation k-ω Turbulence Models For Aerodynamic Flows. In Proceedings of the 23rd Fluid Dynamics, Plasmadynamics, and Lasers Conference, Reston, VA, USA, 6–9 July 1993. [Google Scholar] [CrossRef]
- Kaiser, S.C.; Decaria, P.N.; Seidel, S.; Eibl, D. Scaling-up of an Insect Cell-based Virus Production Process in a Novel Single-use Bioreactor with Flexible Agitation. Chem. Ing. Tech. 2022, 94, 1950–1961. [Google Scholar] [CrossRef]
- Kaiser, S.C.; Löffelholz, C.; Werner, S.; Eibl, D. CFD for Characterizing Standard and Single-use Stirred Cell Culture Bioreactors. In Computational Fluid Dynamics Technologies and Applications; Minin, I.V., Minin, O.V., Eds.; IntechOpen: Rijeka, Croatia, 2011. [Google Scholar] [CrossRef]
- Schirmer, C.; Nussbaumer, T.; Schöb, R.; Pörtner, R.; Eibl, R.; Eibl, D. Development, Engineering and Biological Characterization of Stirred Tank Bioreactors. In Biopharmaceuticals; InTech: Rijeka, Croatia, 2018. [Google Scholar] [CrossRef]
- Jossen, V.; Eibl, D.; Eibl, R. Numerical Methods for the Design and Description of In Vitro Expansion Processes of Human Mesenchymal Stem Cells. In Digital Twins, 1st ed.; Herwig, C., Pörtner, R., Möller, J., Eds.; Springer: Cham, Switzerland, 2020; pp. 185–228. [Google Scholar] [CrossRef]
- Seidel, S.; Schirmer, C.; Maschke, R.W.; Lia, R.; Eibl-Schindler, R.; Eibl, D. Computational Fluid Dynamics For Advanced Characterisation Of Bioreactors Used In The Biopharmaceutical Industry—Part II: Case Studies. In Computational Fluid Dynamics—Recent Advances, New Perspectives and Applications, 1st ed.; Ji, G., Ed.; IntechOpen: London, UK, 2023. [Google Scholar] [CrossRef]
- Holzmann, T. Mathematics, Numerics, Derivations and OpenFOAM®, Release, 7th ed.; Holzmann CFD: Bad Wörishofen, Germany, 2019. [Google Scholar] [CrossRef]
- Hirt, C.W.; Nichols, B.D. Volume of fluid (VOF) method for the dynamics of free boundaries. J. Comput. Phys. 1981, 39, 201–225. [Google Scholar] [CrossRef]
- Brackbill, J.; Kothe, D.; Zemach, C. A continuum method for modeling surface tension. J. Comput. Phys. 1992, 100, 335–354. [Google Scholar] [CrossRef]
- Georgoulas, A.; Koukouvinis, P.; Gavaises, M.; Marengo, M. Numerical investigation of quasi-static bubble growth and detachment from submerged orifices in isothermal liquid pools: The effect of varying fluid properties and gravity levels. Int. J. Multiph. Flow 2015, 74, 59–78. [Google Scholar] [CrossRef]
- Vogler, E.A. Structure and reactivity of water at biomaterial surfaces. Adv. Colloid Interface Sci. 1998, 74, 69–117. [Google Scholar] [CrossRef]
- Courant, R.; Friedrichs, K.; Lewy, H. Über die partiellen Differenzengleichungen der mathematischen Physik. In Kurt Otto Friedrichs; Birkhäuser Boston: Boston, MA, USA, 1986; pp. 53–95. [Google Scholar] [CrossRef]
- Youngs, D. Time-Dependent Multi-material Flow with Large Fluid Distortion. In Numerical Methods in Fluid Dynamics; Morton, K.W., Baines, M.J., Eds.; Academic Press: Cambridge, MA, USA, 1982. [Google Scholar]
- Bureš, L.; Sato, Y.; Pautz, A. Piecewise linear interface-capturing volume-of-fluid method in axisymmetric cylindrical coordinates. J. Comput. Phys. 2021, 436, 110291. [Google Scholar] [CrossRef]
- Kawano, A. A simple volume-of-fluid reconstruction method for three-dimensional two-phase flows. Computers Fluids 2016, 134–135, 130–145. [Google Scholar] [CrossRef]
- Stephan, P.; Kabelac, S.; Kind, M.; Mewes, D.; Schaber, K.; Wetzel, T. (Eds.) VDI-Wärmeatlas, 12th ed.; Springer Reference Technik; Springer: Berlin/Heidelberg, Germany, 2019. [Google Scholar] [CrossRef]
- Seidel, S.; Eibl, D. Influence of Interfacial Force Models and Population Balance Models on the kLa Value in Stirred Bioreactors. Processes 2021, 9, 1185. [Google Scholar] [CrossRef]
- Ahrens, J.; Geveci, B.; Law, C. ParaView: An End-User Tool for Large Data Visualization, Visualization Handbook; Elsevier: Amsterdam, The Netherlands, 2005. [Google Scholar]
- van Rossum, G. Python 3.10. Available online: https://www.python.org/ (accessed on 20 February 2023).
- Sirasitthichoke, C.; Perivilli, S.; Liddell, M.R.; Armenante, P.M. Experimental determination of the velocity distribution in USP Apparatus 1 (basket apparatus) using Particle Image Velocimetry (PIV). Int. J. Pharm. X 2021, 3, 100078. [Google Scholar] [CrossRef]
- Cates, S.; Ciccarone, V.C.; Gruber, D.F.; Hawley-Nelson, P. Novel Attached Cell Lines, International Patent. WO 2004/085620 A3, 7 October 2004. [Google Scholar]
- Yuan, J.; Xu, W.; Jiang, S.; Yu, H.; Fai Poon, H. The Scattered Twelve Tribes of HEK293. Biomed. Pharmacol. J. 2018, 11, 621–623. [Google Scholar] [CrossRef]
- Ovizio Imaging Systems. Ovizio Reader User Manual; Technical Report; Ovizio Imaging Systems: Uccle, Belgium, 2017. [Google Scholar]
- Kim, M.K. Digital Holographic Microscopy. In Digital Holographic Microscopy, 1st ed.; Springer: New York, NY, USA, 2011. [Google Scholar] [CrossRef]
- Joe, C.C.D.; Segireddy, R.R.; Oliveira, C.; Berg, A.; Li, Y.; Doultsinos, D.; Chopra, N.; Scholze, S.; Ahmad, A.; Nestola, P.; et al. Accelerating manufacturing to enable large-scale supply of 1 a new adenovirus-vectored vaccine within 100 days. bioRxiv 2021. [Google Scholar] [CrossRef]
- Sanderson, T.P.; Erlandson, T.; Hazi, N.; MacIntyre, A.; Ingersoll, B.I.; McLaughlin, M.; Wesel, S.; Maples, P.B. Scalability comparison between 50 and 500 liter stirred tank bioreactor for production of rAAV viral vector. Cell Gene Ther. Insights 2021, 7, 1025–1033. [Google Scholar] [CrossRef]
- Patel, S.; Fong, E.; George, H. Considerations for Bioreactor Process Development and Scale-Up for Transient Transfection-Based Lentivirus Production in Suspension. Available online: https://www.emdmillipore.com/Web-US-Site/en_CA/-/USD/ShowDocument-Pronet?id=202008.048 (accessed on 20 February 2023).
- Chen, P.; Demirji, J.; Ivleva, V.B.; Horwitz, J.; Schwartz, R.; Arnold, F. The transient expression of CHIKV VLP in large stirred tank bioreactors. Cytotechnology 2019, 71, 1079–1093. [Google Scholar] [CrossRef]
- Yang, J.; Guertin, P.; Jia, G.; Lv, Z.; Yang, H.; Ju, D. Large-scale microcarrier culture of HEK293T cells and Vero cells in single-use bioreactors. AMB Express 2019, 9, 70. [Google Scholar] [CrossRef]
- Roache, P.J. Perspective: A Method for Uniform Reporting of Grid Refinement Studies. J. Fluids Eng. 1994, 116, 405–413. [Google Scholar] [CrossRef]
- Richardson, L.F. The Approximate Arithmetical Solution by Finite Differences of Physical Problems Involving Differential Equations, with an Application to the Stresses in a Masonry Dam. Philos. Trans. R. Soc. A Math. Phys. Eng. Sci. 1911, 210, 307–357. [Google Scholar] [CrossRef]
- Cosner, R.; Oberkampf, W.; Rahaim, C.; Shih, T. AIAA Committee on Standards for Computational Fluid Dynamics—Status and Plans. In Proceedings of the 42nd AIAA Aerospace Sciences Meeting and Exhibit, Reston, VA, USA, 5–8 January 2004. [Google Scholar] [CrossRef]
- OECD Nuclear Energy Agency. Best Practice Guidelines for the Use of CFD in Nuclear Reactor Safety Applications—Revision; OECD Nuclear Energy Agency: Paris, France, 2015. [Google Scholar]
- Baker, N.; Kelly, G.; O’Sullivan, P.D. A grid convergence index study of mesh style effect on the accuracy of the numerical results for an indoor airflow profile. Int. J. Vent. 2020, 19, 300–314. [Google Scholar] [CrossRef]
- Ramírez, L.A.; Pérez, E.L.; García Díaz, C.; Camacho Luengas, D.A.; Ratkovich, N.; Reyes, L.H. CFD and Experimental Characterization of a Bioreactor: Analysis via Power Curve, Flow Patterns and kLa. Processes 2020, 8, 878. [Google Scholar] [CrossRef]
- Pappalardo, F.; Moscatello, A.; Ledda, G.; Uggenti, A.C.; Gerboni, R.; Carpignano, A.; Di Maio, F.; Mereu, R.; Zio, E. Quantification of Uncertainty in CFD Simulation of Accidental Gas Release for O & G Quantitative Risk Assessment. Energies 2021, 14, 8117. [Google Scholar] [CrossRef]
- Roache, P.J. Verification and Validation in Computational Science and Engineering; Hermosa: Albuquerque, NM, USA, 1998; p. 895. [Google Scholar]
- Meana-Fernández, A.; Fernández Oro, J.M.; Argüelles Díaz, K.M.; Galdo-Vega, M.; Velarde-Suárez, S. Application of Richardson extrapolation method to the CFD simulation of vertical-axis wind turbines and analysis of the flow field. Eng. Appl. Comput. Fluid Mech. 2019, 13, 359–376. [Google Scholar] [CrossRef]
- Büchs, J.; Maier, U.; Milbradt, C.; Zoels, B. Power consumption in shaking flasks on rotary shaking machines: II. Nondimensional description of specific power consumption and flow regimes in unbaffled flasks at elevated liquid viscosity. Biotechnol. Bioeng. 2000, 68, 594–601. [Google Scholar] [CrossRef]
- Raval, K.; Kato, Y.; Büchs, J. Comparison of torque method and temperature method for determination of power consumption in disposable shaken bioreactors. Biochem. Eng. J. 2007, 34, 224–227. [Google Scholar] [CrossRef]
- Peter, C.P.; Suzuki, Y.; Rachinskiy, K.; Lotter, S.; Büchs, J. Volumetric power consumption in baffled shake flasks. Chem. Eng. Sci. 2006, 61, 3771–3779. [Google Scholar] [CrossRef]
- Büchs, J.; Lotter, S.; Milbradt, C. Out-of-phase operating conditions, a hitherto unknown phenomenon in shaking bioreactors. Biochem. Eng. J. 2001, 7, 135–141. [Google Scholar] [CrossRef]
- Azizan, A.; Sieben, M.; Wandrey, G.; Büchs, J. Reassessing the out-of-phase phenomenon in shake flasks by evaluating the angle-dependent liquid distribution relative to the direction of the centrifugal acceleration. Biotechnol. Bioeng. 2019, 116, 2983–2995. [Google Scholar] [CrossRef]
- Li, C.; Xia, J.Y.; Chu, J.; Wang, Y.H.; Zhuang, Y.P.; Zhang, S.L. CFD analysis of the turbulent flow in baffled shake flasks. Biochem. Eng. J. 2013, 70, 140–150. [Google Scholar] [CrossRef]
- Kysela, B.; Konfrst, J.; Chara, Z.; Sulc, R.; Jasikova, D. Evaluation of the turbulent kinetic dissipation rate in an agitated vessel. EPJ Web Conf. 2017, 143, 02062. [Google Scholar] [CrossRef]
- Hortsch, R.; Weuster-Botz, D. Power consumption and maximum energy dissipation in a milliliter-scale bioreactor. Biotechnol. Prog. 2009, 26, 595–599. [Google Scholar] [CrossRef]
- Liangchao, L.; Ning, C.; Kefeng, X.; Beiping, X. CFD Study on the Flow Field and Power Characteristics in a Rushton Turbine Stirred Tank in Laminar Regime. Int. J. Chem. React. Eng. 2019, 17, 1–17. [Google Scholar] [CrossRef]
- Ng, K.; Yianneskis, M. Observations on the Distribution of Energy Dissipation in Stirred Vessels. Chem. Eng. Res. Des. 2000, 78, 334–341. [Google Scholar] [CrossRef]
- Liangchao, L.; Ning, C.; Kefeng, X.; Beiping, X. A Comparative CFD Study on Gas-Liquid Dispersion in A Stirred Tank with Low and High Gas Loadings. Int. J. Chem. React. Eng. 2018, 16, 1–21. [Google Scholar] [CrossRef]
- Tianzhong, L.; Ge, S.; Jing, L.; Xiangming, Q.; Xiaobei, Z. Numerical Simulation of Flow in Erlenmeyer Shaken Flask. In Computational Fluid Dynamics; InTech: London, UK, 2010. [Google Scholar] [CrossRef]
- Büchs, J.; Zoels, B. Evaluation of Maximum to Specific Power Consumption Ratio in Shaking Bioreactors. J. Chem. Eng. Jpn. 2001, 34, 647–653. [Google Scholar] [CrossRef]
- Liu, Y.; Wang, Z.J.; Zhang, J.; Xia, J.Y.; Chu, J.; Zhang, S.L.; Zhuang, Y.P. Quantitative evaluation of the shear threshold on Cart. tinctorius L. Cell Growth Comput. Fluid Dyn. Shaken Flask Bioreact. Biochem. Eng. J. 2016, 113, 66–76. [Google Scholar] [CrossRef]
- Peter, C.P.; Suzuki, Y.; Büchs, J. Hydromechanical stress in shake flasks: Correlation for the maximum local energy dissipation rate. Biotechnol. Bioeng. 2006, 93, 1164–1176. [Google Scholar] [CrossRef] [PubMed]
- Nienow, A.W. The Impact of Fluid Dynamic Stress in Stirred Bioreactors – The Scale of the Biological Entity: A Personal View. Chem. Ing. Tech. 2021, 93, 17–30. [Google Scholar] [CrossRef]
- Freiberger, F.; Budde, J.; Ateş, E.; Schlüter, M.; Pörtner, R.; Möller, J. New Insights from Locally Resolved Hydrodynamics in Stirred Cell Culture Reactors. Processes 2022, 10, 107. [Google Scholar] [CrossRef]
- Mortazavi, H.; Pakzad, L. The Hydrodynamics and Mixing Performance in a Moving Baffle Oscillatory Baffled Reactor through Computational Fluid Dynamics (CFD). Processes 2020, 8, 1236. [Google Scholar] [CrossRef]
- Xie, Y.; Wan, A.; Wu, Y. Numerical simulation and experimental investigation on the effect of a new suspended carrier filler on mass transfer in MBBR. Chem. Eng. Process.-Process Intensif. 2020, 156, 108104. [Google Scholar] [CrossRef]
- Wan, A.; Wu, Y.; Xie, Y.; Zhao, B.; Qi, X. Experimental study and numerical simulation of moving bed biofilm reactor using 3D printed filler. Chem. Eng. Process.-Process Intensif. 2020, 157, 108146. [Google Scholar] [CrossRef]
- Martínez-Monge, I.; Albiol, J.; Lecina, M.; Liste-Calleja, L.; Miret, J.; Solà, C.; Cairó, J.J. Metabolic flux balance analysis during lactate and glucose concomitant consumption in HEK293 cell cultures. Biotechnol. Bioeng. 2019, 116, 388–404. [Google Scholar] [CrossRef]
- Shapiro, S.S.; Wilk, M.B. An Analysis of Variance Test for Normality (Complete Samples). Biometrika 1965, 52, 591. [Google Scholar] [CrossRef]
- Bartlett, M.S.; A, P.R.S.L. Properties of sufficiency and statistical tests. Proc. R. Soc. London. Ser. A-Math. Phys. Sci. 1937, 160, 268–282. [Google Scholar] [CrossRef]
- Levene, H. Robust tests for equality of variances. In Contributions to Probability and Statistics: Essays in Honor of Harold Hotelling; Olkin, I., Hotelling, H., Eds.; Stanford University Press: Redwood City, CA, USA, 1960; pp. 278–292. [Google Scholar]
- Meier, K.; Klöckner, W.; Bonhage, B.; Antonov, E.; Regestein, L.; Büchs, J. Correlation for the maximum oxygen transfer capacity in shake flasks for a wide range of operating conditions and for different culture media. Biochem. Eng. J. 2016, 109, 228–235. [Google Scholar] [CrossRef]
- Seidel, S.; Maschke, R.W.; Werner, S.; Jossen, V.; Eibl, D. Oxygen Mass Transfer in Biopharmaceutical Processes: Numerical and Experimental Approaches. Chem. Ing. Tech. 2021, 93, 42–61. [Google Scholar] [CrossRef]
- Maschke, R.W.; Pretzner, B.; John, G.T.; Herwig, C.; Eibl, D. Improved Time Resolved KPI and Strain Characterization of Multiple Hosts in Shake Flasks Using Advanced Online Analytics and Data Science. Bioengineering 2022, 9, 339. [Google Scholar] [CrossRef]
- Martínez-Monge, I.; Comas, P.; Triquell, J.; Lecina, M.; Casablancas, A.; Cairó, J.J. A new strategy for fed-batch process control of HEK293 cell cultures based on alkali buffer addition monitoring: Comparison with O.U.R. dynamic method. Appl. Microbiol. Biotechnol. 2018, 102, 10469–10483. [Google Scholar] [CrossRef] [PubMed]
- Pappenreiter, M.; Sissolak, B.; Sommeregger, W.; Striedner, G. Oxygen Uptake Rate Soft-Sensing via Dynamic kLa Computation: Cell Volume and Metabolic Transition Prediction in Mammalian Bioprocesses. Front. Bioeng. Biotechnol. 2019, 7, 1–16. [Google Scholar] [CrossRef]
- Tromans, D. Temperature and pressure dependent solubility of oxygen in water: A thermodynamic analysis. Hydrometallurgy 1998, 48, 327–342. [Google Scholar] [CrossRef]
- Garcia-Ochoa, F.; Gomez, E. Bioreactor scale-up and oxygen transfer rate in microbial processes: An overview. Biotechnol. Adv. 2009, 27, 153–176. [Google Scholar] [CrossRef]
- Liu, Y.; Wang, Z.J.; Li, L.; Cui, X.; Chu, J.; Zhang, S.L.; Zhuang, Y.P. On-line monitoring of the aggregate size distribution of Cart. tinctorius L. Cells Multi-Freq. Capacit. Meas. RSC Adv. 2016, 6, 89764–89769. [Google Scholar] [CrossRef]
- Wucherpfennig, T.; Schilling, J.; Sieblitz, D.; Pump, M.; Schütte, K.; Wittmann, C.; Krull, R. Improved assessment of aggregate size in Taxus Plant Cell Suspens. Cult. Using Laser Diffraction. Eng. Life Sci. 2012, 12, 595–602. [Google Scholar] [CrossRef]
- Renner, W.A.; Jordan, M.; Eppenberger, H.M.; Leist, C. Cell-cell adhesion and aggregation: Influence on the growth behavior of CHO cells. Biotechnol. Bioeng. 1993, 41, 188–193. [Google Scholar] [CrossRef] [PubMed]
- Tsao, Y.S.; Condon, R.; Schaefer, E.; Lindsay, D.; Liu, Z. Biomass and Aggregation Analysis of Human Embryonic Kidney 293 Suspension Cell Cultures by Particle Size Measurement. Biotechnol. Prog. 2000, 16, 809–814. [Google Scholar] [CrossRef] [PubMed]
- Khokonov, M.K.; Khokonov, A.K. Cluster Size Distribution in a System of Randomly Spaced Particles. J. Stat. Phys. 2021, 182, 3. [Google Scholar] [CrossRef]
- Mendes, R.L.; Santos, A.A.; Martins, M.; Vilela, M. Cluster size distribution of cell aggregates in culture. Phys. A Stat. Mech. Its Appl. 2001, 298, 471–487. [Google Scholar] [CrossRef]
- Paul, S.R. Testing Goodness Of Fit Of The Geometric Distribution: An Application To Human Fecundability Data. J. Mod. Appl. Stat. Methods 2005, 4, 425–433. [Google Scholar] [CrossRef]
- Kocherlakota, S.; Kocherlakota, K. Goodness of fit tests for discrete distributions. Commun. Stat.-Theory Methods 1986, 15, 815–829. [Google Scholar] [CrossRef]
- Chen, F. The Goodness-of-Fit Tests for Geometric Models. Ph.D. Thesis, New Jersey Institute of Technology and Rutgers, Newark, NJ, USA, 2013. [Google Scholar]
- Lin, M.; Lucas, H.C.; Shmueli, G. Research Commentary —Too Big to Fail: Large Samples and the p -Value Problem. Inf. Syst. Res. 2013, 24, 906–917. [Google Scholar] [CrossRef]
- Bergh, D. Sample Size and Chi-Squared Test of Fit—A Comparison Between a Random Sample Approach and a Chi-Square Value Adjustment Method Using Swedish Adolescent Data. In Pacific Rim Objective Measurement Symposium (PROMS) 2014 Conference Proceedings; Springer: Berlin/Heidelberg, Germany, 2015; pp. 197–211. [Google Scholar] [CrossRef]
- Dietmair, S.; Hodson, M.P.; Quek, L.E.; Timmins, N.E.; Gray, P.; Nielsen, L.K. A Multi-Omics Analysis of Recombinant Protein Production in Hek293 Cells. PLoS ONE 2012, 7, e43394. [Google Scholar] [CrossRef]
- Blumlein, A.; Williams, N.; McManus, J.J. The mechanical properties of individual cell spheroids. Sci. Rep. 2017, 7, 7346. [Google Scholar] [CrossRef]
- Maschke, R.W.; Eibl, D. Process Transfer of CHO Cultivations Using the Minifors 2 as an Example. Available online: https://www.infors-ht.com/en/productdownload/request/file/id/167/ (accessed on 20 February 2023).
- Kaiser, S.C.; Werner, S.; Jossen, V.; Kraume, M.; Eibl, D. Development of a method for reliable power input measurements in conventional and single-use stirred bioreactors at laboratory scale. Eng. Life Sci. 2017, 17, 500–511. [Google Scholar] [CrossRef] [PubMed]
- Zhu, H.; Nienow, A.W.; Bujalski, W.; Simmons, M.J. Mixing studies in a model aerated bioreactor equipped with an up- or a down-pumping ‘Elephant Ear’ agitator: Power, hold-up and aerated flow field measurements. Chem. Eng. Res. Des. 2009, 87, 307–317. [Google Scholar] [CrossRef]
- Rotondi, M.; Grace, N.; Betts, J.; Bargh, N.; Costariol, E.; Zoro, B.; Hewitt, C.J.; Nienow, A.W.; Rafiq, Q.A. Design and development of a new ambr250® bioreactor vessel for improved cell and gene therapy applications. Biotechnol. Lett. 2021, 43, 1103–1116. [Google Scholar] [CrossRef] [PubMed]
- Zhou, G.; Kresta, S.M. Impact of tank geometry on the maximum turbulence energy dissipation rate for impellers. AIChE J. 1996, 42, 2476–2490. [Google Scholar] [CrossRef]
- Zhou, G.; Kresta, S.M. Correlation of mean drop size and minimum drop size with the turbulence energy dissipation and the flow in an agitated tank. Chem. Eng. Sci. 1998, 53, 2063–2079. [Google Scholar] [CrossRef]
- Assirelli, M.; Wynn, E.J.W.; Bujalski, W.; Eaglesham, A.; Nienow, A.W. An Extension to the Incorporation Model of Micromixing and Its Use in Estimating Local Specific Energy Dissipation Rates. Ind. Eng. Chem. Res. 2008, 47, 3460–3469. [Google Scholar] [CrossRef]
- Wernersson, E.S.; Trägrdh, C. Scaling of turbulence characteristics in a turbine-agitated tank in relation to agitation rate. Chem. Eng. J. 1998, 70, 37–45. [Google Scholar] [CrossRef]
- Henry, O.; Jolicoeur, M.; Kamen, A. Unraveling the metabolism of HEK-293 cells using lactate isotopomer analysis. Bioprocess Biosyst. Eng. 2011, 34, 263–273. [Google Scholar] [CrossRef]
- Sorg, R.; Tanzeglock, T.; Soos, M.; Morbidelli, M.; Périlleux, A.; Solacroup, T.; Broly, H. Minimizing hydrodynamic stress in mammalian cell culture through the lobed Taylor-Couette bioreactor. Biotechnol. J. 2011, 6, 1504–1515. [Google Scholar] [CrossRef]
- Liu, H.; Liu, X.; Wu, B.; YE, L.; Ni, X.; Wang, Q.; Chen, Z. Effects of Hydrodynamics on Aggregates Formation, Growth and Metabolism of HEK 293 Cells in Suspension Culture. Chin. J. Biotechnol. 2006, 22, 101–106. [Google Scholar] [CrossRef]
- Zhan, C.; Bidkhori, G.; Schwarz, H.; Malm, M.; Mebrahtu, A.; Field, R.; Sellick, C.; Hatton, D.; Varley, P.; Mardinoglu, A.; et al. Low Shear Stress Increases Recombinant Protein Production and High Shear Stress Increases Apoptosis in Human Cells. iScience 2020, 23, 101653. [Google Scholar] [CrossRef] [PubMed]
- Godoy-Silva, R.; Chalmers, J.J.; Casnocha, S.A.; Bass, L.A.; Ma, N. Physiological responses of CHO cells to repetitive hydrodynamic stress. Biotechnol. Bioeng. 2009, 103, 1103–1117. [Google Scholar] [CrossRef] [PubMed]
- Chalmers, J.J. Mixing, aeration and cell damage, 30+ years later: What we learned, how it affected the cell culture industry and what we would like to know more about. Curr. Opin. Chem. Eng. 2015, 10, 94–102. [Google Scholar] [CrossRef]
- Tzima, E. Role of Small GTPases in Endothelial Cytoskeletal Dynamics and the Shear Stress Response. Circ. Res. 2006, 98, 176–185. [Google Scholar] [CrossRef]
- Verma, D.; Ye, N.; Meng, F.; Sachs, F.; Rahimzadeh, J.; Hua, S.Z. Interplay between Cytoskeletal Stresses and Cell Adaptation under Chronic Flow. PLoS ONE 2012, 7, e44167. [Google Scholar] [CrossRef]
- Guo, F.; Li, P.; French, J.B.; Mao, Z.; Zhao, H.; Li, S.; Nama, N.; Fick, J.R.; Benkovic, S.J.; Huang, T.J. Controlling cell-cell interactions using surface acoustic waves. Proc. Natl. Acad. Sci. USA 2015, 112, 43–48. [Google Scholar] [CrossRef]
- Altenburg, J.J.; Klaverdijk, M.; Cabosart, D.; Desmecht, L.; Brunekreeft-Terlouw, S.S.; Both, J.; Tegelbeckers, V.I.; Willekens, M.L.; van Oosten, L.; Hick, T.A.; et al. Real-time online monitoring of insect cell proliferation and baculovirus infection using digital differential holographic microscopy and machine learning. Biotechnol. Prog. 2022, 39, e3318. [Google Scholar] [CrossRef] [PubMed]
- Willard, S.; Sha, M. Solving the Aggregation Problem of Human Embryonic Kidney 293 Cells Using the New Brunswick ™ S41i CO2 Incubator Shaker; Technical Report; Eppendorf, Inc: Hamburg, Germany, 2015. [Google Scholar]
- Menter, F.R. Two-equation eddy-viscosity turbulence models for engineering applications. AIAA J. 1994, 32, 1598–1605. [Google Scholar] [CrossRef]
- Wilcox, D.C. Turbulence Modeling for CFD, 3rd ed.; DCW Industries, Inc.: La Canada, CA, USA, 2006; p. 522. [Google Scholar]
- Launder, B.; Spalding, D. The numerical computation of turbulent flows. Comput. Methods Appl. Mech. Eng. 1974, 3, 269–289. [Google Scholar] [CrossRef]

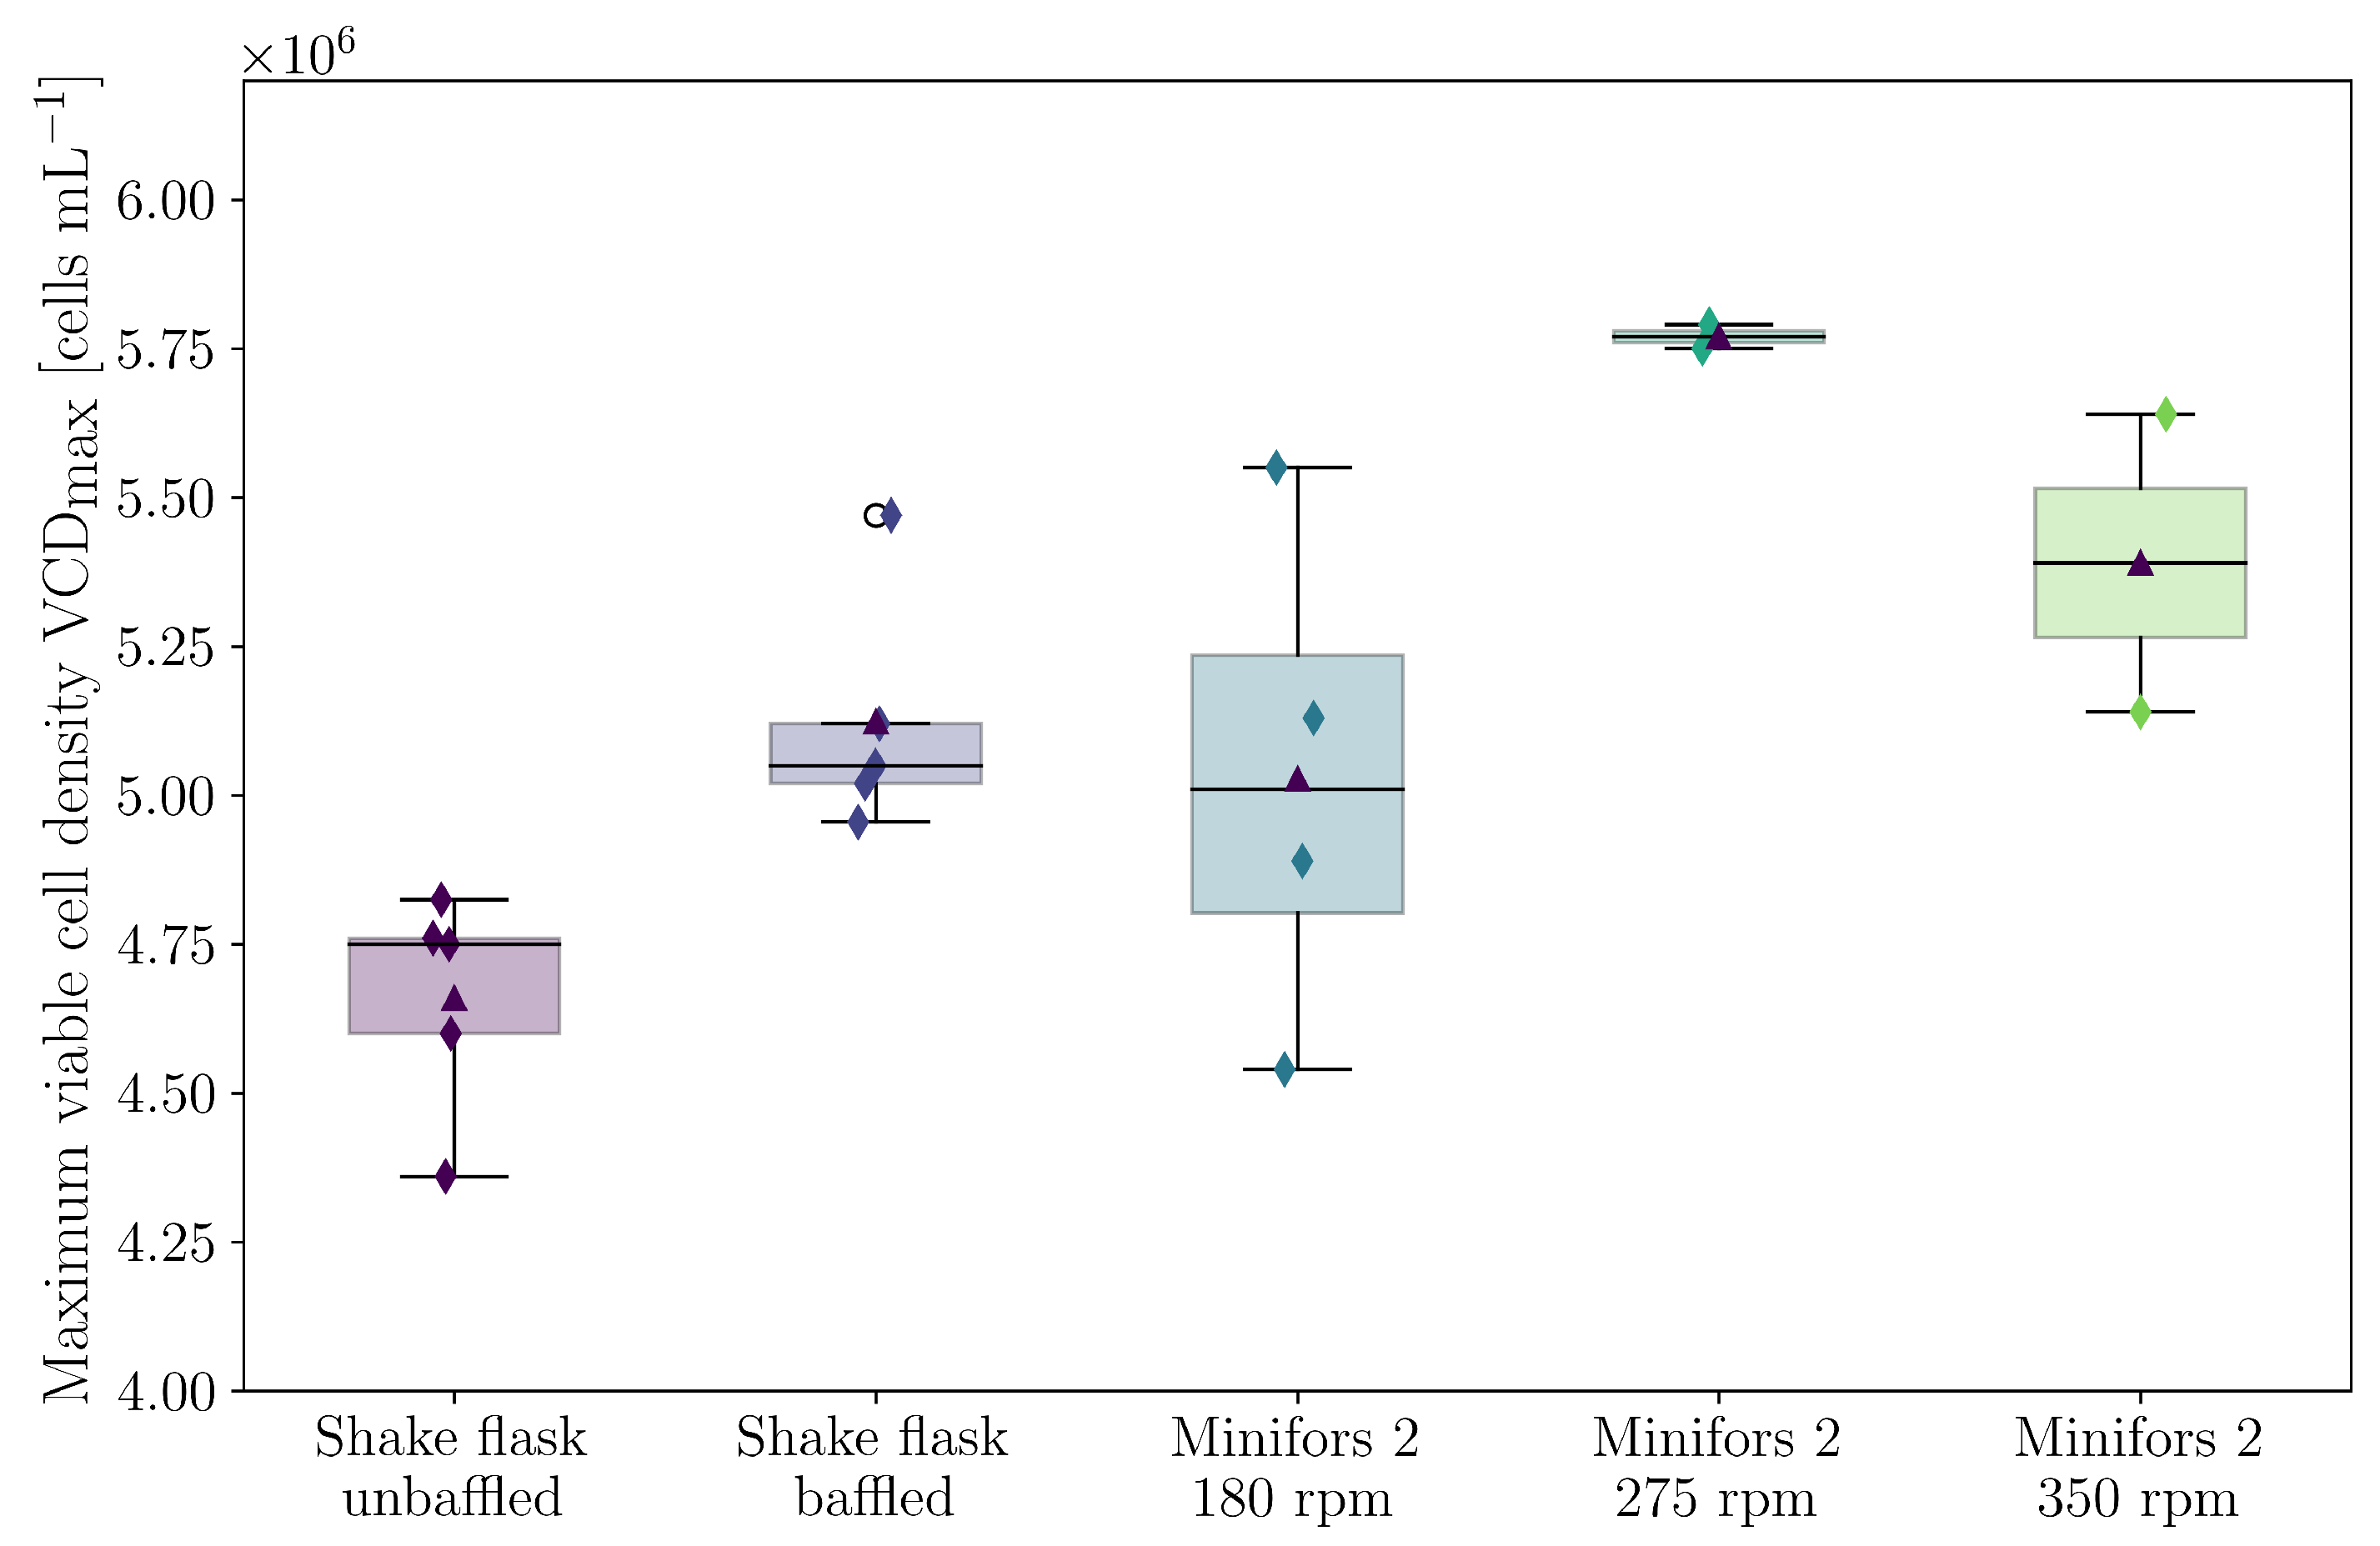
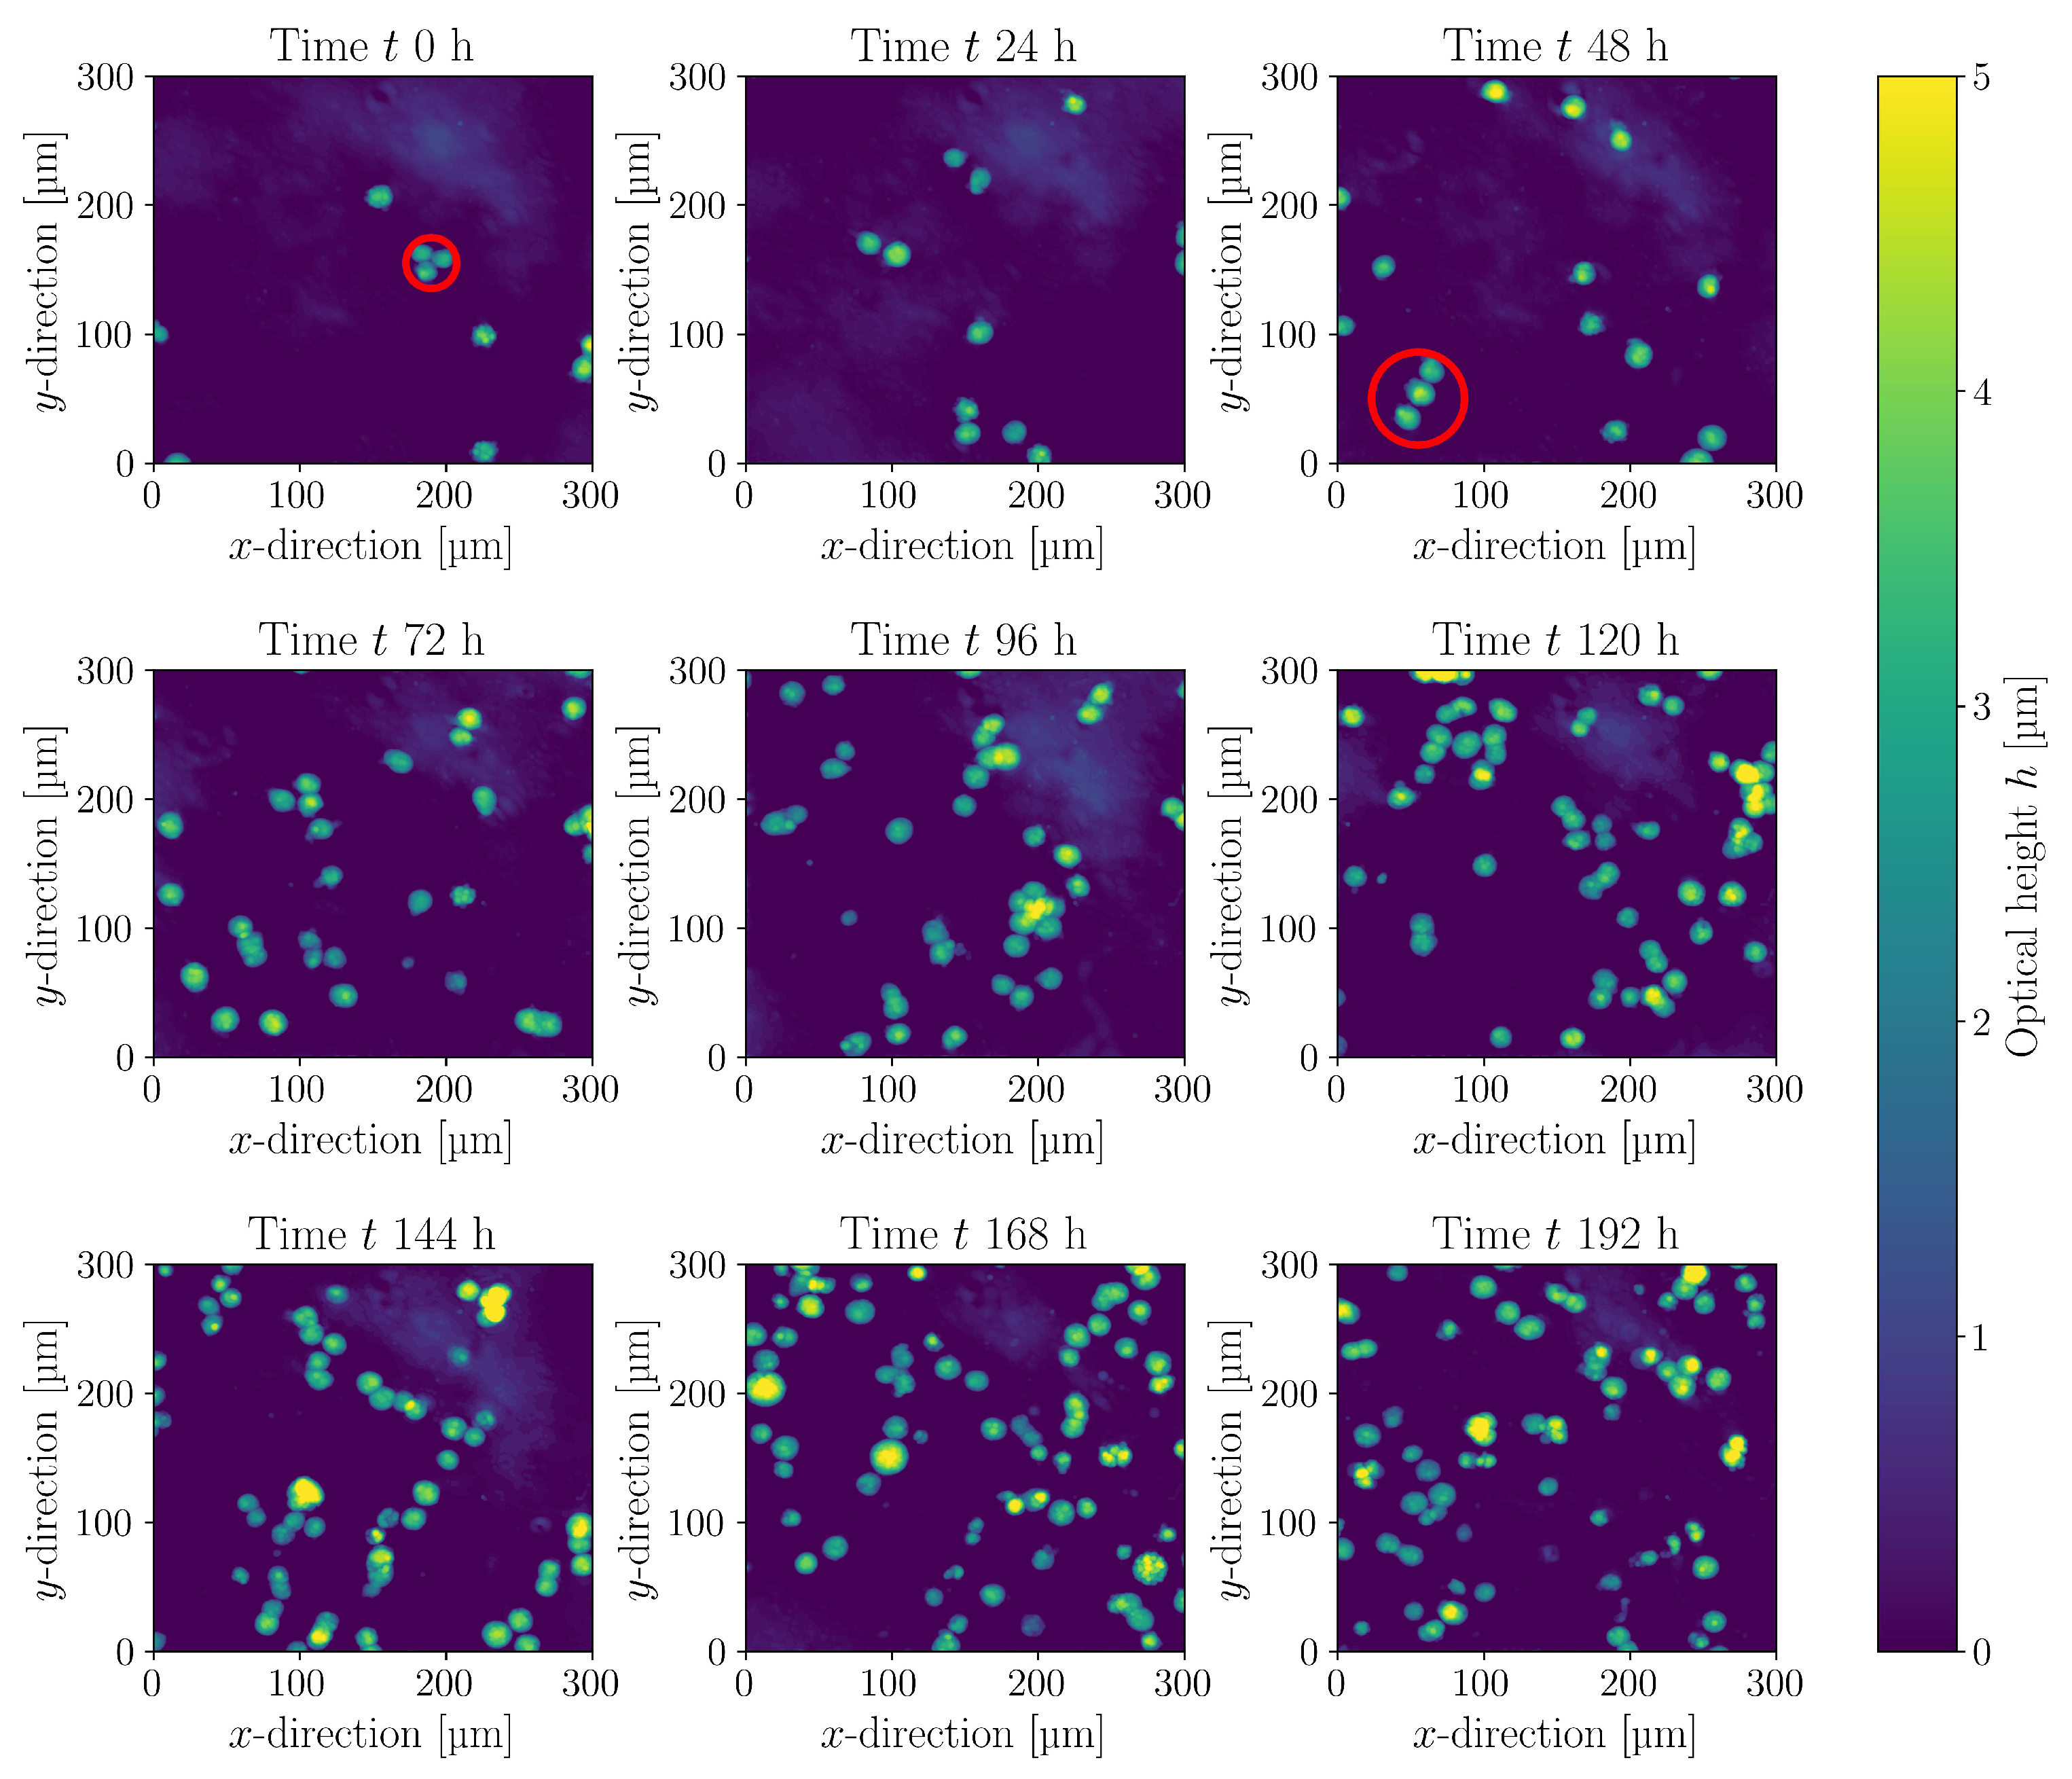

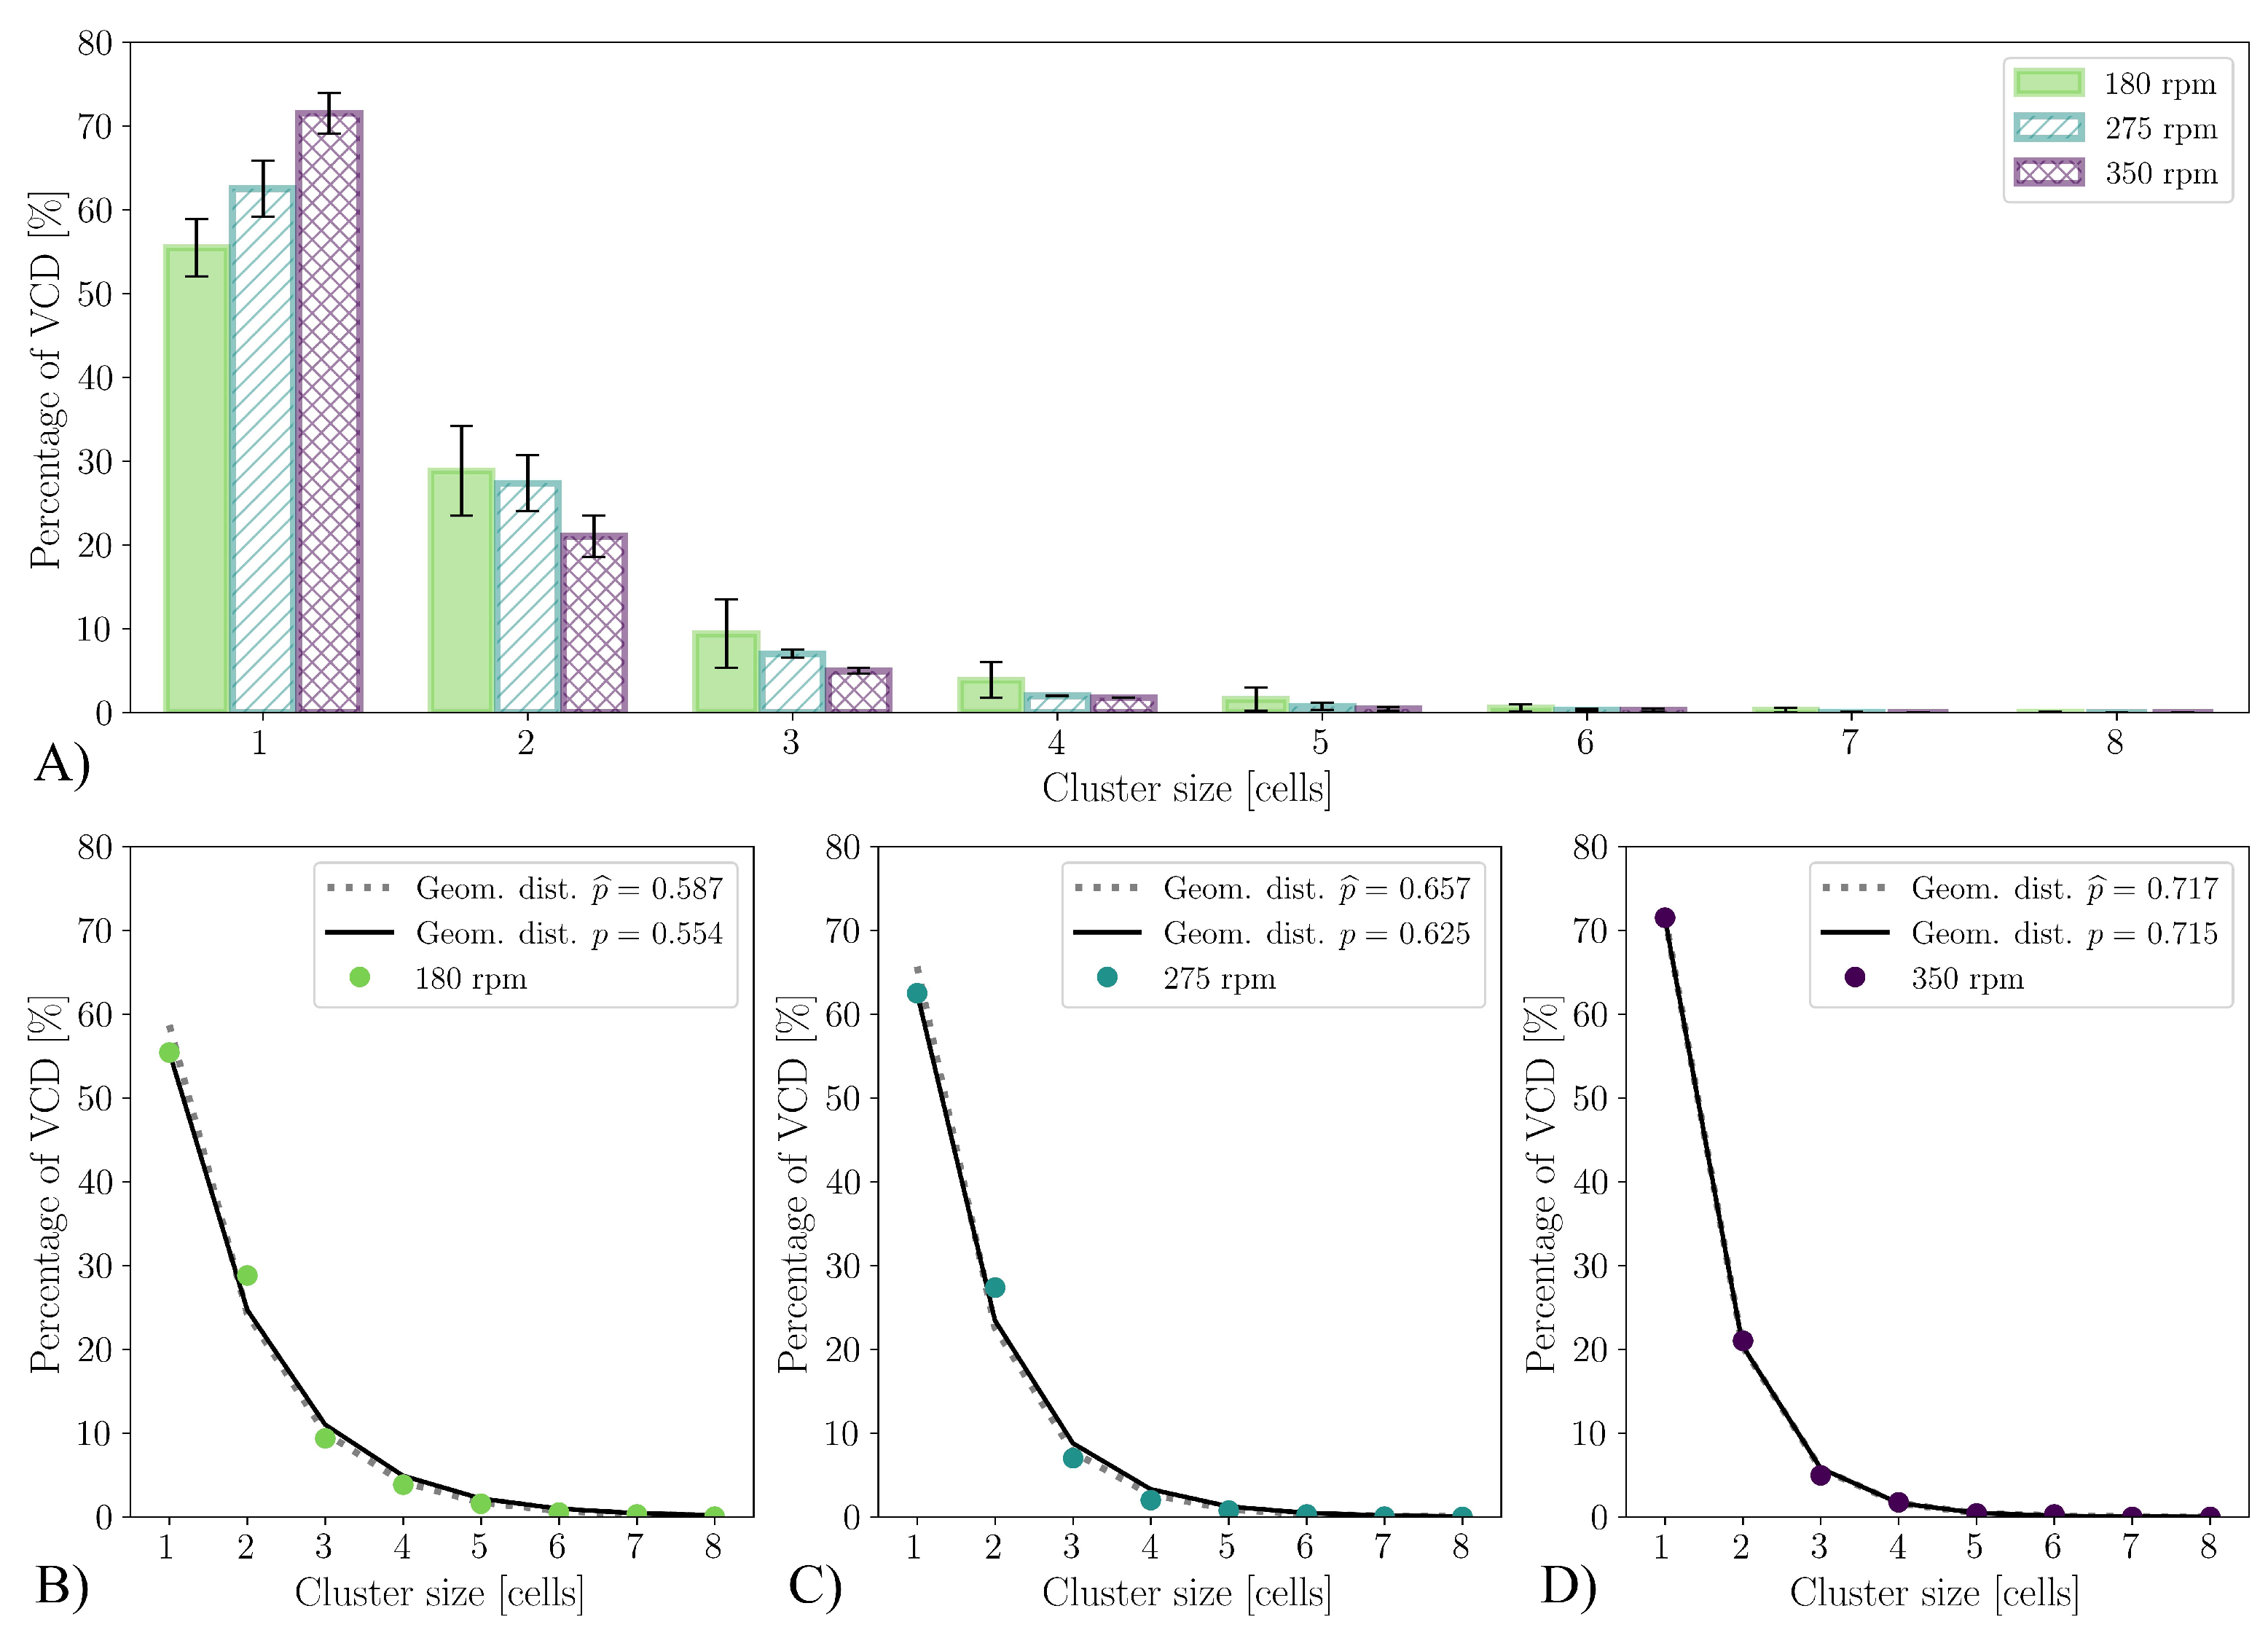
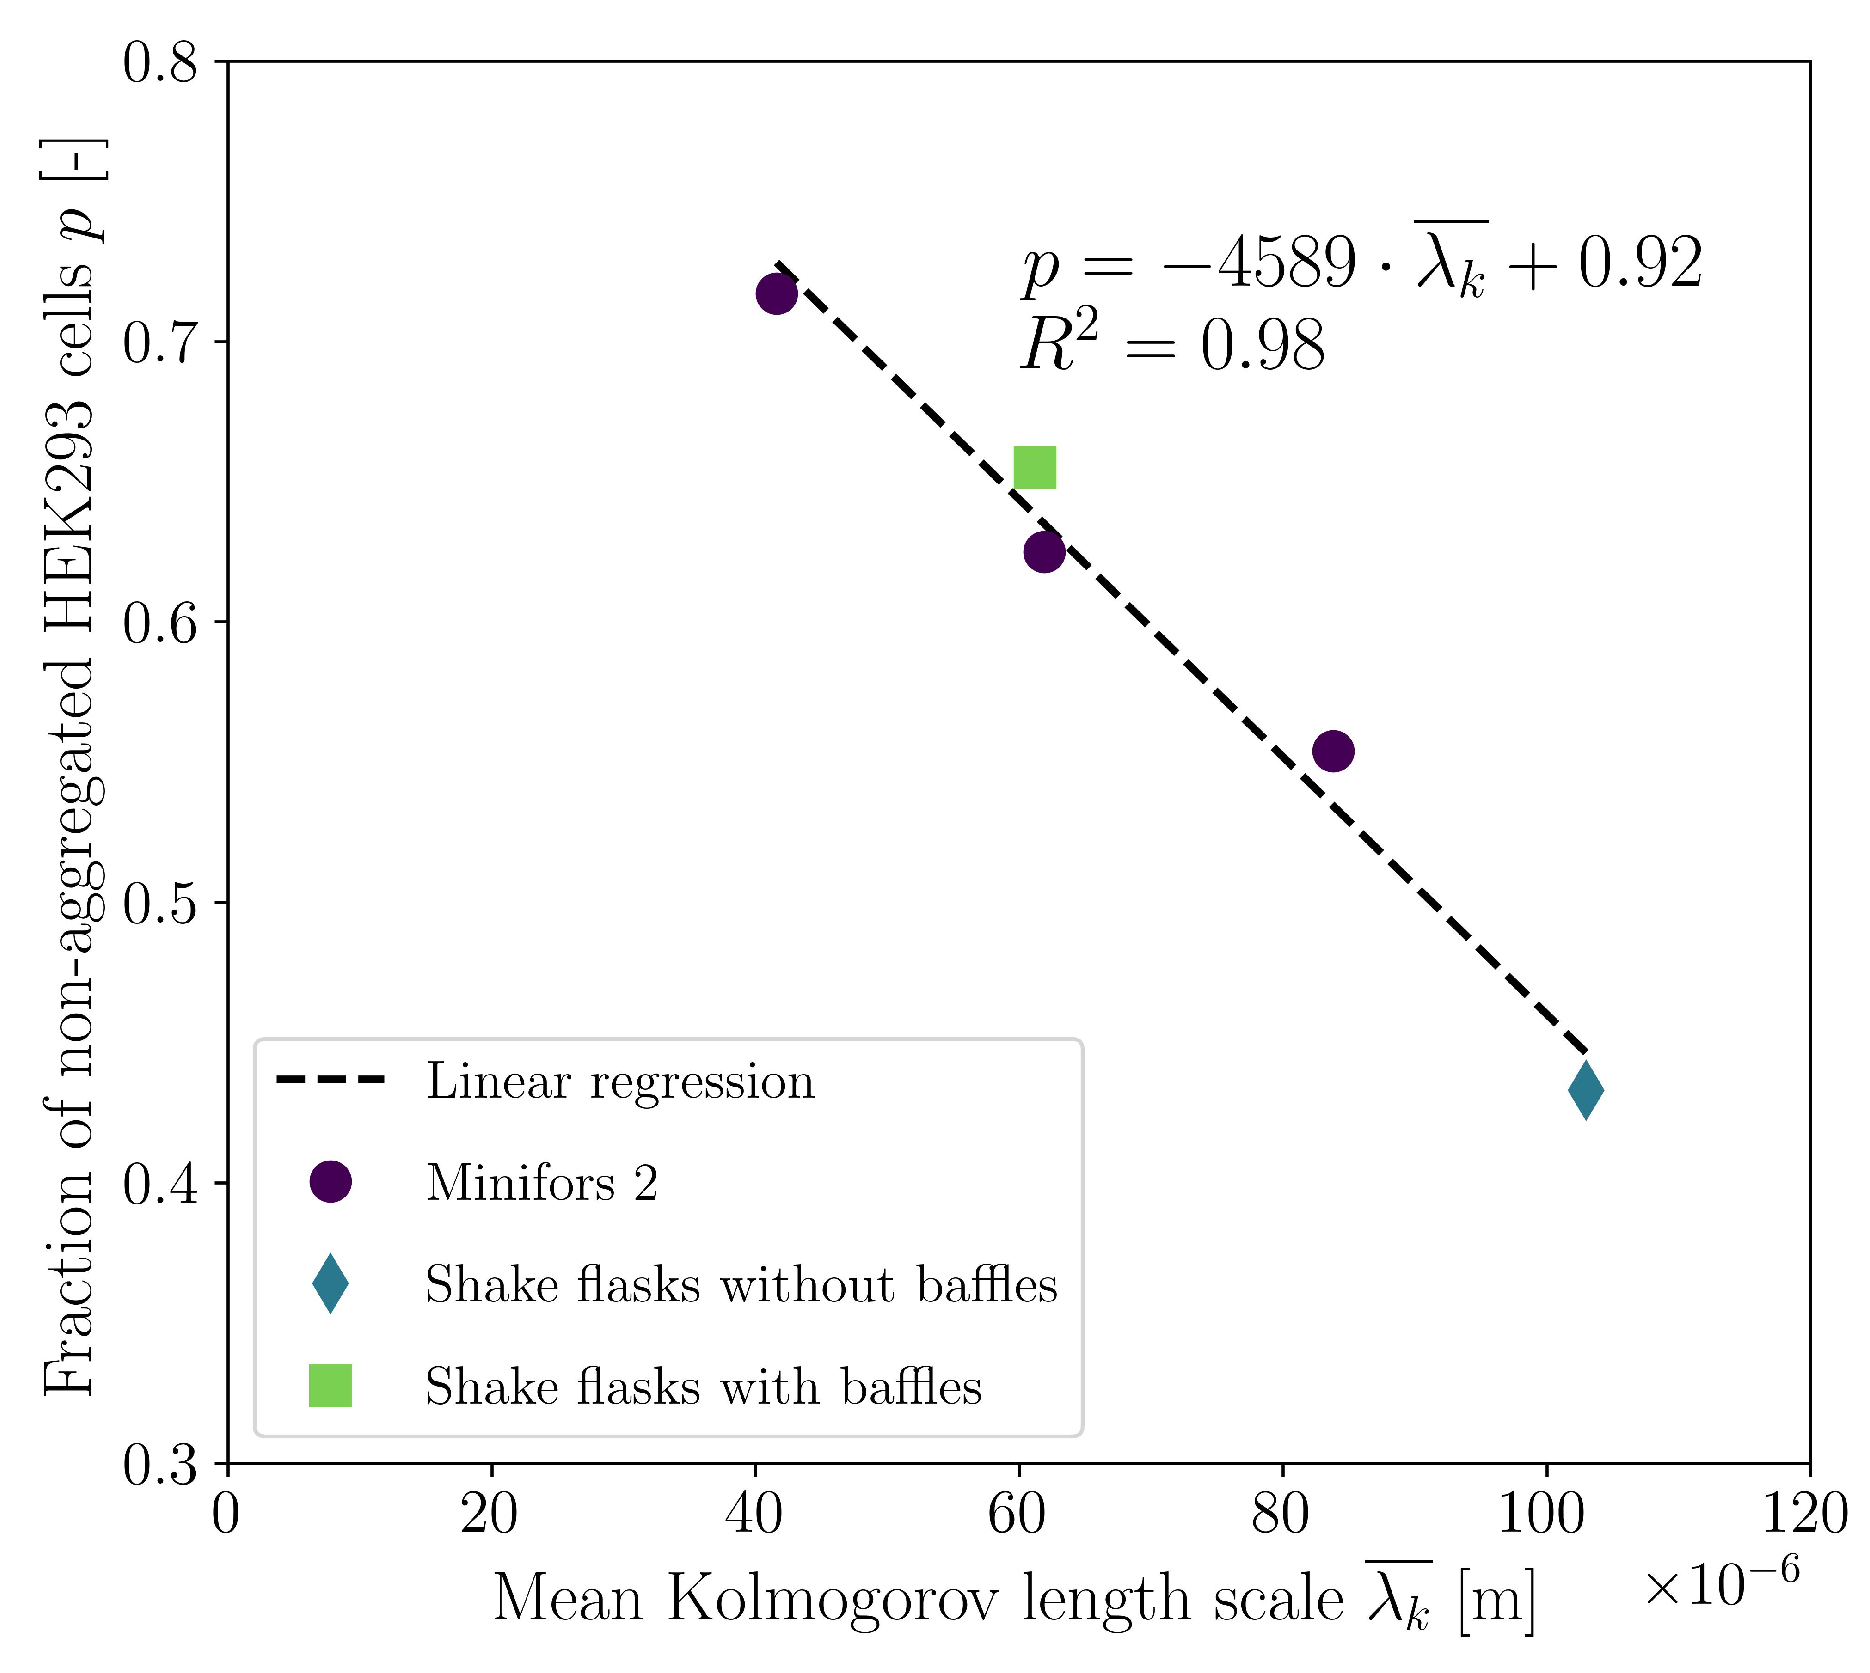
| Case | Mesh | GCI [%] | ||||
|---|---|---|---|---|---|---|
| Case 1 | M1-M2 | 1.24 | 1.95 | 7.81 | 0.36 | |
| M2-M3 | 1.19 | 14.39 | ||||
| Case 2 | M2-M3 | 1.19 | 1.67 | 17.21 | 0.73 | |
| M3-M4 | 1.16 | 17.65 | ||||
| Case 3 | M3-M4 | 1.16 | 2.35 | 11.88 | 1.20 | |
| M4-M5 | 1.14 | 6.96 |
| Cultivation System | Shapiro–Wilk Test | Levene Test | Bartlett Test | Student’s t-Test | |||||||
|---|---|---|---|---|---|---|---|---|---|---|---|
| [-] | [ ] | [ ] | W | L | |||||||
| Unbaffled | 5 | 0.870 | 0.816 | 0.000 | 0.985 | 0.026 | 0.873 | 3.767 | 0.003 | ||
| shake flask | |||||||||||
| Baffled | 5 | 0.267 | 0.108 | ||||||||
| shake flask | |||||||||||
| Case | Mesh | GCI [%] | ||||
|---|---|---|---|---|---|---|
| Case 1 | M1-M2 | 1.27 | 0.31 | 69.01 | 2.50 | |
| M2-M3 | 1.20 | 25.72 | ||||
| Case 2 | M2-M3 | 1.22 | 1.31 | 5.45 | 0.93 | |
| M3-M4 | 1.17 | 4.55 |
Disclaimer/Publisher’s Note: The statements, opinions and data contained in all publications are solely those of the individual author(s) and contributor(s) and not of MDPI and/or the editor(s). MDPI and/or the editor(s) disclaim responsibility for any injury to people or property resulting from any ideas, methods, instructions or products referred to in the content. |
© 2023 by the authors. Licensee MDPI, Basel, Switzerland. This article is an open access article distributed under the terms and conditions of the Creative Commons Attribution (CC BY) license (https://creativecommons.org/licenses/by/4.0/).
Share and Cite
Seidel, S.; Maschke, R.W.; Mozaffari, F.; Eibl-Schindler, R.; Eibl, D. Improvement of HEK293 Cell Growth by Adapting Hydrodynamic Stress and Predicting Cell Aggregate Size Distribution. Bioengineering 2023, 10, 478. https://doi.org/10.3390/bioengineering10040478
Seidel S, Maschke RW, Mozaffari F, Eibl-Schindler R, Eibl D. Improvement of HEK293 Cell Growth by Adapting Hydrodynamic Stress and Predicting Cell Aggregate Size Distribution. Bioengineering. 2023; 10(4):478. https://doi.org/10.3390/bioengineering10040478
Chicago/Turabian StyleSeidel, Stefan, Rüdiger W. Maschke, Fruhar Mozaffari, Regine Eibl-Schindler, and Dieter Eibl. 2023. "Improvement of HEK293 Cell Growth by Adapting Hydrodynamic Stress and Predicting Cell Aggregate Size Distribution" Bioengineering 10, no. 4: 478. https://doi.org/10.3390/bioengineering10040478
APA StyleSeidel, S., Maschke, R. W., Mozaffari, F., Eibl-Schindler, R., & Eibl, D. (2023). Improvement of HEK293 Cell Growth by Adapting Hydrodynamic Stress and Predicting Cell Aggregate Size Distribution. Bioengineering, 10(4), 478. https://doi.org/10.3390/bioengineering10040478


