
Kolmogorov–Arnold Network Model Integrated with Hypoxia Risk for Predicting PD-L1 Inhibitor Responses in Hepatocellular Carcinoma


Abstract

1. Introduction
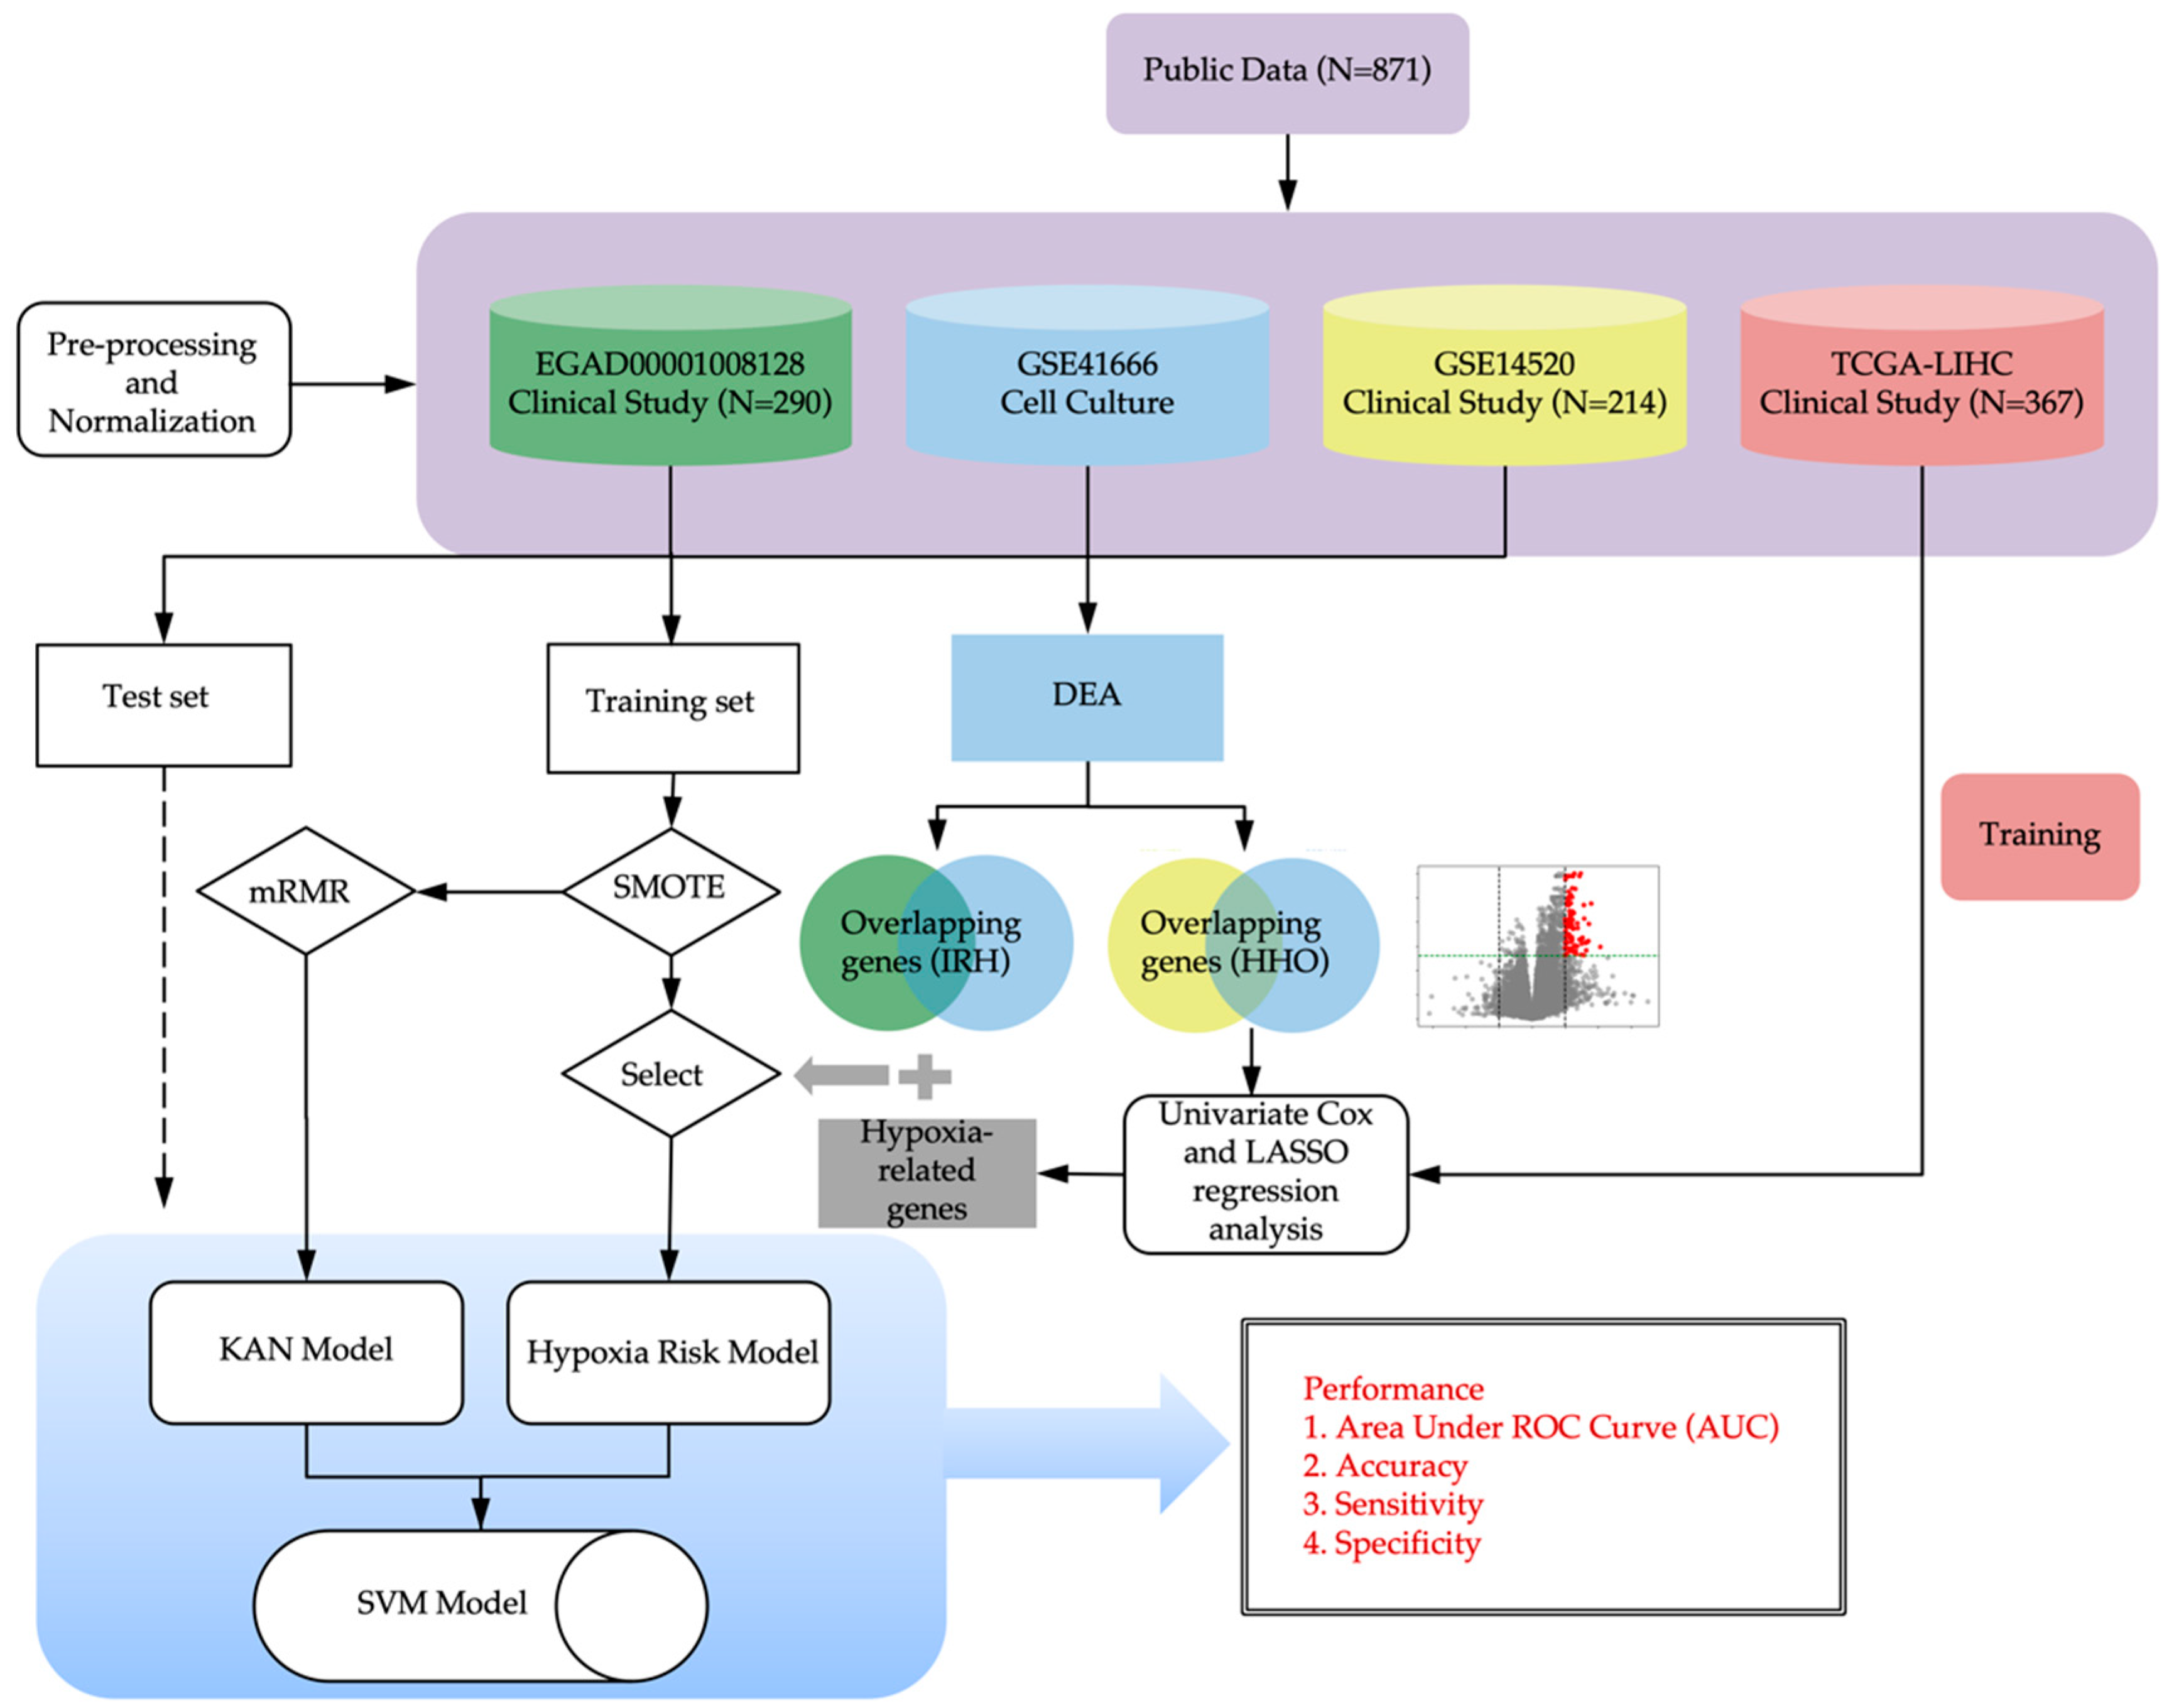
2. Methods
2.1. Data Collection and Preprocessing
2.1.1. Clinical Datasets
2.1.2. Cell Culture Datasets
2.1.3. Pre-Processing of RNA Sequencing Raw Data
2.1.4. Normalization of Gene Expression Data
2.2. Feature Selection
2.2.1. Differential Expression Analysis
2.2.2. Enrichment Analysis
2.3. Model Development
2.3.1. Oversampling of Imbalanced Data
2.3.2. Hypoxia Scoring Model Associated with Drug Response
2.3.3. Model Validation
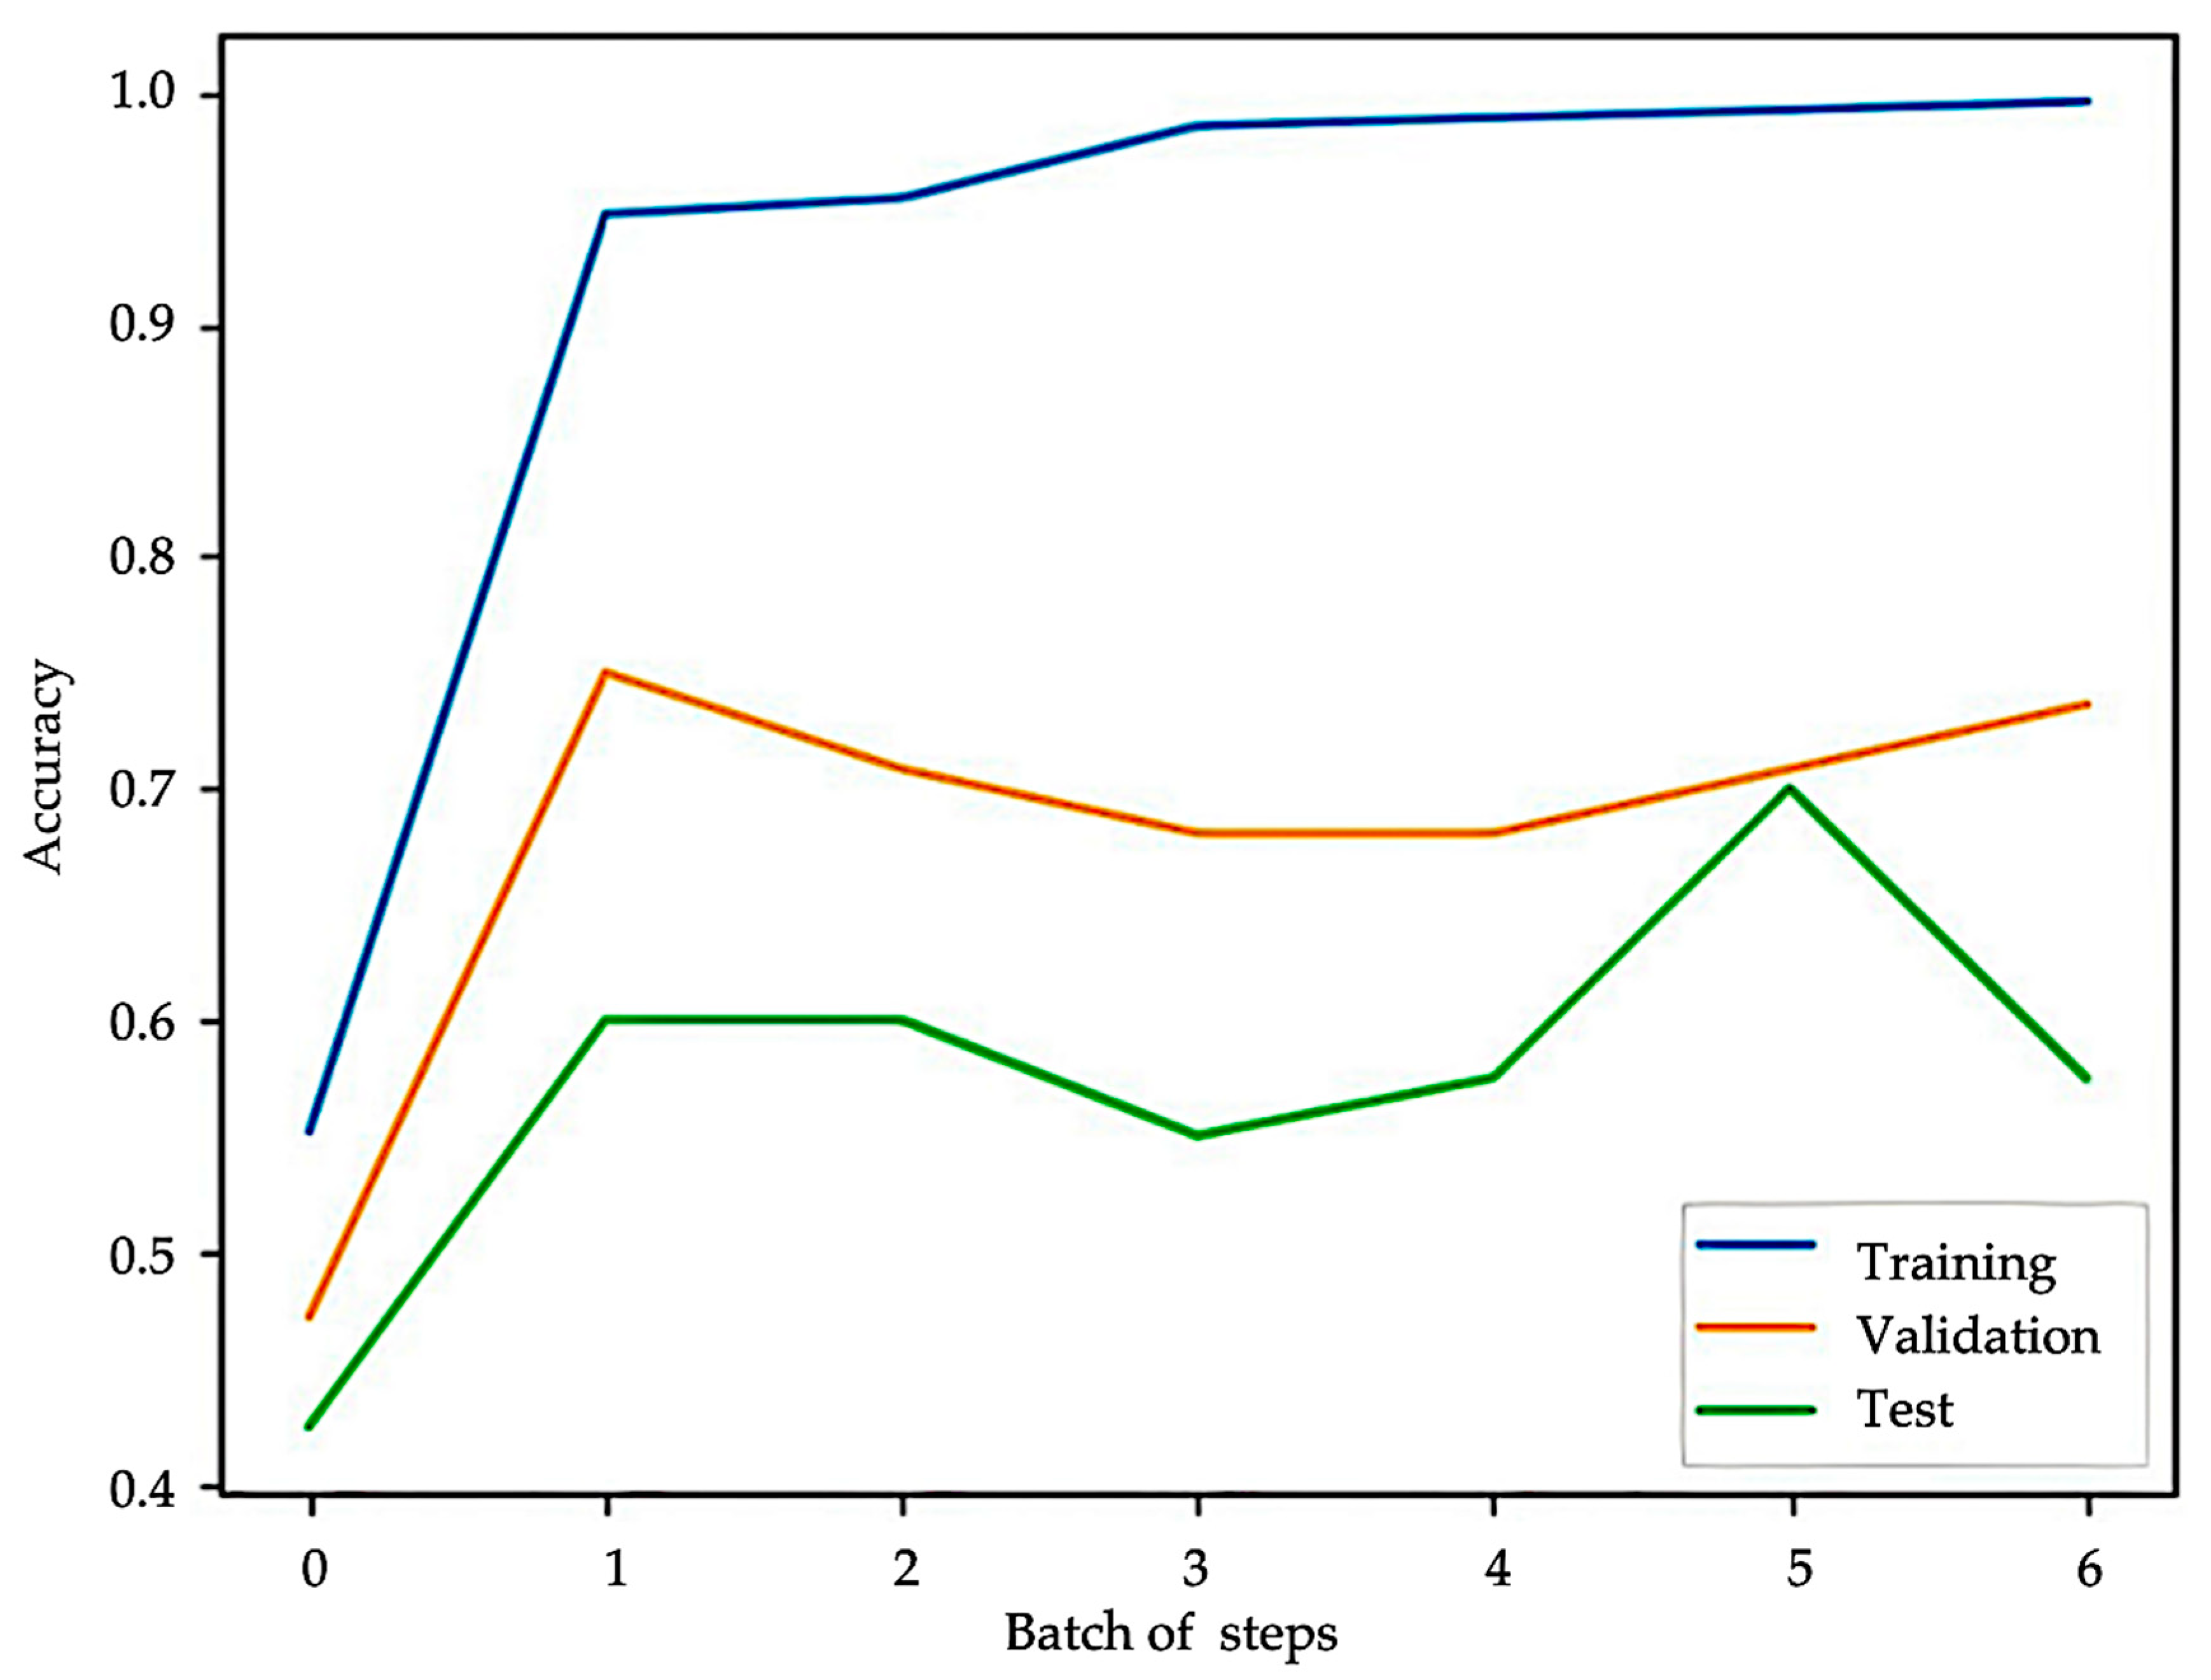
2.3.4. KAN Model Architecture and Training
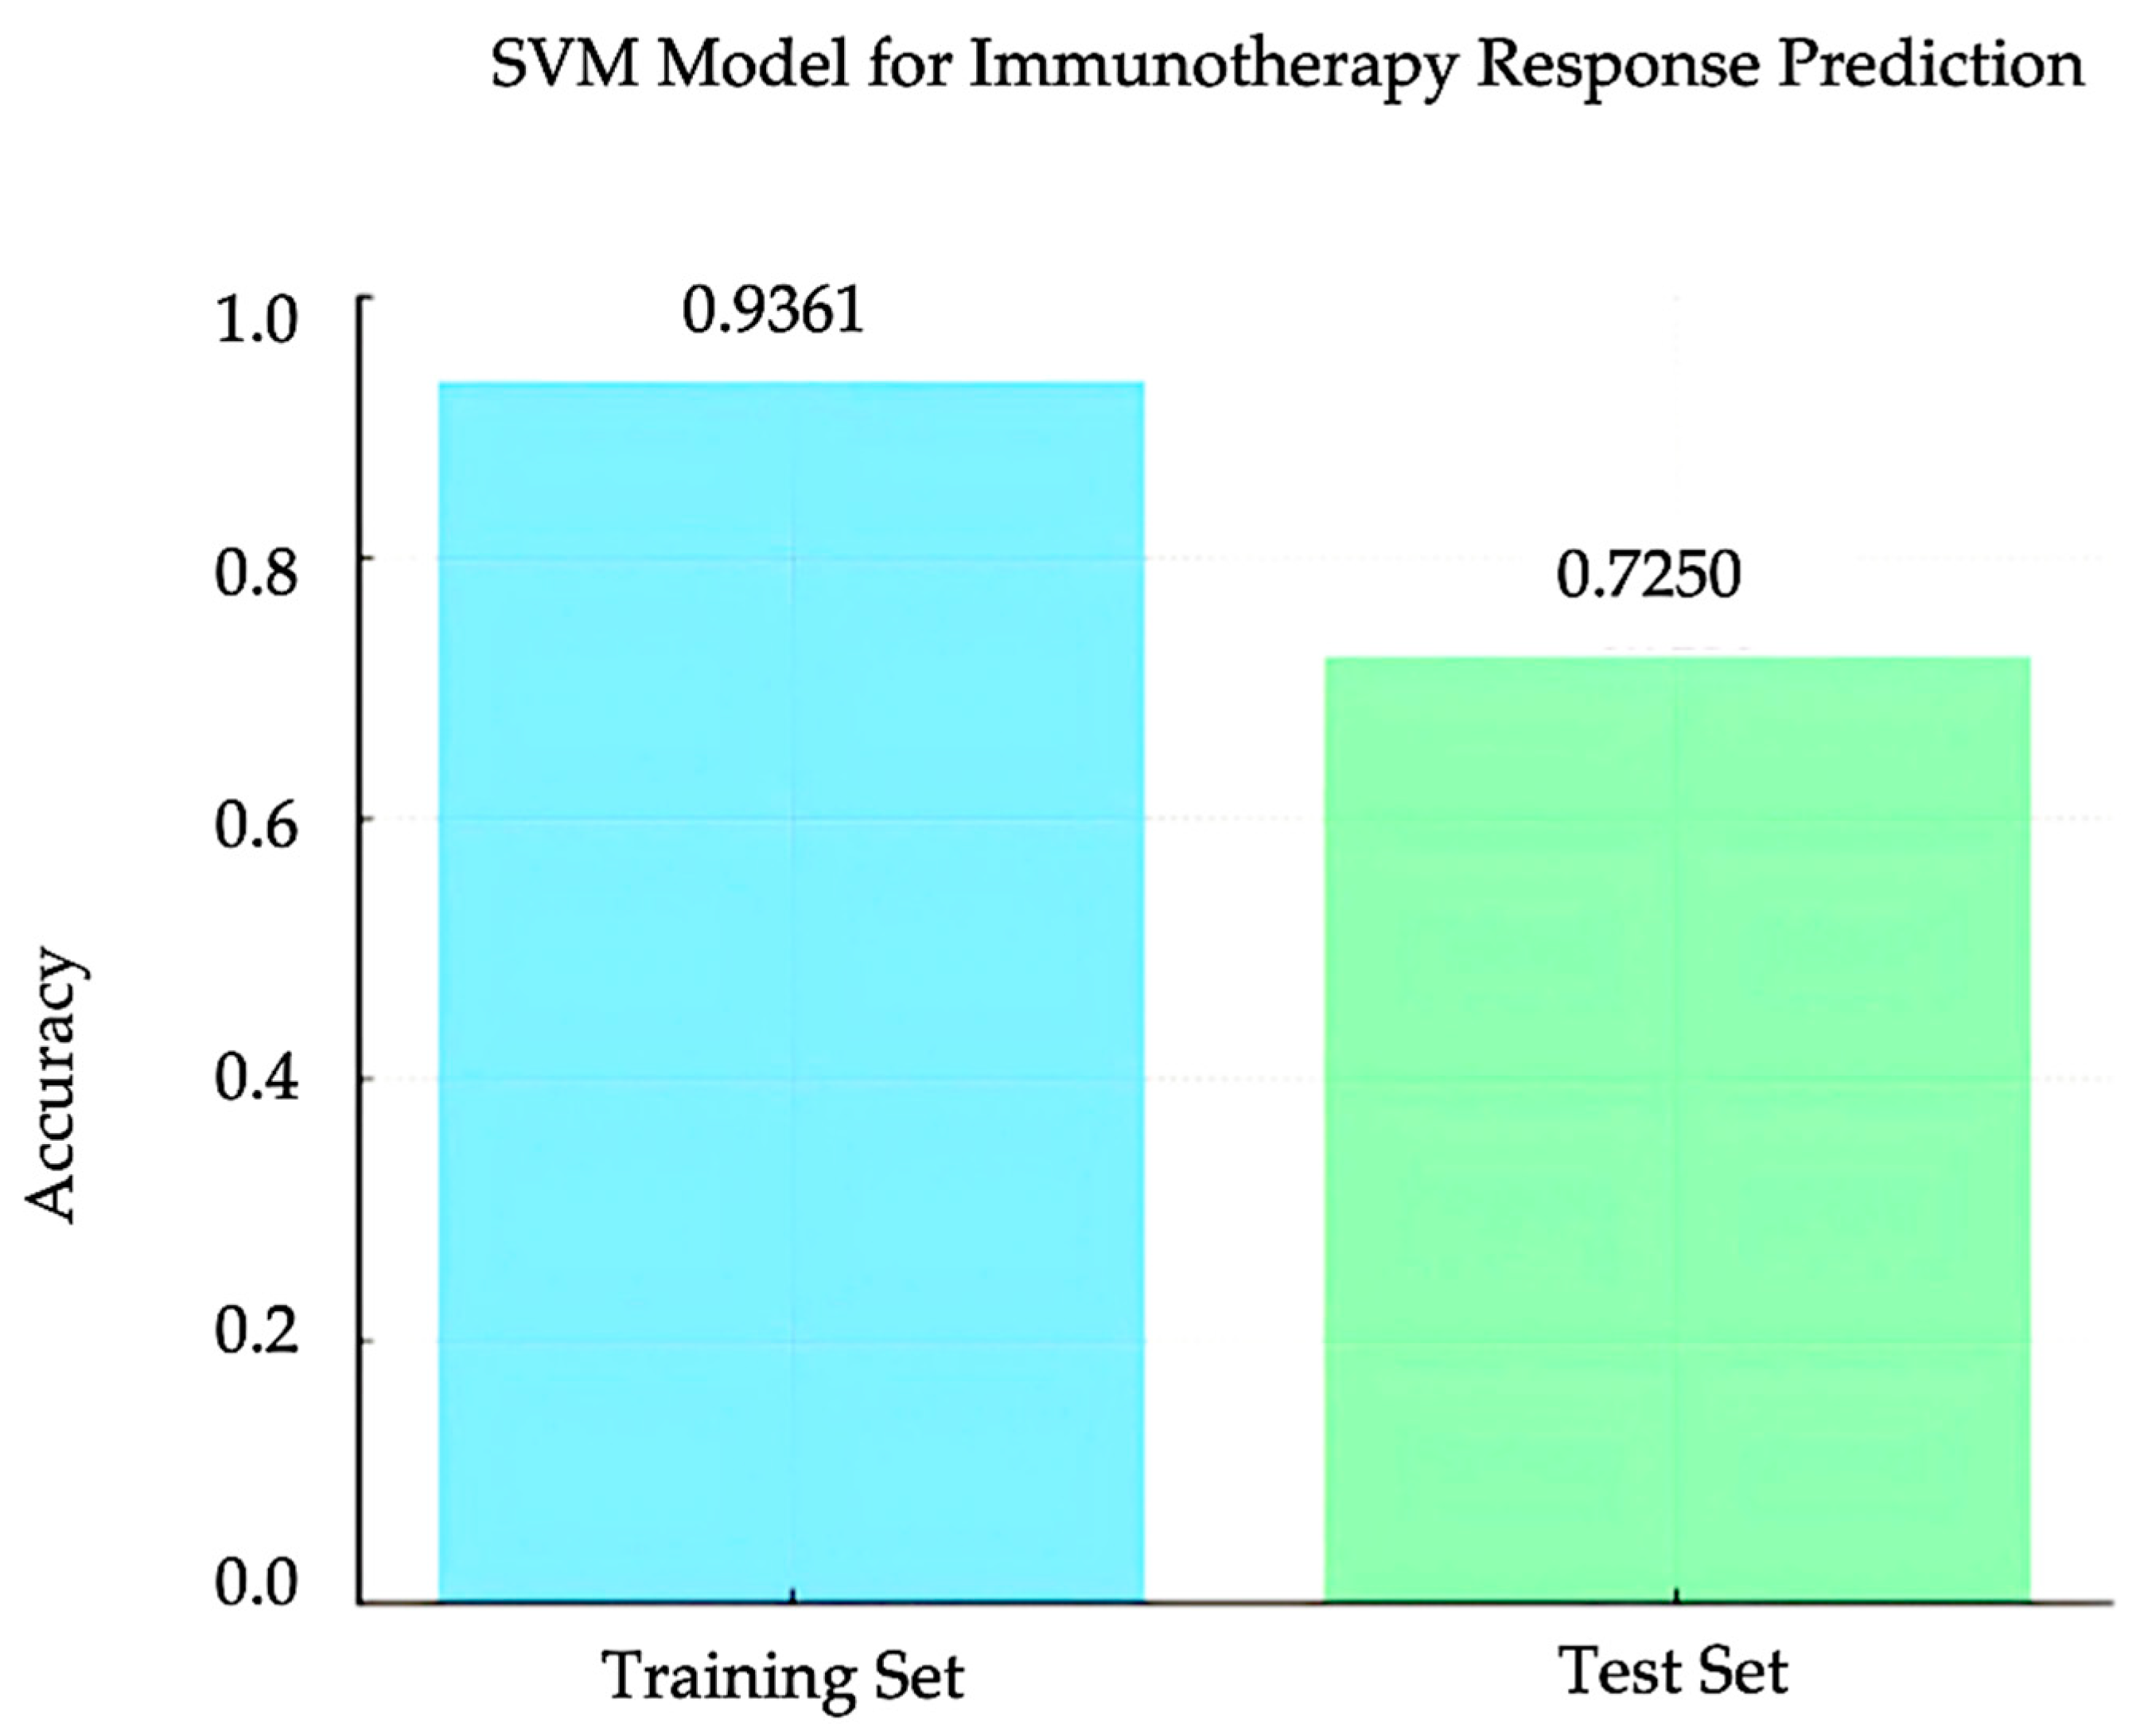
2.3.5. SVM Model
3. Results
3.1. Identification of IRH and HHO Genes from Public Dataset
3.2. Hypoxia Scoring Model
3.3. Feature Selection and KAN Model
3.4. SVM Model for Immunotherapy Response Prediction
4. Discussion
5. Conclusions
Author Contributions
Funding
Data Availability Statement
Conflicts of Interest
References
- Ayuso, C.; Rimola, J.; Vilana, R.; Burrel, M.; Darnell, A.; García-Criado, Á.; Bianchi, L.; Belmonte, E.; Caparroz, C.; Barrufet, M.; et al. Diagnosis and staging of hepatocellular carcinoma (HCC): Current guidelines. Eur. J. Radiol. 2018, 101, 72–81. [Google Scholar] [CrossRef] [PubMed]
- Llovet, J.M.; Pinyol, R.; Kelley, R.K.; El-Khoueiry, A.; Reeves, H.L.; Wang, X.W.; Gores, G.J.; Villanueva, A. Molecular pathogenesis and systemic therapies for hepatocellular carcinoma. Nat. Cancer 2022, 3, 386–401. [Google Scholar] [CrossRef] [PubMed]
- Hsu, C.; Rimassa, L.; Sun, H.C.; Vogel, A.; Kaseb, A.O. Immunotherapy in hepatocellular carcinoma: Evaluation and management of adverse events associated with atezolizumab plus bevacizumab. Ther. Adv. Med. Oncol. 2021, 13, 17588359211031141. [Google Scholar] [CrossRef]
- Shen, K.-Y.; Zhu, Y.; Xie, S.-Z.; Qin, L.-X. Immunosuppressive tumor microenvironment and immunotherapy of hepatocellular carcinoma: Current status and prospectives. J. Hematol. Oncol. 2024, 17, 25. [Google Scholar] [CrossRef]
- Carloni, R.; Sabbioni, S.; Rizzo, A.; Ricci, A.D.; Palloni, A.; Petrarota, C.; Cusmai, A.; Tavolari, S.; Gadaleta-Caldarola, G.; Brandi, G. Immune-Based Combination Therapies for Advanced Hepatocellular Carcinoma. J. Hepatocell. Carcinoma 2023, 10, 1445–1463. [Google Scholar] [CrossRef]
- Cheon, J.; Jung, S.; Kim, J.S.; Kang, B.; Kim, H.; Chan, L.L.; Becker, L.; Gaillard, V.E.; Chan, S.L.; Kim, C.; et al. Organ-specific responses to atezolizumab plus bevacizumab in advanced hepatocellular carcinoma: A multicentre, retrospective study. Liver Int. 2024, 44, 1961–1970. [Google Scholar] [CrossRef]
- Lim, M.; Espinoza, M.; Huang, Y.H.; Franses, J.; Zhu, H.; Hsiehchen, D. Complete Response to Immunotherapy in Patients With Hepatocellular Carcinoma. JAMA Netw. Open 2025, 8, e2461735. [Google Scholar] [CrossRef]
- Oura, K.; Morishita, A.; Tani, J.; Masaki, T. Tumor Immune Microenvironment and Immunosuppressive Therapy in Hepatocellular Carcinoma: A Review. Int. J. Mol. Sci. 2021, 22, 5801. [Google Scholar] [CrossRef] [PubMed]
- Bloom, M.; Podder, S.; Dang, H.; Lin, D. Advances in Immunotherapy in Hepatocellular Carcinoma. Int. J. Mol. Sci. 2025, 26, 1936. [Google Scholar] [CrossRef]
- Zeng, F.; Zhang, Y.; Han, X.; Zeng, M.; Gao, Y.; Weng, J. Employing hypoxia characterization to predict tumour immune microenvironment, treatment sensitivity and prognosis in hepatocellular carcinoma. Comput. Struct. Biotechnol. J. 2021, 19, 2775–2789. [Google Scholar] [CrossRef]
- Dai, X.; Pi, G.; Yang, S.L.; Chen, G.G.; Liu, L.P.; Dong, H.H. Association of PD-L1 and HIF-1α Coexpression with Poor Prognosis in Hepatocellular Carcinoma. Transl. Oncol. 2018, 11, 559–566. [Google Scholar] [CrossRef] [PubMed]
- Cheng, B.; Zhou, P.; Chen, Y. Machine-learning algorithms based on personalized pathways for a novel predictive model for the diagnosis of hepatocellular carcinoma. BMC Bioinform. 2022, 23, 248. [Google Scholar] [CrossRef]
- Huang, M.; Yang, S.; Tai, W.C.S.; Zhang, L.; Zhou, Y.; Cho, W.C.S.; Chan, L.W.C.; Wong, S.C.C. Bioinformatics Identification of Regulatory Genes and Mechanism Related to Hypoxia-Induced PD-L1 Inhibitor Resistance in Hepatocellular Carcinoma. Int. J. Mol. Sci. 2023, 24, 8720. [Google Scholar] [CrossRef] [PubMed]
- Liu, Z.; Wang, Y.; Vaidya, S.; Ruehle, F.; Halverson, J.; Soljacic, M.; Hou, T.Y.; Tegmark, M. KAN: Kolmogorov-Arnold Networks. arXiv 2024, arXiv:2404.19756. [Google Scholar] [CrossRef]
- Hou, Y.; Zhang, D.; Wu, J.; Feng, X. A Comprehensive Survey on Kolmogorov Arnold Networks (KAN). arXiv 2024, arXiv:2407.11075. [Google Scholar] [CrossRef]
- Jiang, G.; Zheng, J.Y.; Ren, S.N.; Yin, W.; Xia, X.; Li, Y.; Wang, H.L. A comprehensive workflow for optimizing RNA-seq data analysis. BMC Genom. 2024, 25, 631. [Google Scholar] [CrossRef]
- Chawla, N.; Bowyer, K.; Hall, L.O.; Kegelmeyer, W.P. SMOTE: Synthetic Minority Over-sampling Technique. arXiv 2002, arXiv:1106.1813. [Google Scholar] [CrossRef]
- Pradipta, G.A.; Wardoyo, R.; Musdholifah, A.; Sanjaya, I.N.H.; Ismail, M. SMOTE for Handling Imbalanced Data Problem: A Review. In Proceedings of the 2021 Sixth International Conference on Informatics and Computing (ICIC), Jakarta, Indonesia, 3–4 November 2021; pp. 1–8. [Google Scholar]
- Mohan, H.; Chan, W.C. Machine learning identification of hypoxia-related genes and prognostic risk-scoring model for effective survival stratification in hepatocellular carcinoma. J. Clin. Oncol. 2024, 42, e16261. [Google Scholar] [CrossRef]
- Jing, X.; Yang, F.; Shao, C.; Wei, K.; Xie, M.; Shen, H.; Shu, Y. Role of hypoxia in cancer therapy by regulating the tumor microenvironment. Mol. Cancer 2019, 18, 157. [Google Scholar] [CrossRef]
- Suzuki, T.; Shinjo, S.; Arai, T.; Kanai, M.; Goda, N. Hypoxia and fatty liver. World J. Gastroenterol. 2014, 20, 15087–15097. [Google Scholar] [CrossRef]
- Yuen, V.W.; Wong, C.C. Hypoxia-inducible factors and innate immunity in liver cancer. J. Clin. Investig. 2020, 130, 5052–5062. [Google Scholar] [CrossRef] [PubMed]
- Park, S.Y.; Jeong, M.S.; Jang, S.B. In vitro binding properties of tumor suppressor p53 with PUMA and NOXA. Biochem. Biophys. Res. Commun. 2012, 420, 350–356. [Google Scholar] [CrossRef] [PubMed]
- Wang, C.; Tan, J.Y.M.; Chitkara, N.; Bhatt, S. TP53 Mutation-Mediated Immune Evasion in Cancer: Mechanisms and Therapeutic Implications. Cancers 2024, 16, 3069. [Google Scholar] [CrossRef]
- Yan, X.; Chen, D.; Wang, Y.; Guo, Y.; Tong, C.; Wei, J.; Zhang, Y.; Wu, Z.; Han, W. Identification of NOXA as a pivotal regulator of resistance to CAR T-cell therapy in B-cell malignancies. Signal Transduct. Target. Ther. 2022, 7, 98. [Google Scholar] [CrossRef] [PubMed]
- Yazdani, Y.; Farazmandfar, T.; Azadeh, H.; Zekavatian, Z. The prognostic effect of PTEN expression status in colorectal cancer development and evaluation of factors affecting it: miR-21 and promoter methylation. J. Biomed. Sci. 2016, 23, 9. [Google Scholar] [CrossRef]
- Sun, T.; Chen, Z.; Wei, K.; Tang, H. [Research Progress on Predictive Biomarkers of Immunotherapy Efficacy in Non-small Cell Lung Cancer]. Zhongguo Fei Ai Za Zhi 2024, 27, 459–465. [Google Scholar] [CrossRef]
- Sun, D.; Liu, J.; Zhou, H.; Shi, M.; Sun, J.; Zhao, S.; Chen, G.; Zhang, Y.; Zhou, T.; Ma, Y.; et al. Classification of Tumor Immune Microenvironment According to Programmed Death-Ligand 1 Expression and Immune Infiltration Predicts Response to Immunotherapy Plus Chemotherapy in Advanced Patients With NSCLC. J. Thorac. Oncol. 2023, 18, 869–881. [Google Scholar] [CrossRef]


| Gene | log HR | log HR SE | HR | t | p | 95% CI Lower | 95%CI Upper |
|---|---|---|---|---|---|---|---|
| PHLDA2 | 0.1497 | 0.0753 | 1.1615 | 1.9887 | 0.0467 | 1.0022 | 1.3462 |
| DLGAP5 | 0.0757 | 0.2695 | 1.0787 | 0.281 | 0.7787 | 0.636 | 1.8293 |
| N4BP2L1 | −0.2318 | 0.1636 | 0.7931 | −1.4163 | 0.1567 | 0.5755 | 1.093 |
| CENPA | 0.099 | 0.227 | 1.104 | 0.4361 | 0.6628 | 0.7076 | 1.7226 |
| UPB1 | −0.0584 | 0.0725 | 0.9433 | −0.8061 | 0.4202 | 0.8184 | 1.0872 |
| CABYR | 0.1509 | 0.0752 | 1.1629 | 2.0063 | 0.0448 | 1.0035 | 1.3476 |
| AFM | −0.0022 | 0.0609 | 0.9978 | −0.0368 | 0.9707 | 0.8856 | 1.1242 |
| HMMR | 0.3139 | 0.1889 | 1.3687 | 1.6618 | 0.0965 | 0.9452 | 1.982 |
| KIF20A | 0.0587 | 0.2379 | 1.0604 | 0.2465 | 0.8053 | 0.6652 | 1.6904 |
| PMAIP1 | −0.1203 | 0.1857 | 0.8866 | −0.648 | 0.517 | 0.6162 | 1.2758 |
| Parameter | Value |
|---|---|
| Number of training processes (batches) | 6 |
| Number of grid intervals | 3–8 |
| Optimizer | L-BFGS algorithm |
| Learning rate | 1 |
| Maximum number of iterations per optimization process | 20 |
| Maximal number of function evaluations per optimization process | 25 |
| Termination tolerance on first-order optimality | 1 × 10⁻⁷ |
| Termination tolerance on function | 1 × 10⁻⁹ |
Disclaimer/Publisher’s Note: The statements, opinions and data contained in all publications are solely those of the individual author(s) and contributor(s) and not of MDPI and/or the editor(s). MDPI and/or the editor(s) disclaim responsibility for any injury to people or property resulting from any ideas, methods, instructions or products referred to in the content. |
© 2025 by the authors. Licensee MDPI, Basel, Switzerland. This article is an open access article distributed under the terms and conditions of the Creative Commons Attribution (CC BY) license (https://creativecommons.org/licenses/by/4.0/).
Share and Cite
Huang, M.; Chen, X.; Jiang, Y.; Chan, L.W.C. Kolmogorov–Arnold Network Model Integrated with Hypoxia Risk for Predicting PD-L1 Inhibitor Responses in Hepatocellular Carcinoma. Bioengineering 2025, 12, 322. https://doi.org/10.3390/bioengineering12030322
Huang M, Chen X, Jiang Y, Chan LWC. Kolmogorov–Arnold Network Model Integrated with Hypoxia Risk for Predicting PD-L1 Inhibitor Responses in Hepatocellular Carcinoma. Bioengineering. 2025; 12(3):322. https://doi.org/10.3390/bioengineering12030322
Chicago/Turabian StyleHuang, Mohan, Xinyue Chen, Yi Jiang, and Lawrence Wing Chi Chan. 2025. "Kolmogorov–Arnold Network Model Integrated with Hypoxia Risk for Predicting PD-L1 Inhibitor Responses in Hepatocellular Carcinoma" Bioengineering 12, no. 3: 322. https://doi.org/10.3390/bioengineering12030322
APA StyleHuang, M., Chen, X., Jiang, Y., & Chan, L. W. C. (2025). Kolmogorov–Arnold Network Model Integrated with Hypoxia Risk for Predicting PD-L1 Inhibitor Responses in Hepatocellular Carcinoma. Bioengineering, 12(3), 322. https://doi.org/10.3390/bioengineering12030322