Article

Flow Characteristics by Blood Speckle Imaging in Non-Stenotic Congenital Aortic Root Disease Surrounding Valve-Preserving Operations

1
Department of Mathematics, KTH Royal Institute of Technology, 114 28 Stockholm, Sweden
2
Congenital Valve Procedural Planning Program, Department of Pediatric Cardiology and Division of Pediatric Cardiac Surgery, The Heart, Vascular, and Thoracic Institute, Cleveland Clinic, Cleveland, OH 44195, USA
3
Department of Pediatric Cardiology, Cleveland Clinic, Cleveland, OH 44195, USA
4
Cardiovascular Innovation Research Center, Department of Cardiovascular Medicine, The Heart, Vascular and Thoracic Institute, Cleveland Clinic, Cleveland, OH 44195, USA
5
Department of Engineering Mechanics, FLOW Research Center, KTH Royal Institute of Technology, 100 44 Stockholm, Sweden
*
Author to whom correspondence should be addressed.
Bioengineering 2025, 12(7), 776; https://doi.org/10.3390/bioengineering12070776
Submission received: 15 May 2025 / Revised: 8 July 2025 / Accepted: 15 July 2025 / Published: 17 July 2025

Abstract

Contemporary evaluation and surgical approaches in congenital aortic valve disease have yielded limited success. The ability to evaluate and understand detailed flow characteristics surrounding surgical repair may be beneficial. This study explores the feasibility and utility of echocardiographic-based blood speckle imaging (BSI) in assessing pre- and post-operative flow characteristics in those with non-stenotic congenital aortic root disease undergoing aortic valve repair or valve-sparing root replacement (VSRR) surgery. Transesophageal echocardiogram was performed during the pre-operative and post-operative assessment surrounding aortic surgery for ten patients with non-stenotic congenital aortic root disease. BSI, utilizing block-matching algorithms, enabled detailed visualization and quantification of flow parameters from the echocardiographic data. Post-operative BSI unveiled enhanced hemodynamic patterns, characterized by quantified changes suggestive of the absence of stenosis and no more than trivial regurgitation. Rectification of an asymmetric jet and the reversal of flow on the posterior aspect of the ascending aorta resulted in a reduced oscillatory shear index ( O S I ) of 0.0543 ± 0.0207 (pre-op) vs. 0.0275 ± 0.0159 (post-op) and p = 0.0044 , increased peak wall shear stress of 1.9423 ± 0.6974 (pre-op) vs. 3.6956 ± 1.4934 (post-op) and p = 0.0035 , and increased time-averaged wall shear stress of 0.6885 ± 0.8004 (pre-op) vs. 0.8312 ± 0.303 (post-op) and p = 0.23 . This correction potentially attenuates cellular alterations within the endothelium. This study demonstrates that children and young adults with non-stenotic congenital aortic root disease undergoing valve-preserving operations experience significant improvements in flow dynamics within the left ventricular outflow tract and aortic root, accompanied by a reduction in O S I . These hemodynamic enhancements extend beyond the conventional echocardiographic assessments, offering immediate and valuable insights into the efficacy of surgical interventions.

Graphical Abstract

1. Introduction

Aortic valve repair or preservation has emerged as a preferred option for addressing congenital aortic root pathologies in children and young adults. However, achieving successful outcomes hinges upon a comprehensive grasp of the intricate anatomy of the congenitally malformed aortic root and its valve, and the understanding and technical proficiency to restore normal valve geometry and mechanics [1]. Accurately assessing the repaired valve holds paramount importance in appraising immediate surgical outcomes and optimizing post-operative care. While traditional echocardiographic techniques offer valuable insights, they may falter in capturing nuanced hemodynamic characteristics, which may enhance understanding [2].
Continuous-wave Doppler echocardiography stands as a cornerstone in clinical practice for assessing the severity of aortic stenosis. This method entails the measurement of peak blood flow velocity traversing the aortic valve during systole. Utilizing the modified Bernoulli equation, clinicians derive an estimation of the transvalvar pressure gradient [3]. This modality holds preference over cardiac catheterization owing to its accessibility, cost-effectiveness, and non-invasive means, thereby enhancing its widespread utilization in clinical settings [4].
Continuous-wave Doppler echocardiography is primarily confined to estimating peak instantaneous velocity and transvalvar pressure gradient, a limitation when compared to equations governing the complete hemodynamic profile at the site of greatest constriction [5,6]. Peak velocity measurements disregards the momentum inherent in blood flow across the entire vascular cross-section, a critical factor in accurately assessing velocity profiles and wall shear stress ( W S S ). Furthermore, peak velocity estimation via Doppler echocardiography depends on the angle of insonation being parallel to the direction of flow. Minimal misalignment may significantly underestimate the interrogated peak velocity [7]. While various non-invasive alternatives have been explored, their integration into clinical practice remains pending [6,8].
Blood speckle imaging (BSI) has emerged as a novel non-invasive mean to visualize and quantify blood flow characteristics [2,9,10]. This modality entails direct measurement and visualization of both the magnitude and direction of the blood flow field, sampled at an ultra-high (kilohertz) frequency range [9,11,12]. BSI presents a promising modality for overcoming the limitations associated with conventional Doppler echocardiography, including angle dependence and reliance on single peak velocity acquisitions [5]. In addition, BSI allows the calculation of W S S based on velocity information within a cross-sectional profile. BSI has been used in recent studies to assess aortic valve flow dynamics. Carnotti et al. (2023) [13] demonstrate the feasibility and reproducibility of BSI in evaluating aortic flow patterns in healthy children. The authors quantified vortex formation in the aortic root and ascending aorta, providing baseline data that can be used for comparison in pathological conditions. In a pilot study by Park et al. (2023) [14], the authors investigates the relationship between trans-aortic turbulence, as measured by BSI, and aortic valve inflammation, assessed using 18F-NaF PET/CT. The findings suggest that higher degrees of turbulence are associated with increased inflammatory activity in the aortic valve, highlighting the potential of BSI in evaluating disease progression in aortic stenosis.
Our group has previously explored the biomechanics of bicuspid aortic valves (BAVs) through fluid–structure interaction (FSI) modeling [15,16]. These computational studies provided detailed insight into the mechanical stresses and flow separation regions in BAVs with variation in the interleaflet triangle and commissural angle. However, numerical modeling lacks immediate clinical applicability in perioperative settings. The current BSI study builds upon and complements our prior FSI work by offering in vivo, patient-specific hemodynamic measurements. BSI enables bedside assessment of W S S and O S I , which were previously inferred via simulation. This work thus bridges the gap between computational and clinical hemodynamic characterization.
A recent study has evaluated BAV-specific hemodynamics using imaging and modeling techniques. Anam et al. (2025) [17] used patient-specific computational modeling to evaluate and compare post-TAVR complications, specifically paravalvular leak (PVL) and thrombogenic risk, in BAV patients implanted with older versus newer generation TAVR devices, demonstrating improved outcomes with newer devices.
A perioperative echocardiography study by Hayaschi et al. (2021) showed that patients undergoing VSRR surgery had a reduced oscillatory shear index ( O S I ) and increased peak W S S compared to controls, suggesting a reduced leaflet stress and potential degeneration following VSARR [18]. A recent proteomic study in LVAD recipients linked abnormal W S S / O S I patterns to the reduced expression of cytoskeletal and junction proteins in aortic leaflets, implicating shear forces in endothelial dysfunction, inflammation, and tissue remodeling [19]. While these findings support a mechanical link between W S S / O S I and structural valve changes, most evidence is based on limited longitudinal data correlating shear stress to clinical outcomes.
This retrospective, small cohort study aims to assess the feasibility and application of BSI for pre- and post-operative transesophageal echocardiographic (TEE) evaluation of flow characteristics and resulting tissue biomechanics of the aortic valve leaflets and adjacent arterial walls in children and adults with congenital aortic valve disease undergoing valve repair and valve-sparing aortic root replacement.

2. Methods

2.1. Surgical Cohort

A retrospective analysis of a single-center, cohort study was conducted. Ten patients with congenital (neo-)aortic valve disease and/or (neo-)aortic root dilation who met clinical criteria for aortic valve repair or valve-sparing root replacement were included. Intraoperative TEE was performed as part of the standard pre- and post-operative evaluation surrounding the surgical procedure. For analysis, patients where divided into two subcohorts: those with a well-functioning aortic valve versus those with valve dysfunction. Aortic valve dysfunction was defined as greater than mild stenosis and/or greater than mild regurgitation.

2.2. Quantification of the Velocity Field

BSI analyzes sequences of ultrasound images by tracking the movement of small “speckle” patterns made by moving red blood cells. This tracking is performed using a block-matching algorithm that searches for the “best match” between successive frames. Further details are available in [9,10]. BSI acquisition was obtained using the Vivid E95 ultrasound system (GE HealthCare, GE Vingmed Ultrasound AS, Horten, Norway). The acquired data consisted of a cine loop comprising standard 2D sonographic images, blood velocity data, a corresponding confidence level map, and associated metadata. The tissue data formed a single channel, where pixel intensity directly corresponded to image brightness.
Blood velocity data were multichannel and subsequently processed into a velocity field. A separate single channel provided quantitative information on the confidence level associated with the blood velocity estimates. This confidence level ranged from 0 (low confidence) to 1 (high confidence) and reflected the fidelity of the block-matching algorithm used to track blood speckle displacement. Lower confidence values indicated potentially unreliable velocity estimates, often caused by factors such as poor image quality or out-of-plane blood speckle movement [20,21,22].
The spatial resolution of the BSI images was 0.0825 mm/pixel. The dimensions of the acquired tissue data in the x- and y-directions provided the total number of pixels. This information was then used to generate a 2D grid encompassing the region of interest (ROI). Subsequently, the velocity field was mapped onto this 2D grid, facilitating both visualization and quantification of blood flow patterns. The BSI images were acquired with a pulse repetition frequency (PRF) of 6 kHz. The velocity encoding setting allowed for a maximum trackable blood velocity of up to 2 m/s, which was sufficient for both pre- and post-operative evaluations.

2.3. Hemodynamic Characterization Using Wall Shear Stress Related Indicators

Endothelial cells lining the aortic wall are sensitive to the mechanical forces exerted by blood flow. To evaluate these forces and their potential impact on endothelial cell health, this study employed three key hemodynamic parameters: peak wall shear stress ( P e a k W S S ), time-averaged wall shear stress ( T A W S S ), and oscillatory shear index ( O S I ).
Wall shear stress ( W S S ) represents the frictional force exerted by blood flow per unit area on the aortic wall. It varies spatially and temporally depending on blood flow patterns and the geometry of the thoracic aorta and aortic valve. P e a k W S S refers to the maximum shear stress experienced at the wall of a blood vessel at peak systole and has been correlated with disease progression and assessing the risk of aneurysm rupture. Time-averaged wall shear stress ( T A W S S ) reflects the localized average W S S over the cardiac cycle [23,24,25].
T A W S S = 1 T 0 T | W S S i | d t .
While T A W S S provides a magnitude estimate, spatial variations in W S S offer insights into the non-uniformity of the forces experienced by the endothelium. However, these variations do not capture the frequency of flow direction changes. Therefore, O S I quantifies the oscillatory nature of W S S . O S I ranges from 0 (perfectly steady flow) to 0.5 (maximal flow reversal [24].
O S I = 1 2 1 | 0 T W S S i d t | 0 T | W S S i | d t .

2.4. Statistical Analysis

The study aimed to assess the statistical significance of differences in P e a k W S S , T A W S S , and O S I , before and after surgery. Normality of the parameter differences was evaluated using the Shapiro–Wilk test. For normally distributed data, a one-sample Student’s t-test was employed. With a sample size (n) of 10, the mean difference ( Δ x ¯ ) and standard deviation ( S D ) were calculated. The resulting statistic,
t = Δ x ¯ μ 0 S D / n .
Consequently, a rejection of the null hypothesis, that the surgery does not have an effect on the hemodynamic markers, is given by the probability of this effect occurring by chance was calculated as:
2 t ρ t ( x ) d x
which denotes the cumulative distribution function of the Student t-distribution. A significance level of 0.05 was chosen for hypothesis testing. The findings were graphically represented using box-and-whisker plots to illustrate changes in the hemodynamic markers induced by surgery.

3. Results

A total of 10 patients were included in the study. Patient demographics, body size, cardiac diagnoses, surgical indications, aortic valve morphology, and surgery performed are presented in Table 1. Pre-operative dimensions and pre- and post-operative echocardiographic assessment of the aortic valve function are presented in Table 2. The mean pre- and post-operative aortic valve virtual basal ring, or “annulus” diameters, were 30.2 ± 5.5 mm and 17.1 ± 3.2 mm ( p < 0.001 ), respectively. All patients had some degree of aortic root dilation, with all but one patient (Patient 10) having some degree of aortic regurgitation and/or stenosis. All patients in Group 1, with significant aortic regurgitation, showed mild or no aortic regurgitation following surgery. All patients in Group 2, with well-functioning aortic valves, remained well-functioning post-operatively without significant stenosis or regurgitation.
There was no significant difference in the entire cohort in the mean of the peak systolic aortic valve velocity pre- and post-surgery ( 1.1584 ± 0.3919 m/s vs. 1.1290 ± 0.2144 m/s, p = 0.8995 , Figure 1). Post-surgery reveals a notable reduction in the standard deviation of the peak velocity between peak systole and towards valve closure. This indicates a more uniform and stabilized flow profile following the surgical intervention.

3.1. Qualitative Flow Field Evaluation of BSI

Figure 2 shows the flow through a transesophageal long-axis view of the left ventricular outflow tract and aortic valve during different stages of the cardiac cycle for both the pre- and post-operative cases of Patient 1. The flow pattern differed pre-operatively from that post-operatively (Figure 2). Pre-operatively, Patient 1 exhibited a dilated aortic root and ascending aorta showing eccentric and less organized flow pre-surgery. This demonstrated an uneven jet pattern across the aortic valve in systole. Post-surgery, with adjustments toward normal valvar morphology and reduced aortic virtual basal ring diameter, the flow became more laminar and unidirectional. This behavior was consistent in 9 out of 10 patients.

3.2. Velocity Profile and Shear Stress Quantification

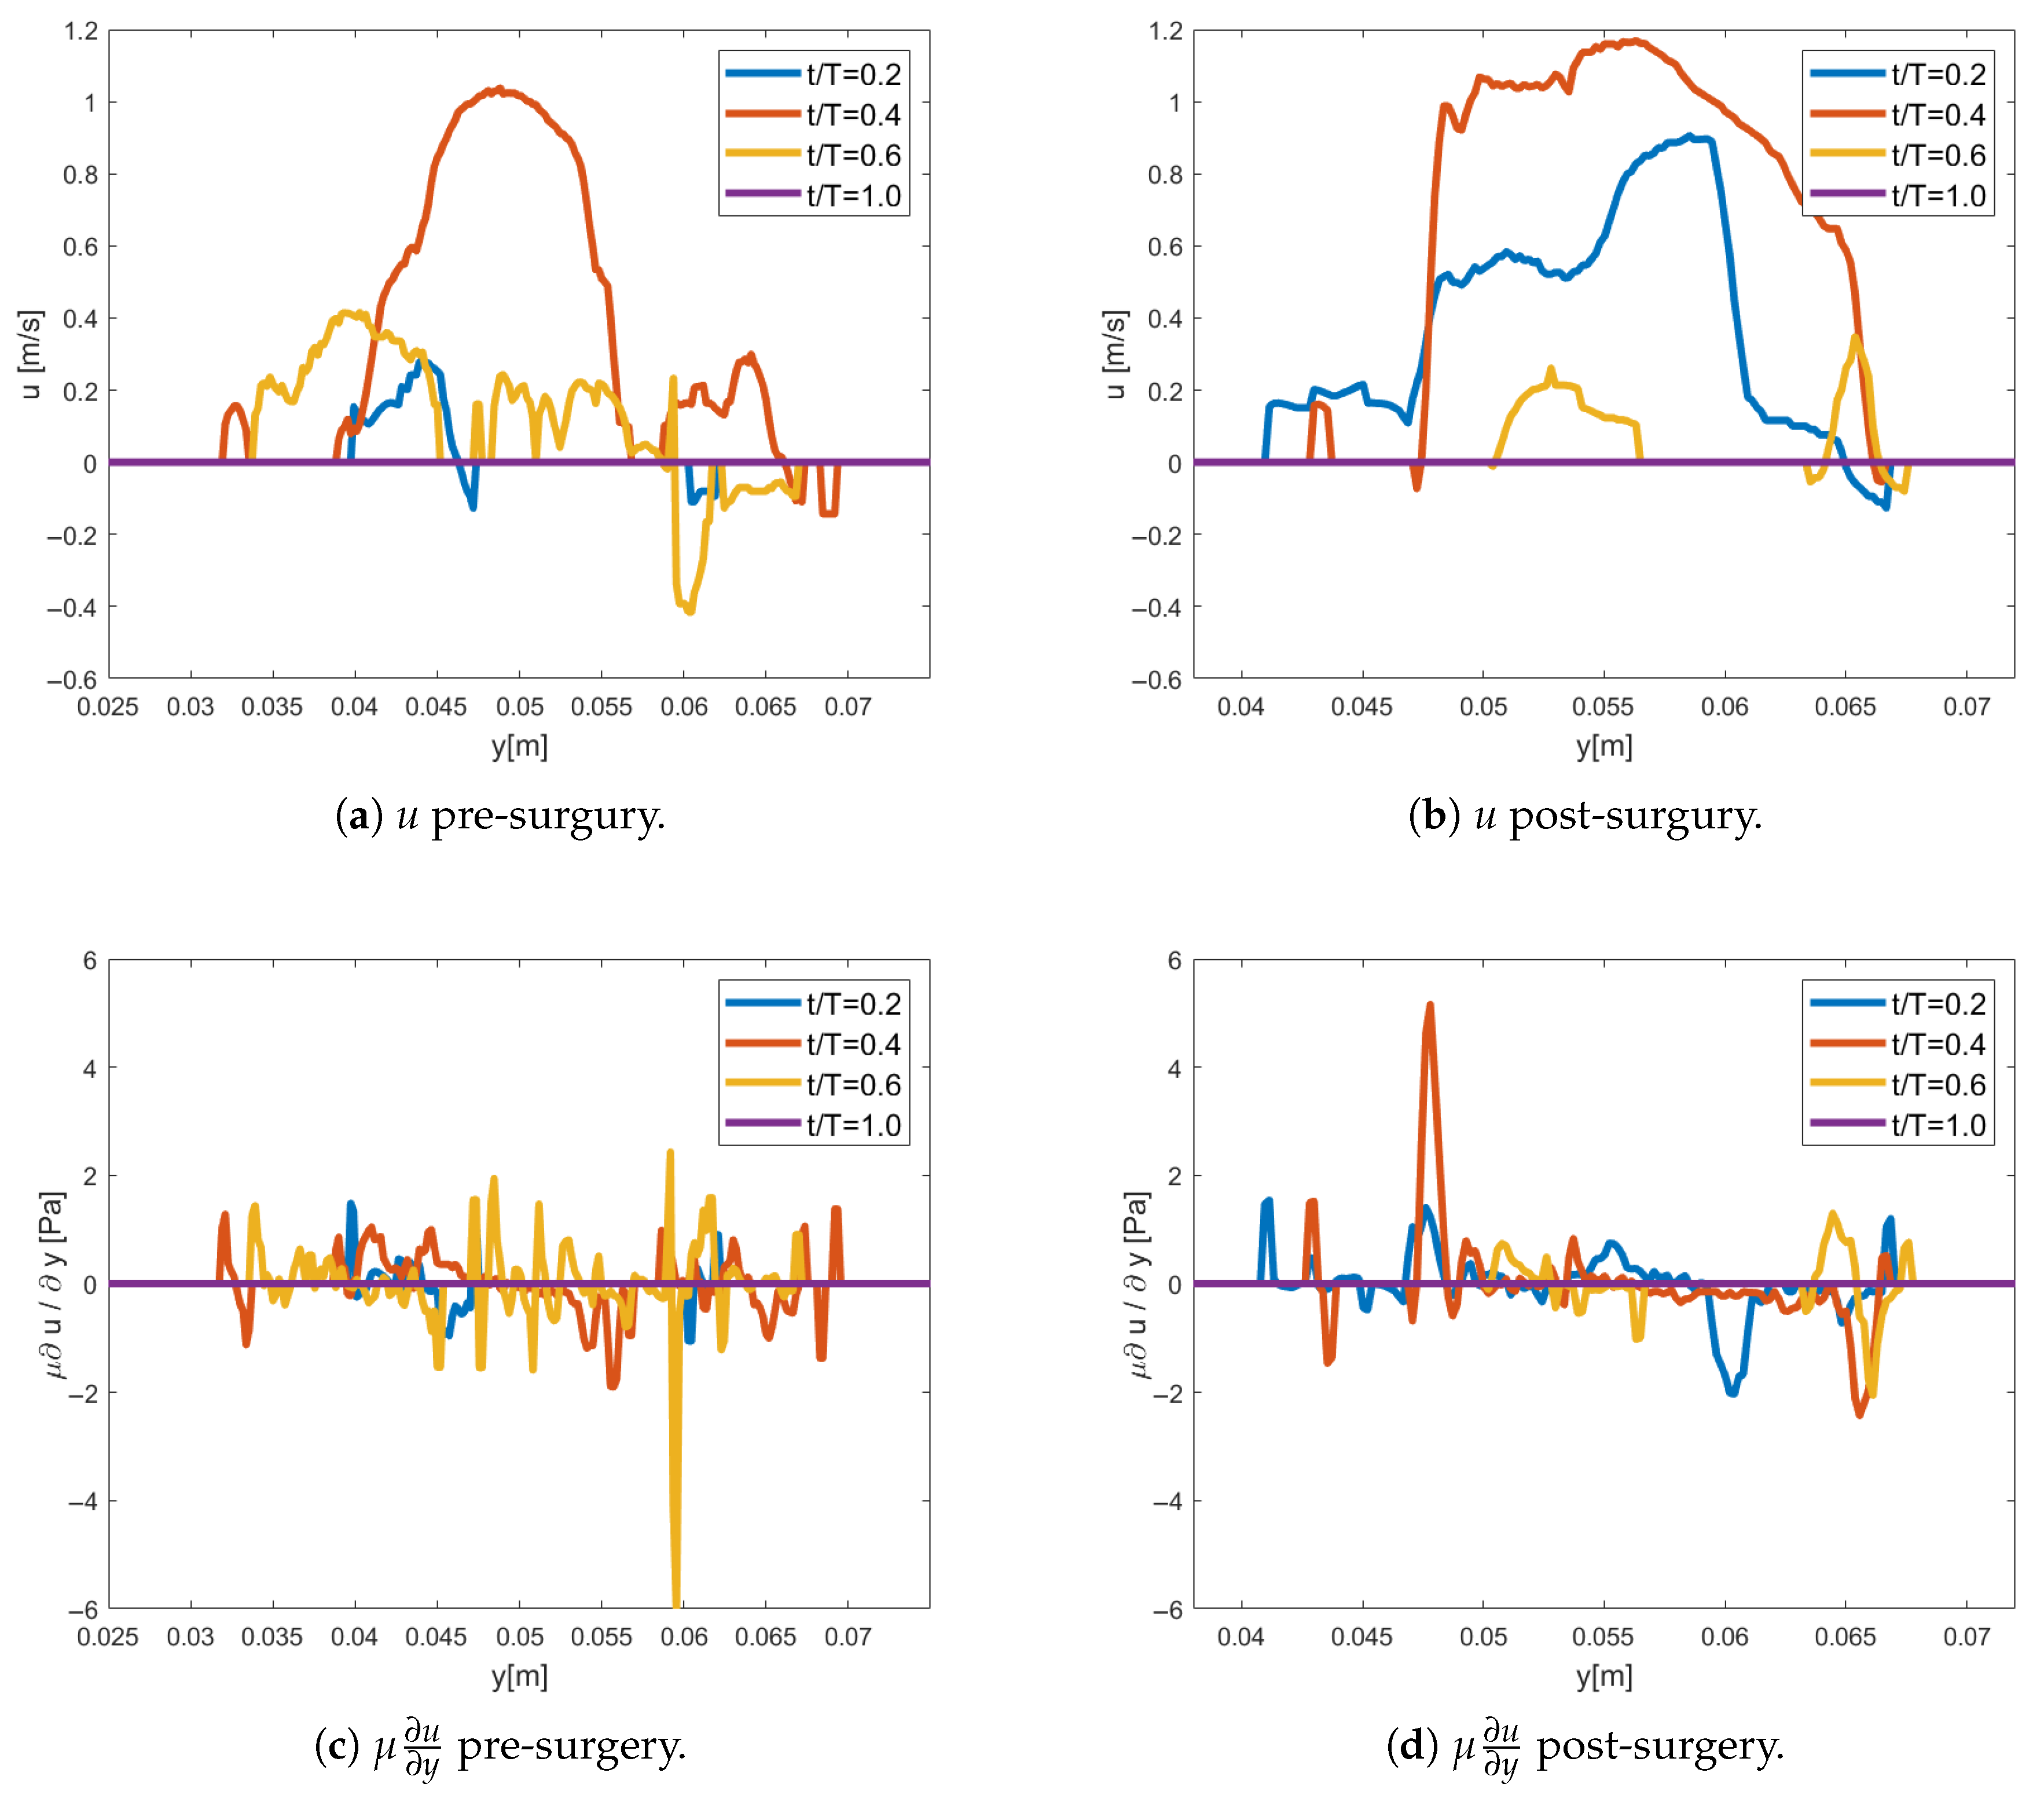
The blood flow illustrated in Figure 2 is further analyzed along the vertical profile (white dashed line) for Patient 1, see Figure 3. In the pre-operative scenario, the long-axis velocity component is initially low during early systole but increases towards peak systole, forming an anteriorly directed jet with flow reversal on the posterior side of the aortic root. This results in a significant velocity gradient at the jet’s shear layer [26], leading to increased shear stress. By post-systole, the velocity magnitude decreases, and the jet’s center shifts approximately 5 mm in the short-axis direction.
In the post-operative scenario, a relatively symmetric top-hat velocity profile emerges at peak systole, with minimal recirculation near the endothelial wall. Here, the shear layer on the anterior aortic wall exhibits a steeper gradient, resulting in higher shear stress levels. Additionally, there is less displacement of the jet’s center along the short axis compared to the pre-operative case.
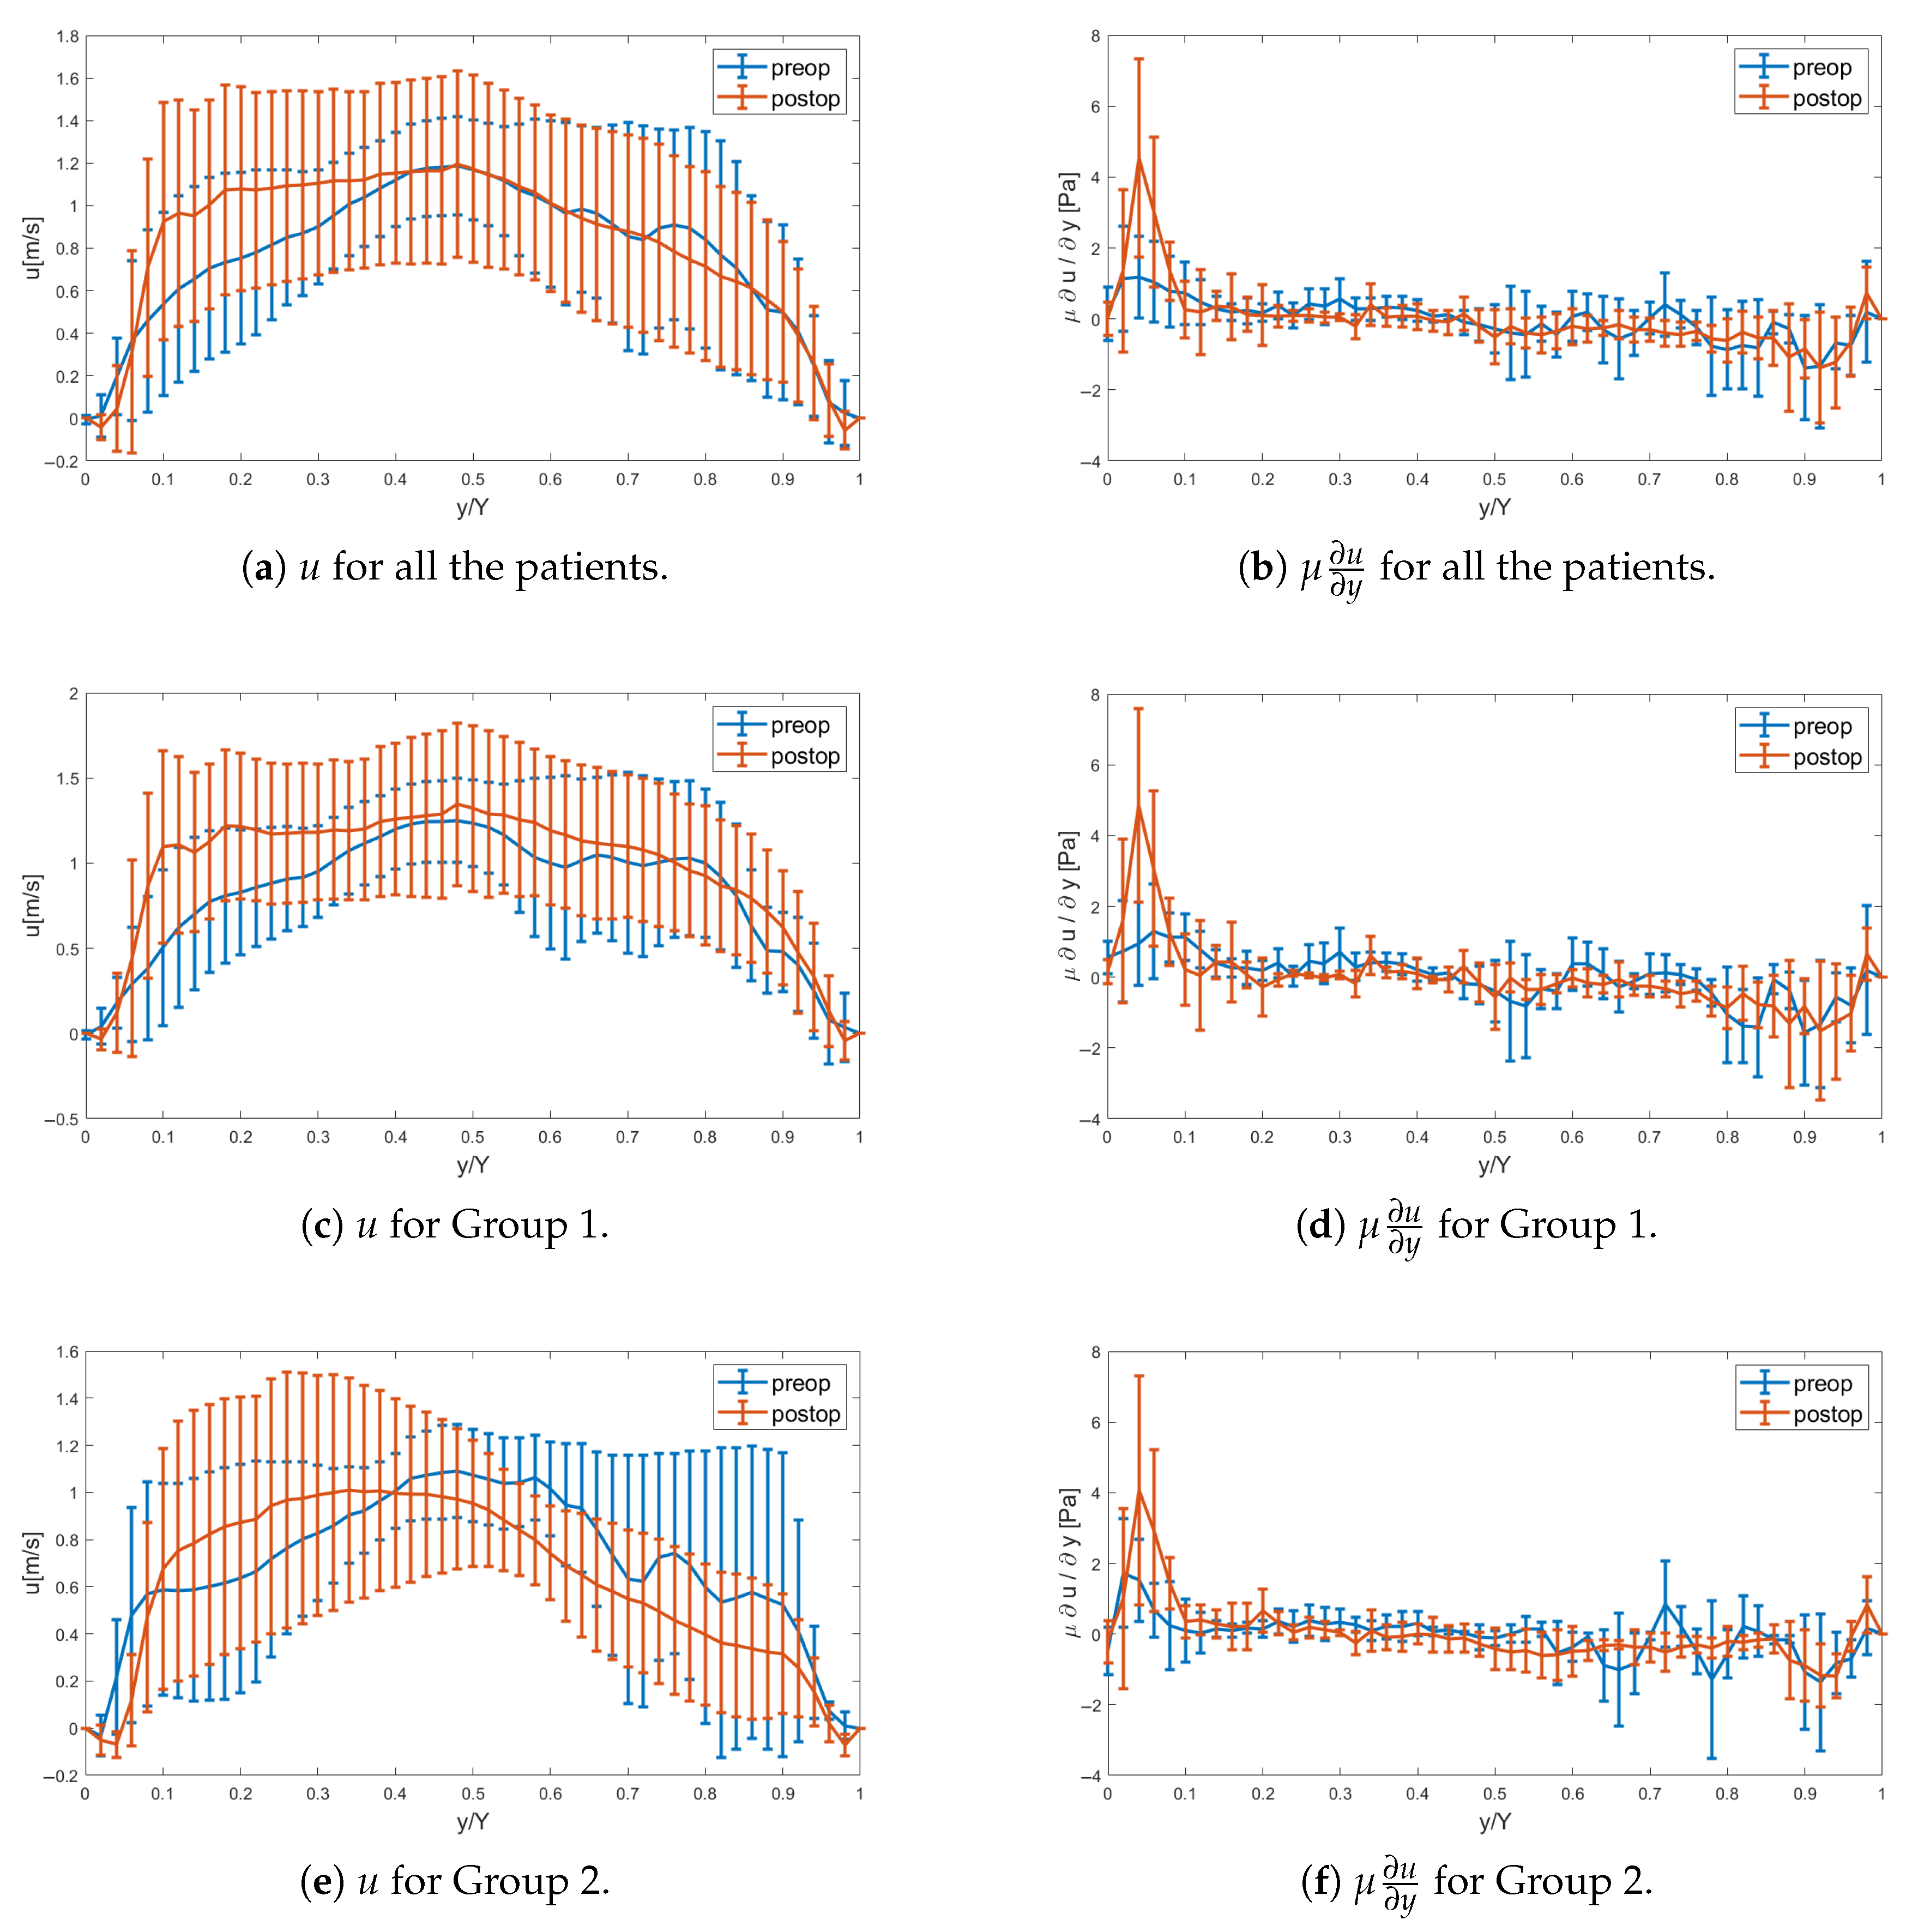
Figure 4 complements Figure 3 by illustrating the statistical mean and standard deviation for Patients 1–10 at peak systole. Pre-operatively, the impaired flow is evident towards the right/left coronary leaflets, with the jet directed more anteriorly, c.f., Figure 3a,b. Post-operatively, the statistics indicate a fuller velocity profile at peak systole, with larger velocities directed anteriorly towards the probe. The greater asymmetry observed pre-operatively causes a reduced velocity gradient on this side compared to the post-operative case, resulting in lower axial wall shear stress and indicating a tendency for retrograde flow; see Figure 4b. On the opposite side ( y / Y = 1 ), i.e., the posterior aortic wall, the gradient is similarly small with low axial velocity, with some patients indicating changed sign of the wall shear stress, implying flow reversal pre-operatively as compared to the post-operative case.

3.3. Quantification of PeakWSS, TAWSS, and OSI Parameters

Statistics of the P e a k W S S , T A W S S , and O S I parameters are quantified in Table 3 for Patients 1–10 in both pre- and post-operative cases.
The difference in these parameters is given in quantile–quantile (Q-Q) plots in Figure 5 and shows that the data falls on a straight line, indicating normally distributed data.
The statistics P e a k W S S , T A W S S , and O S I are also presented with box-and-whisker plots in Figure 6. PeakWSS demonstrates a significant increase from a pre-operative value of 1.94 Pa to a post-operative value of 3.69 Pa (p = 0.0035 ), indicating a marked change in wall shear dynamics following intervention. This increase is attributed to a steeper velocity gradient near the anterior wall of the aorta ( y / Y = 0 ), specifically closer to the imaging probe, as illustrated in Figure 3. Post-operatively, the flow becomes more directed and coherent, resulting in higher near-wall velocities and thus a greater shear stress at the vessel boundary. It is also evident in Figure 6a that the change in P e a k W S S is more pronounced for Group 1 compared to Group 2 in the cohort. This is also evidenced in Table 3. In both pre-operative and post-operative cases, the axial velocity undergoes a sign change, transitioning from positive to negative flow, coinciding with the location of the shear layer. Pre-operatively, the retrograde flow towards the posterior wall is stronger than post-operatively. Integrating over the cardiac cycle reveals that the mean value of the T A W S S increases from 0.6885 Pa to 0.8312 Pa, with a larger standard deviation, as shown in Figure 6. When W S S is integrated over the entire cardiac cycle, the influence of transient flow features—such as retrograde flow—is effectively averaged out. As a result, the difference in T A W S S between pre- and post-operative states becomes statistically insignificant ( p = 0.23 ). However, retrograde flow with a change in flow direction results in a non-zero O S I in the axial flow direction. The mean values for O S I significantly decreases in the mean from 0.0534 to 0.0275 . Thus, Figure 6 indicates that the O S I is significantly larger pre-operatively than post-operatively, which is statistically significant ( p = 0.0044 ). Periods of significant wall shear stress combined with a non-zero O S I have been suggested as a risk factor for cell-driven changes in the aortic wall structure, including the development and progression of atherosclerosis.
O S I was calculated using Equation (2). For each patient, the wall region (anterior or posterior) that contributed most significantly to the O S I , as defined by Equation (2), was identified. The O S I values reported in Table 3 were calculated using data from this dominant wall region. For the majority of patients, the anterior wall ( y / Y = 0 ) exhibited the highest O S I contribution. However, for Patient 4, the posterior wall ( y / Y = 1 ) showed the greatest contribution, and thus this region was used in the O S I calculation for that patient.

3.4. Relationship with Aortic Virtual Basal Ring Diameter

The correlation between aortic virtual basal ring diameter and O S I is weak and positive ( R 2 = 0.187 , r = 0.3755 ,   and   p = 0.0571 ); however, it does not correlate to the same extent with T A W S S ( R 2 = 0.0192 , r = 0 ,   and   p = 0.56 ). Figure 7a shows that the relationship between P e a k W S S and the virtual basal ring diameter is almost significant ( R 2 = 0.304, r = 0.5148, and p = 0.0118), indicating a weak negative correlation.

4. Discussion

In this study we utilized BSI for evaluating aortic valve repair or valve-sparing root replacement (VSRR) in a cohort of 10 patients, leveraging the capabilities of the newly available mini-3D transesophageal probe. The findings indicated that pre-operative BSI measurements exhibited unorganized eccentric flow, while post-operative BSI measurements showed uniform and laminar blood flow.
P e a k W S S shows a significant increase from pre-operatively to post-operatively ( p = 0.0035 ). This rise is attributed to a steeper velocity gradient near the anterior wall of the aorta, closer to the imaging probe, as illustrated in Figure 3. The post-operative flow pattern results in higher near-wall velocities in this region, leading to elevated shear stress. The significant rise in P e a k W S S suggests a biomechanical shift in local hemodynamics, potentially beneficial if aligning with physiological norms. However, elevated W S S should also be monitored for potential long-term effects, depending on the vascular context.
The assessment of T A W S S , an integrated hemodynamic parameter, showed no significant difference between pre- and post-surgery conditions. This outcome can be partially attributed to the similar velocity magnitudes observed throughout the cardiac cycle. Although P e a k W S S increases significantly post-operatively (indicating localized shear intensification), the lack of significant change in T A W S S ( p = 0.23 ) suggests that, over the full cardiac cycle, the net shear exposure remains comparable. This outcome highlights the temporal filtering effect of the T A W S S metric and underscores the importance of analyzing both instantaneous and time-averaged shear stress measures for a comprehensive assessment of hemodynamic changes.
Surgery involving aortic valve repair in the studied cohort indicated a significant reduction in O S I , attributed to the axial velocity profile alternating between positive and negative flow during the cardiac cycle [23,24]. The specific variation in O S I pre-operatively is seen to be linked to a more anteriorly directed jet with a large recirculation zone on the posterior side of the aortic root. In contrast, post-operatively at peak systole, the axial velocity data in the ascending aorta demonstrate a more symmetric top-hat profile, aligning well with previous observations [2], c.f., Figure 3. The steeper velocity gradient resulted in a higher axial shear stress in the shear layer post-operatively. In the study by [27], it was observed that a non-zero O S I combined with significant W S S increases the risk of aortic wall damage, including the progression of atherosclerosis [28,29]. We can assume that these same biomechanical insults may similarly lead to progressive damage of the valve leaflets. Moreover, the observed reductions in O S I may serve as potential predictors for future complications, such as valve deterioration and aortic root dilation. Consequently, incorporating comprehensive flow dynamic analyses into the post-operative evaluation could improve long-term outcomes and guide more precise patient management strategies.
P e a k W S S , like O S I , shows a significant difference between pre- and post-operative cases ( p = 0.0044 ), suggesting both metrics may serve as effective parameters for perioperative assessment of the aortic valve. Additionally, Figure 6a illustrates that the change in P e a k W S S is more pronounced in Group 1 compared to Group 2, indicating a greater capacity for restoring normal hemodynamics and tissue biomechanics through valve repair in dysfunctional valves, compared to valve-sparing root replacement in already well-functioning valves. The observed hemodynamic normalization following VSRR reinforces a mechanical association between altered W S S / O S I and structural remodeling of the aortic valve [18,19].
The quantitative assessment of axial velocity and shear stress offers valuable insights into the relationship between hemodynamics in the proximal thoracic aorta and variations in aortic valve morphology. BSI technology is promising as a potential tool for perioperative assessment of the blood flow through the aortic valve, providing more granular insight into favorable versus unfavorable flow characteristics. Furthermore, in addition to assessing immediate post-operative hemodynamics, BSI may potentially help predict the long-term durability of any valve repairs. This technique provides a more comprehensive understanding of surgical intervention completeness compared to traditional Doppler and color Doppler assessments of pressure gradients or regurgitation. Additionally, it may offer early indications of potential recurrence. Future investigations with larger cohorts and long-term follow-up will be essential to establish the clinical utility of these findings and to assess their abilities to predict outcomes.

5. Limitations

The relatively small number of patients presenting with both aortic valve abnormalities and aortic root dilation limited the ability to perform a robust subgroup analysis. This constraint reduced statistical power and made it challenging to draw definitive conclusions about this specific patient subset. Another limitation of this study is the 2D nature of flow analysis. This is important in the aortic root because of the eccentric flow seen in patients with valve abnormalities and dilated aortic roots, which may be unaccounted for.
The velocity component orthogonal to the imaging plane was not available for all patients in the present study. Capturing the maximum velocity can be optimized by aligning it with the long axis of the left ventricular outflow tract and aorta.
In the cohort under study, which is predominantly characterized by trileaflet/trisinuate aortic valve morphology, W S S is expected to be primarily influenced by the long-axis velocity component. However, in two cases with bileaflet morphology, one of which also exhibited bisinuate root anatomy, previous studies using 4D flow MRI [25,30] and fluid–structure-interaction (FSI) simulations [16], have identified a significant short-axis velocity component. This may give rise to tangential W S S due to the presence of helical flow structures. Nonetheless, the magnitude of tangential W S S in bileaflet cases is generally lower than that of the W S S in the long-axis direction. Therefore, we do not expect this to significantly affect the overall results for the cohort. It is important to note, however, that vorticity information, as well as any jet or transitional laminar-turbulent flow deviating outside the 2D imaging plane, may be lost, which could limit the ability to fully capture the complexity of flow patterns in some cases. Analyzing the helical flow structure through velocity components in the short-axis view may indeed provide valuable insight into O S I and valve function, particularly in cases with bileaflet morphology. This aspect is intended to be explored in future work.
Our previous FSI studies focused on stenotic BAV morphologies characterized by fusion between two adjacent leaflets, along with variations in the interleaflet triangle [15] and commissural angle [16]. In the present study, we examine patients with non-stenotic congenital aortic root disease characterized by varying degrees of regurgitation, ranging from mild to severe. Therefore, a direct side-by-side comparison with our earlier FSI studies was not applicable.
The 3D physiological displacement of the heart throughout the cardiac cycle, which evolves both spatially and temporally, is also not fully captured. This influences the flow quantification of relative velocities to the walls in the left ventricle, as it experiences significant volume changes during systolic contraction. However, for vessels that undergo moderate displacement and area changes, this factor is less significant.

6. Conclusions

This study highlights the significant impact of aortic valve repair and aortic root remodeling using valve-sparing techniques on key hemodynamic parameters, P e a k W S S , T A W S S , and O S I , at the level of the aortic virtual basal ring in children and young adults. The results show statistically significant differences in both P e a k W S S and O S I between pre-operative and post-operative states, suggesting that these parameters may serve as useful markers for monitoring the functional outcome of aortic valve interventions. Despite these promising findings, further research is essential to thoroughly investigate and validate the relationship between O S I reduction and long-term outcomes. Continued evaluation will help in understanding the prognostic implications and guide clinical decision-making for this patient population.

Author Contributions

Conceptualization, S.L., J.T.T., L.D., H.K.N., D.G., J.K.R., and E.S.; formal analysis, S.L., J.K.R., and E.S.; writing—review and editing, S.L., J.T.T., L.D., H.K.N., D.G., J.K.R., and E.S.; supervision, J.T.T., J.K.R., and E.S.; funding acquisition, E.S. All authors have read and agreed to the published version of the manuscript.

Funding

This research was funded by the Swedish Research Council (grant number 2021-04894).

Institutional Review Board Statement

The study was conducted in accordance with the Declaration of Helsinki and approved by the Institutional Review Board (IRB) at Cleveland Clinic (approval code: 23-874, approval date: 8 January 2024) for studies involving humans.

Informed Consent Statement

Informed consent was obtained from all subjects involved in the study. Written informed consent has been obtained from the patient(s) to publish this paper.

Data Availability Statement

Data available on request due to restrictions in repository access.

Acknowledgments

The authors gratefully acknowledge the support of the Swedish Research Council under grant number 2021-04894. Support from KTH Engineering Mechanics in the areas of Biomechanics, Health, and Biotechnology is also appreciated. The authors thank the anonymous reviewers for their constructive feedback, which helped improve the clarity of this paper.

Conflicts of Interest

Justin Tretter is a consultant for Cara Medical, Ltd. The remaining authors declare that the research was conducted in the absence of any commercial or financial relationships that could be construed as a potential conflict of interest.

Abbreviations

The following abbreviations are used in this manuscript:
BSIBlood Speckle Imaging
BAVBicuspid Aortic Valves
TEETransesophageal Echocardiographic
VSRRValvar-Sparing Root Replacement
PVLParavalvular Leak
LVADLeft Ventricular Assist Device
VSARRValve-Sparing Aortic Root Replacement
PRFPulse Repetition Frequency
W S S Wall Shear Stress
T A W S S Time-Averaged Wall Shear Stress
O S I Oscillatory Shear Index
FSIFluid–Structure Interaction

References

  1. Tretter, J.T.; Spicer, D.E.; Franklin, R.C.G.; Land, M.J.; Aiello, V.D.; Cook, A.C.; Crucean, A.; Loomba, R.S.; Yoo, S.J.; Quintessenza, J.A.; et al. Expert Consensus Statement: Anatomy, Imaging, and Nomenclature of Congenital Aortic Root Malformations. Ann. Thorac. Surg. 2023, 116, 6–16. [Google Scholar] [CrossRef] [PubMed]
  2. Sundström, E.; Jiang, M.; Najm, H.K.; Tretter, J.T. Blood Speckle Imaging: An Emerging Method for Perioperative Evaluation of Subaortic and Aortic Valvar Repair. Bioengineering 2023, 10, 1183. [Google Scholar] [CrossRef] [PubMed]
  3. Currie, P.J.; Seward, J.; Reeder, G.; Vlietstra, R.; Bresnahan, D.; Bresnahan, J.; Smith, H.; Hagler, D.; Tajik, A. Continuous-wave Doppler echocardiographic assessment of severity of calcific aortic stenosis: A simultaneous Doppler-catheter correlative study in 100 adult patients. Circulation 1985, 71, 1162–1169. [Google Scholar] [CrossRef] [PubMed]
  4. Nishimura, R.A.; Carabello, B.A. Hemodynamics in the cardiac catheterization laboratory of the 21st century. Circulation 2012, 125, 2138–2150. [Google Scholar] [CrossRef] [PubMed]
  5. Donati, F.; Myerson, S.; Bissell, M.M.; Smith, N.P.; Neubauer, S.; Monaghan, M.J.; Nordsletten, D.A.; Lamata, P. Beyond Bernoulli: Improving the accuracy and precision of noninvasive estimation of peak pressure drops. Circ. Cardiovasc. Imaging 2017, 10, e005207. [Google Scholar] [CrossRef] [PubMed]
  6. Dockerill, C.; Gill, H.; Fernandes, J.F.; Nio, A.Q.; Rajani, R.; Lamata, P. Blood speckle imaging compared with conventional Doppler ultrasound for transvalvular pressure drop estimation in an aortic flow phantom. Cardiovasc. Ultrasound 2022, 20, 18. [Google Scholar] [CrossRef] [PubMed]
  7. Ring, L.; Shah, B.N.; Bhattacharyya, S.; Harkness, A.; Belham, M.; Oxborough, D.; Pearce, K.; Rana, B.S.; Augustine, D.X.; Robinson, S.; et al. Echocardiographic assessment of aortic stenosis: A practical guideline from the British Society of Echocardiography. Echo Res. Pract. 2021, 8, G19–G59. [Google Scholar] [CrossRef] [PubMed]
  8. Gill, H.; Fernandes, J.; Chehab, O.; Prendergast, B.; Redwood, S.; Chiribiri, A.; Nordsletten, D.; Rajani, R.; Lamata, P. Evaluation of aortic stenosis: From Bernoulli and Doppler to Navier-Stokes. Trends Cardiovasc. Med. 2023, 33, 32–43. [Google Scholar] [CrossRef] [PubMed]
  9. Lasse Løvstakken, L.; Lie, G.R. BSI (Blood Speckle Imaging). GE Healthcare (2017). 2022. Available online: https://www.gehealthcare.com/-/media/28568e93cbe741d48a10114e399ebd91.pdf (accessed on 14 July 2023).
  10. Trahey, G.E.; Allison, J.W.; Von Ramm, O.T. Angle independent ultrasonic detection of blood flow. IEEE Trans. Biomed. Eng. 1987, 12, 965–967. [Google Scholar] [CrossRef] [PubMed]
  11. Hansen, K.L.; Nielsen, M.B.; Jensen, J.A. Vector velocity estimation of blood flow—A new application in medical ultrasound. Ultrasound 2017, 25, 189–199. [Google Scholar] [CrossRef] [PubMed]
  12. Nyrnes, S.A.; Fadnes, S.; Wigen, M.S.; Mertens, L.; Lovstakken, L. Blood speckle-tracking based on high–frame rate ultrasound imaging in pediatric cardiology. J. Am. Soc. Echocardiogr. 2020, 33, 493–503. [Google Scholar] [CrossRef] [PubMed]
  13. Cantinotti, M.; Marchese, P.; Scalese, M.; Giordano, R.; Franchi, E.; Assanta, N.; Koestenberger, M.; Barnes, B.T.; Celi, S.; Jani, V.; et al. Characterization of Aortic Flow Patterns by High-Frame-Rate Blood Speckle Tracking Echocardiography in Children. J. Am. Heart Assoc. 2023, 12, e026335. [Google Scholar] [CrossRef] [PubMed]
  14. Park, S.; Chung, W.-B.; O, J.H.; Lee, K.Y.; Jung, M.-H.; Jung, H.-O.; Chang, K.; Youn, H.-J. Trans-aortic flow turbulence and aortic valve inflammation: A pilot study using blood speckle imaging and 18F-sodium fluoride positron emission tomography/computed tomography in patients with moderate aortic stenosis. J. Cardiovasc. Imaging 2023, 31, 145–149. [Google Scholar] [CrossRef] [PubMed]
  15. Sundström, E.; Tretter, J.T. Impact of Variation in Interleaflet Triangle Height Between Fused Leaflets in the Functionally Bicuspid Aortic Valve on Hemodynamics and Tissue Biomechanics. J. Eng. Sci. Med Diagn. Ther. 2022, 5, 031102. [Google Scholar] [CrossRef]
  16. Sundström, E.; Tretter, J.T. Impact of Variation in Commissural Angle between Fused Leaflets in the Functionally Bicuspid Aortic Valve on Hemodynamics and Tissue Biomechanics. Bioengineering 2023, 10, 1219. [Google Scholar] [CrossRef] [PubMed]
  17. Anam, S.; Kovarovic, B.; Parikh, P.; Slepian, M.; Hamdan, A.; Haj-Ali, R.; Bluestein, D. Impact of Device Type and Orientation on Post-Transcatheter Aortic Valve Replacement Complications in Bicuspid Aortic Valve Patients: A Computational Study. ASAIO J. 2025. [CrossRef] [PubMed]
  18. Hayashi, H.; Itatani, K.; Akiyama, K.; Zhao, Y.; Kurlansky, P.; DeRoo, S.; Sanchez, J.; Ferrari, G.; Yuzefpolskaya, M.; Colombo, P.C.; et al. Influence of aneurysmal aortic root geometry on mechanical stress to the aortic valve leaflet. Eur. Heart J.-Cardiovasc. Imaging 2021, 22, 986–994. [Google Scholar] [CrossRef] [PubMed]
  19. Kobsa, S.; Akiyama, K.; Nemeth, S.K.; Kurlansky, P.A.; Naka, Y.; Takeda, K.; Itatani, K.; Werth, E.G.; Brown, L.M.; Ferrari, G.; et al. Correlation between aortic valve protein levels and vector flow mapping of wall shear stress and oscillatory shear index in patients supported with continuous-flow left ventricular assist devices. J. Heart Lung Transplant. 2023, 42, 64–75. [Google Scholar] [CrossRef] [PubMed]
  20. Swillens, A.; Segers, P.; Lovstakken, L. Two-dimensional flow imaging in the carotid bifurcation using a combined speckle tracking and phase-shift estimator: A study based on ultrasound simulations and in vivo analysis. Ultrasound Med. Biol. 2010, 36, 1722–1735. [Google Scholar] [CrossRef] [PubMed]
  21. Swillens, A.; Segers, P.; Torp, H.; Lovstakken, L. Two-dimensional blood velocity estimation with ultrasound: Speckle tracking versus crossed-beam vector Doppler based on flow simulations in a carotid bifurcation model. IEEE Trans. Ultrason. Ferroelectr. Freq. Control 2010, 57, 327–339. [Google Scholar] [CrossRef] [PubMed]
  22. Ekroll, I.K.; Swillens, A.; Segers, P.; Dahl, T.; Torp, H.; Lovstakken, L. Simultaneous quantification of flow and tissue velocities based on multi-angle plane wave imaging. IEEE Trans. Ultrason. Ferroelectr. Freq. Control 2013, 60, 727–738. [Google Scholar] [CrossRef] [PubMed]
  23. Suo, J.; Oshinski, J.N.; Giddens, D.P. Blood flow patterns in the proximal human coronary arteries: Relationship to atherosclerotic plaque occurrence. Mol. Cell. Biomech. 2008, 5, 9. [Google Scholar]
  24. Chen, X.; Gao, Y.; Lu, B.; Jia, X.; Zhong, L.; Kassab, G.S.; Tan, W.; Huo, Y. Hemodynamics in coronary arterial tree of serial stenoses. PLoS ONE 2016, 11, e0163715. [Google Scholar] [CrossRef] [PubMed]
  25. Sundström, E.; Laudato, M. Machine learning-based segmentation of the thoracic aorta with congenital valve disease using MRI. Bioengineering 2023, 10, 1216. [Google Scholar] [CrossRef] [PubMed]
  26. Fan, J.; Sundström, E. Vortex Dynamics in the Sinus of Valsalva. Bioengineering 2025, 12, 279. [Google Scholar] [CrossRef] [PubMed]
  27. Kiema, M.; Sarin, J.K.; Kauhanen, S.P.; Torniainen, J.; Matikka, H.; Luoto, E.S.; Jaakkola, P.; Saari, P.; Liimatainen, T.; Vanninen, R.; et al. Wall shear stress predicts media degeneration and biomechanical changes in thoracic aorta. Front. Physiol. 2022, 13, 934941. [Google Scholar] [CrossRef] [PubMed]
  28. Zarins, C.K.; Giddens, D.P.; Bharadvaj, B.; Sottiurai, V.S.; Mabon, R.F.; Glagov, S. Carotid bifurcation atherosclerosis. Quantitative correlation of plaque localization with flow velocity profiles and wall shear stress. Circ. Res. 1983, 53, 502–514. [Google Scholar] [CrossRef] [PubMed]
  29. LaDisa, J.F., Jr.; Dholakia, R.J.; Figueroa, C.A.; Vignon-Clementel, I.E.; Chan, F.P.; Samyn, M.M.; Cava, J.R.; Taylor, C.A.; Feinstein, J.A. Computational simulations demonstrate altered wall shear stress in aortic coarctation patients treated by resection with end-to-end anastomosis. Congenit. Heart Dis. 2011, 6, 432–443. [Google Scholar]
  30. Jonnagiri, R.; Sundström, E.; Gutmark, E.; Anderson, S.; Pednekar, A.; Taylor, M.; Tretter, J.; Gutmark-Little, I. Influence of aortic valve morphology on vortical structures and wall shear stress. Med. Biol. Eng. Comput. 2023, 61, 1489–1506. [Google Scholar] [CrossRef] [PubMed]
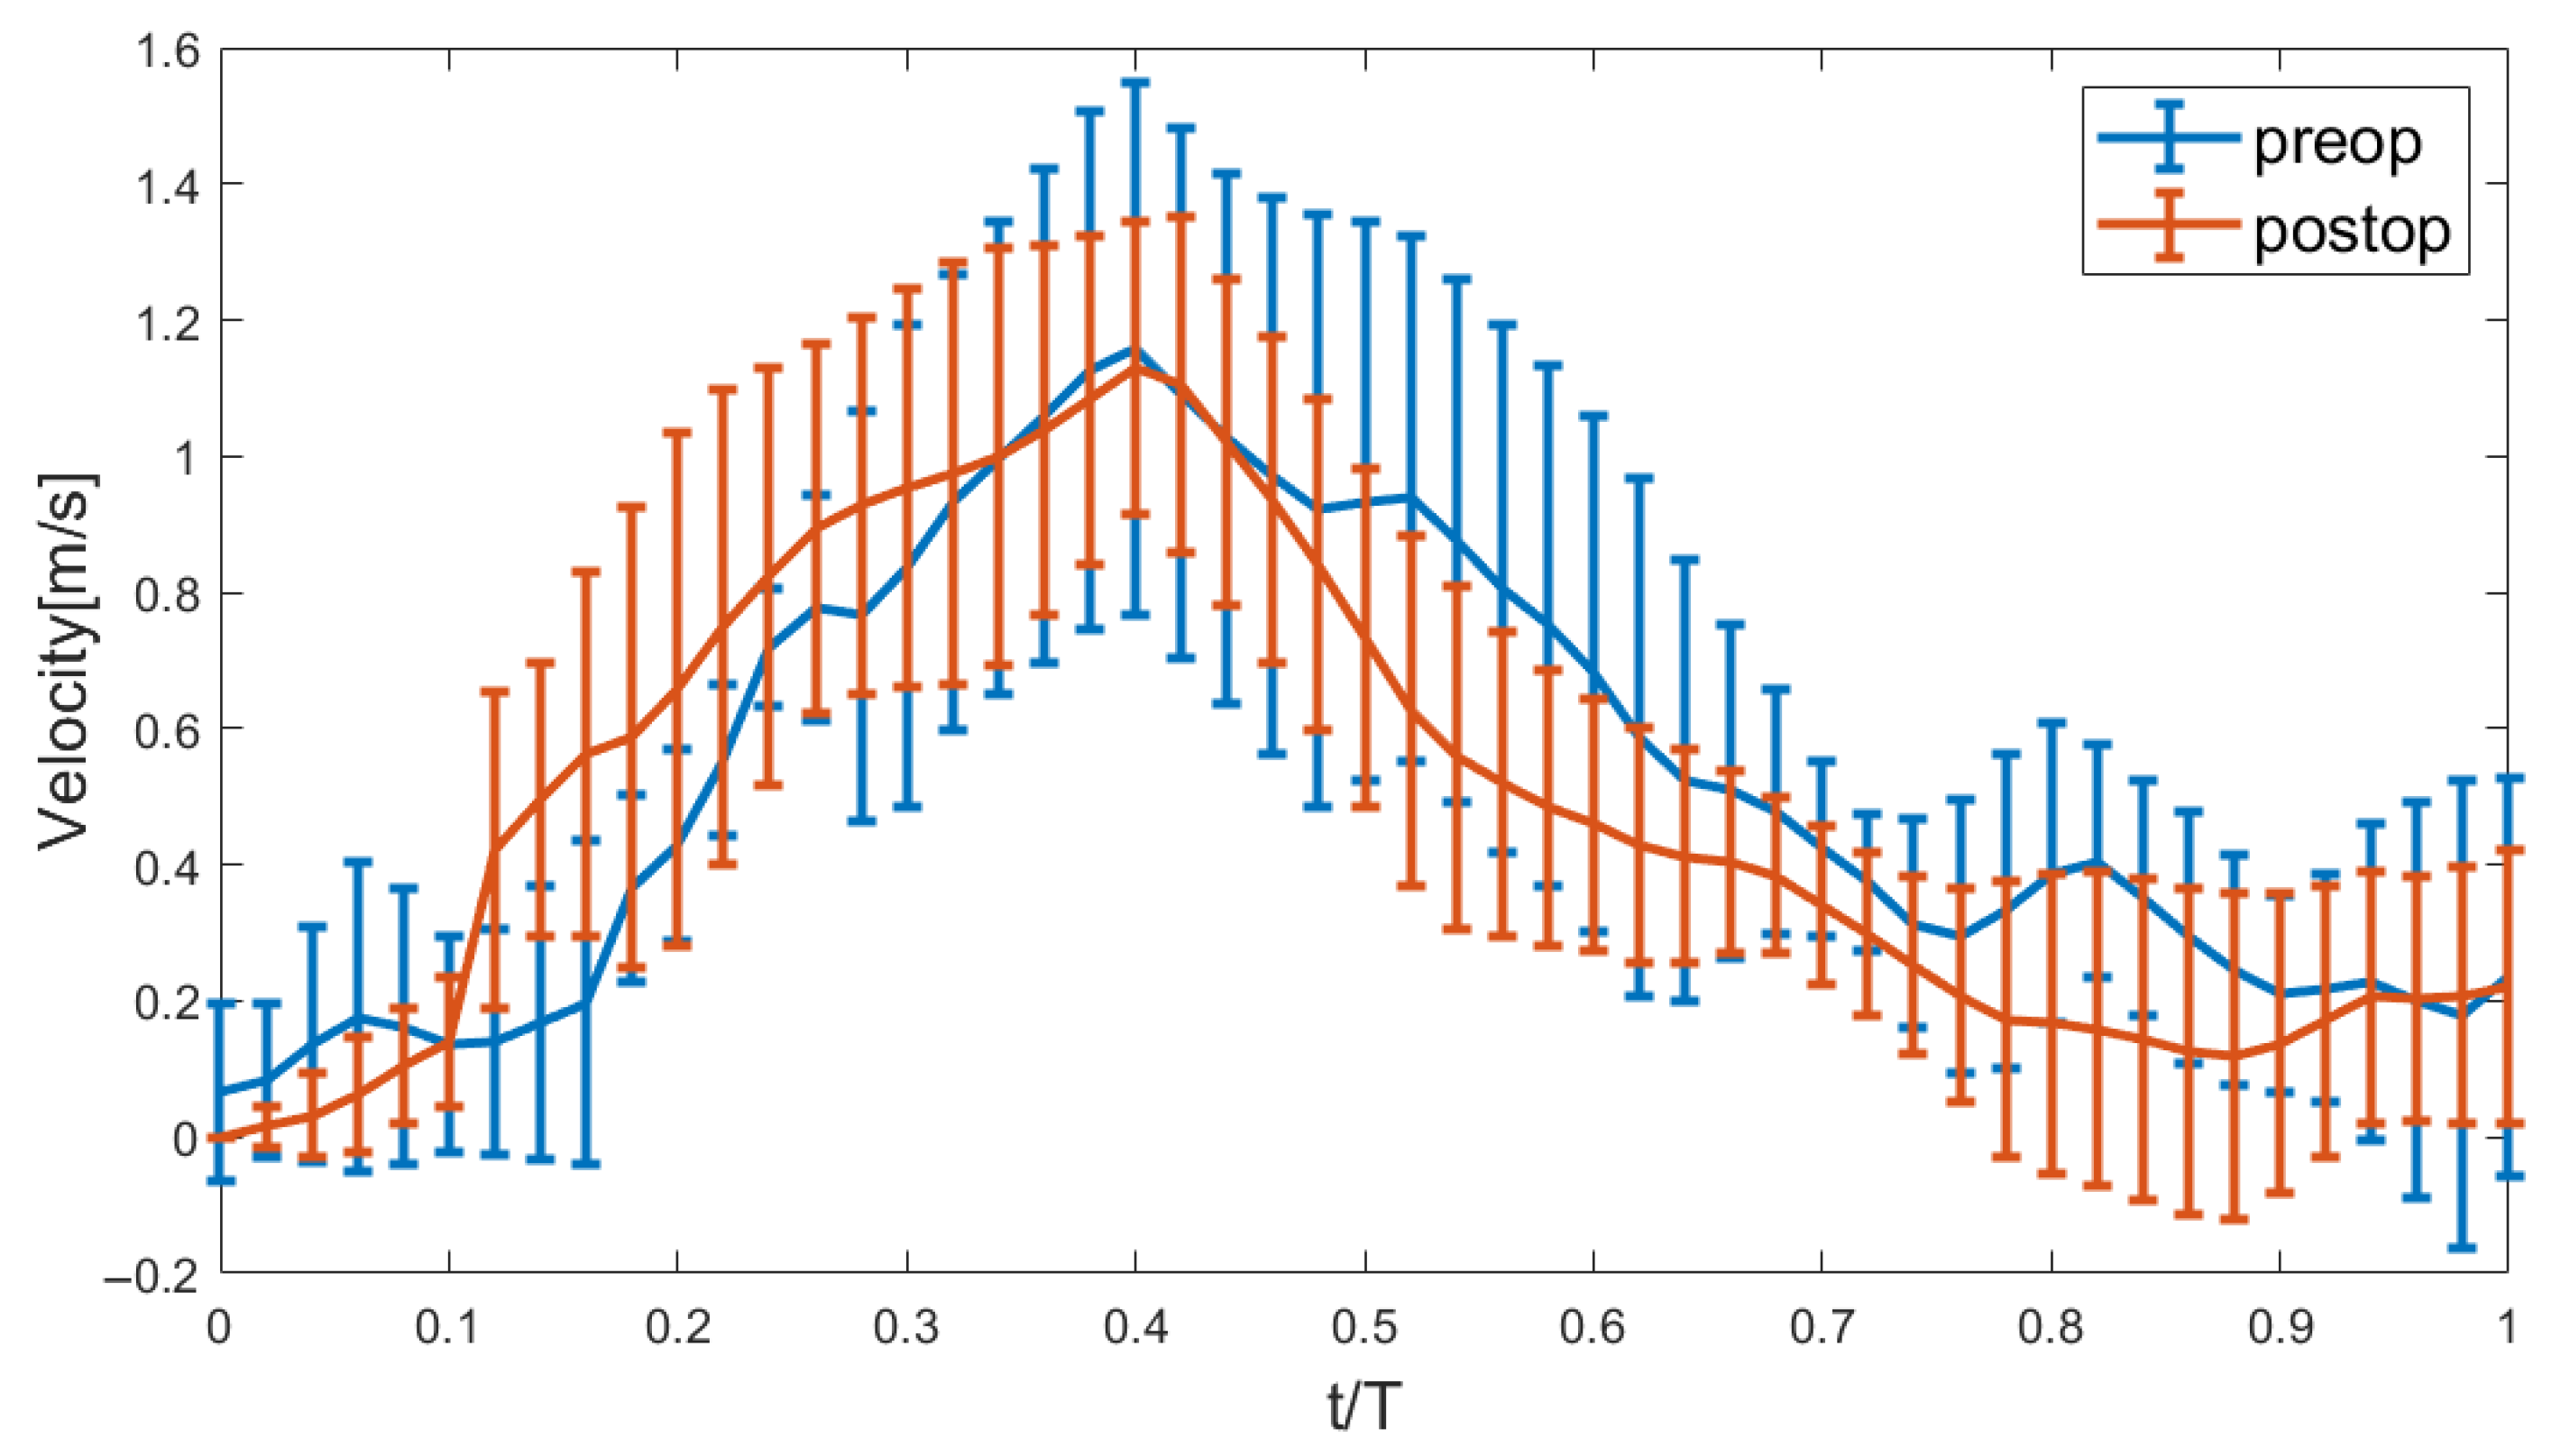
Figure 1. Error bar showing the mean and standard deviation of the peak velocity over the normalized time.
Bioengineering 12 00776 g001
Figure 2. Transesophageal long-axis blood speckle imaging view of the left ventricular (LV) outflow tract and the aortic valve showing the blood flow velocity during different time instants of the cardiac cycle of Patient 1. The velocity vectors are colored with the velocity magnitude. The top of the image is posteriorly positioned towards the left atrium and the bottom is anteriorly positioned toward the right ventricle. (a) Pre-operative images are displayed across the top panels. (b) Post-operative images are displayed across the bottom panels.
Bioengineering 12 00776 g002
Figure 3. Axial velocity, u, and axial shear stress, μ u y , is shown pre- and post-surgery for Patient 1 at different instances of the cardiac cycle. The profiles are located along the white dashed line annotated in Figure 2. The y-direction corresponds to the short axis, where lower y-values indicate proximity to the anterior wall (higher up on the screen and closer to the TEE probe) and higher y-values indicate proximity to the posterior wall (further from the TEE probe).
Bioengineering 12 00776 g003
Figure 4. Error bar showing the mean and standard deviation of axial velocity, u, and axial shear stress, μ u y for Patients 1–10 at peak-systole.
Bioengineering 12 00776 g004
Figure 5. QQ-plot of the difference in P e a k W S S , T A W S S , and O S I between pre-surgery and post-surgery.
Bioengineering 12 00776 g005
Figure 6. Box-whisker plot of the difference in P e a k W S S , T A W S S , and O S I . Which is showing a significant change in O S I following surgery at p-value = 0.0044.
Bioengineering 12 00776 g006
Figure 7. Linear regression showing a correlation between aortic virtual basal ring or “annulus” diameter and P e a k W S S , T A W S S , and O S I .
Bioengineering 12 00776 g007
Table 1. Patient demographics and clinical data.
Patient
#
Age
(Years)
GenderHeight
(cm)
Weight
(kg)
BSA
(m2)
DiagnosisSurgical Indication(Neo-)Aortic Valve MorphologySurgery Performed
Group 1—Dysfunctional aortic valve (>mild stenosis and/or >mild regurgitation)
120Male177.481.42.00LAA isomerism, AVSD s/p repair and aortic valvotomysevere AR and severe AoR and AAo dilationTrileaflet/trisinuate with asymmetric leafletsVSRR and AAoR
220Male164.575.01.85Repaired tetralogy of Fallotsevere ARTrileaflet/trisinuate with right leaflet bendingInternal annuloplasty with AoV repair
38Male128.931.21.06Repaired perimembranous VSD and AoVsevere AR and severe AoR dilationTrileaflet/trisinuateVSRR and AAoR with AoV repair
414Male170.073.11.86Arterial switch operation for TGAsevere AR and severe AoR dilationTrileaflet/trisinuateVSRR and AAoR with AoV repair
526Male170.075.31.89Functionally bileaflet AoVsevere ARFunctionally bileaflet/trisinuate with fusion between the coronary leafletsExternal annuloplasty and AoV repair maintaining bileaflet configuration
625Female157.0102.32.11LAA isomerism, AVSD s/p repairModerate AR and severe AAo dilationTrileaflet/trisinuate with asymmetric leafletsVSRR and AAoR with AoV repair
Mean ± SD18.8 ± 6.8 161.3 ± 17.373.1 ± 23.21.8 ± 0.4
Group 2—Well-functioning aortic valve (</=mild stenosis and/or </=mild regurgitation)
722Male190.486.62.14Functionally bileaflet AoVsevere AAo dilationBileaflet/bisinuateVSRR and AAo replacement with AoV repair
842Female160.076.21.84Ross-Konno procedure for functionally unileaflet AoV and subaortic stenosissevere neo-AoR dilationTrileaflet/trisinuate with asymmetric enlargement of anteriror-right facing sinusVSRR
920Male170.064.81.75Functionally unileaflet AoVsevere AAo dilationFunctionally unileaflet/trisuateVSRR and AAo replacement with bileaflet AoV repair including dividing right and non-coronary leaflet commissure
1013Female140.5401.25Functionally unileaflet aortic valve, aortic coarctation repair, Turner syndromesevere AAo dilationFunctionally unileaflet/trisunateAAo replacement with bileaflet AoV repair including dividing right and non-coronary leaflet commissure
Group 2 Mean ± SD24.3 ± 12.4 165.2 ± 20.866.9 ± 20.11.7 ± 0.4
Total Cohort Mean ± SD21.0 ± 9.2 162.9 ± 17.770.6 ± 21.01.8 ± 0.4
AAo, ascending aortic; AAoR, ascending aortic replacement; AR, aortic regurgitation; AoR, aortic root; AoV; aortic valve; AVSD, atrioventricular septal defect; BSA, body surface area; LAA, left atrial appendage; SD, standard deviation; TGA, transposition of the great arteries; VSRR, valve-sparing root replacement; VSD, ventricular septal defect.
Table 2. Aortic dimensions and aortic valve function.
Patient #Aortic
Root
Dilation
Aortic
Root
Size
(cm)
Ascending
Aortic
Dilation
Ascending
Aortic
Size (cm)
Pre-op Peak
Gradient (mmHg)
Post-op Peak
Gradient (mmHg)
Pre-op Aortic
Regurgitation
Post-op Aortic
Regurgitation
Group 1—Dysfunctional aortic valve (>mild stenosis * and/or >mild regurgitation)
1Severe5.2Severe5.5119SevereMild
2Mild4.2None3.3411SevereNone
3 **Severe3.8Moderate2.685SevereMild
4 **Severe4.6Mild3.2615SevereMild
5Mild3.7None2.71512SevereNone
6Moderate4.5Severe5.036ModerateNone
Group 1
Mean ± SD
2.2 ± 0.9 o4.3 ± 0.61.5 ± 1.4 o3.7 ± 1.27.8 ± 4.59.7 ± 3.82.8 ± 0.4 o0.5 ± 0.5 o
Group 2—Well-functioning aortic valve (</=mild stenosis * and </=mild regurgitation)
7Mild4.0Severe4.81517MildNone
8Severe5.0None3.3512MildNone
9Moderate4.6Severe5.21217MildMild
10 ***Mild3.0Severe3.965NoneMild
Group 2
Mean ± SD
1.8 ± 1.0 o4.2 ± 0.92.3 ± 1.5 o4.3 ± 0.912.8 ± 5.712.8 ± 5.70.8 ± 0.5 o0.5 ± 0.6 o
Total
Mean ± SD
2.0 ± 0.9 o4.3 ± 0.71.8 ± 1.4 o4.0 ± 1.110.9 ± 4.610.9 ± 4.62.0 ± 1.2 o0.5 ± 0.6 o
* Mild aortic valvar stenosis is defined as a peak gradient >15 mmHg. ** Diagnosis of aortic dilation for pediatricaged patient is based on Z-scores. *** Diagnosis of aortic dilation for pediatric-aged patient with Turner syndrome is based on Turner Z-scores and aortic size index. o The mean and standard deviation are calculated by substituting: severe by “3”, moderate by “2”, mild by “1”, and none by “0”.
Table 3. The aortic annulus diameter ( A A D ), peak wall shear stress ( P e a k W S S ), time average wall shear stress ( T A W S S ), and oscillatory shear index ( O S I ) values of ten different patients pre- and post-surgery at y / Y = 0 .
A A D [cm] P e a k W S S [Pa] T A W S S [Pa] O S I [-]
Patient #prepostprepostprepostprepost
Group 1—Dysfunctional aortic valve
13.81.71.04395.160.78041.26530.06540.0364
22.21.41.92152.63220.46560.52260.09070.029
32.71.61.32212.87420.36710.36470.0720.0626
42.52.11.10232.54710.52510.6410.04020.0246
52.61.92.33786.47480.64250.74510.03590.0112
63.01.43.11103.23910.91310.99180.02750.0058
Mean2.81.71.80653.82120.61560.75510.05530.0283
Median2.71.71.62183.05670.58380.69300.05280.0268
S D 0.50.30.81361.61910.20440.32740.02450.0203
Group 2—Well-functioning aortic valve
73.91.52.05545.27260.83211.06440.02940.0147
82.92.21.64812.75350.60430.67370.05720.0336
93.31.32.86534.12590.98161.24960.05670.0251
103.12.02.01531.87620.77280.79380.0680.0318
Mean3.31.82.14603.50710.79770.94540.05280.0263
Median3.21.82.03543.43970.80250.92910.0570.0285
S D 0.40.40.51341.49750.1560.26040.01650.0086
Tot Mean3.01.71.94233.69560.68850.83120.05430.0275
Tot Median3.01.71.96843.05670.70770.76950.0570.0271
Tot S D 0.50.30.69741.49340.20040.3030.02070.0159
Disclaimer/Publisher’s Note: The statements, opinions and data contained in all publications are solely those of the individual author(s) and contributor(s) and not of MDPI and/or the editor(s). MDPI and/or the editor(s) disclaim responsibility for any injury to people or property resulting from any ideas, methods, instructions or products referred to in the content.