1. Introduction
Cardiovascular disease is a leading cause of death in the United States, accounting for about 24% of total deaths in 2010 [
1]. Improving current diagnostic methods and developing new tools can help decrease associated mortality. Auscultation of heart sounds has been providing useful diagnostic information and is a common test performed during physical examinations. Computer analysis of these sounds can provide additional quantitative diagnostic information that may be helpful for screening patients suspected of heart disease. Seismocardiographic (SCG) signals are the cardiac vibrations measured noninvasively at the chest surface [
2,
3,
4,
5,
6]. Measurement of cardiac vibrations was performed as early as the start of the 20th century [
7]. Many variations within this approach, such as vibrocardiography (VCG), kinetocardiography (KCG), ballistocardiography (BCG), cardiokymography (CKG), and apexcardiography have been described [
8,
9,
10,
11,
12,
13,
14,
15,
16,
17,
18].
These signals are believed to be caused by the mechanical processes associated with the heart activity (such as cardiac contraction, blood momentum changes, valve closure, etc.). The characteristics of these signals can contain useful information that correlates with cardiovascular pathologies [
19]. Such information would also be complementary to other methods that detect the heart’s electrical activity (such as electrocardiography). Early studies [
7] suggested that changes in cardiac output may be estimated using these methods. Certain signal patterns were reported in patients with myocardial infarctions [
20]. These signals were also found to reflect the strength of myocardial contractions [
21,
22] and have detectable waveform changes with heart disease resolution [
23]. More recent studies suggested utility for monitoring left ventricle function [
4,
24], and heart and breathing rates [
3,
9,
25,
26,
27,
28]. A case study reported changes in the relative strength of the SCG waves that correspond to valve closure, rapid ventricular filling and ejection that preceded the onset of ischemic symptoms that resolved after therapy [
4].
The relation between SCG waves and cardiac activity are not fully understood. However, several studies have investigated that relationship [
29,
30,
31]. For example, SCG was found to contain a low-frequency wave during atrial systole, a high-amplitude wave during ventricular systole, a wave during early ventricular filling, and relatively high-frequency waves at the time of the first and second heart sounds [
29]. A three-dimensional model of ventricular contraction indicated that the first SCG peak after electrocardiogram (ECG) R-wave may be related to aortic valve opening [
30]. Simultaneous recording of SCG and ECG suggested that the peaks and valleys of the dorso-ventral component of SCG correspond to different physiological events including mitral valve opening and closure, aortic valve opening and closure, isovolumetric contraction, rapid ejection, and rapid filling [
31]. Electromechanical systole, pre-ejection period, and left ventricular ejection time were identified using simultaneous recordings of SCG and ECG signals [
32]. Multi-channel SCG was used to measure the feature points in a cardiac cycle corresponding to the four valvular auscultation locations. Using this method, six new feature points (including left ventricular lateral wall contraction peak velocity, septal wall contraction peak velocity, trans-aortic valve peak flow, transpulmonary peak flow, trans-mitral ventricular relaxation peak flow, and trans-mitral atrial contraction peak flow) were extracted [
33]. However, SCG signals are vulnerable to inter-subject variations such as body mass index, sex, age, and health conditions [
3]. In addition, SCG vibrations have relatively low amplitudes that can be easily contaminated by building vibrations, motion artifacts (e.g., patient movements, muscle related disease, etc.) and respiration noise, which can lead to a misinterpretation of SCG signal features [
31,
34,
35,
36].
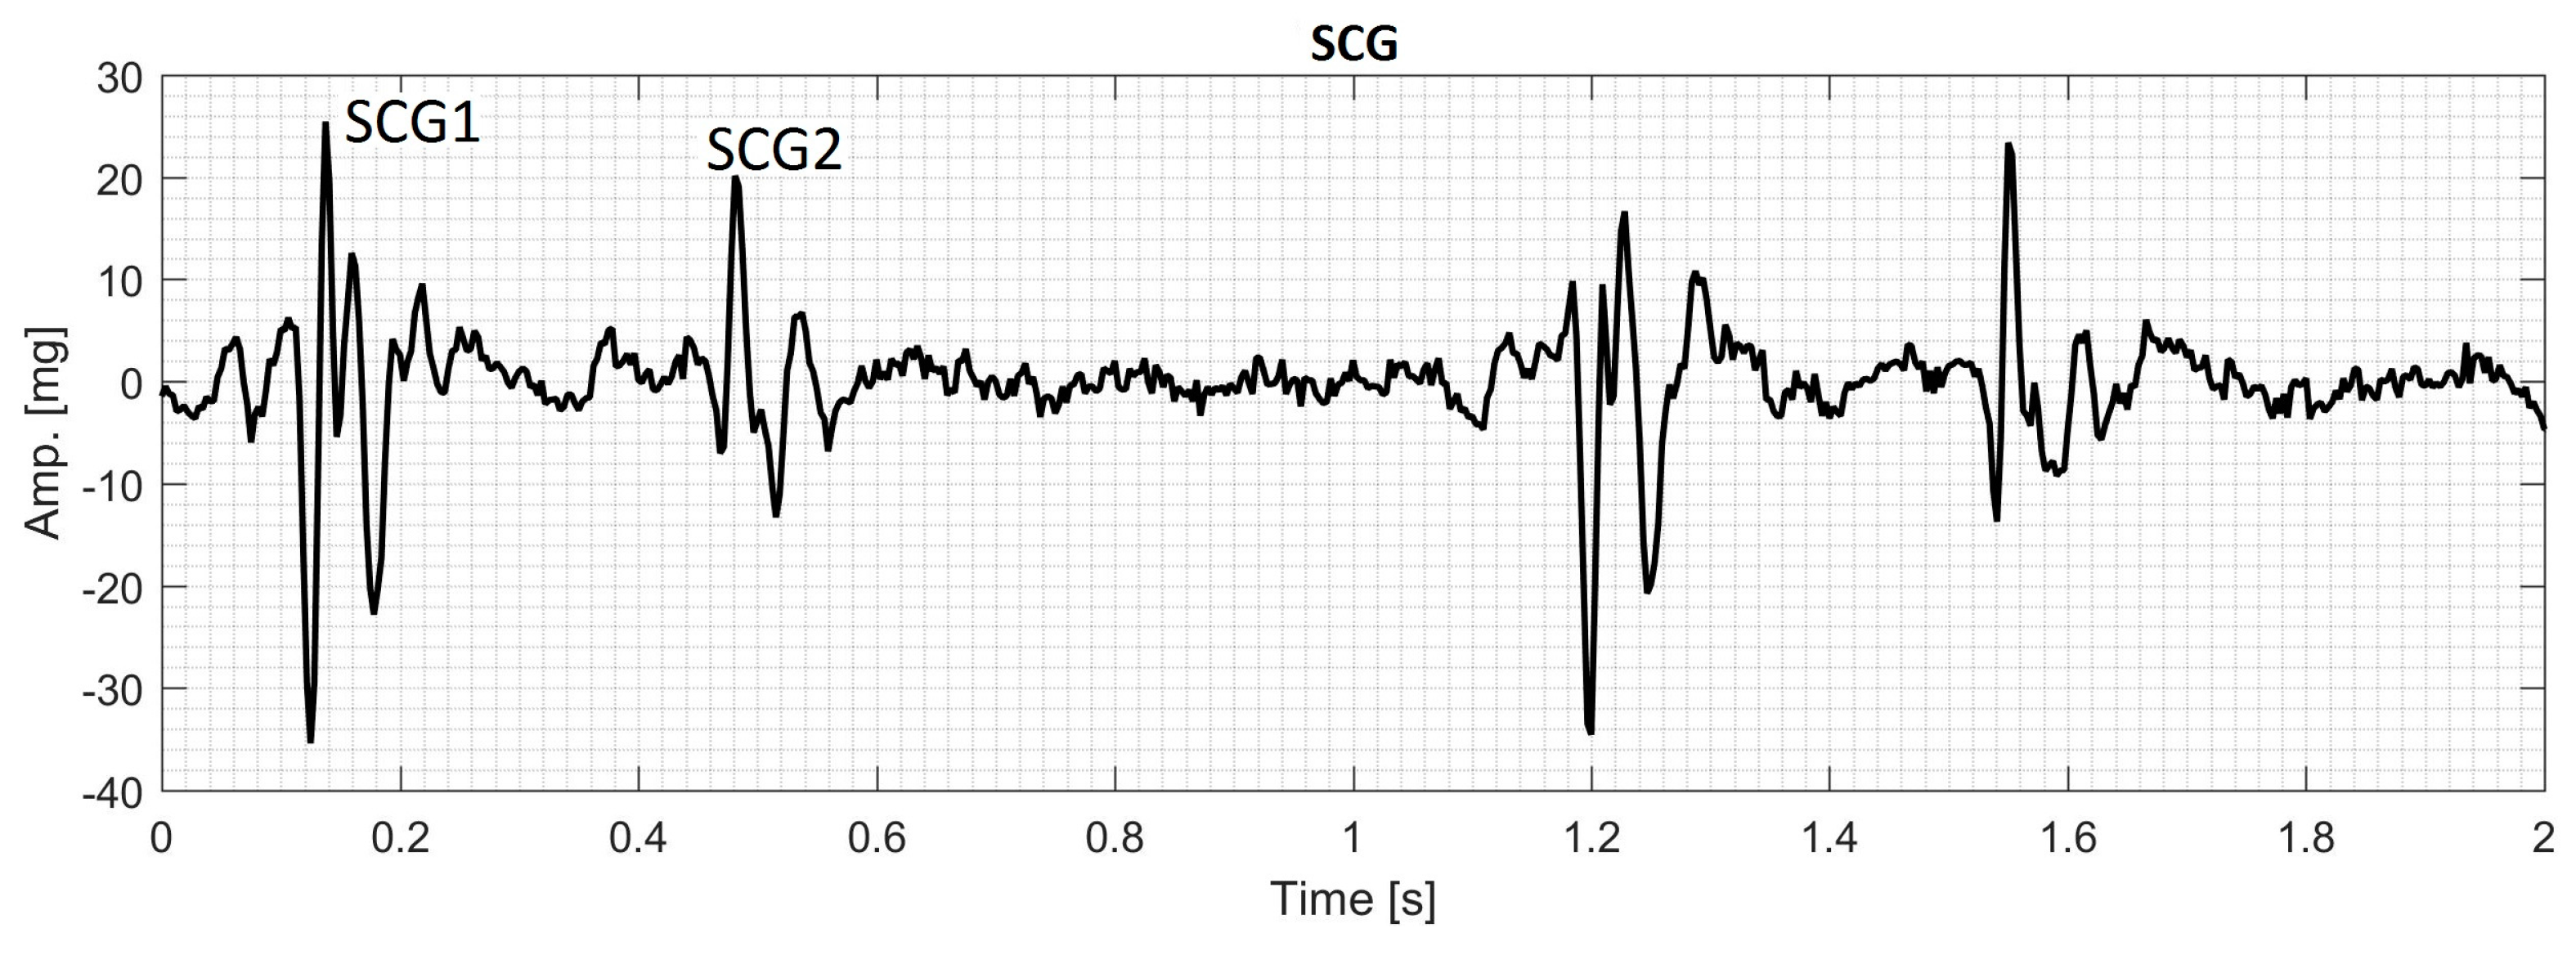
During each cardiac cycle, typical SCG contains two main events that can be called the first SCG (SCG1) and the second SCG (SCG2) as shown in
Figure 1. The frequency content of SCG signals is dominated by low frequencies where the human auditory sensitivity is low and may not be sufficient to extract the characteristics of these signals [
37,
38]. Consequently, examination of SCG signals may not be optimally done by manual auscultation alone and a computer assisted analysis would likely help obtain enhanced qualitative and quantitative description of the signal characteristics. Many methods have been used for SCG analysis [
9,
10,
11,
39] including time-frequency analysis [
35,
40,
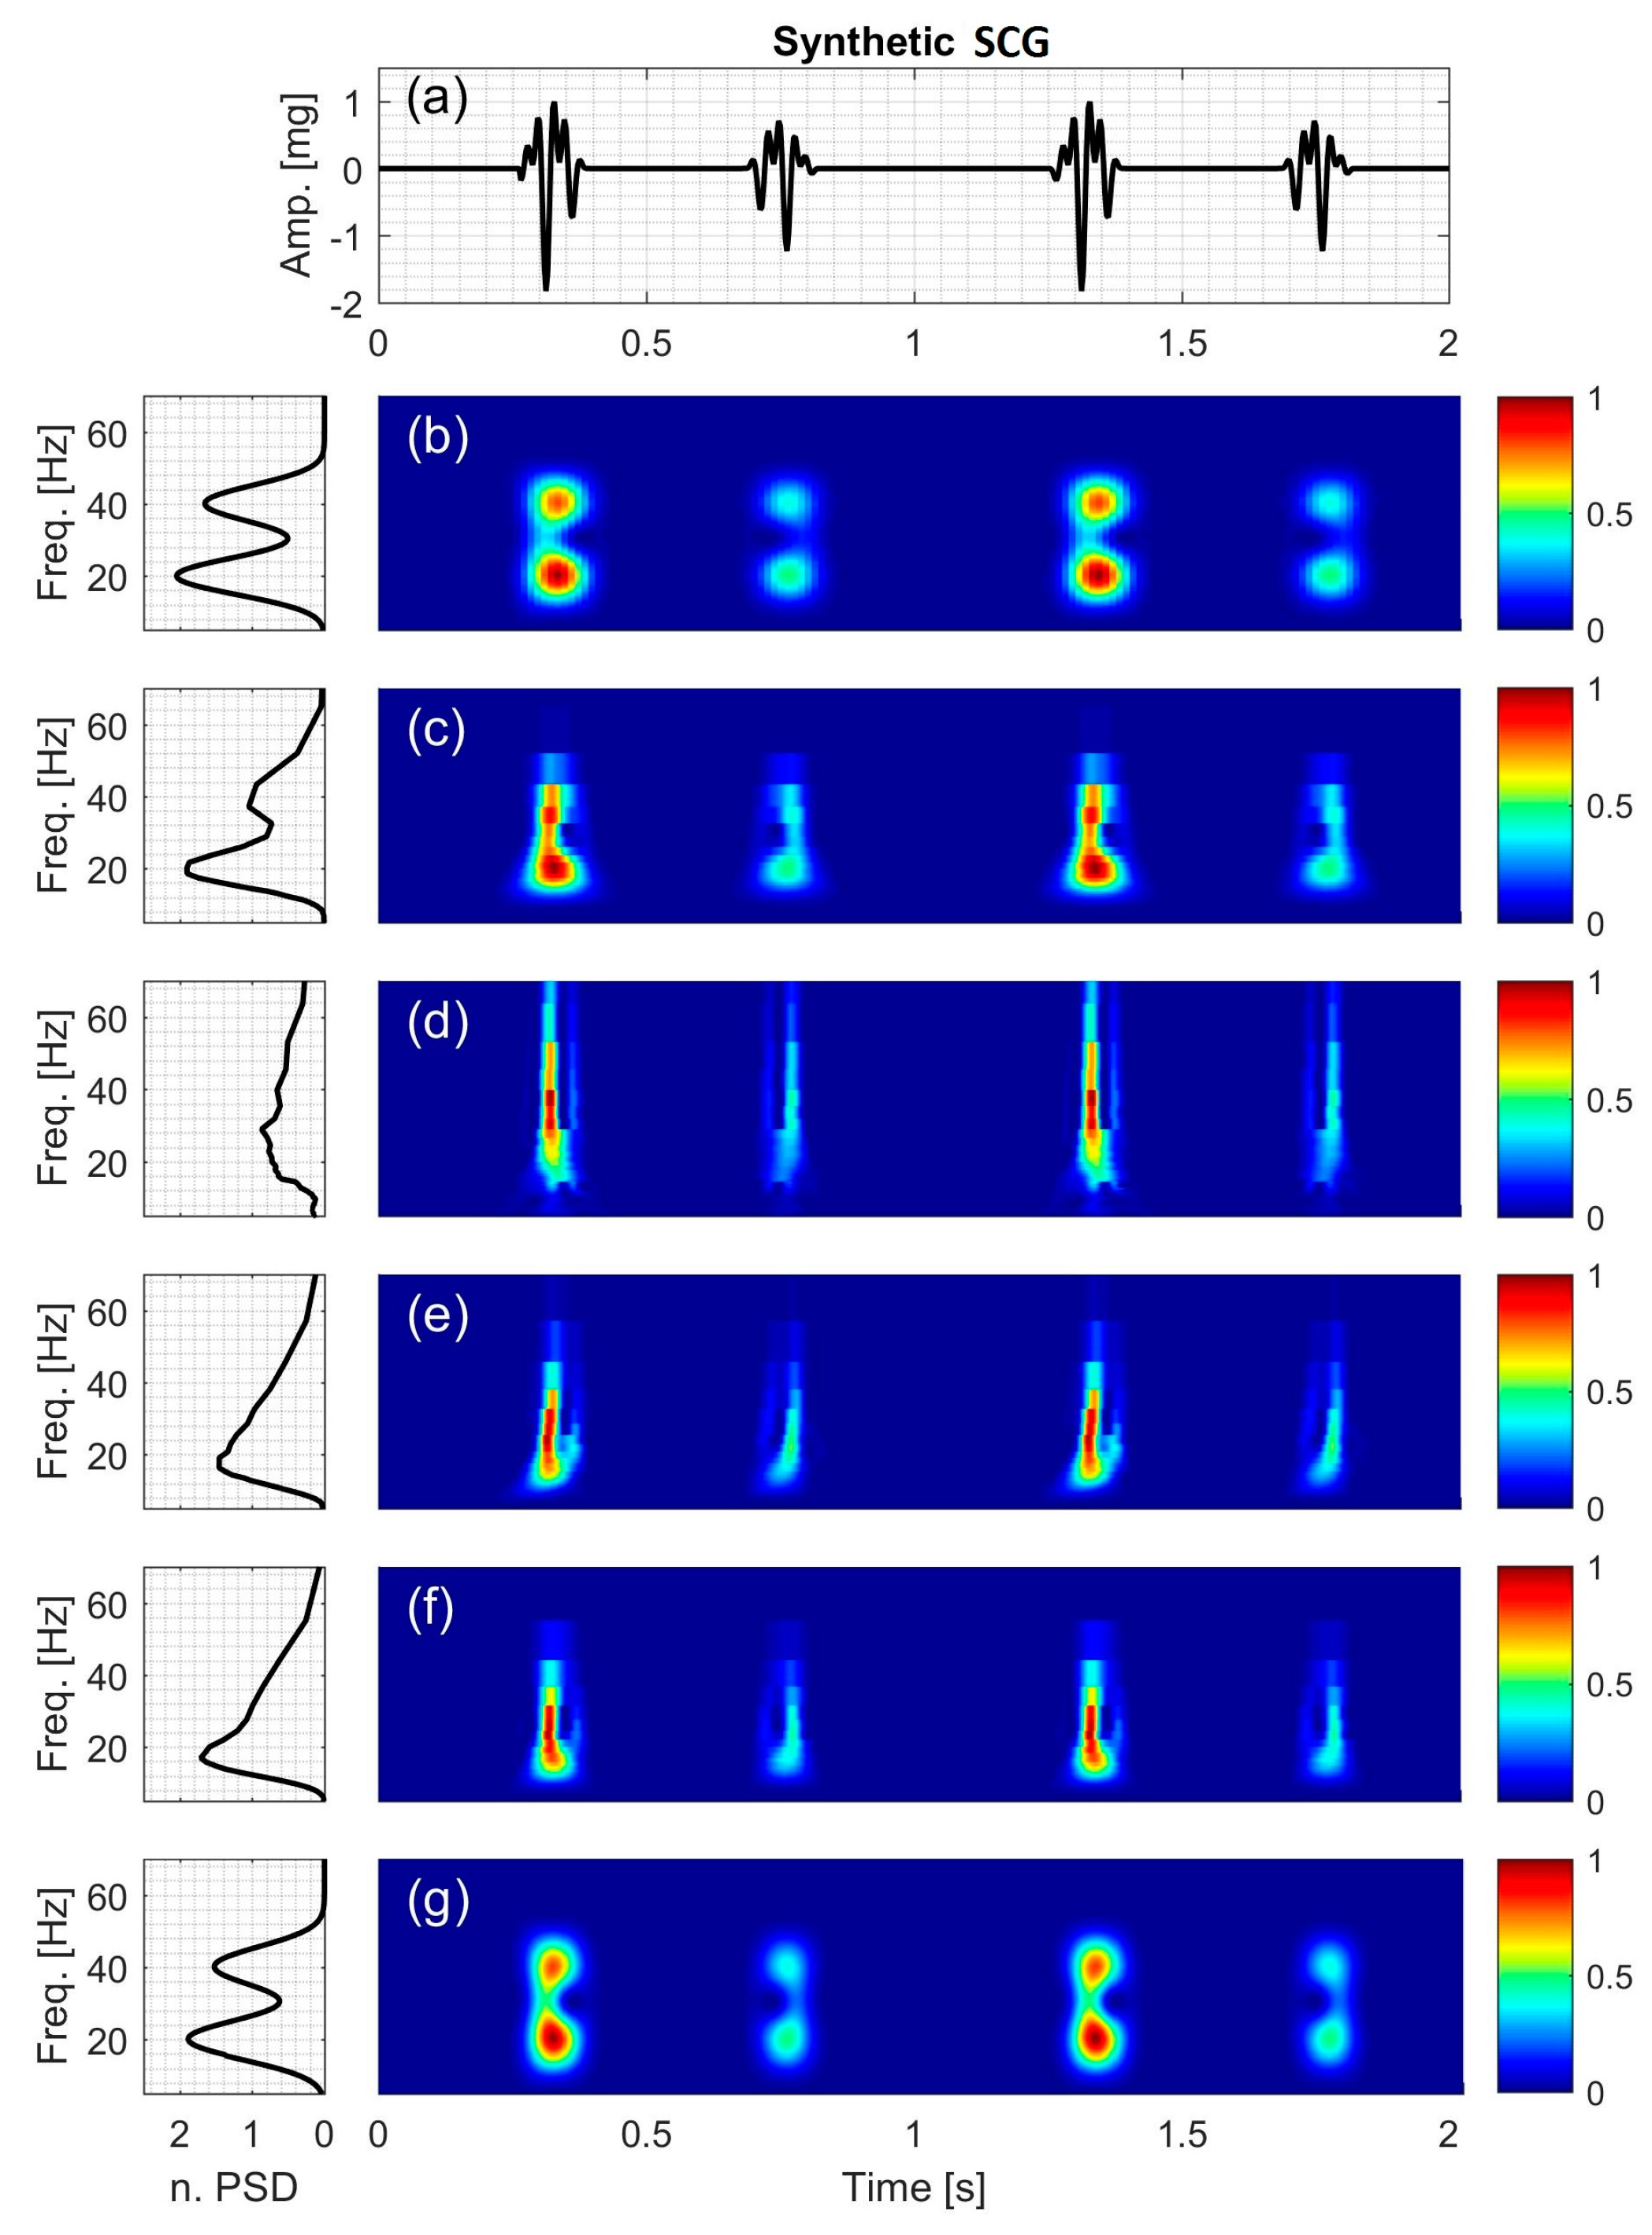
41]. The current study focusses on extracting spectral features of SCG signals using time-frequency distributions (TFDs).
TFDs have been utilized in the analysis of a wide range of signals including biomedical signals such as electrocardiogram [
42,
43], electroencephalogram [
44,
45], phonocardiogram [
46,
47,
48,
49], and myoelectric signals [
50]. The ability of TFD methods to provide an accurate time-frequency representation depends on the underlying assumptions associated with each method. One common approach for TFD estimation is the short-time Fourier transform (STFT). The STFT is relatively simple, but it may not effectively track steep changes in the time direction [
46,
51]. In addition, the STFT has static resolution in the time-frequency plane, which can result in resolution limitations. For example, improving the resolution of one of either time or frequency domains worsens the resolution in the other domain. The wavelet transform (WT) was proposed to overcome the resolution issues of the STFT, but the former also has its own resolution limitations [
43]. For example, a wavelet shows coarser frequency resolution at higher frequencies and vice versa [
52]. This property suggests that WT can be a proper candidate for TFD analysis of signals with discontinuity or steep changes. The wavelet theory can be divided into two important parts; continuous wavelet transform (CWT) and discrete wavelet transform (DWT). While DWT is usually used for signal filtering, denoising and compressing [
49,
53,
54,
55,
56], CWT is more useful for the signal time-frequency analysis [
46,
50,
57].
The chirplet transform (CT) is another transform that can be viewed as a generalization of both the STFT and WT [
58]. It is a transform that involves a function of four parameters: time, frequency, scale and chirp rate; where chirp rate is defined as the instantaneous rate of change in the signal frequency [
59]. Since the conventional CT is developed based on the linear chirp kernel, it may provide inaccurate TFD estimations for the signals that have nonlinear instantaneous frequency (IF) trajectory. Therefore, Peng et al. [
51] proposed the polynomial chirplet transform (PCT), which is based on a kernel with a polynomial nonlinear IF. This method is more suitable for the signals with IF trajectories that are continuous (either linear or nonlinear) functions of time.
All of the TFDs under discussion are bilinear (or quadratic) representations that combine the time and frequency domain signal information, i.e., they describe the temporal and spectral characteristics of the signal simultaneously. It is worth noting that for a bilinear TFD, the power spectral density (PSD) of a signal that contains two components differs from the summation of the PSD of the components. The cross terms (also called interference terms) in bilinear representations cause artifacts (e.g., extra peaks) in those regions of the time-frequency plane where energy spectral density of the signal components overlap [
52].
There are no previous detailed studies that compared the performance of TFD for the analysis of SCG signals. There are, however, studies that addressed similar cardiac signals. For instance, Crowe et al. [
43] proposed WT for the analysis of the ECG signals. WT has also been used to analyze ECG signals of patients with some cardiovascular pathology [
42]. Obaidat [
46] compared the resolution of STFT, WT, and Wigner-Ville distribution for the analysis of phonocardiogram signal. He concluded that WT provided more details of the first and second heart sounds that are acquired by a phonocardiograph. Debbal and Bereksi-Reguig [
48] performed a time-frequency analysis of a phonocardiogram signal and compared the performance of STFT, WT and Wigner distribution. Their results suggested that WT revealed the time-frequency characteristics of the signal and was superior to STFT and Wigner distribution in distinguishing between different components of the first and second heart sound. Cherif et al. [
49] used wavelet packet transform and discrete wavelet transform with different mother functions to filter murmurs from phonocardiogram signals. They concluded that discrete wavelet transform was more suitable for filtering the murmurs without affecting the heart sound and their components. Also, Ergen et al. [
57] investigated the characteristics of the phonocardiogram signals by using wavelets of eight different mother functions and concluded that Morlet was the most appropriate wavelet to extract the features of heart sounds and murmurs.
Understanding different characteristics of SCG, including its TFD, may lead to a more comprehensive description of signals that are related to cardiac activity. Furthermore, successful automatic classification of SCG signals in health and disease can provide possible new methods for diagnosing and monitoring heart function. Time-frequency characteristics are potentially useful features that have been used for automatic classification of similar biomedical signals. However, there is no previous study that focused on determining the most suitable TFD for extracting features of SCG signals.
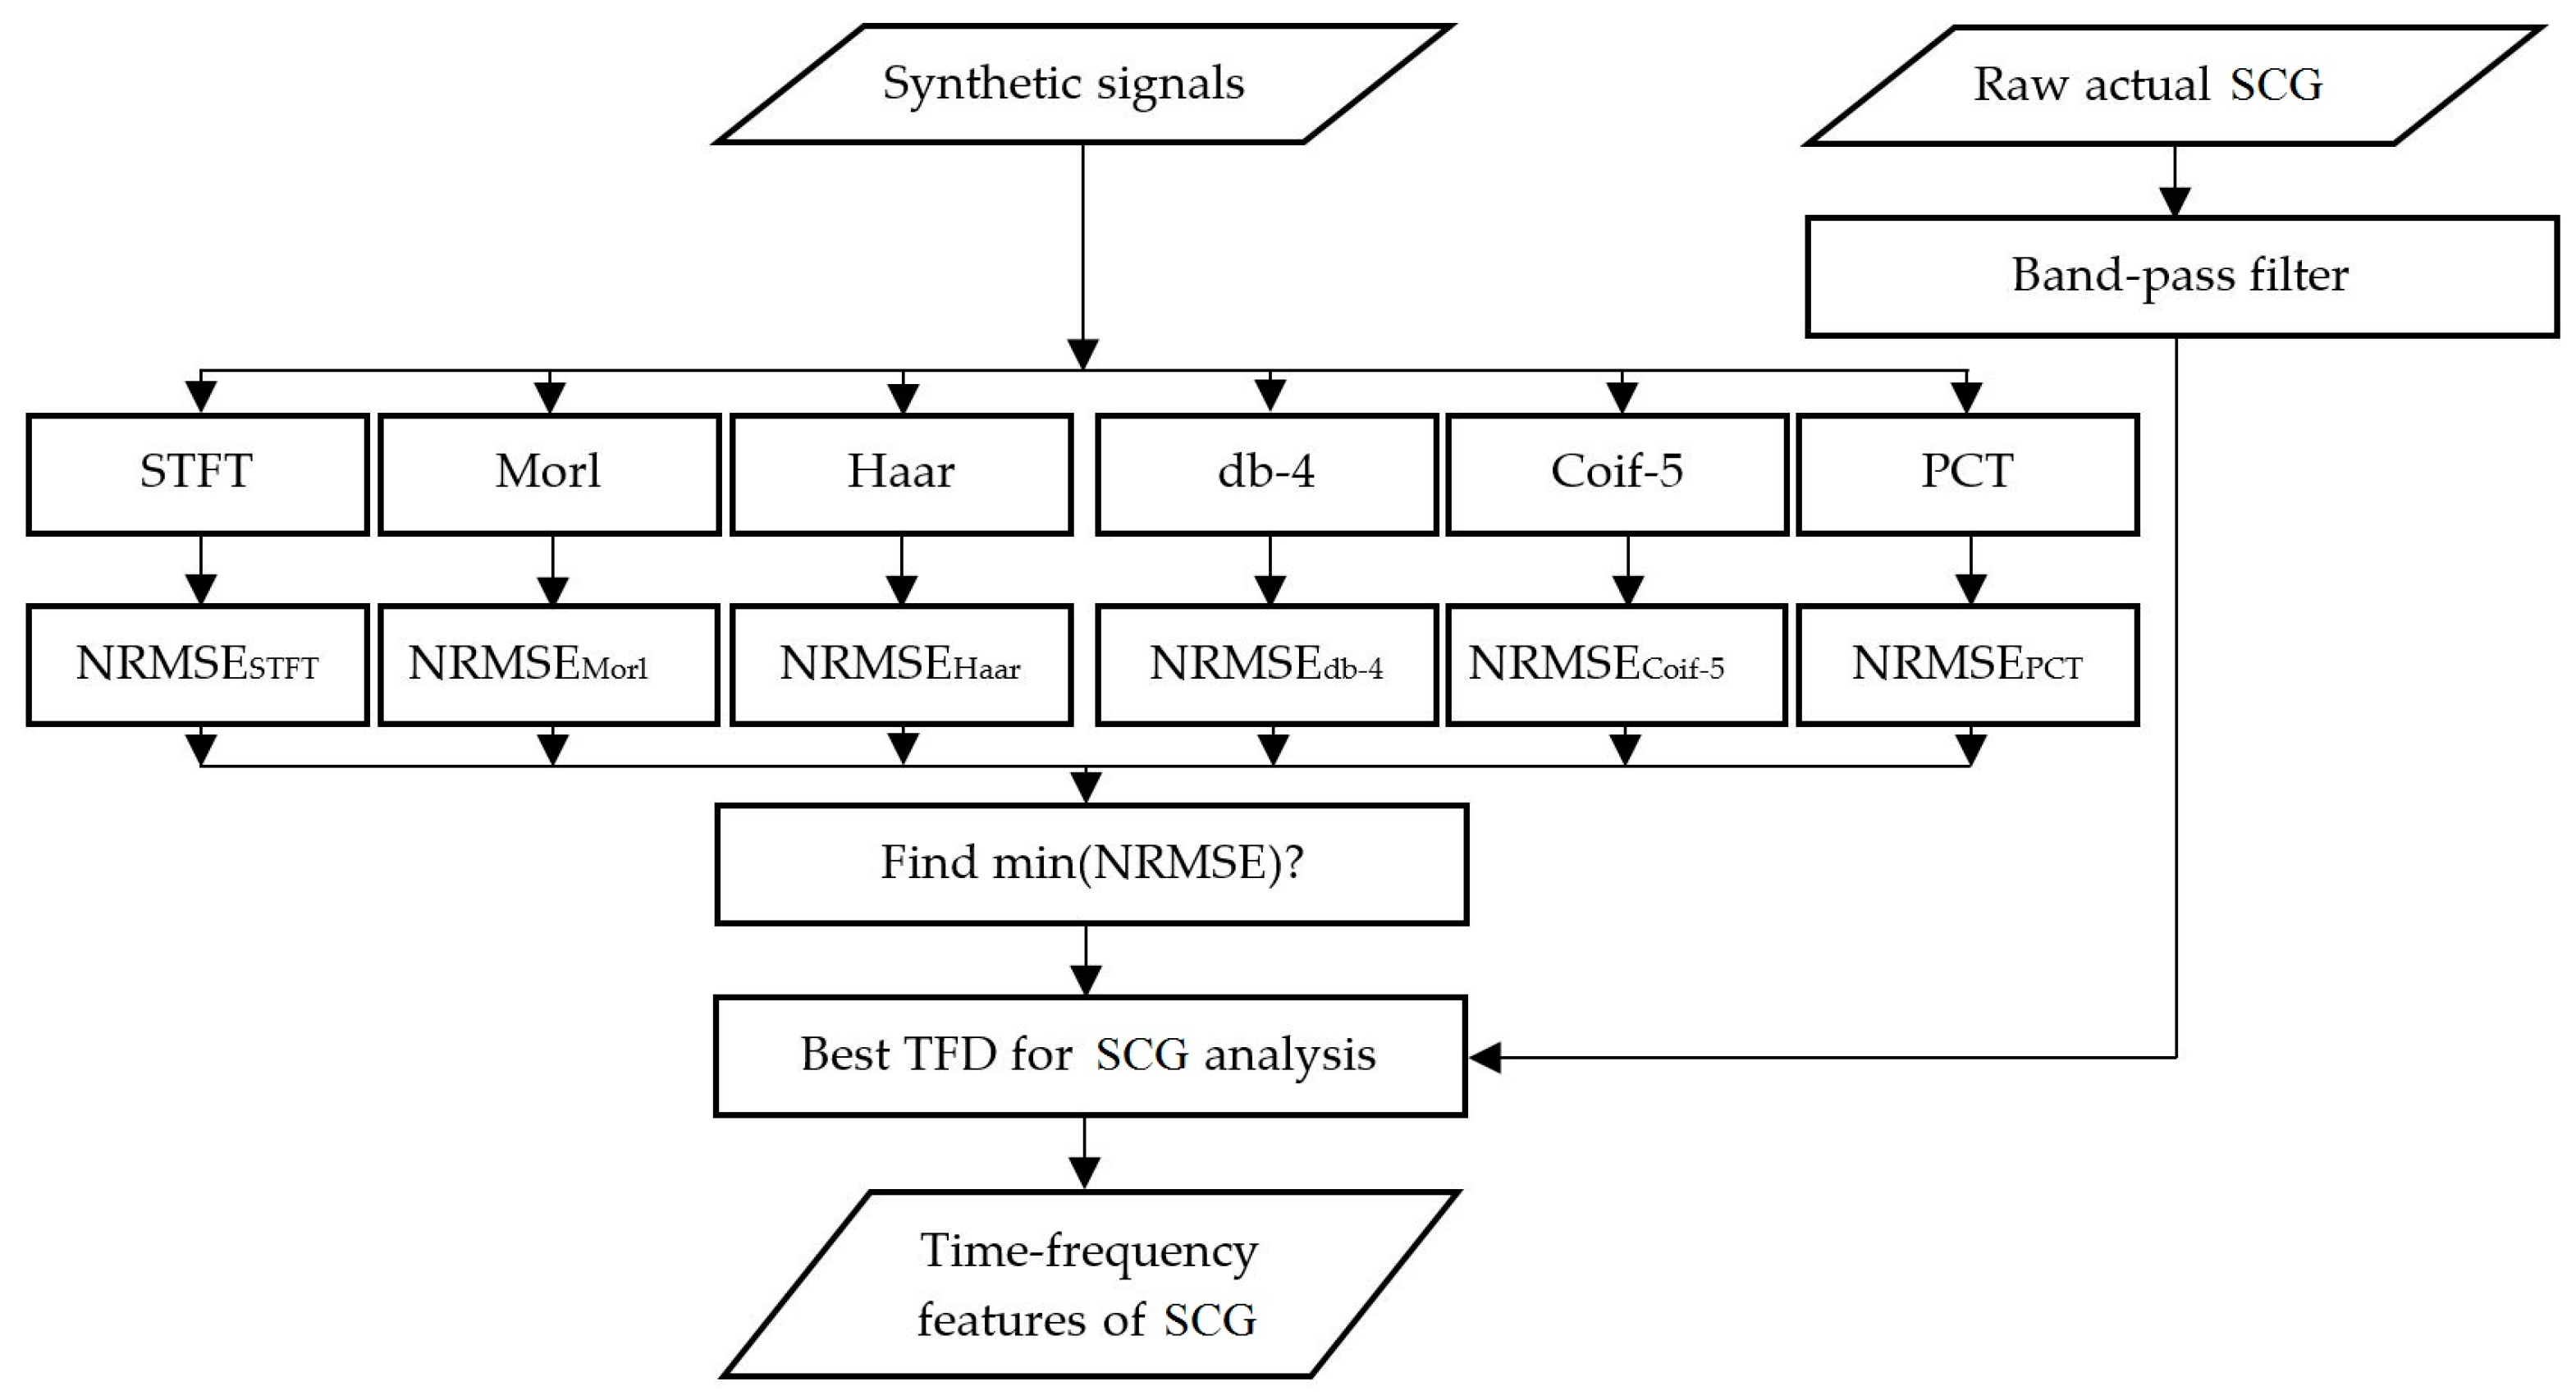
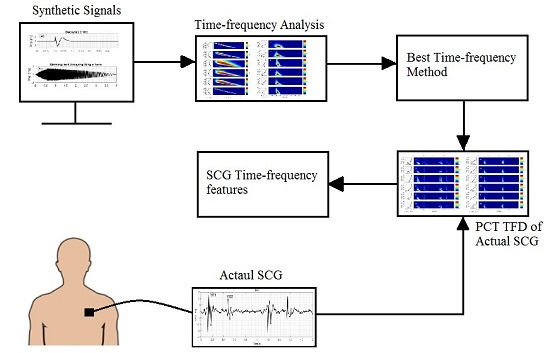
The objective of the current study is to compare the performances of different TFDs for the analysis of SCG signals. The TFDs that can extract SCG features more accurately will be identified and used to analyze actual SCG signals. A brief description of the theory behind STFT, WT, and PCT is provided in
Section 2. Results are presented and discussed in
Section 3 followed by conclusions in
Section 4.


