Article

Investigation on the Modeling and Reconstruction of Head Injury Accident Using ABAQUS/Explicit

1
College of Mechanical and Electrical Engineering, Chengdu University of Technology, Chengdu 610059, China
2
Hongguang Street Health Center, Pidu District, Chengdu 610097, China
3
Department of Mechanical Engineering, South Dakota State University, Brookings, SD 57006, USA
*
Author to whom correspondence should be addressed.
Bioengineering 2022, 9(12), 723; https://doi.org/10.3390/bioengineering9120723
Submission received: 9 October 2022 / Revised: 18 November 2022 / Accepted: 21 November 2022 / Published: 23 November 2022

Abstract

:
A process of modeling and reconstructing human head injuries involved in traffic crashes based on ABAQUS/Explicit is presented in this paper. A high-fidelity finite element (FE) model previously developed by the authors is employed to simulate a real accident case that led to head injury. The most probable head impact position informed by CT images is used for the FE modeling and simulation since the head impact position is critical for accident reconstruction and future analysis of accidents that involve human head injuries. Critical von Mises stress on the skull surface of the head model is chosen as the evaluation criterion for the head injury and FE simulations on 60 cases with various human head—concrete ground impact conditions (impact speeds and angles) were run to obtain those stress values. The FE simulation results are compared with the CT images to determine the minimum speed that will cause skull fracture and the corresponding contact angle at that speed. Our study shows that the minimum speed that would cause skull fracture is 3.5 m/s when the contact angle between the occipital position of the injured head and the ground is about 30°. Effects of the impact speed and the contact angle on the maximum von Mises stress of the head model are revealed from the simulations. The method presented in this paper will help forensic pathologists to examine the head impact injuries and find out the real reasons that lead to those injuries.

1. Introduction

Traffic injuries and fatalities are becoming a global concern due to the dramatic increase in road traffic crashes, which has caused deaths, financial losses, and other unbearable losses to families and society. In 2018, the World Health Organization (WHO) reported an annual 1.35 million traffic deaths and up to 50 million traffic injuries [1]. Among all the car crash injuries, 30% of them were head injuries, including skull fracture and brain damage, and many other injuries, diseases, and sequelae such as the vegetative state, blindness, migraines, and mental illness. In-depth investigations of these biomechanical phenomena behind traumatic brain injury are indispensable for understanding the relationship between human head responses and various vehicle–head impact scenarios. Results of such investigations can also be used as critical proof for forensic analysis of craniocerebral injury in traffic crashes.
Despite tremendous efforts and resources invested on head injury study, the barriers and issues in the analysis of head injury incurred in traffic crashes still remain unsolved. Because a traffic crash is instantaneous and involves a complicated, high-rate process, a rough estimation may lead to wrong conclusions. In most cases, an accurate description of the entire process is almost impossible due to time restrictions for road closures as well as other constraints. Thus, the real cause of the traffic crash can hardly be obtained. On the other side, a thorough inspection of head injuries is essential in forensic investigations because it is critical for pathologists to understand the injury mechanism so as to determine whether such injuries are accidental or inflicted.
During the second half of the 20th century, a number of mathematical models were developed based on Newton’s principles and experimental observations for the purpose of predicting human head injury mechanisms in given situations. A comprehensive review of those models was performed by Cory et al. in 2001 [2]. However, the accuracy of those models in reproducing the traffic crashes is relatively low due to errors in the acquired experimental data. In vitro experiments directly performed on human specimens can provide correct data, but such experiments require high precision measurement equipment, which are not only very costly, but also intend to cause ethical disputes. In many experimental studies, physical or biological substitutes were tested to understand the relationship between clinical symptoms and brain injury mechanisms. However, due to the complex dynamic loading conditions that victims are subjected to, it is almost impossible to reconstruct real head injuries incurred in accidents [3]. Besides the experimental approaches, use of scalable computers provided a promising, safe, and cost-effective approach to evaluate the consequences of a given head impact by calculating the stress and strain of the brain under a high energy shock through finite element (FE) analysis and simulation [4].
As demonstrated before, due to various constraints such as the time restriction for road closures and technology limitations, the data and information collected from scenes of traffic crashes are sometimes incomplete and may even contain considerable errors. This makes it extremely difficult to conduct on-site investigations of pedestrian collision accidents or any post-accident analysis based on the data acquired from the scenes of accidents. In other words, in order to yield quality data that can be used to reveal the head’s biomechanical response during severe impacts, the scenes of traffic crashes need to be reconstructed and entire impact processes have to be reproduced. In this regard, computational modeling and simulation is the most powerful tool for this purpose.
Traffic crash research includes traffic crash analysis, reproduction, and statistical analysis [5]. The traffic accident reconstruction is a process of making inferences about the cause of the traffic crash based on the vehicle damage, personal injury situation, and various forms of traces on the scene of the traffic crash, referring to the accounts of the parties and witnesses. A correct and comprehensive analysis of a traffic crash almost equals to repeating that accident, from which much valuable information and data are revealed, which would hardly be available otherwise. Thus, the traffic accident reconstruction plays a crucial role in the passenger/pedestrian injury risk prediction. It also provides a scientific basis for the transportation department in decision making and assists the jury in deciding key issues in a traffic crash case. In short, the reproduction of traffic crashes is a key component in the traffic crash research. As verified in numerous previous studies, simulation results can provide more valuable insights about the traffic crashes and assist traffic officers in identifying responsibilities of involved parties and revealing the courses of accidents.
For example, Deng et al. investigated and assessed the dependence of dummy head injury mitigation on the side curtain airbag and occupant distance under a side impact of a Dodge Neon via full-scale FE simulations [6]. Chai et al. proposed a method for traffic crash scene reconstruction and the process reconstruction by combining digital reconstruction and computer simulation technology [7]. Berthelson et al. employed a combined FE–mathematical surrogate modeling approach to study car crash-induced neck injury trends in response to variations in traffic crash parameters at significantly-reduced number of necessary FE simulations [8]. Cui et al. developed a precise FE model of the head and neck based on human anatomical structure and used that model to study neck injuries caused by rear impact at different speeds [9]. He et al. conducted two-dimensional mesoscale FE analysis of a multi-layered brain tissue to calculate the damage-related average stress triaxiality and local maximum von Mises strain in the brain [10]. In their work, behaviors of wet and dry brain issues were described by integrating the FE model with a rate-dependent hyperelastic and internal state variable method. All these works have proved that the combination of FE modeling and simulation and the traffic crash identification technology can effectively enhance the capacity in reconstructing the impact process in traffic crashes, therefore promoting the impact head injury analysis.
Because of its advantages in modeling complicated shapes and simulating real physical processes, FE methods have been extensively used for evaluating the crashworthiness of vehicle structures [11,12,13,14], designing thin-walled energy absorbers [15,16], and investigating head injuries incurred in different collision events [17]. With a high fidelity and geometrically accurate human head model, the FE methods are considered the best tool for studying head response under controlled impact conditions [18,19]. Many high-fidelity FE human head models have been developed, and those developed models provide a scientific background for the present study. Ruan et al. [20] established a detailed FE head model consisting of 6080 nodes and 7351 elements in 1994. Zhou and coworkers improved that model to a more detailed one that consisted of 17,656 sections and 22,995 units. The enhanced model even differentiated the white and gray matter in the brain [21]. In 2001, Zhang et al. continued to revise that model by redefining the sliding interface between the skull and brain model [22]. Kleiven and Hardy developed another FE head model in 2002 and used that model to study the biomechanical response of the brain in low-severity impacts, including the relative motion between the skull and the brain [23]. Horgan and Gilchrist constructed a 3D FE representation of the human head complex for simulation the transient occurrences of simple pedestrian accidents [24].
Since 2016, more physics-based, biofidelic human head models have been developed using advanced modeling methods and novel constitutive laws. Those state-of-the-art FE head models have been used for experiment-informed simulations to faithfully reproduce the traffic crashes and human head response under impact loading. Sahoo et al. [25] enhanced an existing FE head model with composite modeling and a new constitutive law for the skull. The response of their FE head model was validated using data from 15 temporo–parietal impact experiments, conducted with postmortem human surrogates. Cotton et al. [26] proposed a new modeling methodology that addressed several limitations of conventional FE head models. They employed that methodology to develop a highly bio-fidelic FE head model from high-resolution scan data. The accuracy and feasibility of the model were successfully demonstrated against a widely used experimental benchmark in impact loading and through the investigation of a potential brain injury under blast overpressure loading. Trotta and coworkers [27] reported the development of a biofidelic FE head model originally developed from a brain trauma model established in 2003, which accurately represents the mechanical and sliding properties of the scalp.
Despite the numerous efforts in simulating the biomechanical response of the human head during human–vehicle impacts, a few studies were dedicated to understanding the head injury and damage caused by human–ground impacts. The human–ground impact is caused by falls of victims in car–pedestrian accidents, which is the top cause of traumatic brain injuries. Han et al. [28] reconstructed electric two-wheeler riders’ head-to-ground impact accidents using FE simulations. In their simulations, the victim wore a protective helmet. To the authors’ best knowledge, interactions between a bare head and the ground during the human–ground impacts have not been simulated and thoroughly studied. The goal of the present study is following the FE modeling approach to use a high-fidelity FE head model to simulate the head–ground impact involved in a real accident case, which led to significant head injury. The experiment-informed, head-to-ground simulations are supported by detailed accident data such as CT images.
In this paper, a high-fidelity FE head model as well as a modeling approach is developed for understanding the interaction between a bare head and the ground during human–ground impacts and revealing the minimum impact speed that would cause skull fracture and the corresponding contact angle. Based on the present model and the proposed modeling approach, advanced FE models can be developed to study actual head injuries including secondary injuries by taking different factors (e.g., weather, road conditions, human factors) into consideration.

2. Methodology

2.1. FE Human Head Model

The FE head model used for this study was developed and validated by one author of this paper (Deng) and a team of researchers at Mississippi State University based on a set of high-resolution computer tomography (CT) images provided by the National Library of Medicine [29]. As shown in Figure 1, in generating this high-fidelity model, the head model was first divided into four parts (skull, brain, cerebrospinal fluid, and the outer contour of the head) using image processing software ScanIP. After that, pre-processing software Hypermesh was applied to generate natural, high-quality FE meshes. These FE elements were generated so that they retained the anatomical features of the human head, scalp, skull, cerebrospinal fluid, and brain. Figure 1 shows the model of the human head and head–brain interface, which consists of 472,061 elements and 1,404,580 nodes (the skull and scalp/skin only). The element size and mesh density were carefully chosen following Liu and Glass’ method [30] to reach an optimal tradeoff between accuracy and computing speed.
Numbers of elements for each part of this head model are listed in Table 1.

2.2. Material Properties

To obtain accurate simulation results, properties of all materials of this head model have to be precisely defined. A number of investigators obtained the head material properties from experiments and published them in references [18,19,20,21,22,23]. Those properties are used to define the materials of our head model. For instance, the skull, meninges, and skin are modeled as elastic materials, while the cerebrospinal fluid and brain tissue are defined as viscoelastic materials. All the material properties are displayed in Table 2 and Table 3. As verified by the author [29], the present head model and adopted material properties are capable of correctly capturing the head response under different impact conditions.

2.3. Numerical Algorithm

The ABAQUS/Explicit Dynamic software tool is used for simulating the high-speed impact between the human head and the ground. Compared with the implicit solver, the explicit solver is more suitable for simulating dynamic processes which involve high strain rates, nonlinearity, fast changing stress and strain states, as well as large deformation and even damage of materials because it does not require an implicit tangent stiffness matrix and does not involve any iterations or convergence criteria [31]. We used the ABAQUS/Explicit solver for the present study because of its efficiency in multi-object collision simulations.

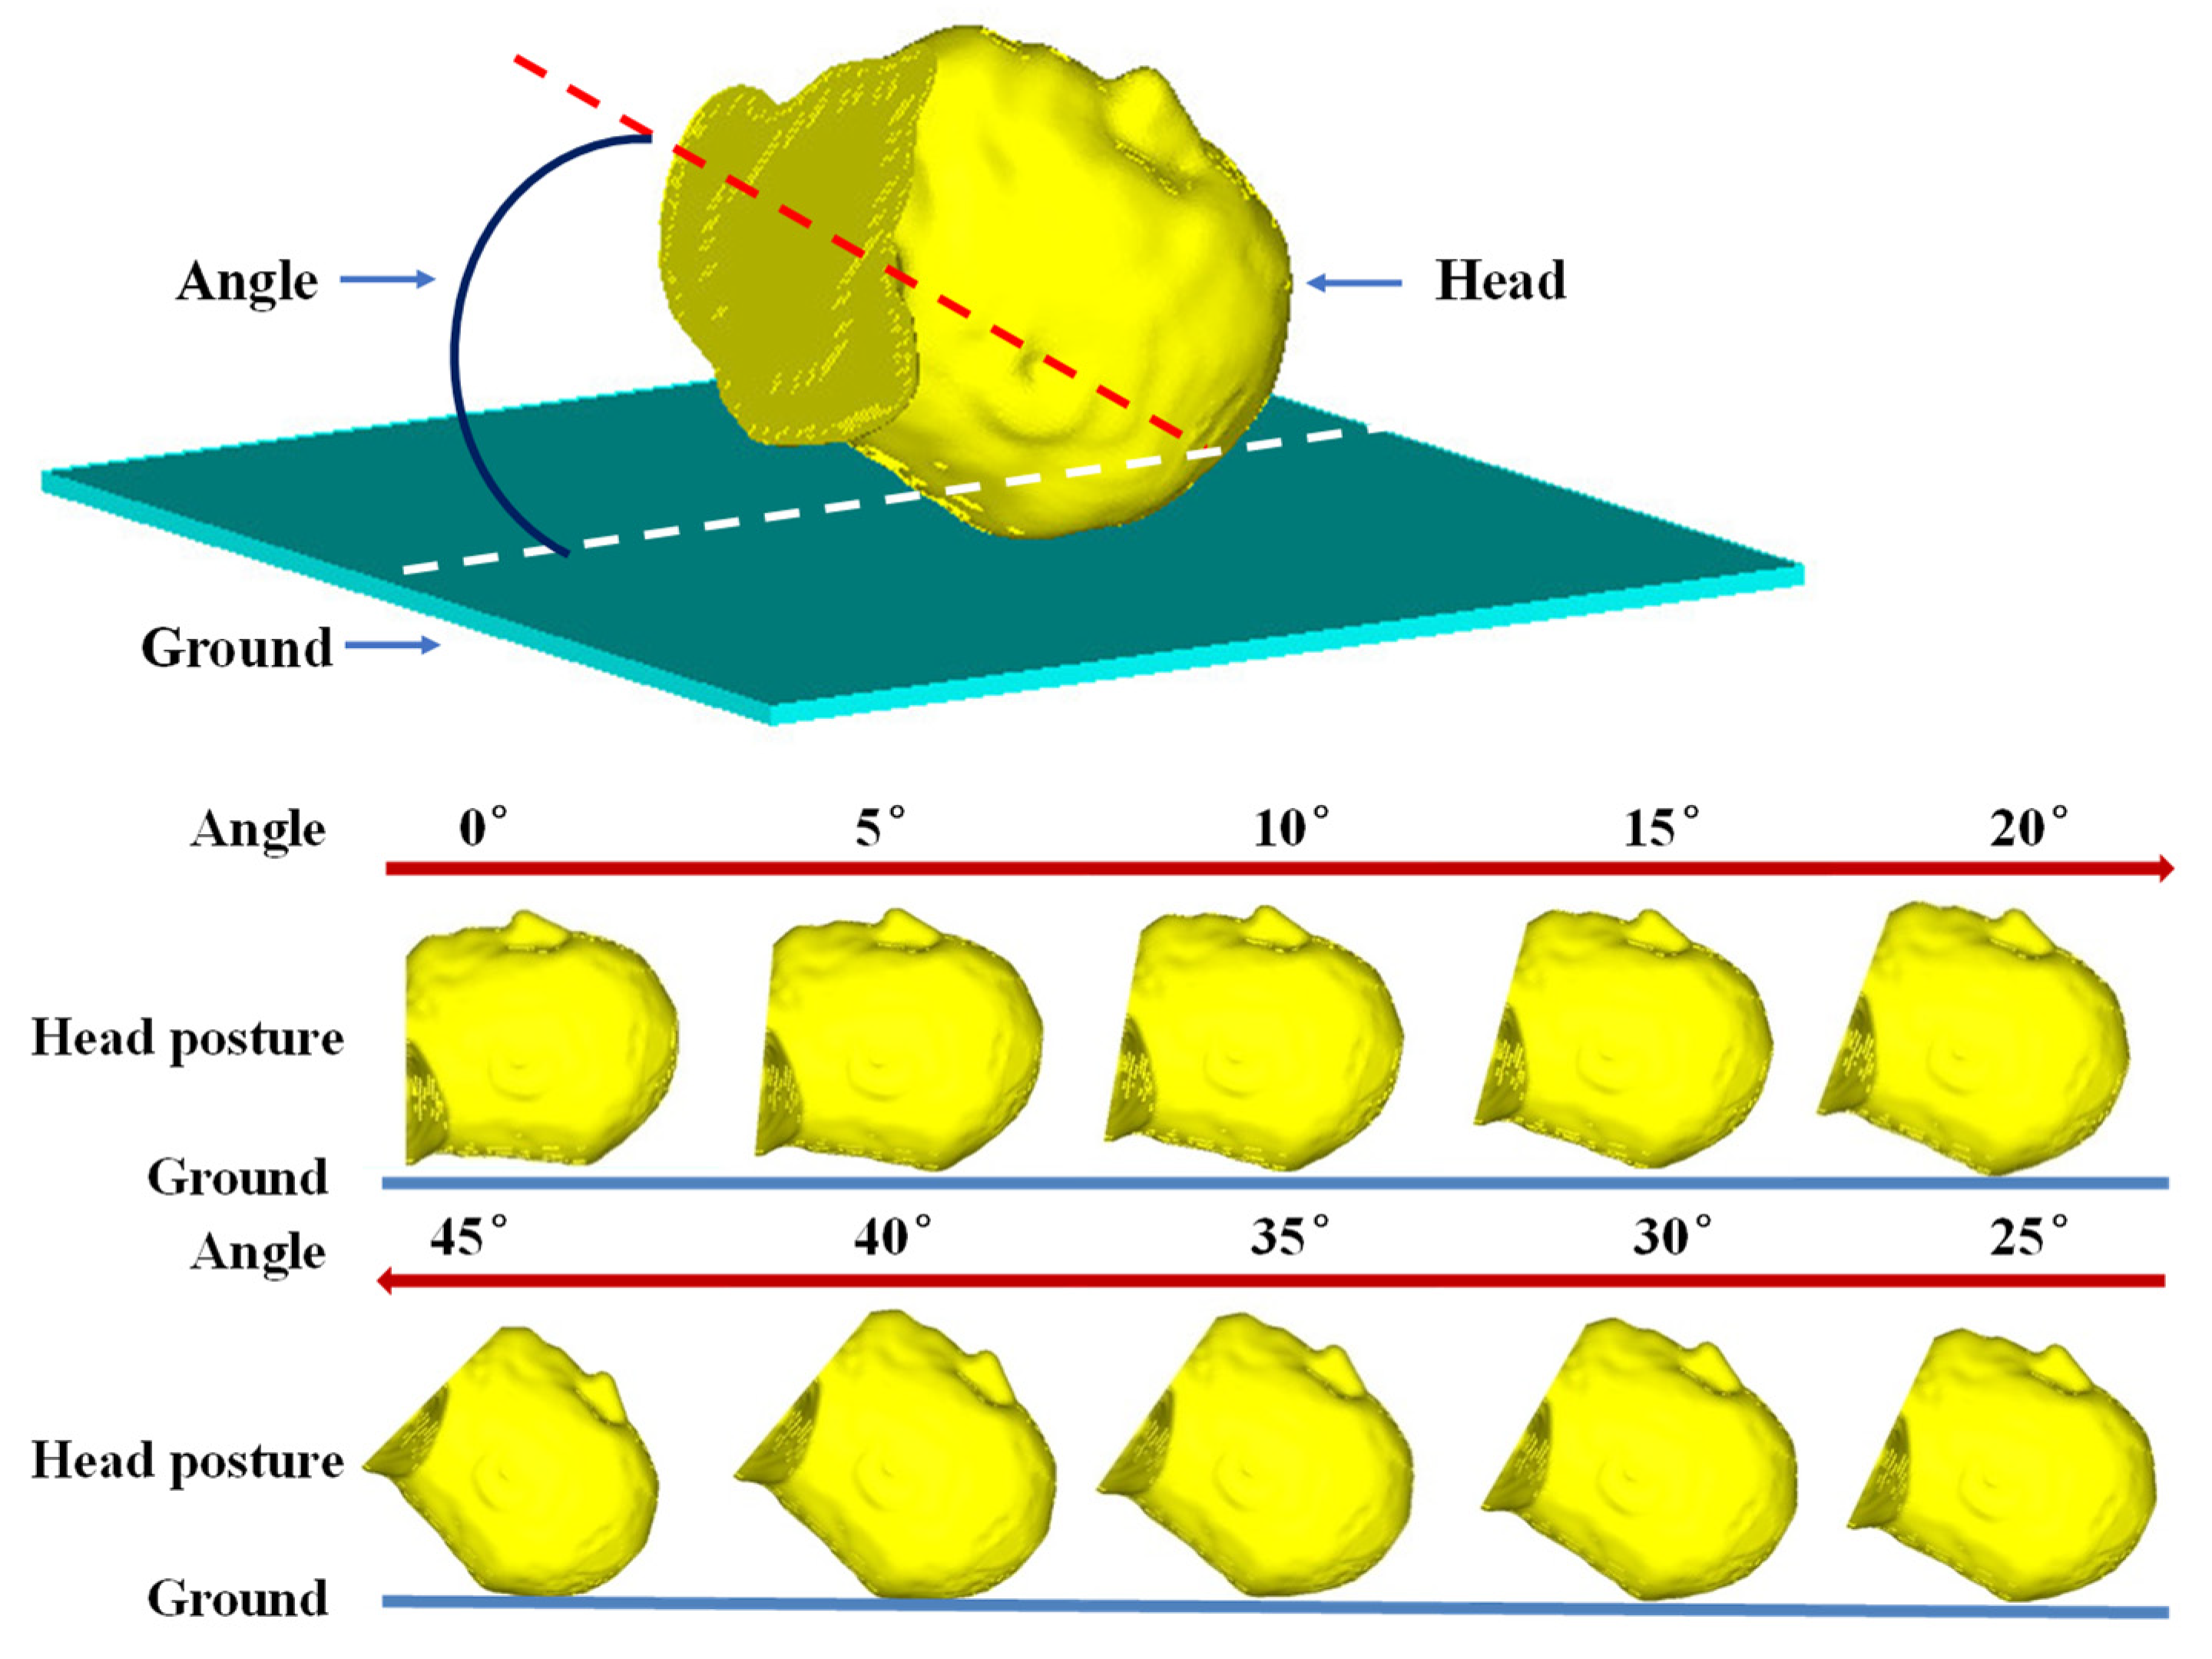
2.4. Head–Ground Impact Simulations

CT images displayed in Figure 2 indicate the impact position where the stress and strain of the head model were monitored. The location of the injury was identified in the CT images, which came from a real head–ground impact incurred by a pedestrian–vehicle collision. Boundary and loading conditions such as the impact speed and contact angle between the head and ground were defined for the simulation. The head posture angle was varied between 0° and 45° and the stresses around the known location of the injury were calculated. The velocity of the impact was predetermined, which was varied between 1 m/s and 3.5 m/s. In the simulations, an initial, unified velocity field was applied on all nodes of the head model and the ground was fully constrained. Figure 3 shows the contact between the head model and the ground, where the contact location was determined from the information provided in the CT images (Figure 2). A face-to-face contact type was defined at the interface between the ground and the head, where the ground was modeled as a flat surface. The simulation time step was 1× 10⁻⁸ s, which was small enough for dynamic analysis. After each simulation, the peak stress and stress profile at the position corresponding to the skull injury occurring in the real accident (Figure 2) were calculated and monitored.
According to Shi et al. [32], head injuries due to ground impact are not likely caused by head rotation but instead resulted from the direct head-to-ground impact. Thus, in our simulations, an initial and unified velocity field is applied on all nodes in the head model and the ground is fully constrained. The CT images shown in Figure 2 indicate where the skull fracture occurred, which is decided as the head-to-ground contact point (Figure 3). Stress and strain variations at that point and the neighboring area are monitored in our simulations.
Figure 3 shows different contact angles between the head and the ground. The contact point was determined based on the CT images (Figure 2) and the head-to-ground contact was defined as surface-to-surface contact. The time step was 1 × 10⁻⁸ s, which was small enough for dynamic simulations. The maximum von Mises stress at that point and the stress profile on the head model were calculated in each simulation.

2.5. Head Injury Threshold Criteria

In human head injury and skull fracture analysis, stress and strain data are better predictors compared with linear and angular accelerations [27]. Therefore, in such studies, the post-traumatic biomechanical response and parameters, such as intracranial pressure (ICP), von Mises stress, and strain, are used to evaluate the severity of traumatic brain injury by comparing the simulation results with the tolerance thresholds of brain tissue [33]. In this study, we chose von Mises stress to measure the severity of head injury and skull fracture based on the seminal work conducted by McElhaney et al. [34]. The threshold von Mises stress values for skull fracture were obtained by McElhaney et al. [34] and are used here as the yield limit of the skull to predict the potential fracture. Table 4 lists those values. The same set of criteria was also used by Yang [4], Trotta [27], and Kim [33] for head and brain injury analysis and prevention.

3. Results

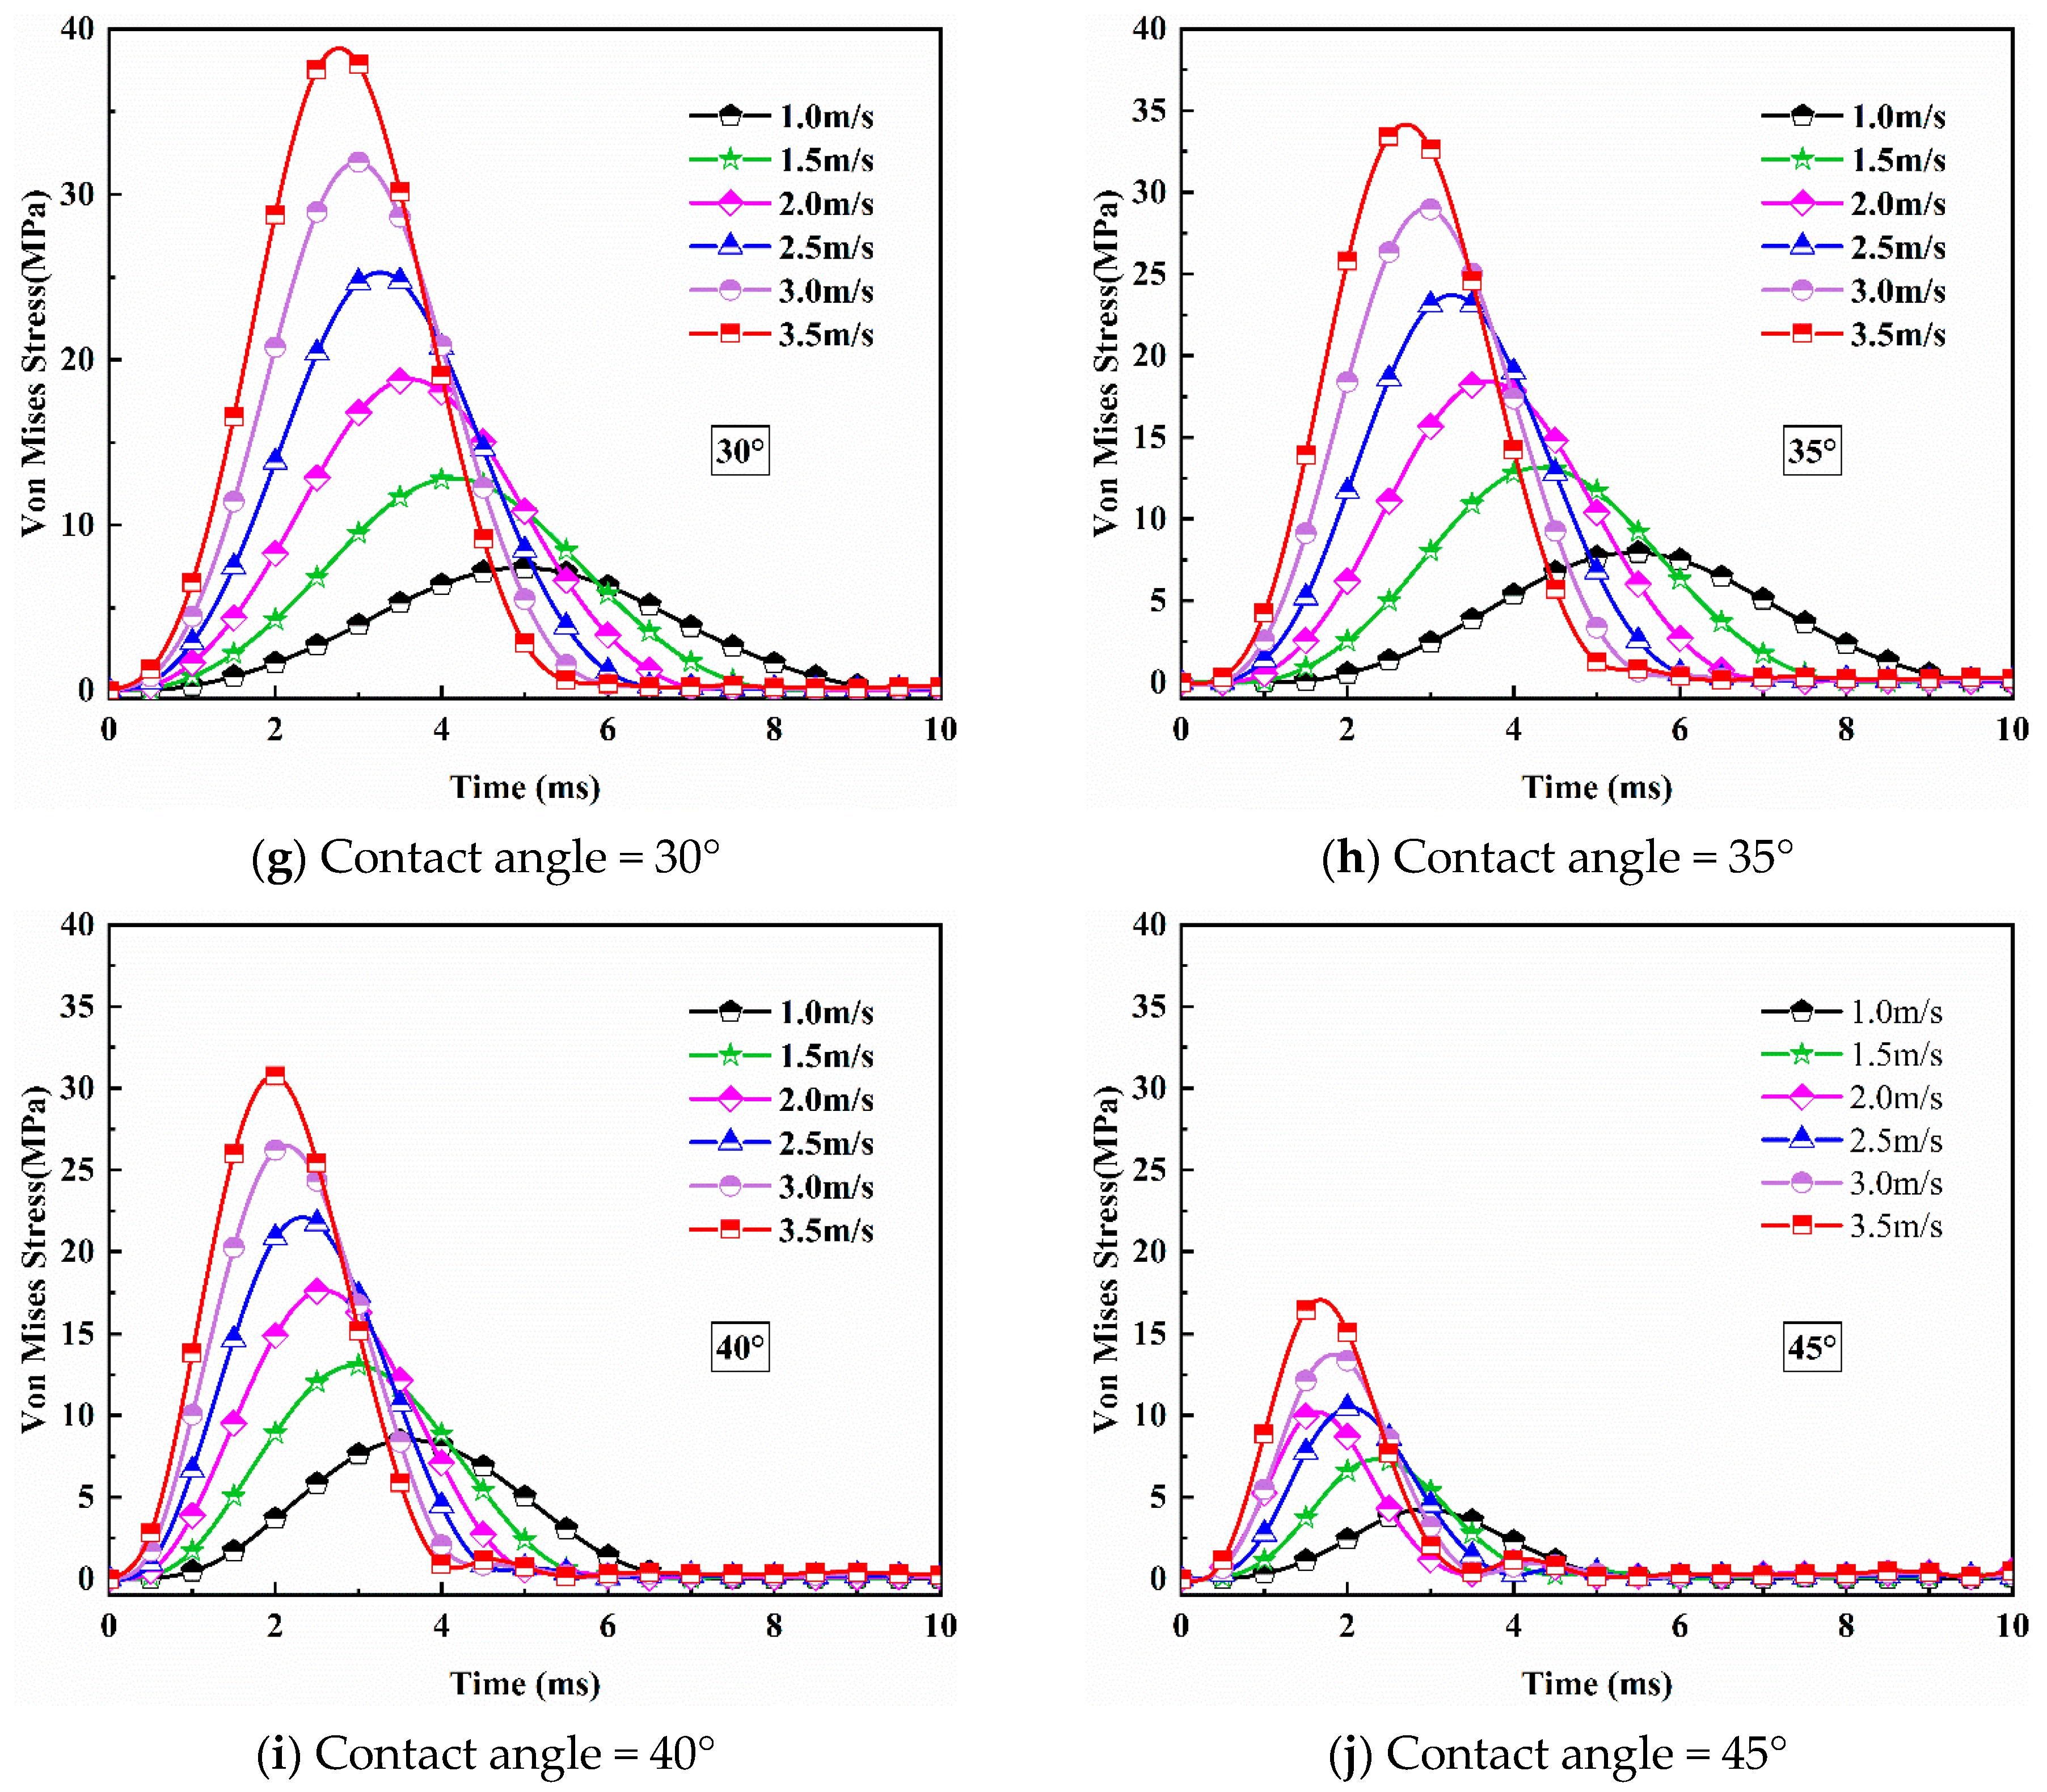
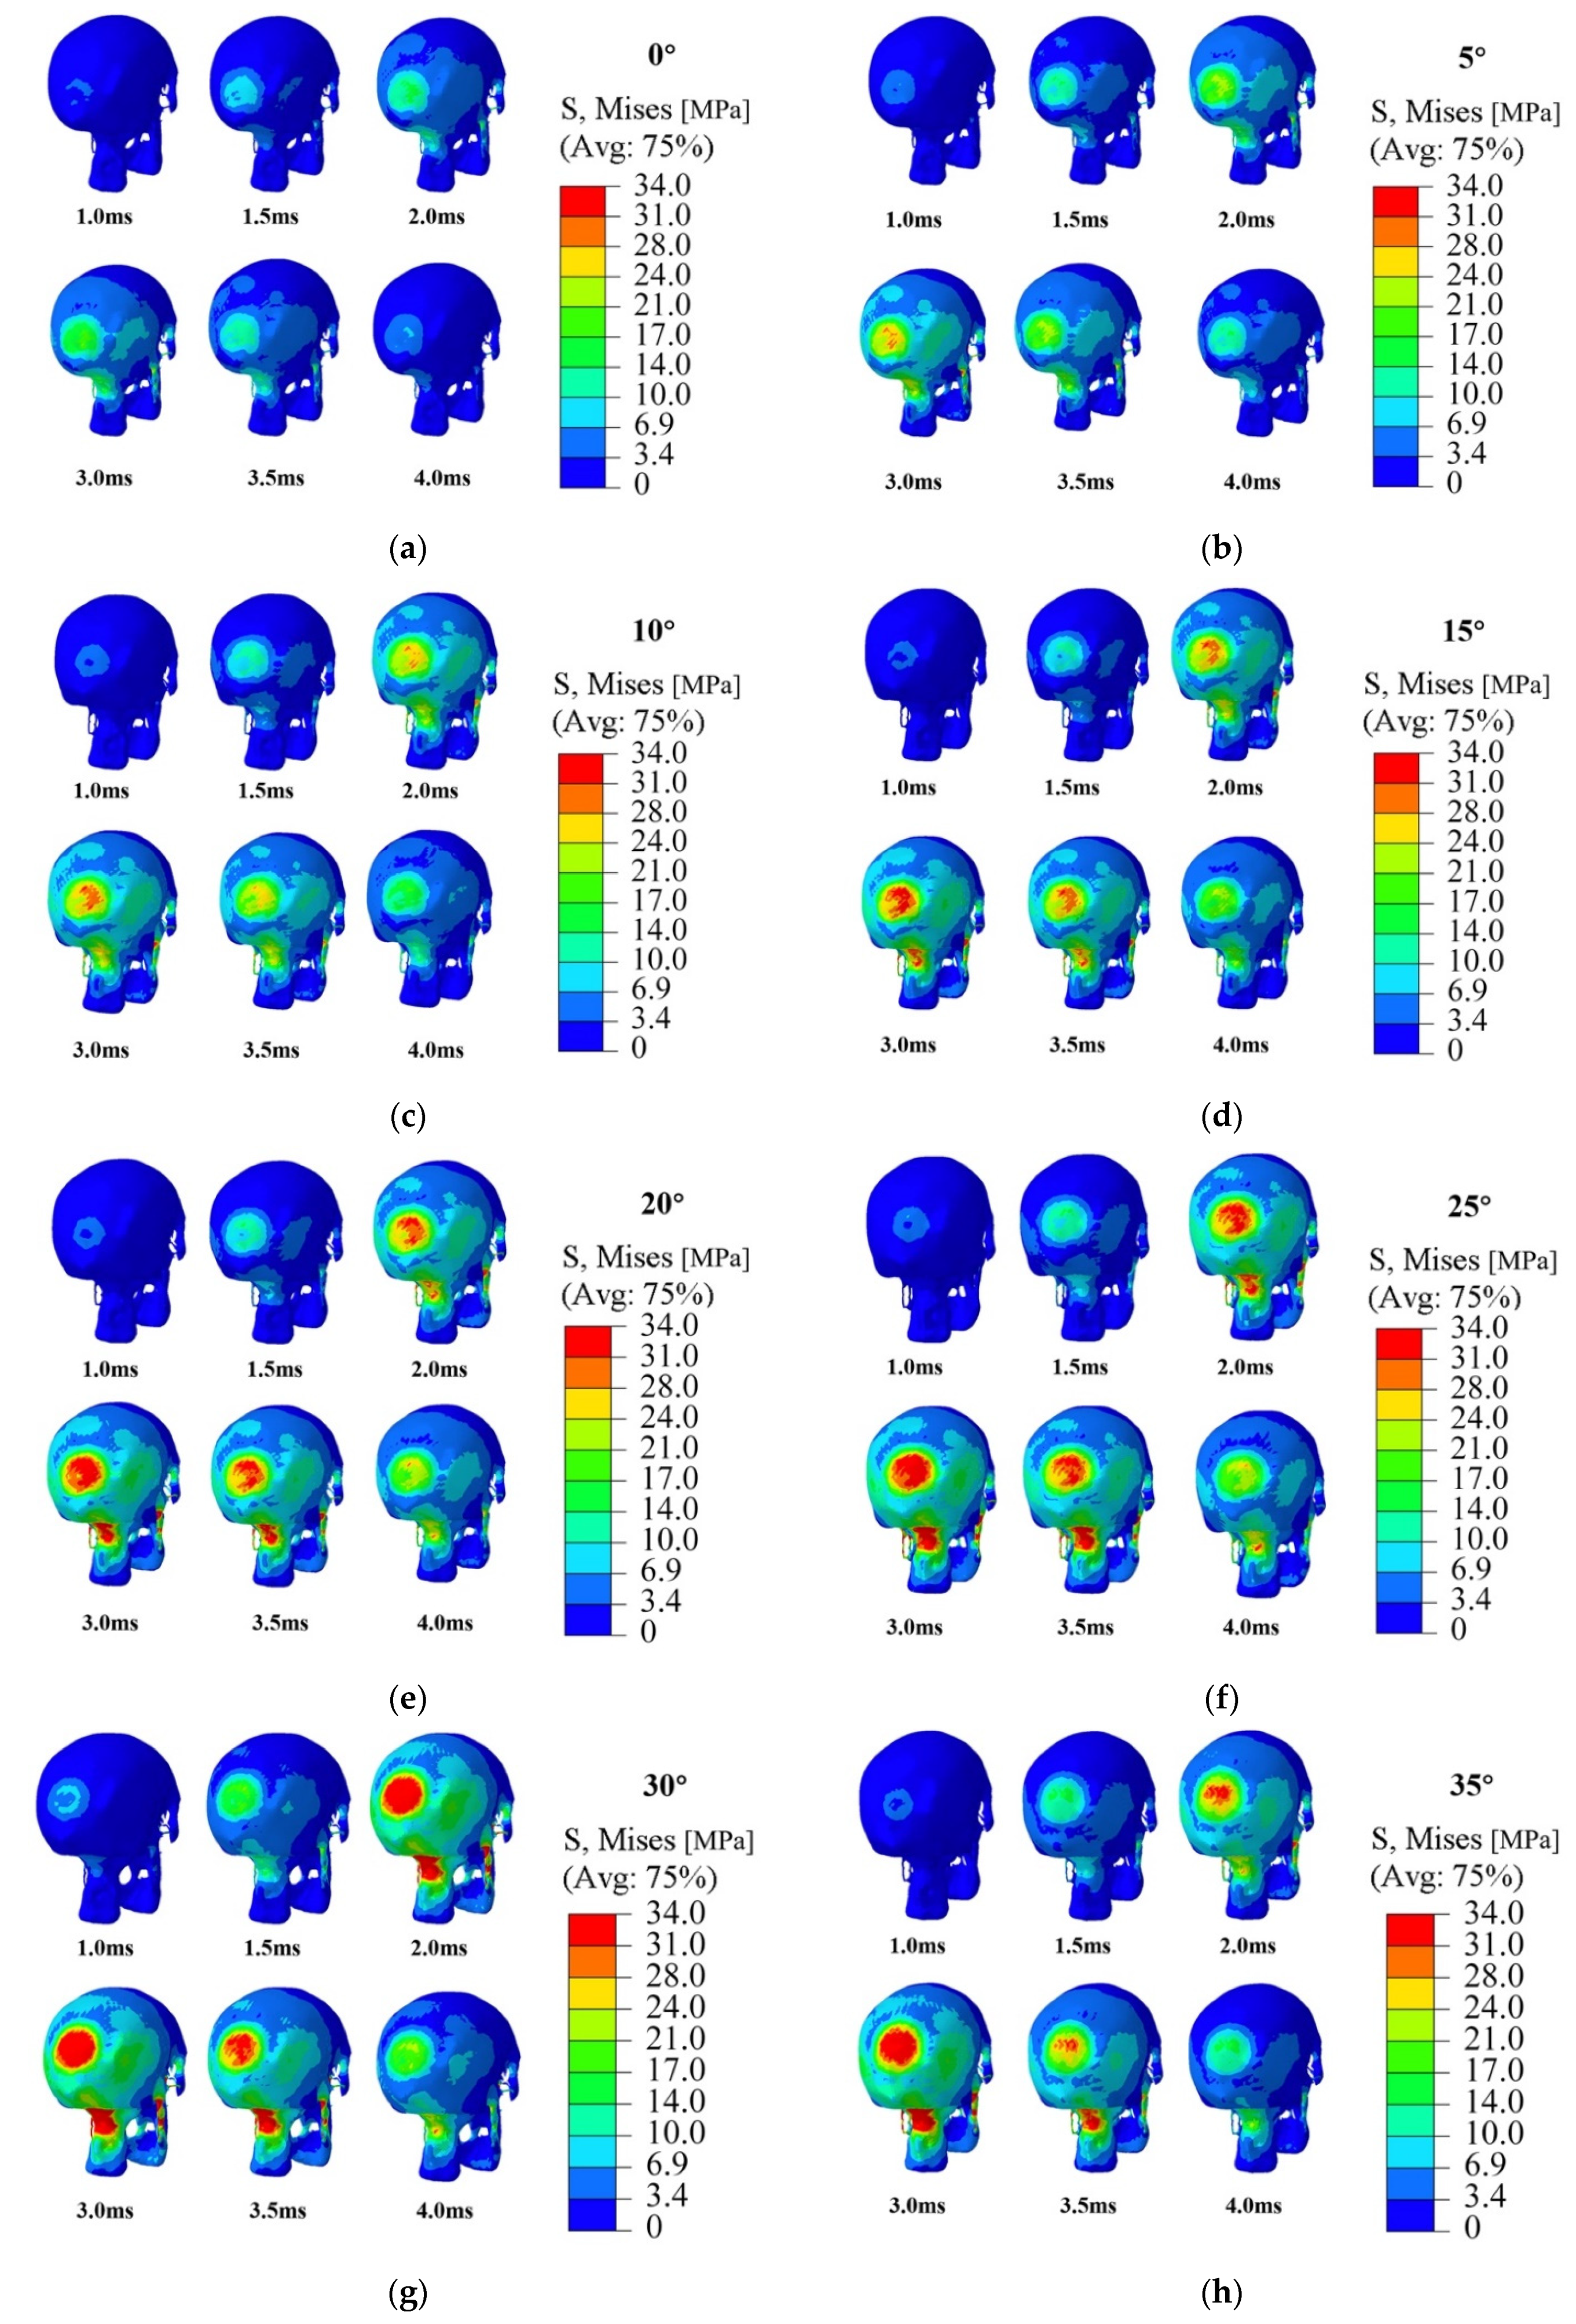
3.1. Skull Injury under Different Impact Conditions

Figure 4 plots stress curves calculated at the position indicated in Figure 2 when the impact speeds are 1 m/s, 1.5 m/s, 2 m/s, 2.5 m/s, 3 m/s, and 3.5 m/s at different contact angles ranging from 0° to 45°. One goal of this study is to find the minimum speed and the contact angle that would cause head injury. Therefore, we start from a very low speed (1 m/s) and gradually increase the impact speed until the maximum von Mises stress on the head model first exceeds the threshold value. At each impact speed, different contact angles ranging from 0° to 45° are entered for simulations (as shown in Figure 3, the contact angle cannot exceed 45°). After each simulation, the maximum von Mises stress is calculated and compared with the threshold value. It is not until the speed reaches 3.5 m/s that the peak stress for the first time exceeds the threshold value when the contact angle is 30°. In our simulations, the increases of 0.5 m/s (impact speed) and 5° (contact angle) were selected to reduce the simulation work.
It can be seen from Figure 4 that during an entire impact process, the stress first increases with the increase in time and reaches the maximum value. This process represents that the human head begins to deform after touching the ground and finally reaches the maximum state of deformation. After reaching the peak stress, the stress value gradually decreases from that peak value to 0. This is a rebound process in which the head separates from the ground and the deformation of the head gradually returns to its normal state from the maximum deformation. In addition, as the impact speed increases, the magnitude of the peak stress also increases. Apparently, a high-speed impact will cause more extensive damage to the head. From the same figure, it can also be found that at the highest impact speed (3.5 m/s), the obtained peak stress value (37.84 MPa) first reaches the threshold value for skull fracture (34.47 MPa) when the contact angle is 30°. For other cases with lower speeds, the peak stress values are also achieved at the contact angle of 30° while they are lower than 34.47 MPa and will not lead to the damage of the skull. Therefore, it can be deduced that the head–ground impact will lead to the most severe injury to the brain when the head hit the ground at an angle of 30°. From Figure 5, we can see that as the impact speed increases, the stress nephogram changes significantly.
Focusing on the maximum stress and stress variation occurring at the highest impact speed of 3.5 m/s, Figure 5 displays the stress profiles calculated from the impact simulations at that speed but different contact angles at a series of times (1 ms, 1.5 ms, 2 ms, 3 ms, 3.5 ms, and 4 ms). From the images in that figure, the history and variation of maximum stress and stress distribution on the entire head model during an entire impact process are clearly shown. It can be found that during the impact, the human head is subjected to severe injury at two locations: the contact location between the head and the ground and the junction between the skull and the spine. This phenomenon becomes more obvious after 2 ms since the initial contact. In other words, besides the impact position, the junction between the skull and spine will also be severely injured during the impact process.

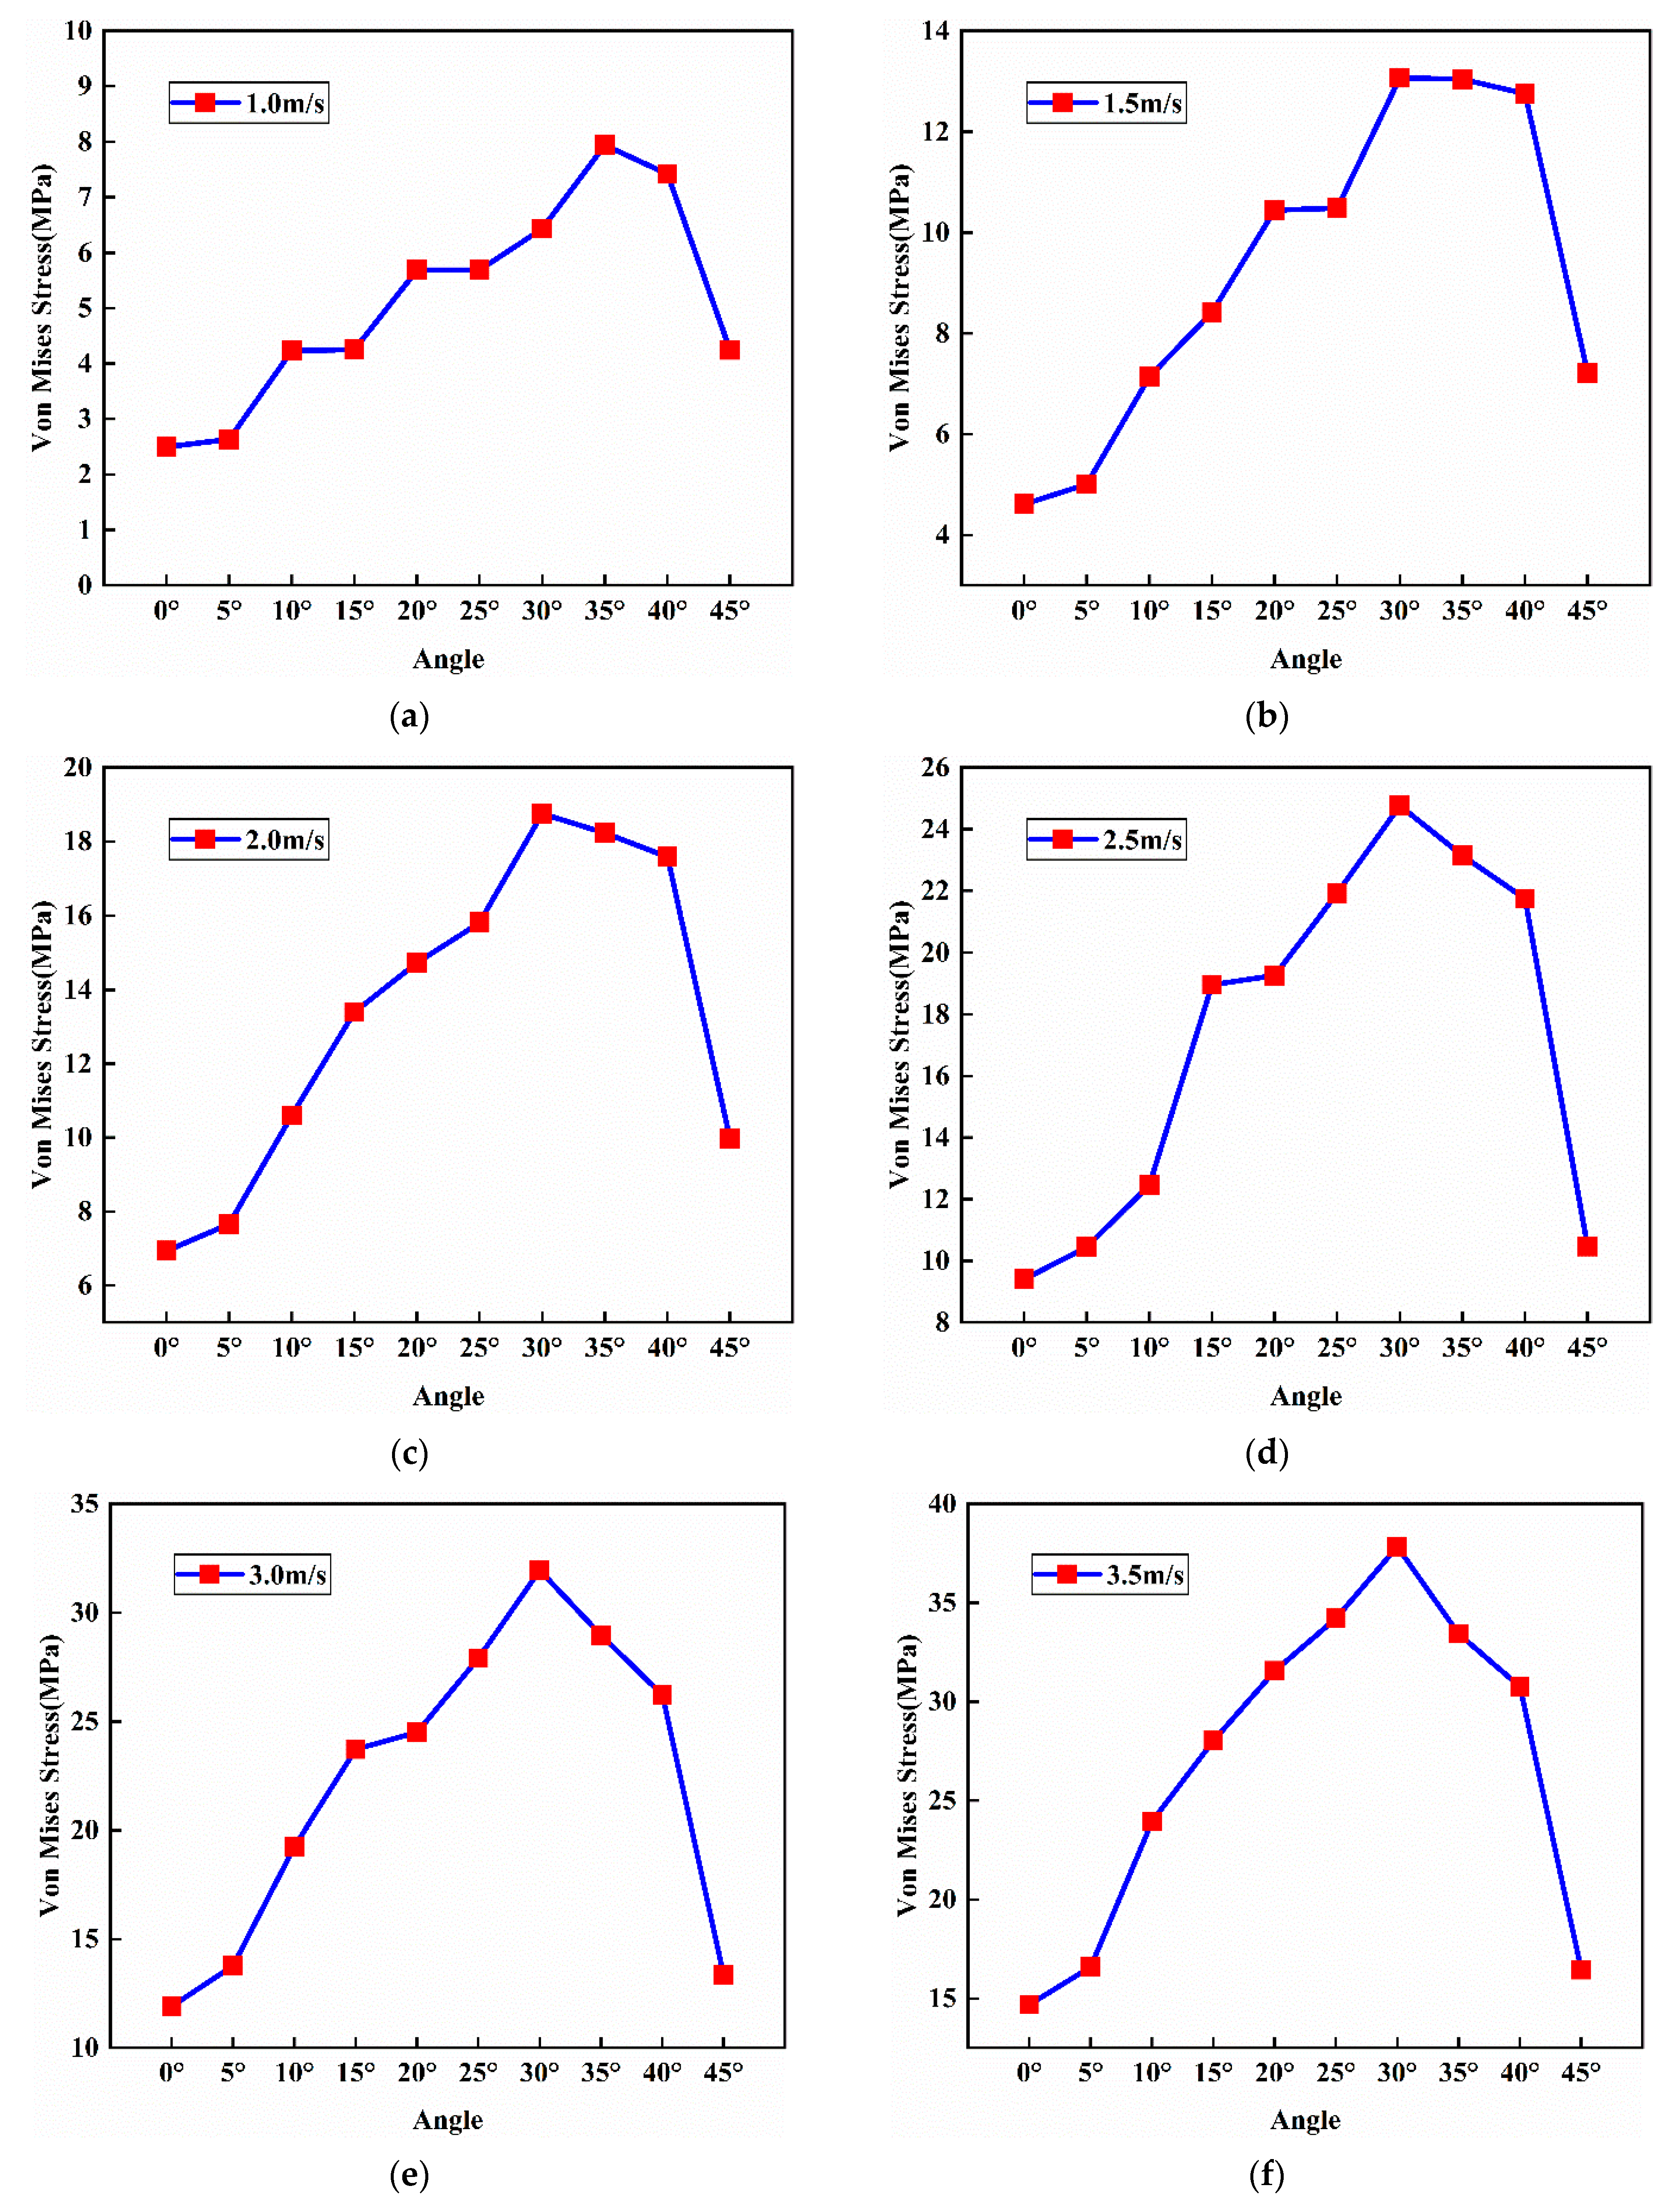
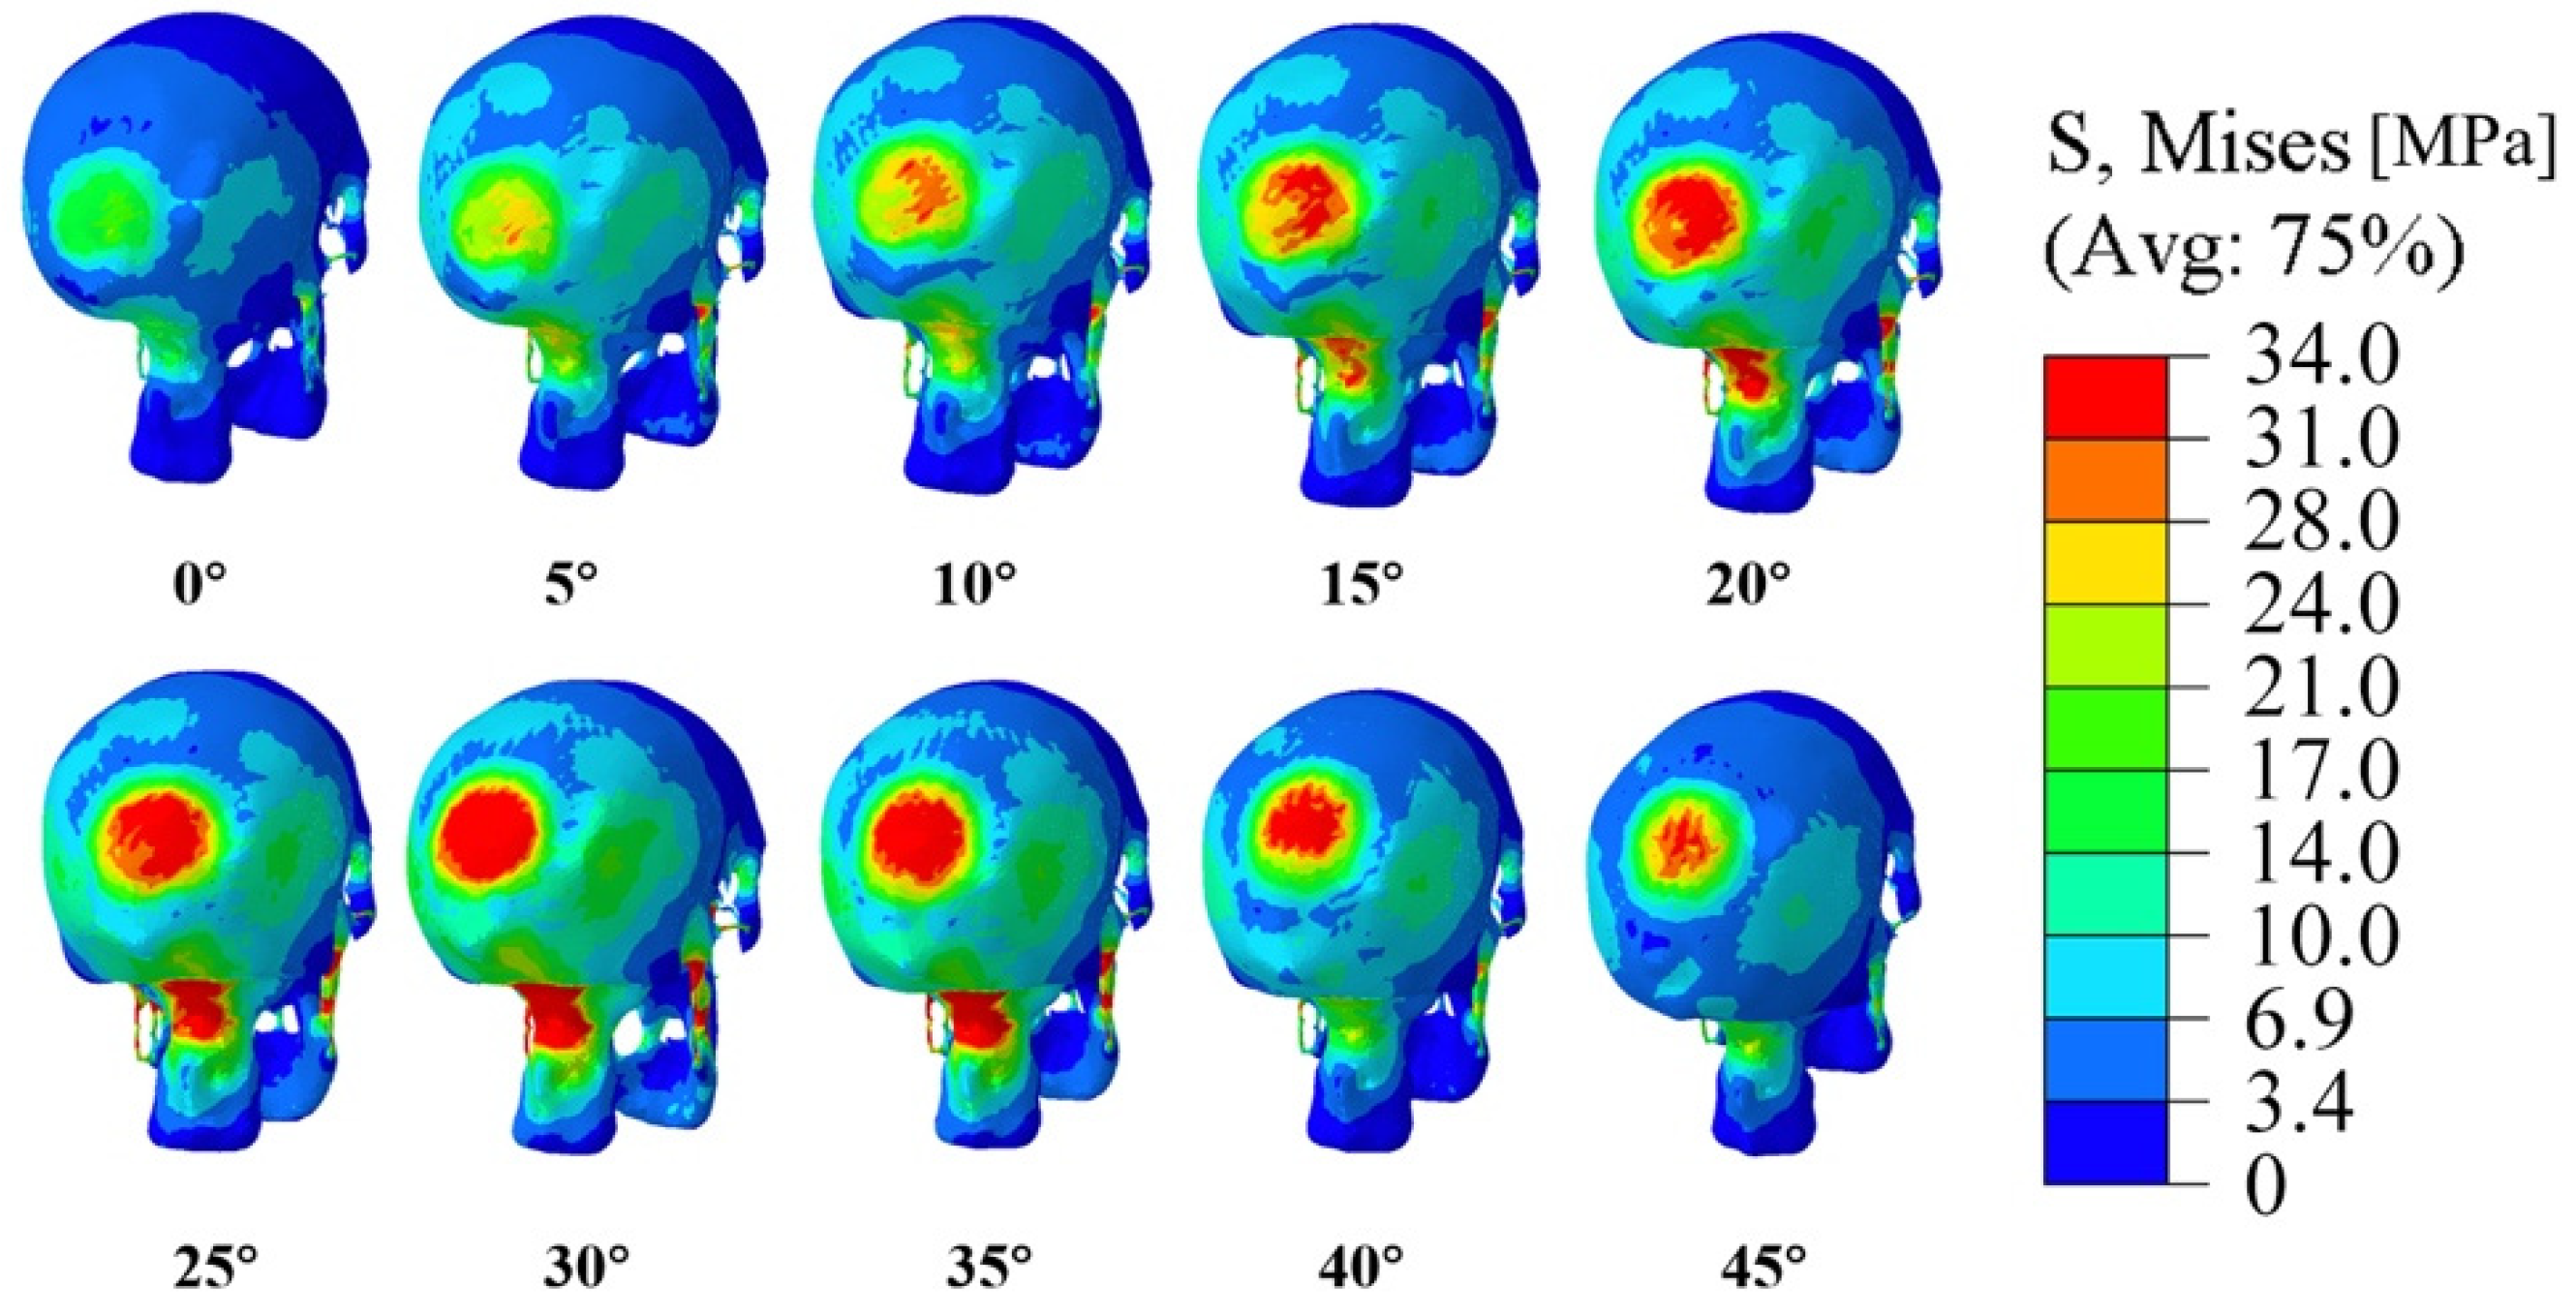
3.2. Effects of Impact Angle on Peak Stress Value of the Skull
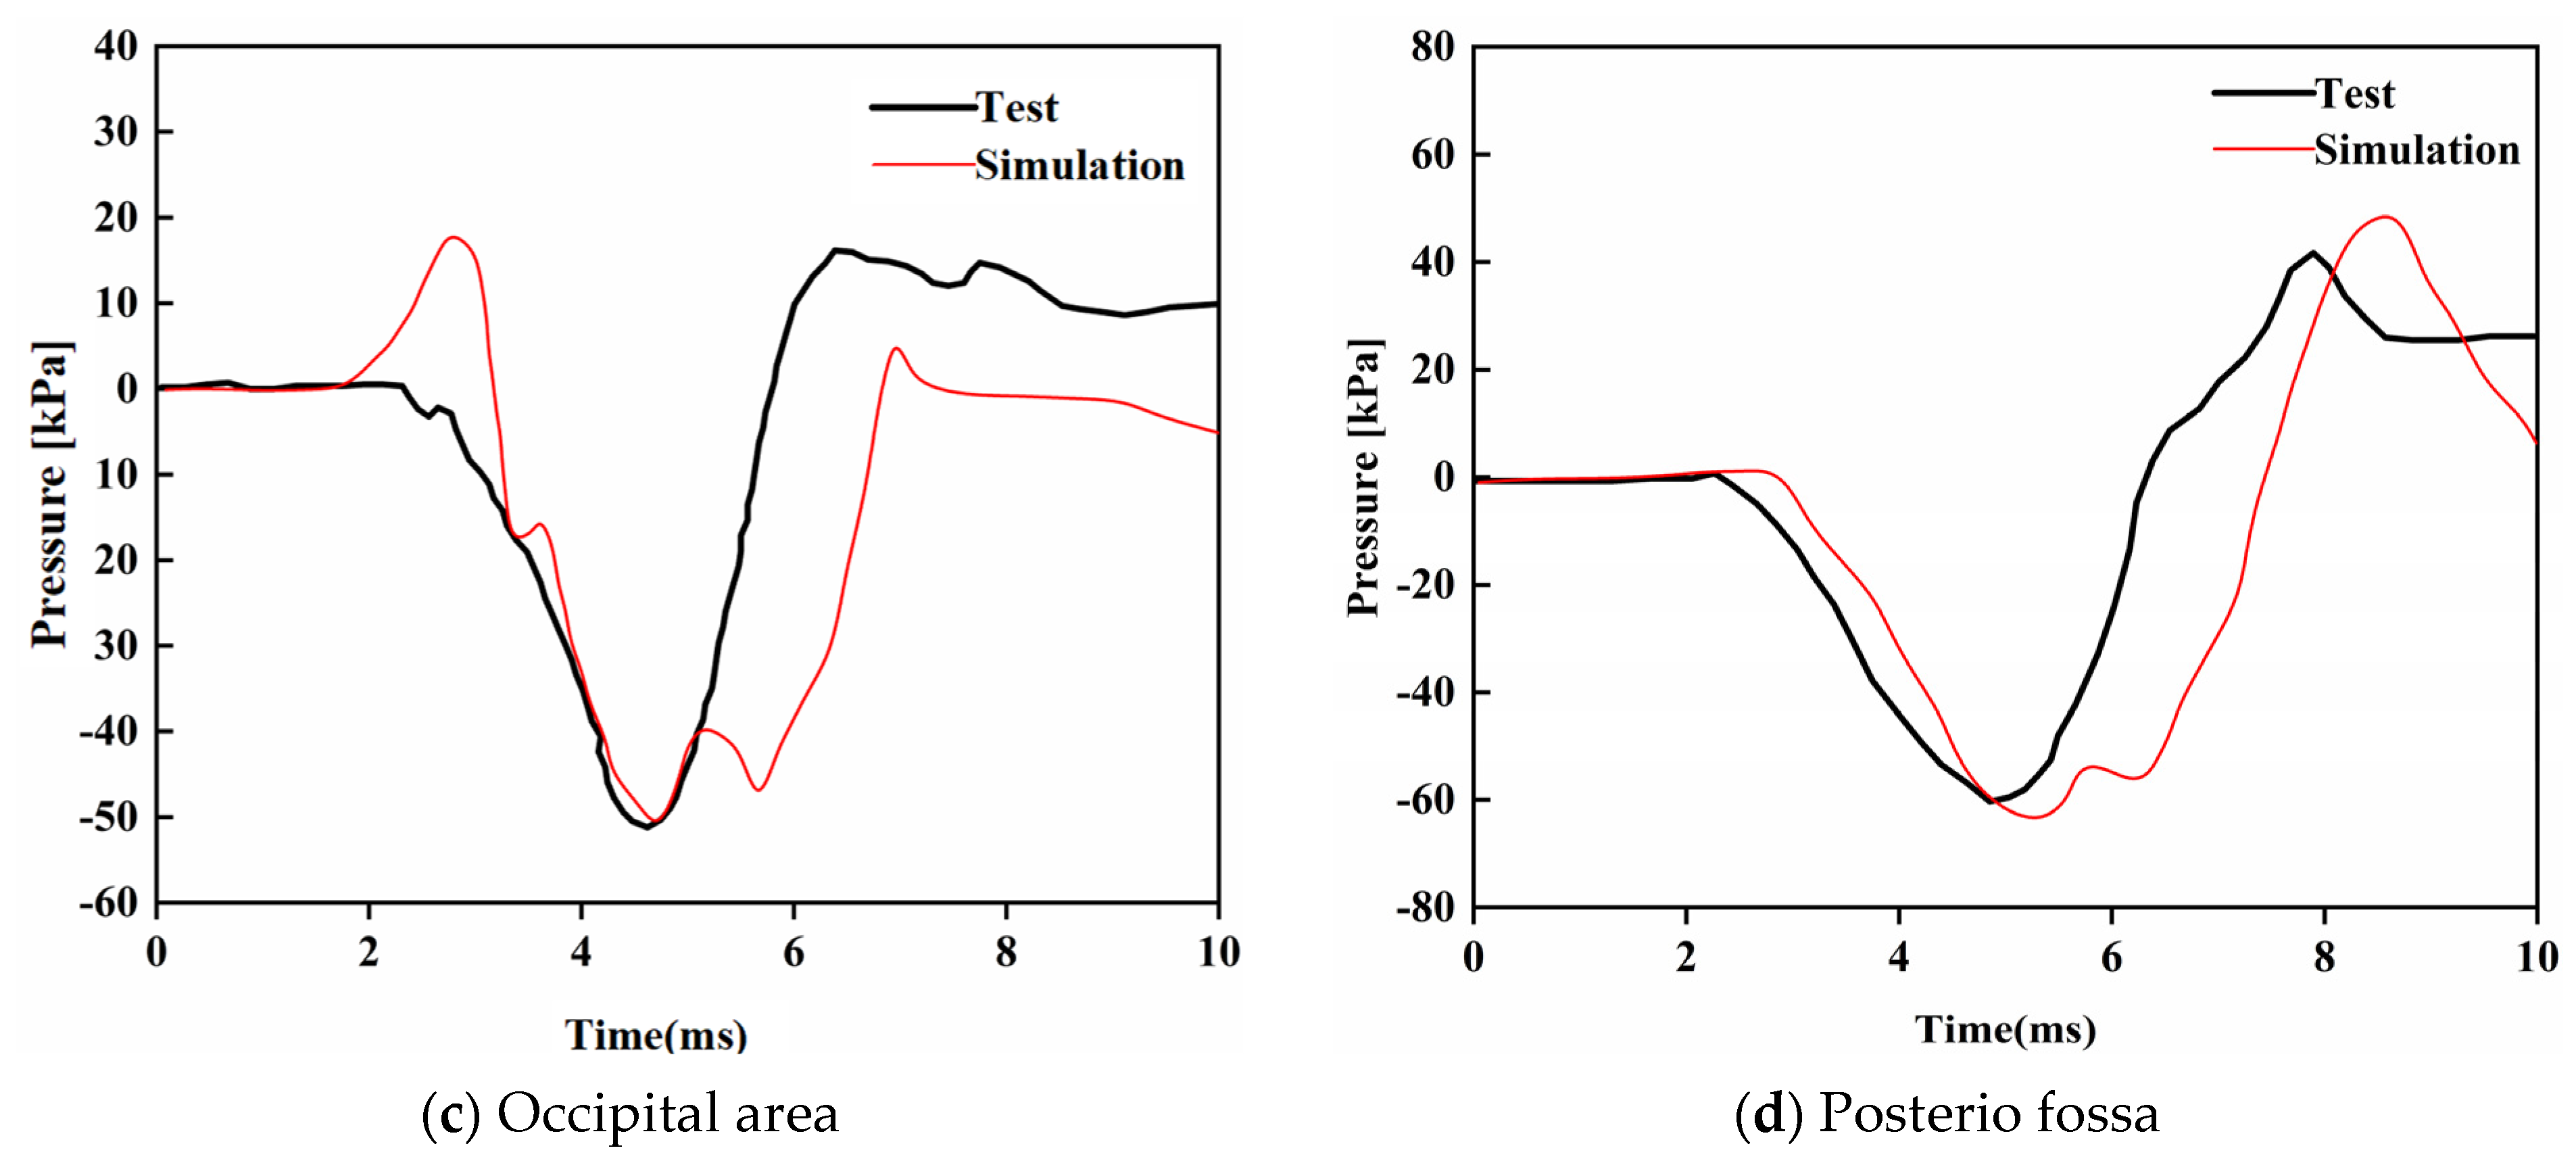
Figure 6 shows how different impact angles affect the peak stress on the skull. As explained before, the peak stress value occurring during the impact indicates the severity of the head injury. From the figure, it is clear that as the contact angle increases from 0° to 30°, the peak stress on the skull developed during the impact also increases regardless of the impact speed. However, when the contact angle changes from 30° to 45°, the peak stress decreases as the contact angle increases. Therefore, it can be deduced that the maximum peak stress as well as the maximum damage during the impact occurs when the contact angle is about 30°.
Next, we focus on the case with the impact speed of 3.5 m/s, which would cause the most severe damage on the head model. Figure 7 shows the stress nephograms generated from simulations at that speed. From those nephograms, apparent differences in head damage caused by the head–ground impacts with different contact angles can be found. In addition to the skull fracture, moderate to serious injuries also occur at the junction between the skull and the spine. Again, that figure shows that the threshold value of 34.47 MPa is first reached and exceeded at the contact angle of 30°.
As shown in Figure 8, when the contact angle between the head and the ground is 30°, the stress at the detection position is the largest. Furthermore, at 3.5 m/s, the stress at the detection position is 37.84 MPa, which exceeds the skull fracture threshold of 34.47 MPa given in Table 4. Therefore, we decided that the lowest speed that would cause the damage on the head would be 3.5 m/s and at that speed, the contact angle between the head of the injured person and the ground is around 30°. As the impact speed increases, the maximum stress obtained at other impact angles will also reach the threshold value of 34.47 MPa, the probability of serious injury and even death will duly increase.

4. Validation

After the analysis, the developed model was used to repeat the famous cadaver head impact experiment (test #37) conducted by Nahum [35] and the simulation results were compared with Nahum’s data for validation and verification. In Nahum’s test, a 5.59 kg cylinder object impacted the frontal part of a head at an initial speed of 6.3 m/s. Figure 9a shows the FE model of that test setup, in which the boudary conditions were defined to reflect the scenario of the original test. The material of the impactor was assumed to be rigid, with Young’s modulus of 6 MPa and Poison’s ratio of 0.16. In the post-processing face, intracranial pressures on the frontal area, parietal area, occipital area, and posterio fossa of the head were plotted and compared with the results obtained from Nahum’s test.
In previous simulations, the calculated peak pressures usually occurred sooner than the measured peak pressures because the scalp and other tissues were ignored in the FE models, and therefore their buffering effect was not taken into consideration in the past simulations. To improve the biofidelity of FE head models and accuracy of simulations, the scalp was carefully modeled and integrated into the present head model. Figure 10a–d compares the simulation results and experimental data obtained from the four areas as specified in Figure 9b. From those figures, it can be found that the simulation results are in good agreement with the experimental data, expecially for the intracranial pressures on the frontal and parietal area. The present model and the modeling approach are therefore verified.

5. Discussion

This study only discusses the effects of impact speed and contact angles on the human head injury and only the threshold for skull fracture is used. In fact, there are other factors such as weather, road conditions, and human factors that contribute to a traffic crash and normally more than one criterion should be used to evaluate the human injury. Moreover, only direct impact injury between the head and the ground is considered in this study because the main goal of this study is to establish a reliable computational modeling framework in support of the investigation of head injuries caused by traffic accidents. In the next phase, more comprehensive models will be established based on the present model and the proposed modeling approach will be followed, which will take different factors into account and implement more human injury criteria so as to achieve more faithful reconstructions of the traffic crashes and better predictions of traumatic head injury caused by the head–ground impacts incurred in the accidents. Actual head injuries including rotational shear stress and burst injury, as well as secondary injuries such as hypoxia, hypotention, brain edema, and epilepsy will be further analyzed using the advanced models. The outcomes of future research will help physiatrists and nurses address clinically significant problems.

6. Conclusions

The present study uses Hypermesh and ABAQUS/Explicit to model and simulate 60 collisions between a human head and the ground which involve different contact angles and impact speeds. On the basis of the numerical results and comparison of those results with the experimental data, the minimum speed that would lead to skull fracture and the corresponding contact angle were determined. The following conclusions can be drawn from this study:
(1)
At the same impact speed, the maximum peak von Mises stress is reached when the contact angle is 30°.
(2)
The maximum peak stress increases as the impact speed increases and when the impact speed is 3.5 m/s at the contact angle of 30°, the peak stress generated at the impact exceeds the threshold value and would cause the skull to fracture.
(3)
FE methods are a powerful tool for reconstructing scenes of traffic crashes and reproducing impact processes in a time- and cost-effective manner. The combination of the FE methods and experimental data can reveal valuable insights into traffic crashes and assist forensic analysts in identifying the responsibilities of involved parties and revealing the courses of accidents.
The developed model and modeling approach can be applied to predict and reconstruct head/skull injuries in traffic accidents, which cannot be reconstructed in reality. Simulation results obtained from the developed model can be used to augment experimental datasets of limited volume to provide researchers with wider and more detailed data in support of their investigation of head/skull injuries and optimization for pedestrian head protection.

Author Contributions

Conceptualization and project administration, X.D.; methodology, Z.D.; software, H.F.; validation and formal analysis, S.W.; resources, H.L.; writing and investigation, Y.L. All authors have read and agreed to the published version of the manuscript.

Funding

This research was funded by Sichuan Distinguished Youth Funds, grant number 19JCQN.

Institutional Review Board Statement

Not applicable.

Informed Consent Statement

Not applicable.

Data Availability Statement

Not applicable.

Conflicts of Interest

The authors declare no conflict of interest.

References

  1. World Health Organization. Global Status Report on Road Safety 2018; World Health Organization: Geneva, Switzerland, 2018. [Google Scholar]
  2. Cory, C.Z.; Jones, M.D.; James, D.S.; Leadbeatter, S.; Nokes, L.D.M. The potential and limitations of utilising head impact injury models to assess the likelihood of significant head injury in infants after a fall. Forensic Sci. Int. 2001, 123, 89–106. [Google Scholar] [CrossRef] [PubMed]
  3. Huang, J.; Peng, Y.; Yang, J.; Otte, D.; Wang, B. A study on correlation of pedestrian head injuries with physical parameters using in-depth traffic accident data and mathematical models. Accid. Anal. Prev. 2018, 119, 91–103. [Google Scholar] [CrossRef] [PubMed]
  4. Yang, K.H.; Mao, H. Modeling of the Brain for Injury Simulation and Prevention. In Biomechanics of the Brain; Springer: Berlin/Heidelberg, Germany, 2011; pp. 91–110. [Google Scholar]
  5. Li, S.-Q.; Peng, Y.-L.; Xiao, L.-Y.; Meng, S.-M.; Wang, P.; Xu, J.-P. Analysis of the mechanism of the road traffic accidents in-situ and the future research trends. J. Saf. Environ. 2014, 14, 14–19. [Google Scholar]
  6. Deng, X.-Q.; Potula, S.; Grewal, H.; Solanki, K.N.; Tschopp, M.A.; Horstemeyer, M.F. Finite element analysis of occupant head injuries: Parametric effects of the side curtain airbag deployment interaction with a dummy head in a side impact crash. Accid. Anal. Prev. 2013, 55, 232–241. [Google Scholar] [CrossRef] [PubMed]
  7. Cai, X.-H.; Jin, X.-L.; Zhang, X.-Y.; Hou, X.-Y. Scene reconstruction and process reappearance of car-pedestrian collision traffic accidents. J. Syst. Simul. 2010, 22, 1288–1291. [Google Scholar]
  8. Berthelson, P.R.; Ghassemi, P.; Wood, J.W.; Liu, Y.-C.; Al-Graitti, A.J.; Jones, M.D.; Chowdhury, S.; Prabhu, R.K. Evaluation of occupant neck injury response to varied impact conditions using a finite element-mathematical surrogate modeling approach. Int. J. Crashworthiness, 2020; in press. [Google Scholar]
  9. Cui, P.; An, M.; Zhang, X.; Guo, Y. Dynamic response and damage analysis of human head and neck in automobile rear impact. J. Med. Biomech. 2020, 35, 83–89. [Google Scholar]
  10. He, G.; Fang, L.; Liu, Y.-C. Mesoscale simulation-based parametric study of damage potential in brain tissue using hyperelastic and internal state variable models. J. Biomech. Eng. 2022, 144, 071005. [Google Scholar] [CrossRef]
  11. Liu, Y.-C. Development and evaluation of a finite element truck chassis crash model. Int. J. Crashworthiness 2010, 15, 107–113. [Google Scholar] [CrossRef]
  12. Liu, Y.-C. Development of simplified truck chassis model for crash analysis in different impact scenarios. Int. J. Crashworthiness 2010, 15, 457–467. [Google Scholar] [CrossRef]
  13. Liu, Y.-C.; Day, M.L. Experimental analysis and computer simulation of automotive bumper system under impact conditions. Int. J. Comput. Methods Eng. Sci. Mech. 2008, 9, 51–59. [Google Scholar] [CrossRef]
  14. Liu, Y.-C.; Day, M.L. Simplified truck chassis modeling and crashworthiness analysis. Int. J. Heavy Veh. Syst. 2008, 15, 237–254. [Google Scholar] [CrossRef]
  15. Liu, Y.-C. Crashworthiness design of thin-walled curved beams with box and channel cross sections. Int. J. Crashworthiness 2010, 15, 413–423. [Google Scholar] [CrossRef]
  16. Liu, Y.-C. Thin-walled curved hexagonal beams in crashes—FEA and design. Int. J. Crashworthiness 2010, 15, 151–159. [Google Scholar] [CrossRef]
  17. Feyzi, M.; Fallahnezhad, K.; Taylor, M.; Hashemi, R. The mechanics of head-neck taper junctions: What do we know from finite element analysis? J. Mech. Behav. Biomed. Mater. 2021, 116, 104338. [Google Scholar] [CrossRef] [PubMed]
  18. Mao, H.; Zhang, L.; Jiang, B.; Genthikatti, V.V.; Jin, X.; Zhu, F.; Makwana, R.; Gill, A.; Jandir, G.; Singh, A.; et al. Development of a finite element human head model partially validated with thirty five experimental cases. J. Biomech. Eng. 2013, 135, 111002. [Google Scholar] [CrossRef]
  19. Raul, J.S.; Deck, C.; Willinger, R.; Ludes, B. Finite-element models of the human head and their applications in forensic practice. Int. J. Leg. Med. 2008, 122, 359–366. [Google Scholar] [CrossRef] [PubMed]
  20. Ruan, J.S.; Khalil, T.; King, A.I. Dynamic response of the human head to impact by three-dimensional finite element analysis. J. Biomech. Eng. 1994, 116, 44–50. [Google Scholar] [CrossRef] [PubMed]
  21. Zhou, C.; Khalil, C.T.B.; King, A.I. A new model comparing impact responses of the homogeneous and inhomogeneous human brain. SAE Pap. 1995, 104, 2999–3015. [Google Scholar]
  22. Zhang, L.; Yang, K.H.; Dwarampudi, R.; Omori, K.; Li, T.; Chang, K.; Hardy, W.N.; Khalil, T.B.; King, A.I. Recent advances in brain injury research: A new human head model development and validation. SAE Pap. 2001, 45, 1–25. [Google Scholar]
  23. Kleiven, S.; Hardy, W.N. Correlation of an FE model of the human head with local brain motion. SAE Pap. 2002, 46, 123–144. [Google Scholar]
  24. Horgan, T.J.; Gilchrist, M.D. The creation of three-dimensional finite element models for simulating head impact biomechanics. Int. J. Crashworthiness 2003, 8, 353–366. [Google Scholar] [CrossRef]
  25. Sahoo, D.; Deck, C.; Yoganandan, N.; Willinger, R. Development of skull fracture criterion based on real-world head trauma simulations using finite element head model. J. Mech. Behav. Biomed. Mater. 2016, 57, 24–41. [Google Scholar] [CrossRef] [PubMed]
  26. Cotton, R.T.; Pearce, C.W.; Young, P.G.; Kota, N.; Leung, A.C.; Bagchi, A.; Qidwai, S.M. Development of a geometrically accurate and adaptable finite element head model for impact simulation: The Naval Research Laboratory-Simpleware Head Model. Comput. Methods Biomech. Biomed. Eng. 2016, 19, 101–113. [Google Scholar] [CrossRef] [PubMed] [Green Version]
  27. Trotta, A.; Clark, J.M.; McGoldrick, A.; Gilchrist, M.D.; Annaidh, A.N. Biofidelic finite element modelling of brain trauma: Importance of the scalp in simulating head impact. Int. J. Mech. Sci. 2020, 173, 105448. [Google Scholar] [CrossRef]
  28. Han, Y.; He, W.; Shi, L.; Wu, H.; Pan, D.; Huang, H. Helmet protective performance via reconstruction of electric two-wheeler rider’s head-to-ground impact accidents. Int. J. Crashworthiness 2020, 25, 493–504. [Google Scholar] [CrossRef]
  29. Deng, X.-Q.; Chen, S.-A.; Prabhu, R.; Jiang, Y.-Y.; Mao, Y.; Horstemeyer, M.F. Finite element analysis of the human head under side car crash impacts at different speeds. J. Mech. Med. Biol. 2014, 14, 1440002. [Google Scholar] [CrossRef]
  30. Liu, Y.-C.; Glass, G.A. Choose the best element size to yield accurate FEA results while reduce FE model’s complexity. Br. J. Eng. Technol. 2013, 1, 13–28. [Google Scholar]
  31. Liu, Y.-C.; Day, M.L. ANSYS and LS-DYNA used for structural analysis. Int. J. Comput. Aided Eng. Technol. 2008, 1, 31–44. [Google Scholar] [CrossRef]
  32. Shi, L.-L.; Han, Y.; Huang, H.-W.; Davidson, J.; Thomson, R. Evaluation of injury thresholds for predicting severe head injuries in vulnerable road users resulting from ground impact via detailed accident reconstructions. Biomech. Model. Mechanobiol. 2020, 19, 1845–1863. [Google Scholar] [CrossRef] [PubMed]
  33. Kim, T.; Poplin, G.; Bollapragada, V.; Daniel, T.; Crandall, J. Monte Carlo method for estimating whole-body injury metrics from pedestrian impact simulation results. Accid. Anal. Prev. 2020, 147, 105761. [Google Scholar] [CrossRef]
  34. McElhaney, J.H.; Fogle, J.L.; Melvin, J.W.; Haynes, R.R.; Roberts, V.L.; Alem, N.M. Mechanical properties on cranial bone. J. Biomech. 1970, 3, 495–511. [Google Scholar] [CrossRef] [PubMed] [Green Version]
  35. Nahum, A.M. Intracranial pressure dynamics during head impact. SAE Tech. Pap. 1977. [Google Scholar] [CrossRef]
Figure 1. The FE head model: (a) isometric view of the head model with brain exposed; (b) medium sagittal view of the head model; (c) sectional view of skull and brain model; (d) skull and facial bones model; (e) brain model; (f) cerebrospinal fluid model; (g) skull–brain interface model.
Bioengineering 09 00723 g001
Figure 2. CT images showing the head injury, which includes extensive intracranial contusion and pneumatosis, hemorrhage, and occipital fracture.
Bioengineering 09 00723 g002
Figure 3. Contact between the head and the ground at different angles.
Bioengineering 09 00723 g003
Figure 4. Stress curves at different impact conditions.
Bioengineering 09 00723 g004aBioengineering 09 00723 g004b
Figure 5. Stress nephograms generated from impact simulations at 3.5 m/s with different contact angles: (a) 0°, (b) 5°, (c) 10°, (d) 15°, (e) 20°, (f) 25°, (g) 30°, (h) 35°, (i) 40°, (j) 45°.
Bioengineering 09 00723 g005aBioengineering 09 00723 g005b
Figure 6. Peak stress values on the skull obtained from different impact conditions: (a) impact speed v = 1.0 m/s, (b) v = 1.5 m/s, (c) v = 2.0 m/s, (d) v = 2.5 m/s, (e) v = 3.0 m/s, (f) v = 3.5 m/s.
Bioengineering 09 00723 g006
Figure 7. Stress nephograms generated from simulations involving different contact angles at 3.5 m/s.
Bioengineering 09 00723 g007
Figure 8. Comparison between simulation results with the CT image.
Bioengineering 09 00723 g008
Figure 9. FE model for Nahum’s #37 test [35]: (a) the model, (b) the regions where the intracranial pressures were calculated.
Bioengineering 09 00723 g009
Figure 10. Comparison between computational and experimental results.
Bioengineering 09 00723 g010aBioengineering 09 00723 g010b
Table 1. The total element numbers for different parts of the human head.
ComponentSkullBrainCerebrospinal FluidScalp and Skin
No. of elements229,17652,636113,083242,885
Table 2. Elastic material properties for the head model and the ground (the data come from [8,10]).
ComponentDensity (kg/m3)Young’s ModulusPoisson’s Ratio
Skull2.0 × 10320.1 GPa0.28
CSF1.0 × 1031.20 MPa0.49
Scalp, Skin, etc.1.2 × 10316.70 MPa0.42
Ground7.8 × 103210 GPa0.30
Table 3. Viscoelastic material properties for the head model and the ground (the data come from [8,10]).
ComponentDensity
(kg/m3)
Young’s ModulusShort-Time Shear
Modulus
Long-Time Shear
Modulus
Decay
Constant
Brain1.04 × 1032.19 GPa0.528 MPa0.168 MPa80
Table 4. Head injury threshold criteria.
Form of InjuryParametersThreshold
Brain damageICPDamage (>235 KPa)
Small or non-injury (<173 KPa)
Cut stressSevere injuries (11~16.5 KPa).
Von Mises stressBruising (7~8.6 KPa).
Mild traumatic brain injury (>20 KPa)
Concussion (15~20 KPa)
Shaft rope damage (>26 KPa)
Skull fractureVon Mises stressSkull fracture (>34.47 MPa)
Publisher’s Note: MDPI stays neutral with regard to jurisdictional claims in published maps and institutional affiliations.

