
Packaging Material Use Efficiency of Commercial PET and Glass Bottles for Mineral Water


Abstract
:1. Introduction
1.1. Mineral Water
1.2. PET and Glass Bottles
1.3. Intention of This Study and Hypotheses
2. Materials and Methods
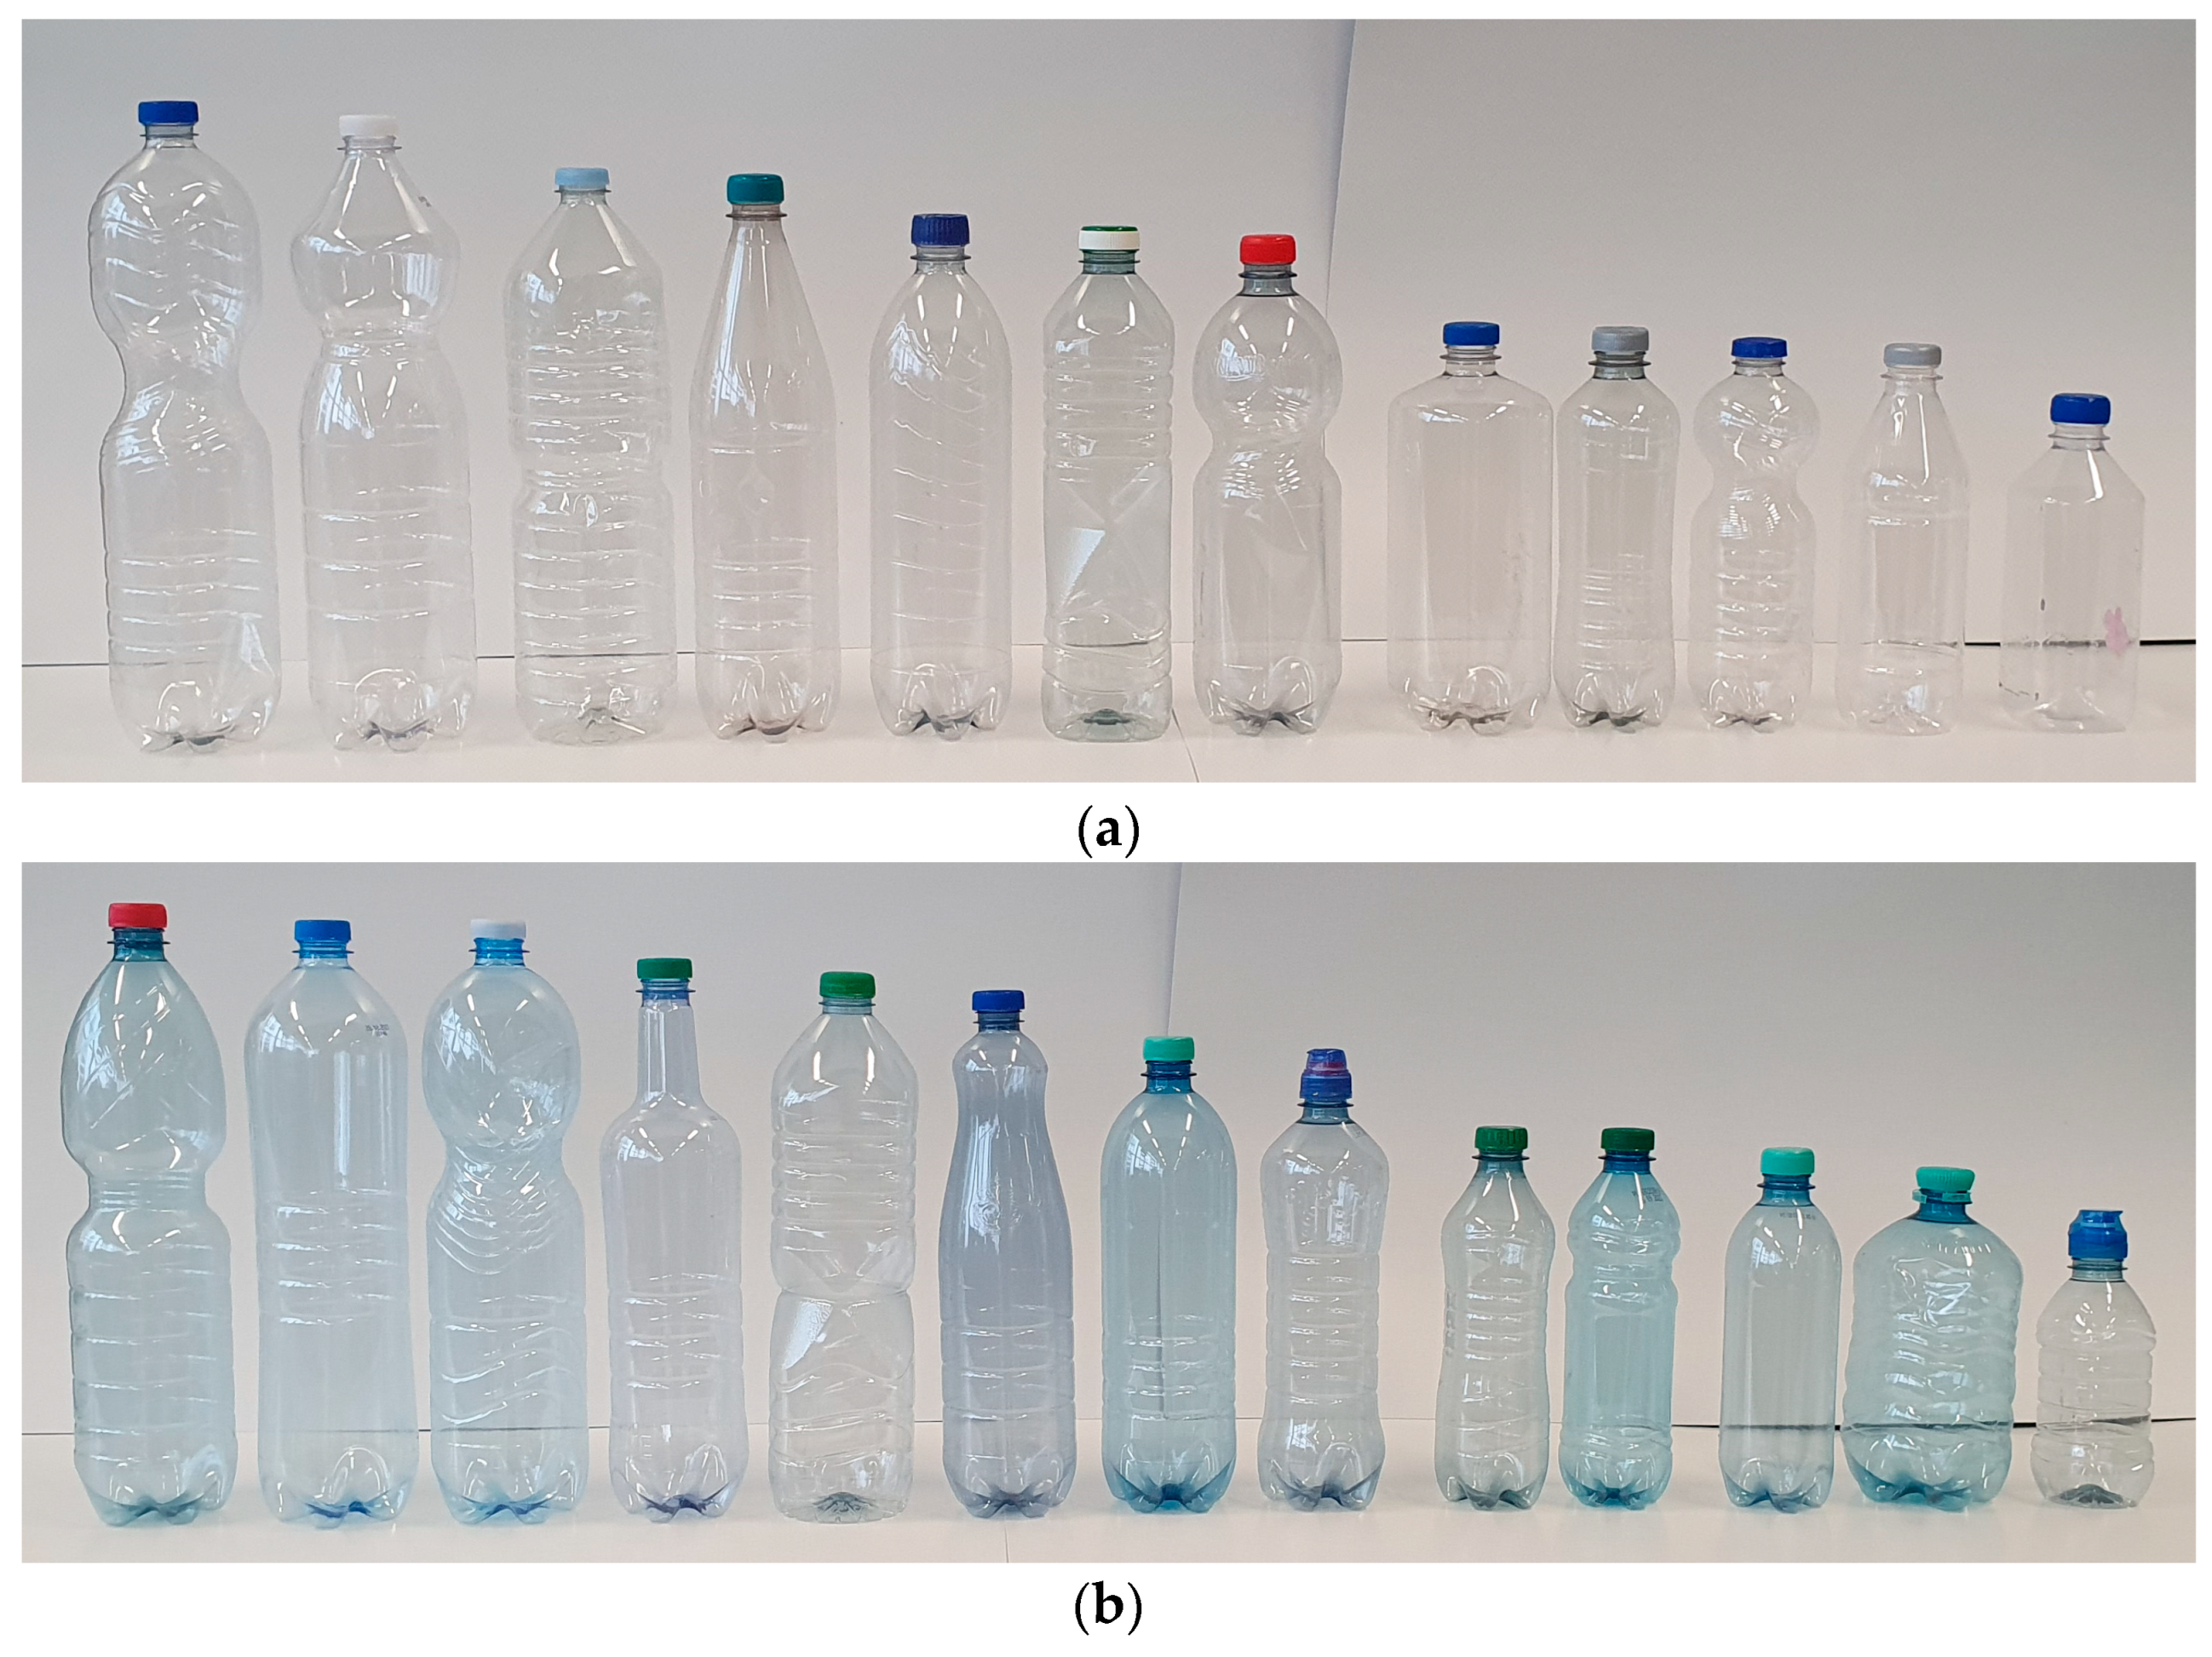
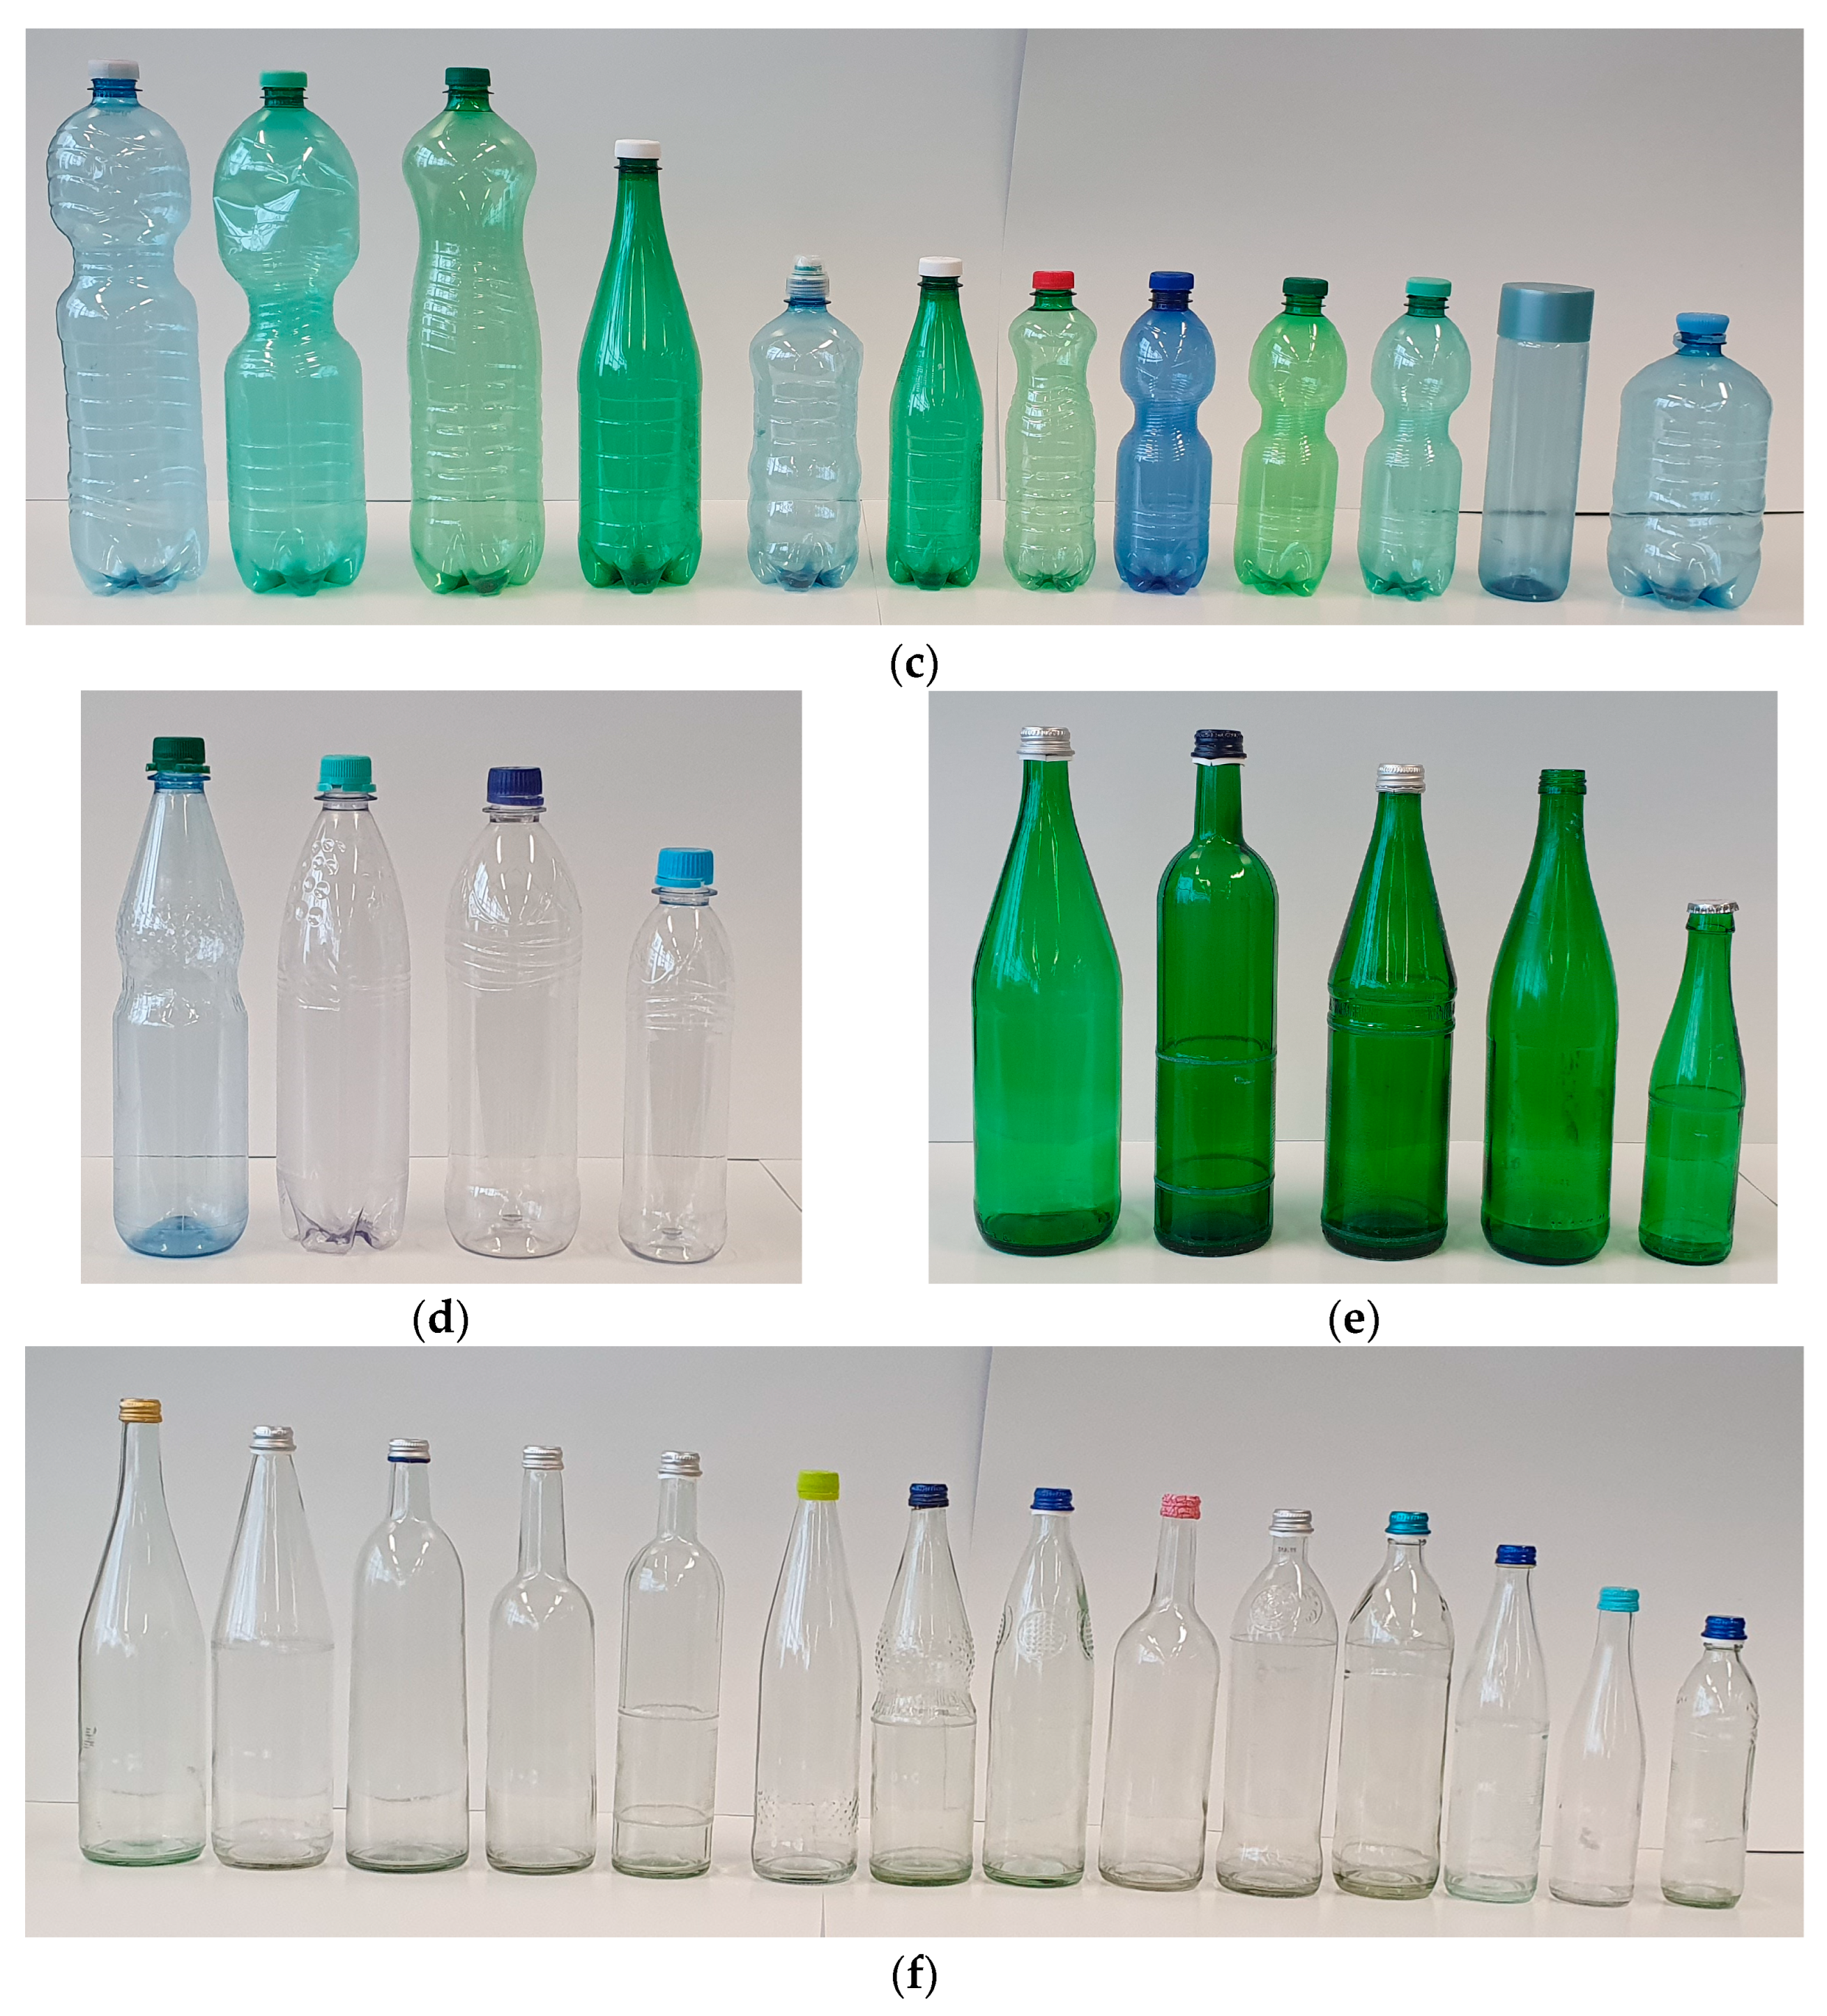
2.1. Sampling
2.2. Categorization
2.3. Sample Preparation and Measuring of Weights
3. Results and Discussion
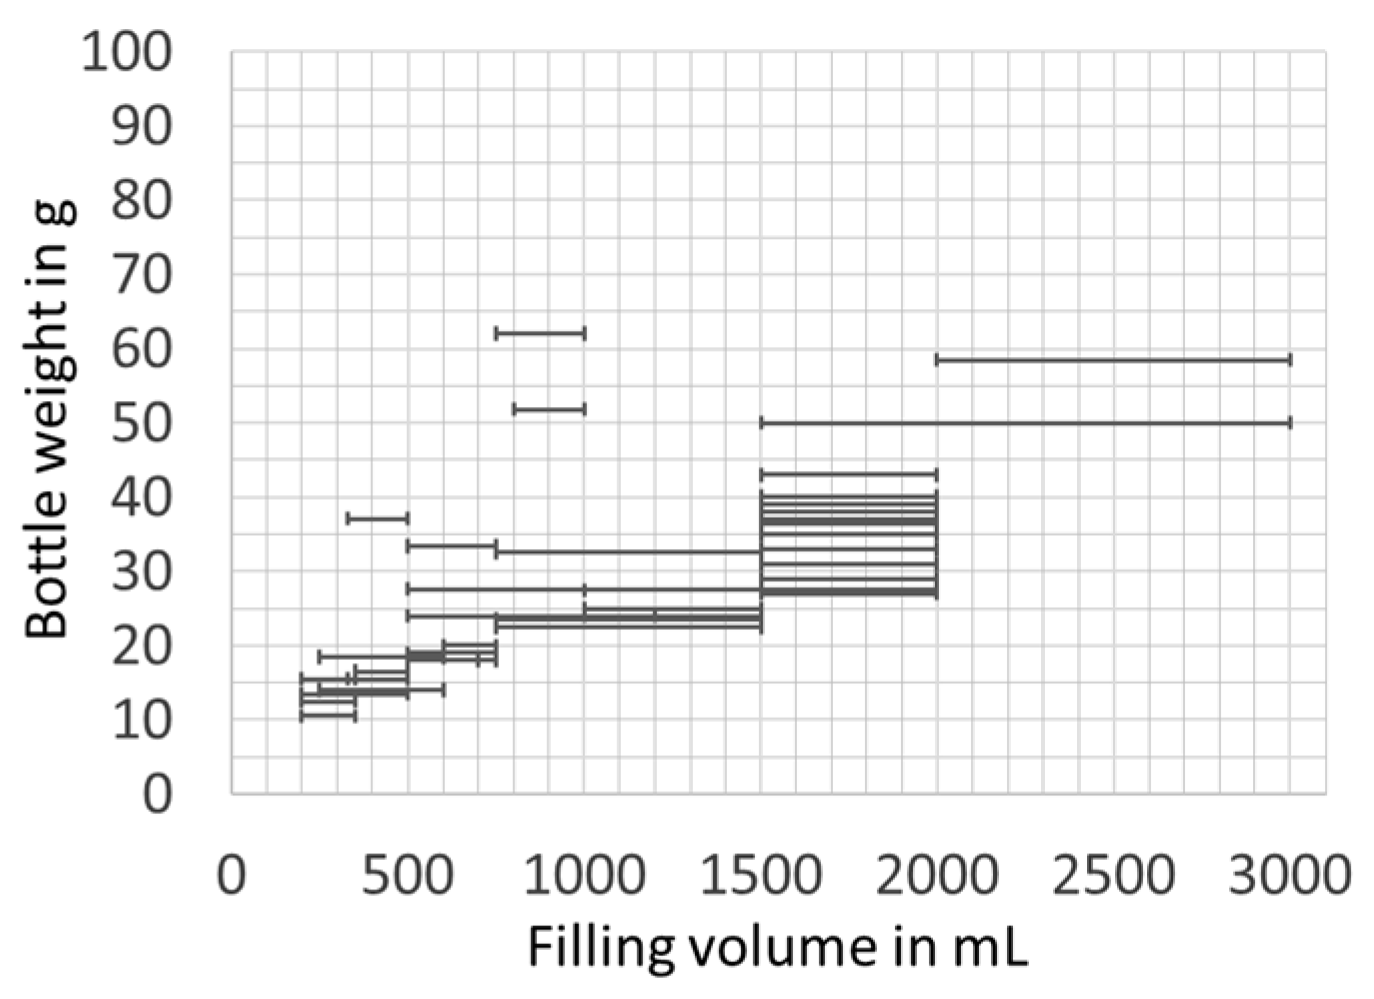
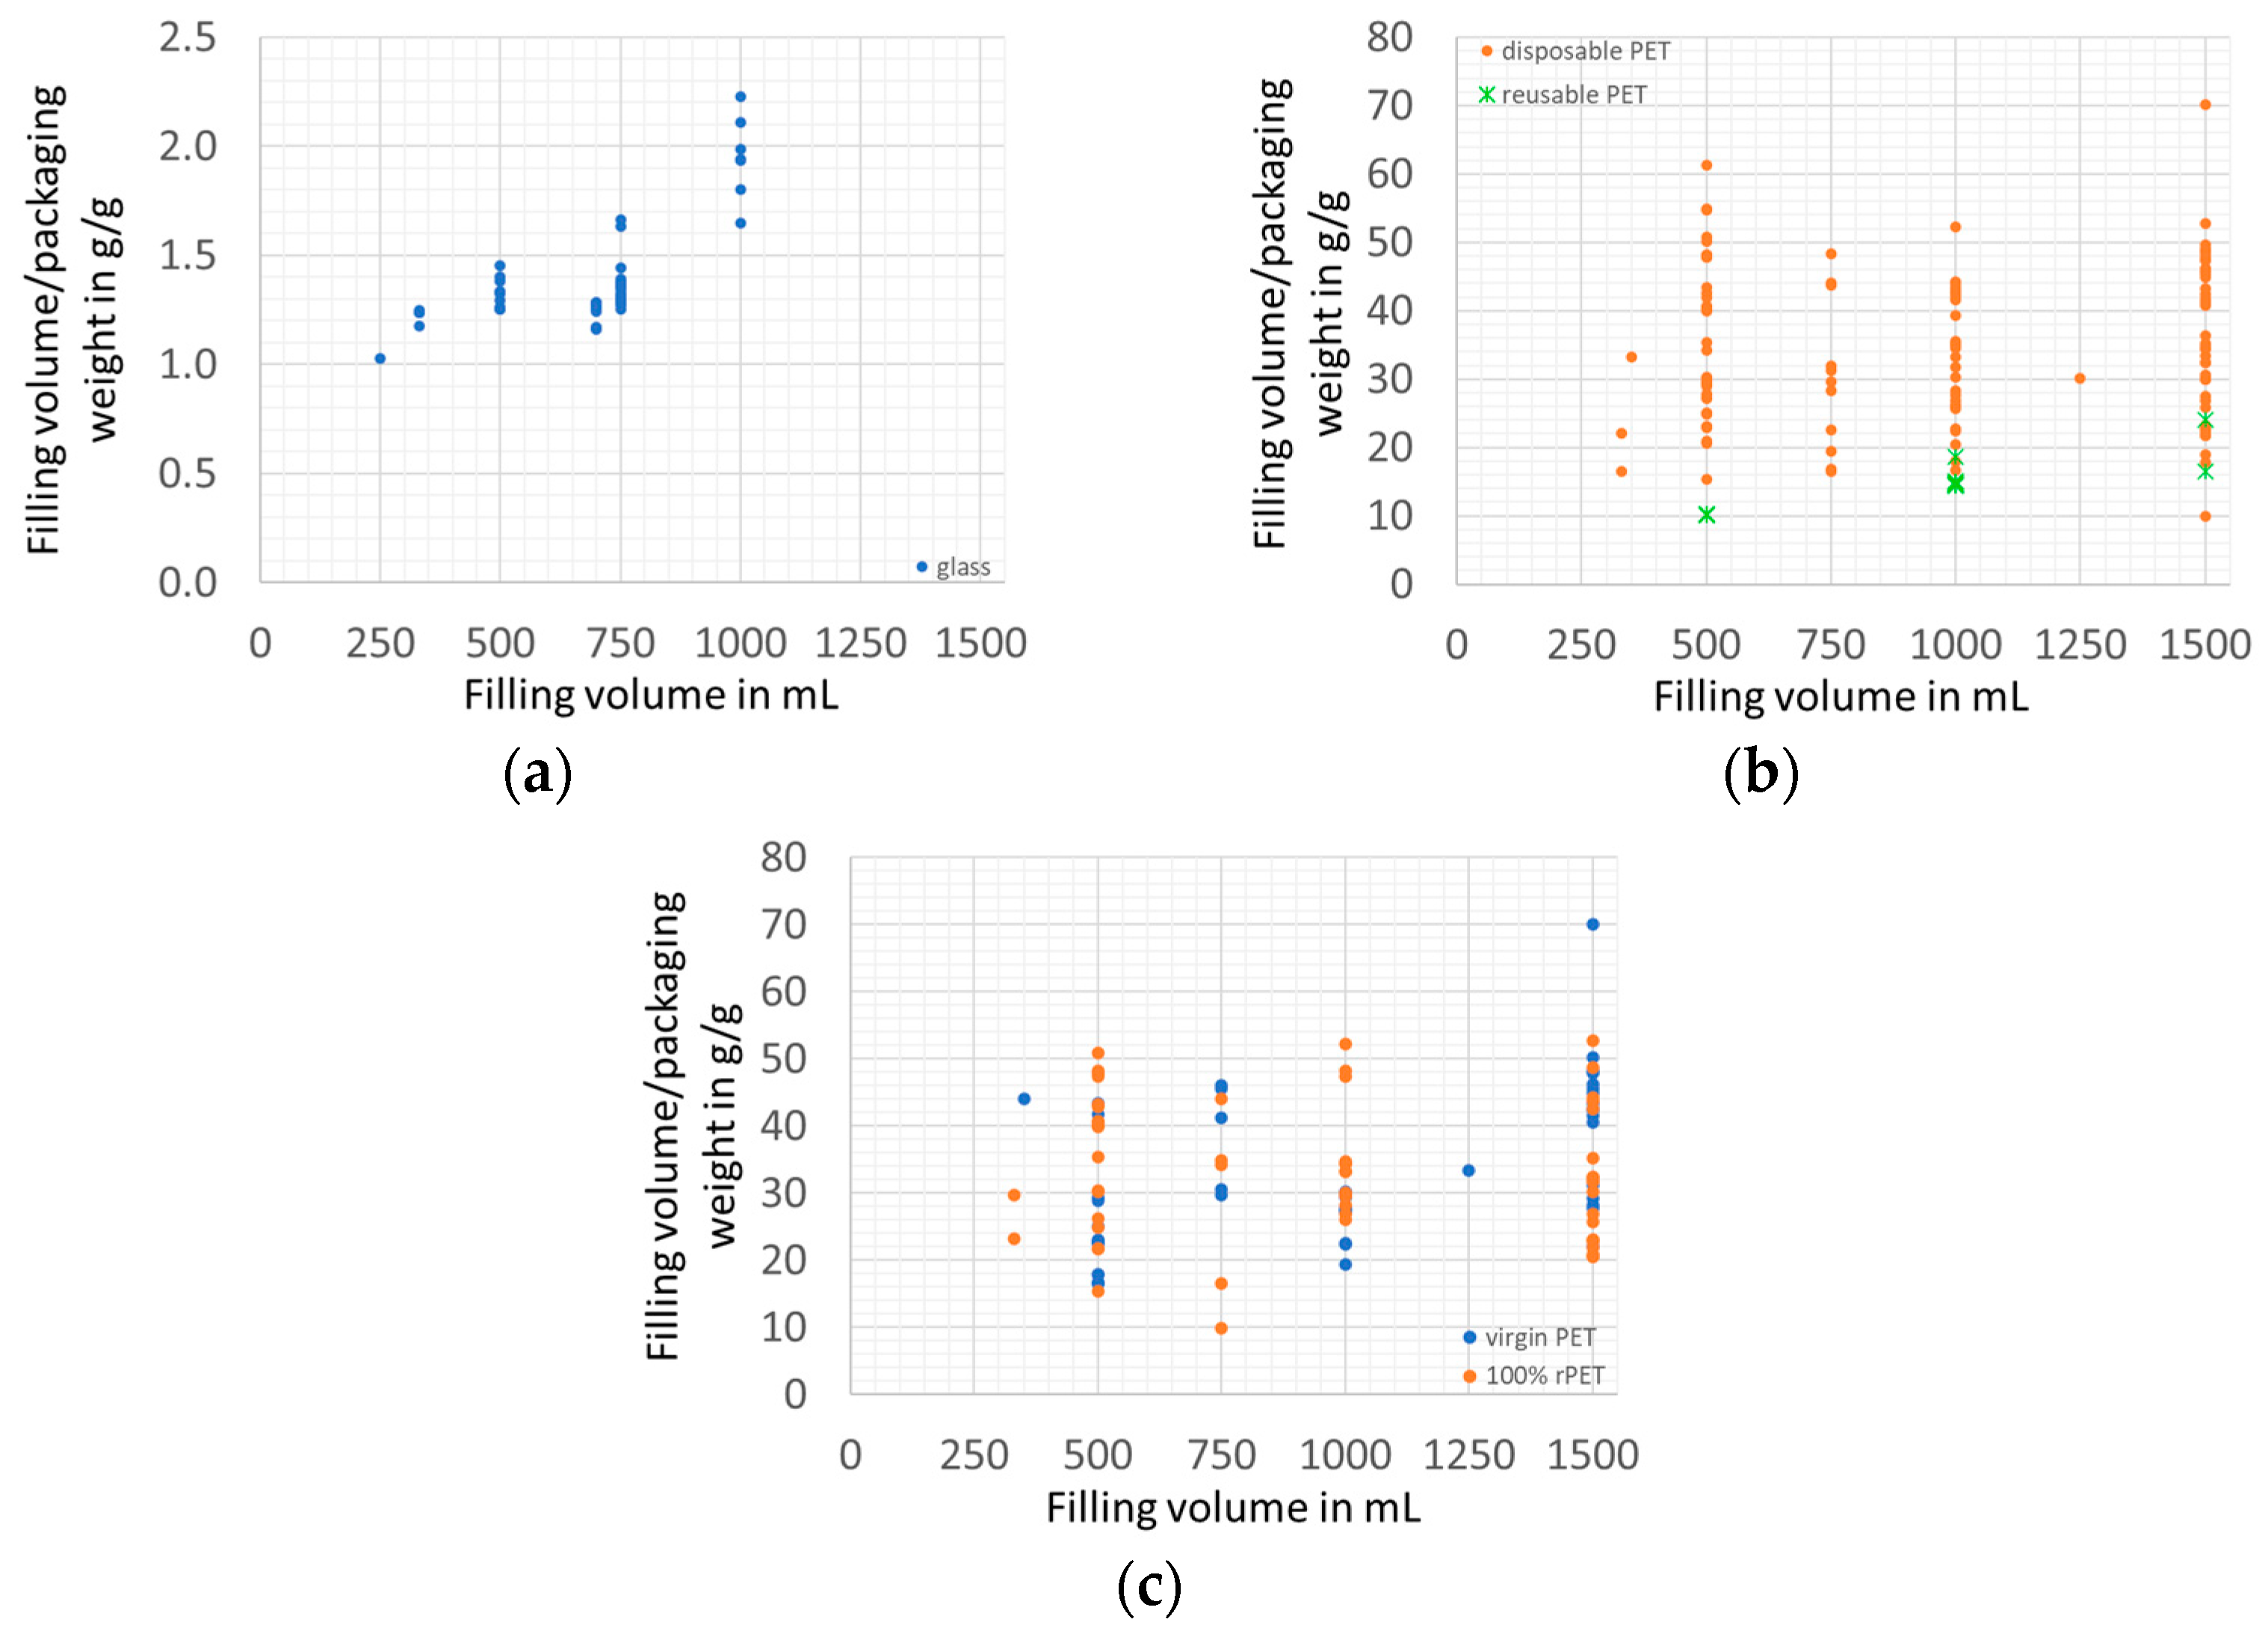
3.1. Packaging Efficiency
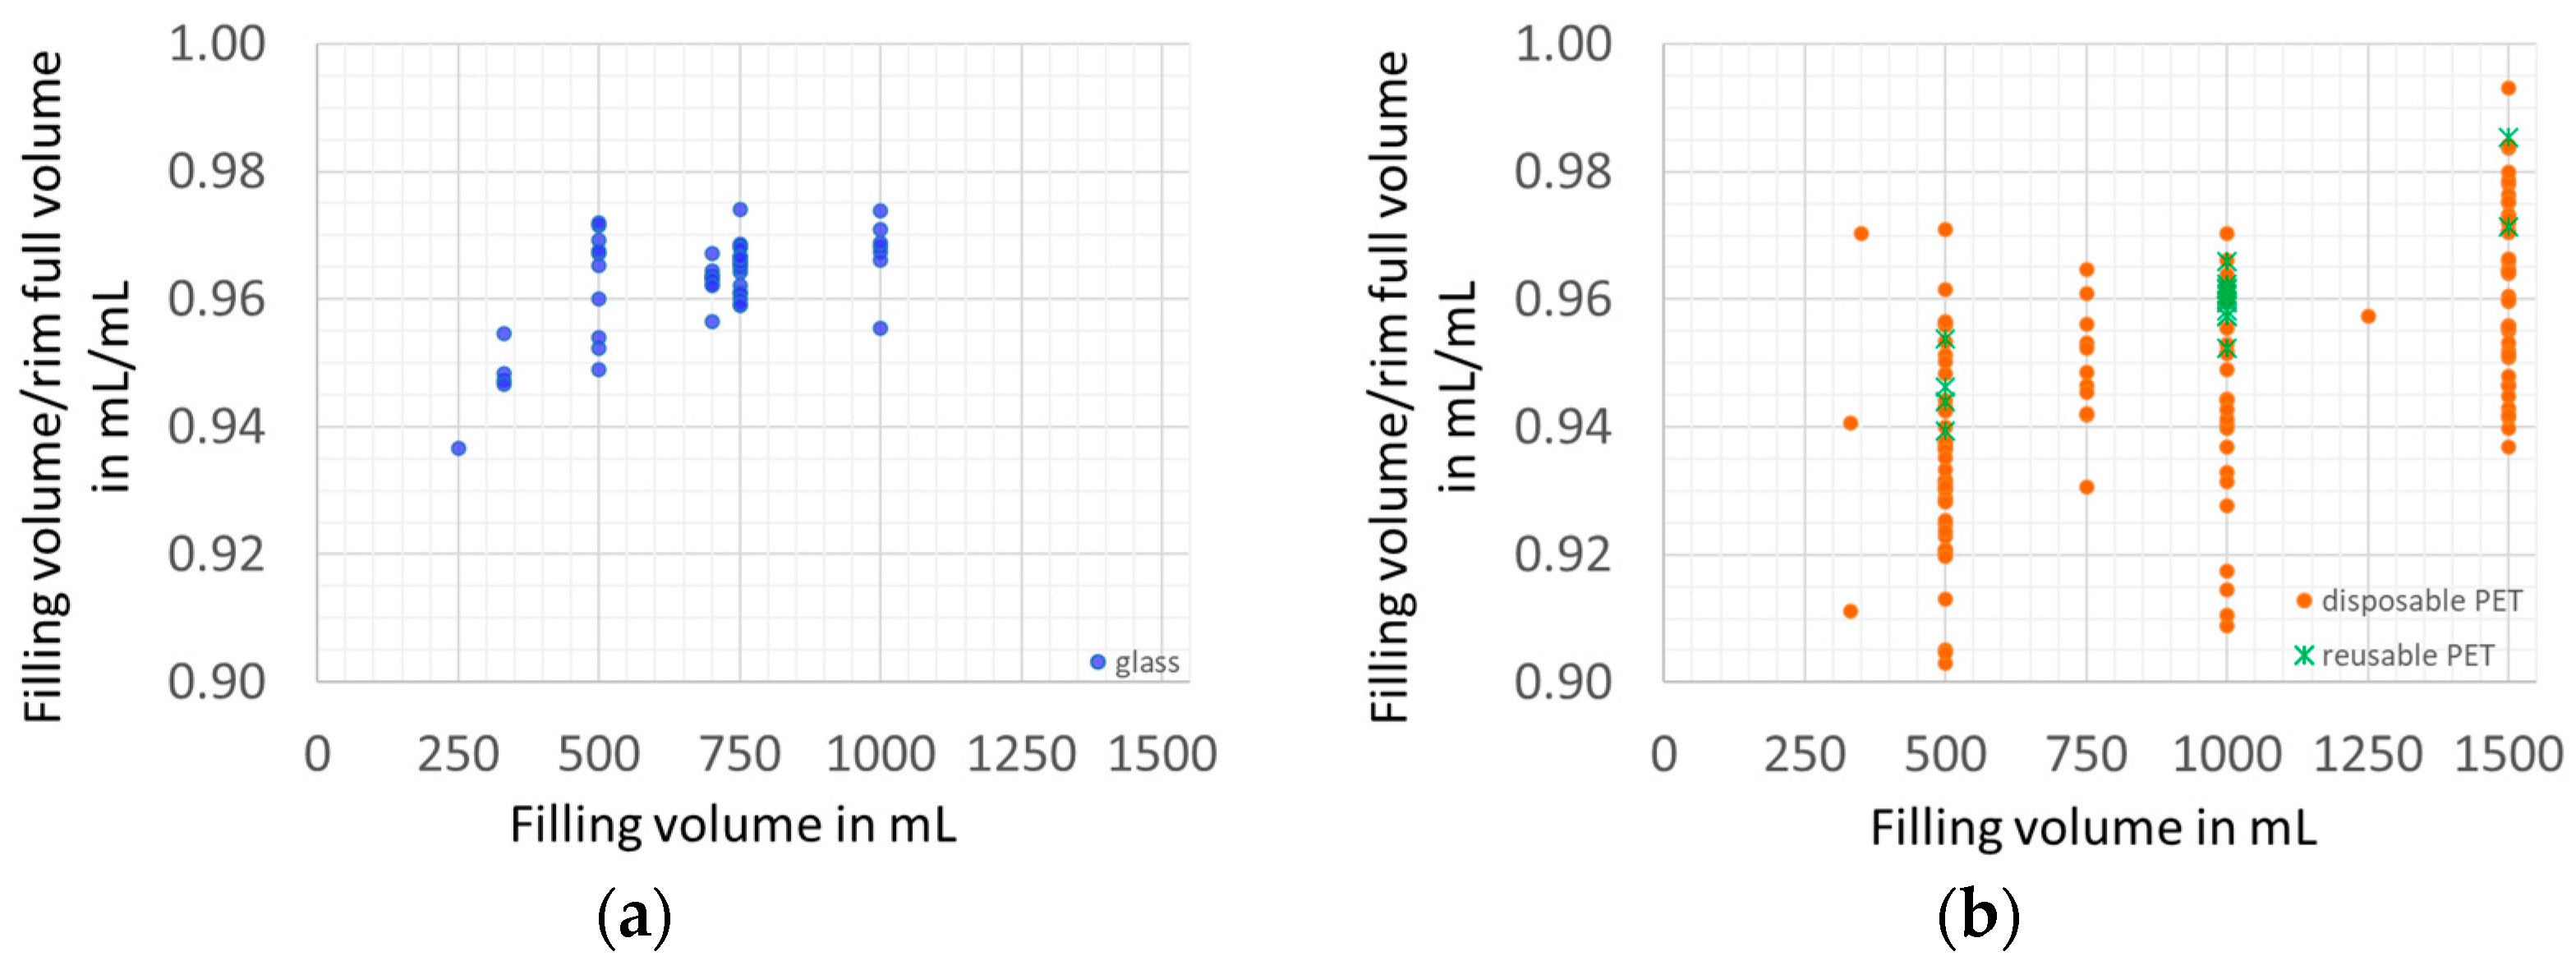
3.1.1. Filling Ratio
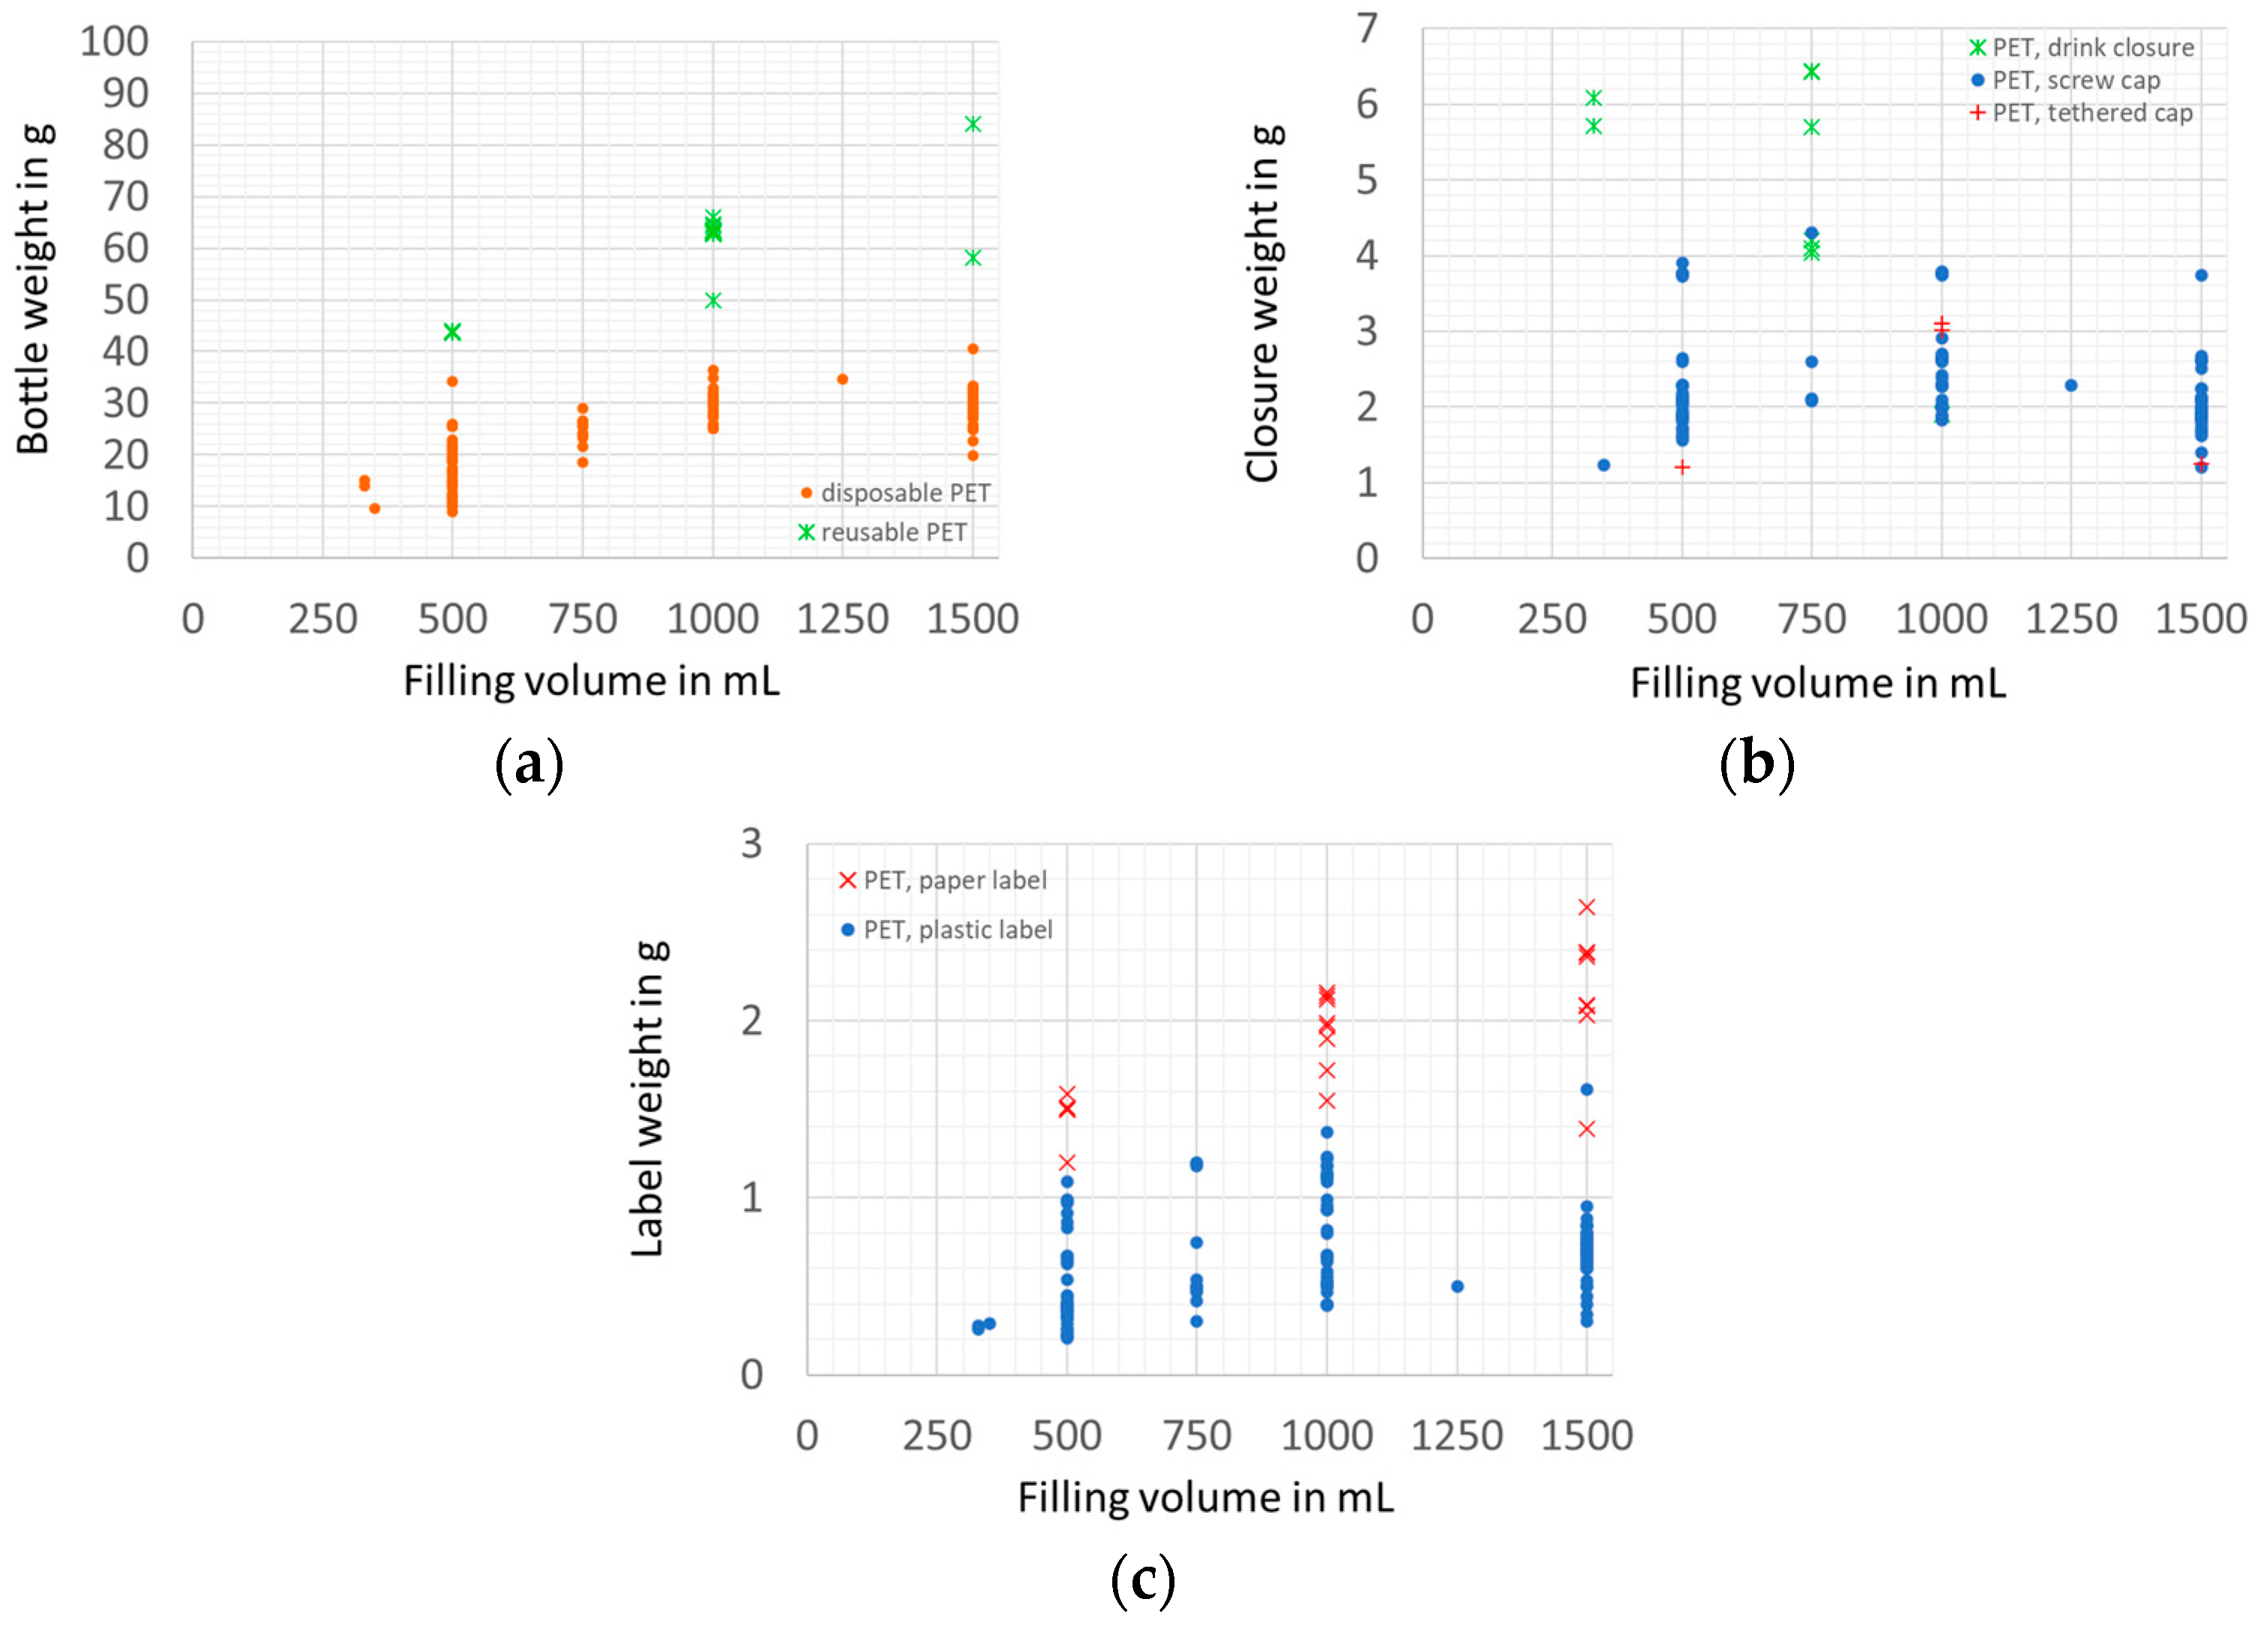
3.1.2. Packaging Material Use Efficiency
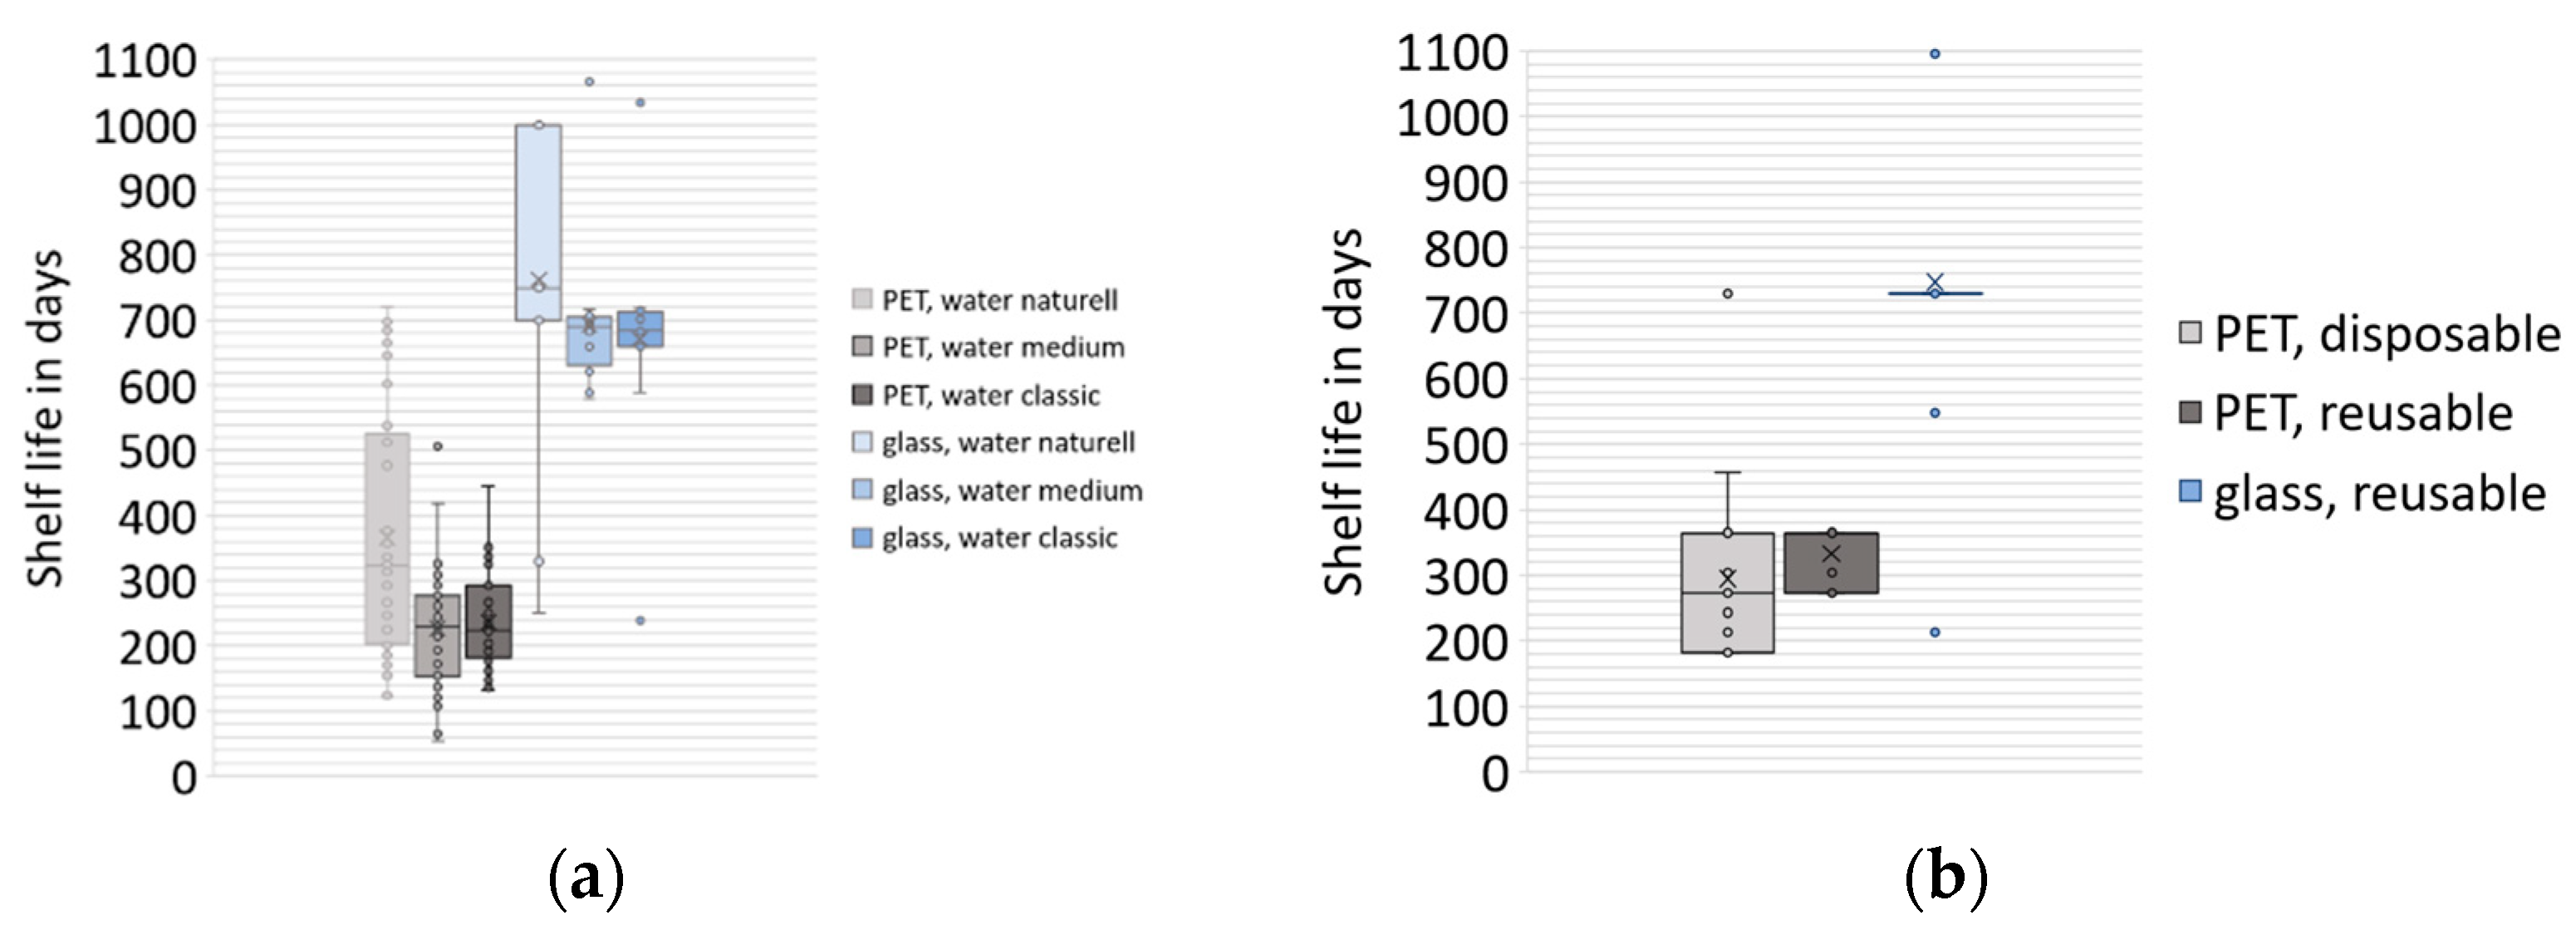
3.2. Shelf Life
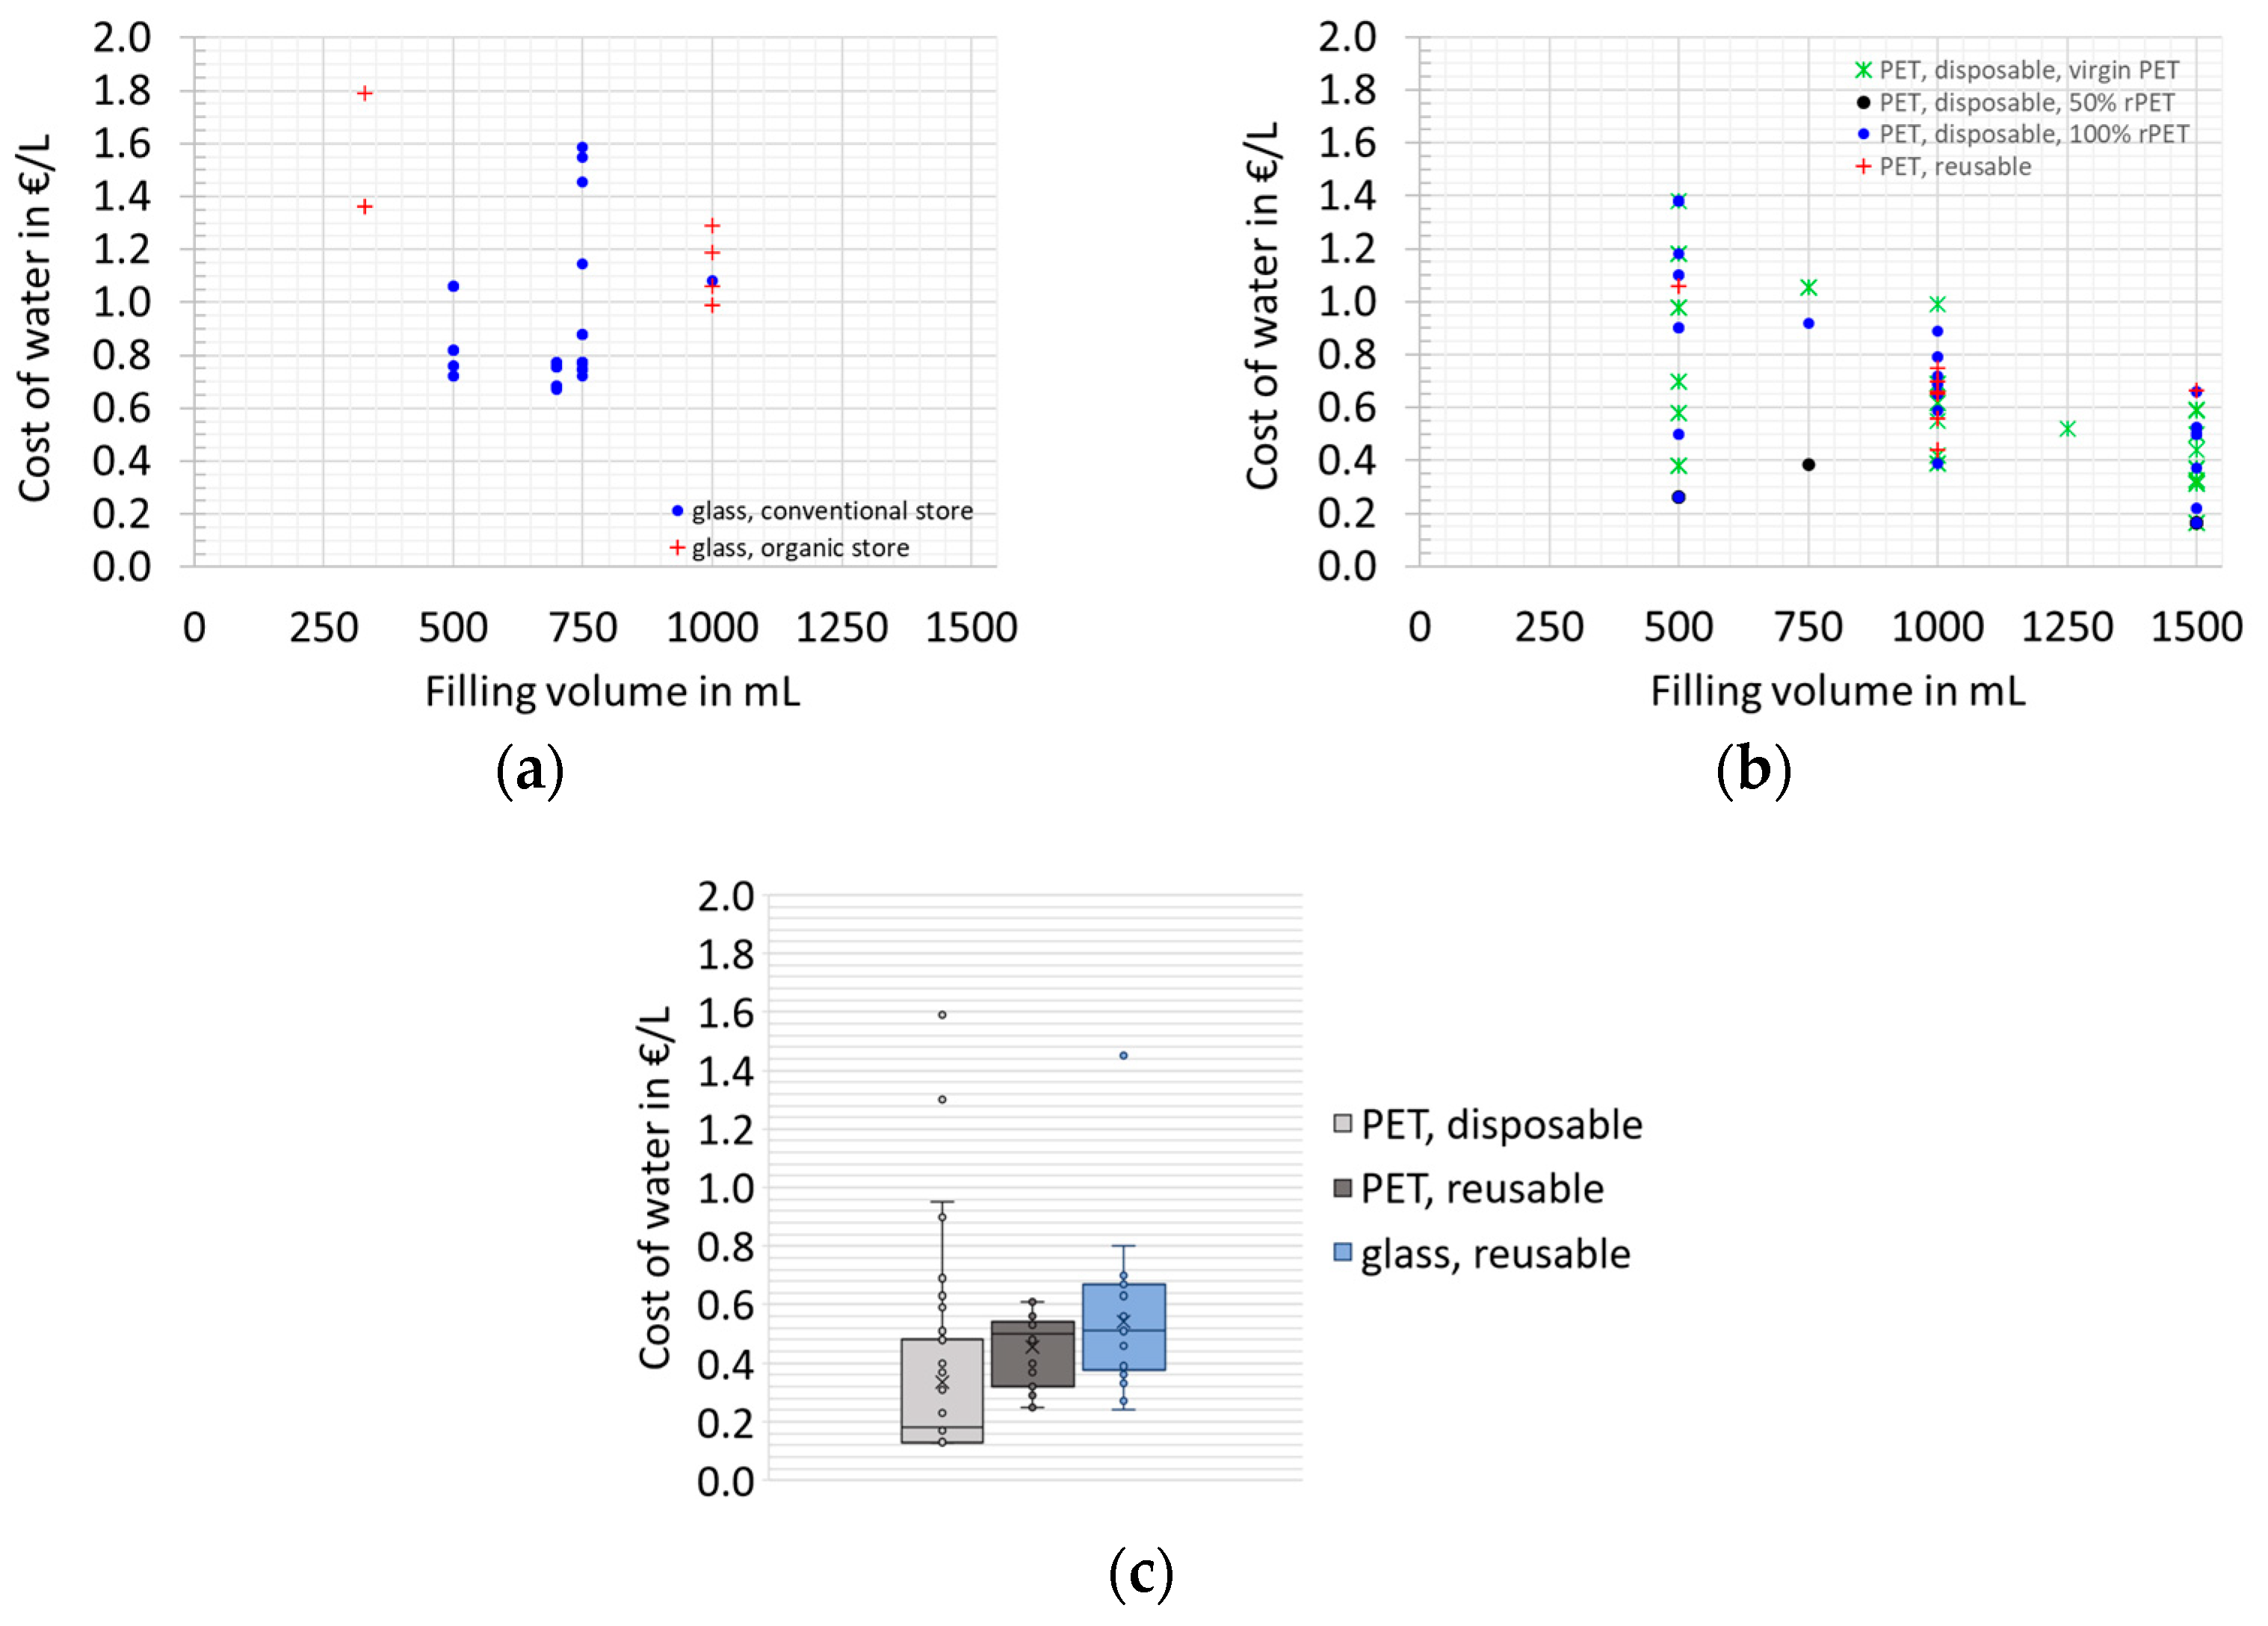
3.3. Cost
4. Conclusions
Supplementary Materials
Author Contributions
Funding
Data Availability Statement
Acknowledgments
Conflicts of Interest
References
- Directive 2009/54/EC of the European Parliament and of the Council of 18 June 2009 on the Exploitation and Marketing of Natural Mineral Waters (Recast) (Text with EEA Relevance): 2009/54/EC, 2009. Available online: https://eur-lex.europa.eu/LexUriServ/LexUriServ.do?uri=OJ:L:2009:164:0045:0058:EN:PDF (accessed on 30 May 2023).
- Verordnung über Natürliches Mineralwasser, Quellwasser und Tafelwasser (Mineral- und Tafelwasser-Verordnung): Min/TafelWV, 1984. Available online: https://www.gesetze-im-internet.de/min_tafelwv/BJNR010360984.html (accessed on 30 May 2023).
- Matissek, R. Erfrischungsgetränke. In Lebensmittelchemie, 9th ed.; Matissek, R., Ed.; Springer Spektrum: Berlin, Heidelberg, 2019; pp. 853–857. ISBN 978-3-662-59668-5. [Google Scholar]
- Belitz, H.-D.; Grosch, W.; Schieberle, P. Lehrbuch der Lebensmittelchemie, 6th ed.; Springer: Berlin, Heidelberg, 2008; ISBN 9783540732013. [Google Scholar]
- Rosborg, I.; Nihlgård, B.; Gerhardsson, L.; Gernersson, M.-L.; Ohlin, R.; Olsson, T. Concentrations of inorganic elements in bottled waters on the Swedish market. Environ. Geochem. Health 2005, 27, 217–227. [Google Scholar] [CrossRef] [PubMed]
- Marcussen, H.; Holm, P.E.; Hansen, H.C. Composition, Flavor, Chemical Foodsafety, and Consumer Preferences of Bottled Water. Compr. Rev. Food Sci. Food Saf. 2013, 12, 333–352. [Google Scholar] [CrossRef] [PubMed]
- Kończyk, J.; Muntean, E.; Gega, J.; Frymus, A.; Michalski, R. Major inorganic anions and cations in selected European bottled waters. J. Geochem. Explor. 2019, 197, 27–36. [Google Scholar] [CrossRef]
- Bertoldi, D.; Bontempo, L.; Larcher, R.; Nicolini, G.; Voerkelius, S.; Lorenz, G.D.; Ueckermann, H.; Froeschl, H.; Baxter, M.J.; Hoogewerff, J.; et al. Survey of the chemical composition of 571 European bottled mineral waters. J. Food Compos. Anal. 2011, 24, 376–385. [Google Scholar] [CrossRef]
- Cicchella, D.; Albanese, S.; Vivo, B.d.; Dinelli, E.; Giaccio, L.; Lima, A.; Valera, P. Trace elements and ions in Italian bottled mineral waters: Identification of anomalous values and human health related effects. J. Geochem. Explor. 2010, 107, 336–349. [Google Scholar] [CrossRef]
- Birke, M.; Rauch, U.; Harazim, B.; Lorenz, H.; Glatte, W. Major and trace elements in German bottled water, their regional distribution, and accordance with national and international standards. J. Geochem. Explor. 2010, 107, 245–271. [Google Scholar] [CrossRef]
- Lyubomirova, V.; Mihaylova, V.; Djingova, R. Chemical characterization of Bulgarian bottled mineral waters. J. Food Compos. Anal. 2020, 93, 103595. [Google Scholar] [CrossRef]
- Dinelli, E.; Lima, A.; Albanese, S.; Birke, M.; Cicchella, D.; Giaccio, L.; Valera, P.; Vivo, B.d. Comparative study between bottled mineral and tap water in Italy. J. Geochem. Explor. 2012, 112, 368–389. [Google Scholar] [CrossRef]
- Roje, V.; Šutalo, P. Trace and major elements in Croatian bottled waters. J. Geochem. Explor. 2019, 201, 79–87. [Google Scholar] [CrossRef]
- Hoch die Flaschen: Mineralwasser. Stiftung Warentest. July 2023. 12–19. Available online: https://www.test.de/shop/test-hefte/test_07_2023/ (accessed on 31 October 2023).
- Mineral Was? Mineralwasser: Die Beliebteste Mineralwasser-Sorte ist Medium. Erfrischend ist auch das Testergebnis: 27 von 31 Medium-Wässern Sind Sehr Gut Oder Gut. Stiftung Warentest [Online], August 2020, 10–17. Available online: https://www.test.de/shop/test-hefte/test_08_2020/ (accessed on 30 May 2023).
- Von Sehr Gut Bis Entzaubert, Mineralwasser: Viele der 32 Stillen Wässer Sind Sehr Gut Oder Gut. Zwei der Fünf Bioprodukte im Test Gehören Nicht Dazu. Auch Enttäuschend: Die Edelmarken Voss und Healsi. Sie Sind Vor Allem Eins–Besonders Teuer. Stiftung Warentest [Online], August 2021, 10–17. Available online: https://www.test.de/shop/test-hefte/test_08_2021/ (accessed on 30 May 2023).
- Top-Wässer ab 17 Cent pro Liter, Mineralwasser: In unserem Test von 32 Classic-Mineralwässern Machen vor Allem Preiswerte von Sich Reden. Zwei Markenwässer Dagegen Versprechen zu viel. Eins fällt Geschmacklich Negativ auf. Stiftung Warentest [Online], July 2022, 12–19. Available online: https://www.test.de/shop/test-hefte/test_07_2022/ (accessed on 30 May 2023).
- Dross. Liste der in Deutschland Amtlich Anerkannten Natürlichen Mineralwässer aus Deutschland. 2022. Available online: https://www.bvl.bund.de/SharedDocs/Downloads/01_Lebensmittel/datenmanagement/mineralwasser_deutsche.html (accessed on 30 May 2023).
- VDM Verband Deutscher Mineralbrunnen e.V. Vorläufige Branchendaten 2022, 2023. Available online: http://www.vdm-bonn.de; https://www.mineralwasser.com (accessed on 30 May 2023).
- Palzer, G. Establishment of a Standard Test Procedure for PET Bottle Materials with Respect to Chemical Inertness Behaviour Including the Preparation of a Certified PET Reference Material. Ph.D. Thesis, Technische Universität München, Munich, Germany, 2002. Available online: https://mediatum.ub.tum.de/603385 (accessed on 30 May 2023).
- Tsironi, T.N.; Chatzidakis, S.M.; Stoforos, N.G. The future of polyethylene terephthalate bottles: Challenges and sustainability. Packag. Technol. Sci. 2022, 35, 317–325. [Google Scholar] [CrossRef]
- Müller, K. O2-Durchlässigkeit von Kunststoffflaschen und Verschlüssen: Messung und Modellierung der Stofftransportvorgänge. Ph.D. Thesis, Technische Universität München, Munich, Germany, 2002. Available online: https://mediatum.ub.tum.de/603313 (accessed on 30 May 2023).
- Liger-Belair, G.; Sternenberg, F.; Brunner, S.; Robillard, B.; Cilindre, C. Bubble dynamics in various commercial sparkling bottled waters. J. Food Eng. 2015, 163, 60–70. [Google Scholar] [CrossRef]
- Liger-Belair, G. Chapter 2-CO2 and Bubbles in Sparkling Waters. In Trends in Non-Alcoholic Beverages; Galanakis, C.M., Ed.; Academic Press: Cambridge, MA, USA, 2020; pp. 37–62. ISBN 978-0-12-816938-4. [Google Scholar]
- Folz, R. Geschmacks-und biologische Stabilität von Bier in Kunststoffverpackungen. Ph.D. Thesis, Technische Universität Berlin, Berlin, Germany, 2010. Available online: http://nbn-resolving.de/urn:nbn:de:kobv:83-opus-28139 (accessed on 30 May 2023).
- Duan, Z.; Sun, R. An improved model calculating CO2 solubility in pure water and aqueous NaCl solutions from 273 to 533 K and from 0 to 2000 bar. Chem. Geol. 2003, 193, 257–271. [Google Scholar] [CrossRef]
- Portier, S.; Rochelle, C. Modelling CO2 solubility in pure water and NaCl-type waters from 0 to 300 °C and from 1 to 300 bar: Application to the Utsira Formation at Sleipner. Chem. Geol. 2005, 217, 187–199. [Google Scholar] [CrossRef]
- Weiss, R.F. Carbon dioxide in water and seawater: The solubility of a non-ideal gas. Mar. Chem. 1974, 2, 203–215. [Google Scholar] [CrossRef]
- Herwig, H. Die geschüttelte Mineralwasser-Flasche steht unter hohem Druck–Und andere Effekte von gelöstem Kohlendioxid. In Ach, So Ist Das!: 50 Thermofluiddynamische Alltagsphänomene Anschaulich und Wissenschaftlich Erklärt; Herwig, H., Ed.; Springer Fachmedien Wiesbaden: Wiesbaden, Germany, 2014; pp. 123–127. ISBN 978-3-658-05630-8. [Google Scholar]
- Stichel, W. Wasserchemie für Ingenieure. Von, F. H. Frimmel und 17 Mitautoren, DVGW Lehr- und Handbuch Wasserversorgung, Band 5, herausgegeben vom DVGW Deutscher Verein des Gas-und Wasserfaches e.V., 496 S. mit zahlr. Abb., Format DIN A 5, R. Oldenbourg Verlag, München Wien 1993. geb. DM 128. Mater. Corros. 1994, 45, 367. [Google Scholar] [CrossRef]
- Angewandte Grundwasserchemie, Hydrogeologie und Hydrogeochemische Modellierung: Grundlagen, Anwendungen und Problemlösungen; Wisotzky, F. (Ed.) Springer: Berlin, Germany, 2011; ISBN 978-3-642-17813-9. [Google Scholar]
- Filella, M. Antimony and PET bottles: Checking facts. Chemosphere 2020, 261, 127732. [Google Scholar] [CrossRef] [PubMed]
- Gambino, I.; Bagordo, F.; Coluccia, B.; Grassi, T.; Filippis, G.D.; Piscitelli, P.; Galante, B.; Leo, F.D. PET-Bottled Water Consumption in View of a Circular Economy: The Case Study of Salento (South Italy). Sustainability 2020, 12, 7988. [Google Scholar] [CrossRef]
- Hopmann, C.; Michaeli, W. Verarbeitungsverfahren für Kunststoffe. Einführung in die Kunststoffverarbeitung; Carl Hanser Verlag GmbH & Co. KG: Munich, Germany, 2015; pp. 109–242. ISBN 978-3-446-44627-4. [Google Scholar]
- Thielen, M.; Gust, P.; Hartwig, K. Blasformen: Von Kunststoffhohlkörpern; 2.; aktualisierte Auflage; Carl Hanser Verlag: München, Germany, 2020; ISBN 9783446458567. [Google Scholar]
- Pet Packaging Technology; Giles, G.A.; Brooks, D.W. (Eds.) Sheffield Academic Press: Boca Raton, FL, USA, 2002; ISBN 1841272221. [Google Scholar]
- Dörr, C. Untersuchung der Eignung von Kunststoffflaschen für die Bierabfüllung. Ph.D. Thesis, Technische Universität München, Munich, Germany, 2003. Available online: https://mediatum.ub.tum.de/603354 (accessed on 30 May 2023).
- Pinter, E.; Welle, F.; Mayrhofer, E.; Pechhacker, A.; Motloch, L.; Lahme, V.; Grant, A.; Tacker, M. Circularity study on pet bottle-to-bottle recycling. Sustainability 2021, 13, 7370. [Google Scholar] [CrossRef]
- Welle, F. Is PET bottle-to-bottle recycling safe? Evaluation of post-consumer recycling processes according to the EFSA guidelines. Resour. Conserv. Recycl. 2013, 73, 41–45. [Google Scholar] [CrossRef]
- Welle, F. Twenty years of PET bottle to bottle recycling—An overview. Resour. Conserv. Recycl. 2011, 55, 865–875. [Google Scholar] [CrossRef]
- Grayhurst, P.; Girling, P.J. Packaging of Food in Glass Containers. In Food and Beverage Packaging Technology; CRC Press: London, UK, 2011; pp. 137–156. ISBN 9781444392180. [Google Scholar]
- Packaging Technology: Fundamentals, Materials and Processes; Emblem, A.; Emblem, H. (Eds.) Elsevier Science: Oxford, UK, 2012; ISBN 9780857095701. [Google Scholar]
- Lechleitner, A.; Schwabl, D.; Schubert, T.; Bauer, M.; Lehner, M. Chemisches Recycling von gemischten Kunststoffabfällen als ergänzender Recyclingpfad zur Erhöhung der Recyclingquote. Osterr. Wasser-Und Abfallwirtsch. 2020, 72, 47–60. [Google Scholar] [CrossRef]
- Sundell, H.A.; Mæs, T. Relationship between impact energy and design parameters of glass bottles. Packag. Technol. Sci. 1991, 4, 29–33. [Google Scholar] [CrossRef]
- Jaime, S.B.M.; Ortiz, S.A.; Dantas, T.B.; Damasceno, C.F. A comparison of the performance of lightweight glass containers manufactured by the P&B and B&B processes. Packag. Technol. Sci. 2002, 15, 225–230. [Google Scholar] [CrossRef]
- Doyle, P.J. Recent developments in the production of stronger glass containers. Packag. Technol. Sci. 1988, 1, 47–53. [Google Scholar] [CrossRef]
- Balzarotti, S.; Maviglia, B.; Biassoni, F.; Ciceri, M.R. Glass vs. Plastic: Affective Judgments of Food Packages After Visual and Haptic Exploration. Procedia Manuf. 2015, 3, 2251–2258. [Google Scholar] [CrossRef]
- Furberg, A.; Moum, A.L.; Nørsterud, S.; Raadal, H.L. Review of Life Cycle Assessments of Reuse Systems for Bottles: REPORT NO. OR.37.21, project number 3301, ISBN NO. 978-82-7520-874-1. Infinitum Literature Review 2021 No. 23, Kråkerøy, Norway, 2021. Available online: https://norsus.no/wp-content/uploads/Final-report-2021-11-30.pdf (accessed on 30 May 2023).
- Detzel, A.; Kauertz, B.; Grahl, B.; Heinisch, J. Prüfung und Aktualisierung der Ökobilanzen für Getränkeverpackungen: TEXTE 19/2016. Forschungskennzahl 3711 92 315, UBA-FB 002276, ISSN 1862-4804, Dessau-Roßlau, Germany, 2016. Available online: https://www.umweltbundesamt.de/publikationen/pruefung-aktualisierung-der-oekobilanzen-fuer (accessed on 30 May 2023).
- Ferrara, C.; Feo, G.d.; Picone, V. LCA of Glass Versus PET Mineral Water Bottles: An Italian Case Study. Recycling 2021, 6, 50. [Google Scholar] [CrossRef]
- Fredy Dinkel, T.K. Ökobilanz Getränkeverpackungen: Gesamtbericht; Referenz: Basel, Switzerland, 2014; Available online: https://www.newsd.admin.ch/newsd/message/attachments/36446.pdf (accessed on 30 May 2023).
- Stefanini, R.; Borghesi, G.; Ronzano, A.; Vignali, G. Plastic or glass: A new environmental assessment with a marine litter indicator for the comparison of pasteurized milk bottles. Int. J. Life Cycle Assess. 2021, 26, 767–784. [Google Scholar] [CrossRef]
- Lexikon Verpackungstechnik; Bleisch, G.; Langowski, H.-C.; Majschak, J.-P. (Eds.) 2. Aufl.; Behr’s Verlag DE: Hamburg, Germany, 2014; ISBN 9783954680344. [Google Scholar]
- Langowski, H.-C. Permeation of Gases and Condensable Substances through Monolayer and Multilayer Structures. In Plastic Packaging; Wiley: Hoboken, NJ, USA, 2008; pp. 297–347. ISBN 9783527621422. [Google Scholar] [CrossRef]
- Jaime, S.B.; Alves, R.M.; Bócoli, P.F. Moisture and oxygen barrier properties of glass, PET and HDPE bottles for pharmaceutical products. J. Drug Deliv. Sci. Technol. 2022, 71, 103330. [Google Scholar] [CrossRef]
- Becerril-Arreola, R.; Bucklin, R.E. Beverage bottle capacity, packaging efficiency, and the potential for plastic waste reduction. Sci. Rep. 2021, 11, 3542. [Google Scholar] [CrossRef]
- Kostic, D.; Hoffmann, U.; Fürtauer, S.; Fell, T.; Yilmaz, C.; Burth, D.; Sängerlaub, S. Packaging Weight, Filling Ratio and Filling Efficiency of Yogurt and Relevant Packagings Depending on Commercial Packaging Design, Material, Packaging Type and Filling Quantity. Dairy 2022, 3, 668–692. [Google Scholar] [CrossRef]
- Go, N. Beitrag zum Recyclingpotential von PET-Und PS-Kunststoffverpackungsabfällen; Shaker Verlag: Düren, Germany, 2020; ISBN 9783844077261. [Google Scholar]
- Koo, H.J.; Chang, G.S.; Kim, S.H.; Hahm, W.G.; Park, S.Y. Effects of recycling processes on physical, mechanical and degradation properties of PET yarns. Fibers Polym. 2013, 14, 2083–2087. [Google Scholar] [CrossRef]
- Nait-Ali, K.L.; Bergeret, A.; Ferry, L.; Colin, X. Chain branching detection by Cole–Cole modeling of rheological properties changes during PET mechanical recycling. Polym. Test. 2012, 31, 500–504. [Google Scholar] [CrossRef]
- Mancini, S.D.; Zanin, M. Consecutive steps of PET recycling by injection: Evaluation of the procedure and of the mechanical properties. J. Appl. Polym. Sci. 2000, 76, 266–275. [Google Scholar] [CrossRef]
- Sängerlaub, S.; Glas, C.E.; Schlemmer, D.; Müller, K. Influence of multiple extrusions of blends made of polyethylene terephthalate and an oxygen scavenger on processing and packaging-related properties. J. Plast. Film. Sheeting 2020, 36, 260–284. [Google Scholar] [CrossRef]
- Schyns, Z.O.G.; Shaver, M.P. Mechanical Recycling of Packaging Plastics: A Review. Macromol. Rapid Commun. 2021, 42, 2000415. [Google Scholar] [CrossRef] [PubMed]
- Schmiemann, A.; Amici, M.; Schröder, T.; van Roost, H.; Jahnke, E.; Nießner, N.; Mangold, H.; Beyer, C.; Leadbitter, J.; Wilhelmus, B. Mechanical Recycling. In Recycling of Plastics; Carl Hanser Verlag GmbH & Co. KG: Munich, Germany, 2022; pp. 275–433. ISBN 978-1-56990-856-3. [Google Scholar]
- Ruf, A.; Borer, C. Festphasenpolykondensation (SSP) von Polyester; Simulation zum Scale up und zur Optimierung. Chem. Ing. Tech. 2000, 72, 1032. [Google Scholar] [CrossRef]
- Scientific Opinion on the safety assessment of the processes “Roxane Nord” and “Stute”, based on KRONES® technology used to recycle post-consumer poly(ethylene terephthalate) (PET) into food contact materials. EFS2 2014, 12, 11. [CrossRef]
- Cruz, S.A.; Scuracchio, C.H.; Fitaroni, L.B.; Oliveira, É. The use of melt rheology and solution viscometry for degradation study of post-consumer poly(ethylene terephthalate): The effects of the contaminants, reprocessing and solid state polymerization. Polym. Test. 2017, 60, 236–241. [Google Scholar] [CrossRef]
- Lambré, C.; Barat Baviera, J.M.; Bolognesi, C.; Chesson, A.; Cocconcelli, P.S.; Crebelli, R.; Gott, D.M.; Grob, K.; Mengelers, M.; Mortensen, A.; et al. Safety assessment of the process Basatli Boru Profil, based on the Starlinger iV+ technology, used to recycle post-consumer PET into food contact materials. EFS2 2023, 21, e07923. [Google Scholar] [CrossRef]
- Lambré, C.; Barat Baviera, J.M.; Bolognesi, C.; Chesson, A.; Cocconcelli, P.S.; Crebelli, R.; Gott, D.M.; Grob, K.; Mengelers, M.; Mortensen, A.; et al. Safety assessment of the process Commercial Plastics, based on the Starlinger iV+ technology, used to recycle post-consumer PET into food contact materials. EFS2 2023, 21, e07925. [Google Scholar] [CrossRef]
- Lambré, C.; Barat Baviera, J.M.; Bolognesi, C.; Chesson, A.; Cocconcelli, P.S.; Crebelli, R.; Gott, D.M.; Grob, K.; Mengelers, M.; Mortensen, A.; et al. Safety assessment of the process Royce Universal, based on the Starlinger iV+ technology, used to recycle post-consumer PET into food contact materials. EFS2 2023, 21, e07927. [Google Scholar] [CrossRef]
- Lambré, C.; Barat Baviera, J.M.; Bolognesi, C.; Chesson, A.; Cocconcelli, P.S.; Crebelli, R.; Gott, D.M.; Grob, K.; Mengelers, M.; Mortensen, A.; et al. Safety assessment of the process Renovapet, based on the VACUNITE (EREMA basic and Polymetrix SSP V-leaN) technology, used to recycle post-consumer PET into food contact materials. EFS2 2023, 21, e07920. [Google Scholar] [CrossRef]
- Lambré, C.; Barat Baviera, J.M.; Bolognesi, C.; Chesson, A.; Cocconcelli, P.S.; Crebelli, R.; Gott, D.M.; Grob, K.; Mengelers, M.; Mortensen, A.; et al. Safety assessment of the process Steinbeis PolyVert, based on the Vacunite (EREMA Basic and Polymetrix SSP V-LeaN) technology, used to recycle post-consumer PET into food contact materials. EFS2 2023, 21, e07919. [Google Scholar] [CrossRef]
- Welle, F. Simulation of the decontamination efficiency of PET recycling processes based on solid-state polycondensation. Packag. Technol. Sci. 2014, 27, 141–148. [Google Scholar] [CrossRef]
- Thielen, M.; Gust, P.; Hartwig, K. Streckblasformen. In Blasformen; Carl Hanser Verlag GmbH & Co. KG: Munich, Germany, 2019; pp. 149–214. ISBN 978-3-446-45552-8. [Google Scholar]
- Müller, K. Multilayer films for bag-in-container systems used in disposable kegs: Basic principles of possible barrier concepts. BrewingScience 2013, 66, 31–36. [Google Scholar]
- Robertson, G.L. Food Packaging and Shelf Life: A practical guide; Taylor & Francis: Boca Raton, FL, USA, 2009; ISBN 0429146809. [Google Scholar]
- Cincotta, F.; Verzera, A.; Tripodi, G.; Condurso, C. Non-intentionally added substances in PET bottled mineral water during the shelf-life. Eur. Food Res. Technol. 2018, 244, 433–439. [Google Scholar] [CrossRef]
- Franz, R.; Gmeiner, M.; Gruner, A.; Kemmer, D.; Welle, F. Diffusion behaviour of the acetaldehyde scavenger 2-aminobenzamide in polyethylene terephthalate for beverage bottles. Food Addit. Contam. Part A 2016, 33, 364–372. [Google Scholar] [CrossRef] [PubMed]
- Welle, F.; Franz, R. Diffusion coefficients and activation energies of diffusion of low molecular weight migrants in Poly(ethylene terephthalate) bottles. Polym. Test. 2012, 31, 93–101. [Google Scholar] [CrossRef]
- Schmid, P.; Welle, F. Chemical Migration from Beverage Packaging Materials—A Review. Beverages 2020, 6, 37. [Google Scholar] [CrossRef]
- Eberhartinger, S.; Steiner, I.; Washüttl, J.; Kroyer, G. Untersuchungen zur Migration von Acetaldehyd aus Polyethylenterephthalat-Flaschen für kohlensäurehaltige Erfrischungsgetränke. Z. Lebensm. Unters. Forsch. 1990, 191, 286–289. [Google Scholar] [CrossRef]
- Gehring, C.; Welle, F. Migration of Acetaldehyde Scavengers From PET Bottles. In Reference Module in Food Science; Elsevier: Amsterdam, The Netherlands, 2017; ISBN 978-0-08-100596-5. [Google Scholar]
- Strube, A.; Guth, H.; Buettner, A. Identification of a medicinal off-flavour in mineral water. Water Res. 2009, 43, 5216–5224. [Google Scholar] [CrossRef] [PubMed]
- Strube, A.; Buettner, A.; Groetzinger, C. Characterization and identification of a plastic-like off-odor in mineral water. Water Supply 2009, 9, 299–309. [Google Scholar] [CrossRef]
- Strube, A.; Buettner, A.; Czerny, M. Influence of chemical structure on absolute odour thresholds and odour characteristics of ortho- and para-halogenated phenols and cresols. Flavour Fragr. J. 2012, 27, 304–312. [Google Scholar] [CrossRef]
- Reimann, C.; Birke, M.; Filzmoser, P. Bottled drinking water: Water contamination from bottle materials (glass, hard PET, soft PET), the influence of colour and acidification. Appl. Geochem. 2010, 25, 1030–1046. [Google Scholar] [CrossRef]
- Soares, J.; Ramos, P.; Poças, F. Is lightweighting glass bottles for wine an option? Linking technical requirements and consumer attitude. Packag. Technol. Sci. 2022, 35, 833–843. [Google Scholar] [CrossRef]
- Der Große Wasser-Check: Wasser Kosten, Reinheit, Umweltschutz–Unser Vergleich von Mineral- und Leitungswasser Spricht Eher Für Das Nass aus Dem Hahn. Die wichtigsten Fakten Rund Um Unser Lebenselixier. Stiftung Warentest, July 2019, 12–25. Available online: https://www.test.de/shop/test-hefte/test_07_2019/ (accessed on 28 January 2024).
- Der Große Wassercheck: Am Hahn zapfen statt Leitungs-Und Mineralwasser Flaschen Schleppen: Die Qualität Unseres Leitungswassers Stimmt, Mineralwasser ist Überbewertet. Die Fakten. Stiftung Warentest, August 2016, 20–27. Available online: https://www.test.de/presse/filmmaterial-5041724-0/video-352470460/ (accessed on 28 January 2024).


Disclaimer/Publisher’s Note: The statements, opinions and data contained in all publications are solely those of the individual author(s) and contributor(s) and not of MDPI and/or the editor(s). MDPI and/or the editor(s) disclaim responsibility for any injury to people or property resulting from any ideas, methods, instructions or products referred to in the content. |
© 2024 by the authors. Licensee MDPI, Basel, Switzerland. This article is an open access article distributed under the terms and conditions of the Creative Commons Attribution (CC BY) license (https://creativecommons.org/licenses/by/4.0/).
Share and Cite
Gress, A.; Müller, K.; Sängerlaub, S. Packaging Material Use Efficiency of Commercial PET and Glass Bottles for Mineral Water. Beverages 2024, 10, 25. https://doi.org/10.3390/beverages10020025
Gress A, Müller K, Sängerlaub S. Packaging Material Use Efficiency of Commercial PET and Glass Bottles for Mineral Water. Beverages. 2024; 10(2):25. https://doi.org/10.3390/beverages10020025
Chicago/Turabian StyleGress, Anna, Kajetan Müller, and Sven Sängerlaub. 2024. "Packaging Material Use Efficiency of Commercial PET and Glass Bottles for Mineral Water" Beverages 10, no. 2: 25. https://doi.org/10.3390/beverages10020025
APA StyleGress, A., Müller, K., & Sängerlaub, S. (2024). Packaging Material Use Efficiency of Commercial PET and Glass Bottles for Mineral Water. Beverages, 10(2), 25. https://doi.org/10.3390/beverages10020025