Abstract
(1) Background: Sugar-sweetened beverages (SSBs) are a major source of added sugars and have been linked to adverse health outcomes, including obesity and metabolic disorders. The global rise in adolescents who are overweight and obese presents critical public health challenges. Although there is a growing focus on SSB consumption globally, data on sugar and SSB intake in Iraq, particularly in the Kurdistan region, remain scarce. This study aims to assess SSB consumption and its association with body mass index (BMI) and waist circumference among adolescents in Erbil, Iraq, contributing to efforts to address obesity in this population. (2) Methods: This cross-sectional study included 379 intermediate school students aged 11 to 16 years from Erbil, Iraq. Data were collected using a validated questionnaire to gather information on sociodemographic characteristics, physical activity levels, sedentary behaviors, and sleep duration. Weight and height were measured, and age- and sex-adjusted BMI z-scores were calculated. Waist circumference was measured twice, with the average value recorded. Dietary data were obtained using two non-consecutive 24 h recalls (one on a school day and one on a weekend day), and the average daily SSB consumption was calculated. Multiple regression modeling was used to evaluate the associations between SSB consumption, BMI, and waist circumference, adjusting for potential confounders. Data analysis was conducted using SPSS version 26, with statistical significance set at 5%. (3) Results: The mean daily intake of SSBs was 686.71 ± 197.50 milliliters (mL), with males consuming significantly more (719.8 ± 185.9) than females (658.0 ± 185.3) (p = 0.001). The prevalence of overweight and obesity was 41.7%. Multiple regression analysis showed a significant positive association between BMI and SSB consumption, sedentary behavior, and total caloric intake (p < 0.001), while age was negatively associated with BMI. The consumption of SSBs was strongly associated with BMI, with each additional milliliter of SSB intake associated with a 0.002 unit increase in BMI (t-value = 12.498, p < 0.001). Waist circumference was significantly positively associated with SSB consumption, total caloric intake, and sedentary behavior (p < 0.001), while age (p < 0.001) and moderate-to-vigorous physical activity (MVPA) (p = 0.005) were negatively associated with waist circumference. For each additional milliliter of SSB consumed, waist circumference increased by 0.028 units (t-value = 12.498, p < 0.001). (4) Conclusions: High levels of SSB consumption were observed among adolescents in Erbil, particularly among males. Significant associations were found between SSB intake, overweight/obesity, and waist circumference. These findings highlight the urgent need for targeted public health interventions and further investigation into the factors driving SSB consumption in this population.
1. Introduction
In its 2015 guideline, the WHO defines “free sugars” as monosaccharides and disaccharides added to foods and beverages by the manufacturer, cook, or consumer, and sugars naturally present in honey, syrups, fruit juices, and fruit juice concentrates. The SSBs are those that contain these free sugars [1]. The consumption of SSBs is a significant contributor to excessive sugar intake in the diets of children and adolescents [1] and has been shown to markedly increase the risk of chronic diseases, including cardiometabolic disorders and hypertension [2,3,4]. Moreover, the intake of SSBs has been linked to detrimental outcomes among children and adolescents, such as decreased academic performance and sedentary behaviors [5]. A systematic review and meta-analysis conducted on the consumption of SSBs among children and adolescents across 51 countries revealed that SSB consumption rates remain notably elevated. The findings indicated significant disparities among countries, with China reporting the highest estimated daily consumption at 710.0 mL, whereas Australia exhibited the lowest estimated daily consumption at 115.1 mL. The combined analysis of daily SSB consumption across all 51 nations yielded a pooled synthesis of 326.0 mL [6]. In Duhok, Kurdistan Regional Government (KRG), Iraq, a study on adolescents aged 15–24 years revealed high SSB consumption rates, with a significant number drinking at least four “istican” (locally used 30 cc) of tea daily and consuming four or more cans of soft drinks per week [7]. Another study in Iraq noted a major reduction in free sugar consumption during the United Nations sanctions period, decreasing from 50 kg to 16.3 kg per person per year, with a subsequent rise to 24.1 kg post-sanctions. This fluctuation in sugar intake significantly impacted the prevalence of type 2 diabetes mellitus (T2DM), overweight/obesity, and dental caries, with caries incidence decreasing during the sanctions and increasing afterward [8]. Despite the well-documented adverse health effects of consuming SSBs, their sales are on the rise worldwide, largely due to aggressive marketing tactics that specifically target the younger generation [9,10]. In high-income countries, individuals with lower socioeconomic status (SES) often have the highest intake of SSBs [11], whereas in low- and middle-income countries, individuals with higher SES frequently have the highest intakes [12]. Although health-related behaviors, including consuming sugar-filled drinks, are ultimately determined by an individual’s choices, socio-ecological theories propose that these choices are formed and impacted by social and physical environments [13]. It is now generally accepted that a complex web of interacting individual, societal, and environmental factors underlies the multifactorial mechanisms behind the observed disparities in SSB intake [14].
Overweight and obesity among children and adolescents have become serious global public health concerns. Between 1975 and 2016, the prevalence of obesity among children and adolescents aged 5 to 19 years increased from 0.7% to 5.6% for girls and from 0.9% to 7.8% for boys [15]. According to the World Obesity Federation, by 2030, more than one million children in 42 nations will be obese, with China projected to have the highest number, followed by India, the United States, Indonesia, and Brazil [16]. Regionally, studies from Basra reported overweight and obesity prevalence rates of 20.6% and 22.6%, respectively, resulting in a combined rate of 43.2% among adolescents aged 13–15 years [17]. Studies in Erbil reported combined rates of 30% among students aged 16 to 18 years [18] and 30.4% among children aged 5 to 18 years [19]. Additionally, it has been demonstrated that waist circumference is associated with a higher risk of T2DM, hypertension, cardiovascular diseases (CVD), and mortality, even in individuals with a normal BMI, indicating the presence of normal-weight abdominal obesity [20]. A recent systematic review of sugar reduction initiatives in the Eastern Mediterranean Region (EMR), while there is a scarcity of information, indicates that the use of added sugar and free sugar remains elevated in nations within the area, particularly among children and adolescents [21].
Given the scarcity of information on dietary behaviors in Kurdistan and Iraq, particularly regarding SSB consumption and its contribution to obesity, this study was designed to assess the frequency and amount of SSB intake and its association with BMI and waist circumference among adolescents in Erbil, Kurdistan Region, Iraq. With significant shifts in dietary patterns and limited regional research, understanding SSB consumption and its health implications is crucial for informing preventive strategies aimed at mitigating chronic health risks associated with poor dietary habits. This study evaluated SSB consumption (in milliliters) and overall dietary and caloric intake using a validated, interviewer-administered 24 h recall method, providing comprehensive insights into the potential impact of SSBs on adolescent health outcomes.
2. Materials and Methods
2.1. Research Design and Subjects
This cross-sectional study was conducted in Erbil city, KRG, Iraq, from May 2022 to April 2023. The target population consisted of students aged 11 to 16 years attending intermediate public schools. Both male and female students were included, while those with systemic diseases or on medications were excluded based on self-reported information.
The sample size was calculated based on an expected prevalence of 50% for the conditions under study within a population of 27,545 students [22]. Using a design effect of 2, Epi-Info software (version 7, Atlanta, GA: Centers for Disease Control and Prevention) estimated a sample size of 758, which was then adjusted to 379 after accounting for the design effect. Schools were selected using a probability proportional to size sampling method, whereby zones with a higher number of schools contributed proportionately more to the sample. Among the 62 eligible schools, 14 were randomly selected for inclusion in the study. Within each selected school, 27–30 students were chosen through a simple random sampling method.
Written informed consent was obtained from both parents and students in accordance with the Helsinki Declaration prior to the commencement of data collection. The study received approval from the Research Ethics Committee at Hawler Medical University, College of Dentistry (Erbil, Kurdistan regional Government (KRG), Iraq), on 13 July 2021 (Meeting 4, Paper Code 10).
2.2. Sociodemographic Characteristics
Data were collected on participants’ age, gender, grade level, physical activity, sedentary behaviors, smoking status, sleep duration, parental education, parental occupation, and economic status. The majority of the questions in the questionnaire were adapted from the validated Health-Related Behavior in School-Aged Children (HBSC) survey protocol [23].
2.3. Dietary Assessment
Dietary data were collected using two non-consecutive 24 h recalls, including one weekday and one weekend day, conducted through face-to-face interviews. We conducted face-to-face interviews following a structured training period under the supervision of local nutritionists. The training included supervised practice sessions to ensure methodological consistency and accuracy in data collection. Additionally, we participated in multiple online meetings with representatives from the Myfood24 software provider to gain a comprehensive understanding of the software’s functionality and data management features. The 24 h dietary recall was validated against a food frequency questionnaire (FFQ) developed in Saudi Arabia [24]. The use of the multiple-pass method further enhanced the validity and reliability of the dietary recall process [25,26].
Portion size estimation posed a substantial challenge in this community due to the lack of a region-specific food atlas for the Kurdistan Region of Iraq. While local efforts by nutritionists provided some guidance for measuring traditional foods, the study utilized the Photographic Atlas of Food Portion Sizes for the Emirate of Abu Dhabi to estimate portion sizes [27]. Dietary data were entered by the researchers into Myfood24, an online dietary assessment tool developed by the University of Leeds in the United Kingdom [28]. Myfood24 database includes Middle Eastern food items and recipes. For recipes not available in the database, the researchers collaborated with three nutritionists to create and add standardized recipes using the platform’s recipe builder feature. This approach facilitated accurate tracking and analysis of dietary intake, particularly for unique or traditional dishes. Additionally, commonly used glasses and cups were coded to assist students in estimating portion sizes when the provided photographs did not match their usual serving sizes. Participants were also encouraged to send photographs of the food and beverages they consumed at home, including pre-packaged foods, desserts, and drinks, to enhance the accuracy of portion size estimation.
To standardize the measurement of consumption frequency, a serving size of 250 mL per day was adopted. Beverage consumption frequencies were categorized into four groups: <2 servings per day, 2–2.9 servings per day, 3–3.9 servings per day, and ≥4 servings per day. Data were collected for all types of SSBs, including sugar-sweetened tea and coffee, milk and dairy products, fruit juices, carbonated soft drinks, and caffeinated energy drinks. These beverages were classified into five categories: the first category, “Hot Beverages”, included tea, coffee, and Nescafe; the second, “Carbonated Drinks”, comprised soft drinks; the third was “Fruit Juices”; the fourth, “Energy Drinks”, included caffeinated beverages; and the fifth, “Milk and Dairy Products”, encompassed sweetened whole milk, chocolate milk, and milkshakes. Regular soda refers to carbonated beverages sweetened with added sugars. Fruit drinks include fruit-based beverages with added sugars but not 100% pure fruit juice. Energy drinks are artificially formulated beverages that contain high levels of stimulant ingredients, typically caffeine, along with added sugars [29]. The SSBs did not include 100% milk with no added sugar, diet soft drinks, or artificially sweetened drinks.
2.4. Anthropometric Measures
The subjects’ weight and height were determined using standardized procedures. Weight was measured in light clothing without shoes, using a digital scale, and recorded to the nearest 0.1 kg. Height was measured to the nearest 0.1 cm using a fixed stadiometer while participants stood without footwear. Waist circumference measured using Seca measuring tape 2 cm above the navel [30]. The body mass index for the age and sex of the participants was calculated using the WHO Anthro Plus Version 1.0.4, developed by the WHO in Geneva, Switzerland. Participants were categorized into four groups: persons who were underweight, normal weight, overweight, or obese, based on the WHO (2007) reference values for BMI for age z-scores (5–19 years) for boys and girls [31].
2.5. Physical Activity and Sedentary Behavior
The assessment of physical activity, defined as (Moderate to Vigorous Physical Activity) (MVPA), was conducted by asking the participants: “During the past 30 days, how many days were you engaged in physical activity for a duration of 60 min per day?”. Responses were categorized as follows: physically inactive (0–2 days per week), moderately active (3–4 days per week), and highly active (5 or more days per week) [32].
The threshold for screen-time activities, including gaming, social media, online videos, TV, or DVDs, was set at 2 h per day [33].
2.6. Sleep Duration
Sleep duration during school days and weekends was determined based on participants’ reported bedtimes and wake-up times. According to the American Academy of Sleep Medicine (AASM), children aged 6–12 years require 9–12 h of sleep per day, while teenagers aged 13–18 years should aim for 8–10 h per day to promote overall well-being [34].
2.7. Smoking Habits
Participants were asked to report the number of days they had smoked in the past 30 days. Individuals who reported smoking at least once during this period were categorized as smokers, consistent with the methodology used in previous studies [35].
2.8. Socioeconomic Status (SES)
The Family Affluence Scale (FAS) III comprises six items designed to assess a family’s material wealth: the number of cars, the number of bathrooms, the number of computers, whether the child has their own bedroom, whether the family has a dishwasher, and the number of vacations taken abroad in the past 12 months. Responses to the six items were aggregated to produce a total score ranging from 0 to 13. The following thresholds were used to categorize family affluence: 0–7 (low), 8–11 (mid), and 12–13 (high) [36]. Parental education was classified as follows: illiterate/can read and write, primary, secondary, institute, college, and above. Parental occupation was classified into five categories: high-rank, non-manual workers, skilled manual workers, unskilled and unemployed, and retired or housewives. The FAS was used as a measure of wealth and combined with parental education and parental occupation to calculate the SES of participants.
3. Statistical Analysis
Data analysis was conducted using SPSS Version 26.0. Descriptive statistics were applied to summarize categorical variables (frequencies and percentages) and continuous variables (means and standard deviations). Associations between SSB intake and sociodemographic variables were tested using ANOVA and unpaired t-tests. The chi-square test and Fisher’s exact test were used to examine relationships between sociodemographic factors and BMI groups, while Mann–Whitney U and Kruskal–Wallis tests were employed for group comparisons.
Multiple regression modeling was conducted to control for factors influencing BMI and waist circumference. Independent variables included sex, age, MVPA, sedentary behavior, total caloric intake (including SSB kilocalories), and SSB consumption (in milliliters). Statistical significance was set at p < 0.05.
4. Results
The participants had a mean age of 13.3 years (SD = 1.2), with a median age of 13 years old and an age range of 11–16 years. The majority (42.7%) were in the 13–14 years age group, and 54.1% were female. Nearly half of the students (44.6%) were classified in the medium SES category (Table 1).

Table 1.
Demographic and socioeconomic characteristics of study participants.
Regarding the association between daily SSB consumption and sociodemographic variables, no statistically significant variation was observed in daily SSB intake across age groups (p = 0.458). However, males consumed significantly more SSBs daily (mean = 719.8 mL, SD = 185.9) compared to females (mean = 658.0 mL, SD = 185.3) (p = 0.001). Additionally, no significant association was found between SSB intake and SES (p = 0.650), as presented in Table 2.
Table 2.
Mean daily sugar-sweetened beverage intake by age, gender, and socioeconomic status.
In terms of moderate to vigorous physical activity (MVPA), the majority of participants (39.6%) reported no physical activity during the previous week. Additionally, 16.4% and 15.8% of participants were physically active for three and two days per week, respectively. Only 3.7% of participants achieved the WHO-recommended level of physical activity, engaging in at least 60 min per day for all seven days of the week [37] (Table 3).
Table 3.
Frequency of physical activity among participants.
In examining the sedentary behaviors of the participants, it was observed that 12% of students reported watching television for more than two hours on weekdays, increasing to 20% during weekends. Gaming activities were reported by 18% of students on weekdays and 24% on weekends. The most common sedentary behavior was social media use, with 22% of students engaging for more than two hours on weekdays and 26% on weekends (Table 4).
Table 4.
Sedentary behavior patterns among participants.
Table 5 illustrates the consumption patterns of SSBs among students. Hot drinks were the most commonly consumed category, with 82.0% of students reporting intake. This was followed by carbonated drinks (67.5%), fruit juice (50.0%), and energy drinks (29.4%). Milk and dairy products had the lowest consumption rate, with 17.2% of students reporting intake.
Table 5.
Consumption pattern of SSBs among students.
Figure 1 displays the distribution of students’ daily SSB consumption by the number of glasses consumed per day. The majority of students (47.5%) reported consuming 2 to 2.9 glasses per day, followed by 32.2% who consumed 3 to 3.9 glasses daily. A smaller proportion (15.6%) consumed fewer than two glasses per day, while only 4.7% reported drinking four or more glasses daily.
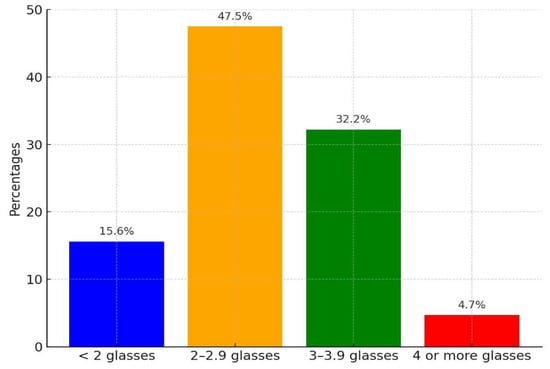
Figure 1.
Frequency of SSB consumption (glasses per day). One glass = one serving = 250 mL.
Figure 2 presents the distribution of students based on weight categories. The majority (58.3%) of students were persons with normal weight or who were underweight, while 41.7% were persons who were overweight or obese.
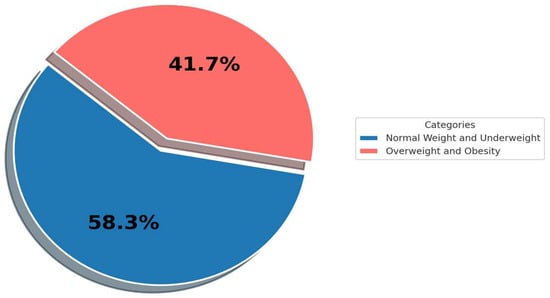
Figure 2.
Prevalence of overweight and obesity.
Table 6 highlights the associations between overweight/obesity and various demographic, lifestyle, and socioeconomic variables among participants. A significant trend was observed, with the prevalence of overweight and obesity decreasing with age. Specifically, 51.6% of students aged 11–12 years were classified as overweight or obese, compared to 27.5% of those aged 15–16 years (p = 0.002). The prevalence was also significantly higher among males (54.5%) compared to females (30.5%) (p < 0.001).
Table 6.
Associations between overweight/obesity and demographic, lifestyle, and socioeconomic variables.
Sedentary students exhibited a significantly higher prevalence of overweight and obesity (48.8%) compared to their physically active counterparts (32.1%) (p = 0.001). Similarly, students engaging in low physical activity (0–2 days/week) had the highest prevalence of overweight and obesity (54.3%), while those with high activity levels (≥5 days/week) had the lowest prevalence (15.9%) (p < 0.001).
In contrast, no significant associations were observed between overweight/obesity and smoking (p = 0.721), SES (p = 0.396), or FAS (p = 0.458).
Table 7 presents the results of the multiple regression model examining the factors associated with BMI among adolescents. The analysis revealed that BMI was positively correlated with SSB consumption (p < 0.001), sedentary behaviors (p = 0.002), and total caloric intake (p < 0.001) (with detailed data on total caloric intake provided in the Supplementary Materials). In contrast, BMI was negatively associated with age (p < 0.001). No significant association was observed between BMI and physical activity levels (P = 0.473) or sex (p = 0.998).
Table 7.
Multivariate regression analysis of the association between sugar-sweetened beverage consumption and BMI in adolescents.
Table 8 illustrates the results of the multivariate regression analysis examining factors associated with waist circumference among adolescents. The analysis revealed significant positive associations between waist circumference and SSB consumption (p < 0.001), total caloric intake (p < 0.001), and sedentary behavior (p = 0.001). Conversely, waist circumference was negatively associated with age (p < 0.001) and MVPA (p = 0.005).
Table 8.
Multivariate regression analysis of factors associated with waist circumference among adolescents.
No significant associations were observed between waist circumference and sleep duration (p = 0.243) or sex (p = 0.304).
5. Discussion
This research focused on the consumption of SSBs and their association with anthropometric measures among adolescents in Erbil, KRG, Iraq. Recognizing the scarcity of research in the Kurdistan region examining the prevalence of SSB intake and its association with health outcomes, this study aimed to address this gap. The findings revealed that daily SSB consumption among the study population was relatively high, with males consuming significantly more SSBs per day than females.
Furthermore, a significant association was observed between SSB intake and both BMI z-scores and waist circumference, even after adjusting for potential confounders. These results underscore the impact of high SSB consumption on adolescent health and highlight the need for targeted public health interventions to address this growing concern.
The average daily consumption of SSBs was 686.71 ± 197.50–1232.50 mL/day, which is equivalent to 2.7469 cups per day, with tea and coffee being the most commonly consumed, followed by soft drinks, while milk and dairy products being the least consumed SSBs. Male students significantly consumed more SSBs, 719.8 mL/ day, than females, 658.0 mL/day (p < 0.001). A study in Duhok, KRG, Iraq, among adolescents (15–24 years old) found that 24.8% consume at least four isticans (locally used 30 cc) of tea daily, and 70.8% consumed more than four soft drink cans weekly; the study showed no gender difference regarding dietary habits [7]. An Iranian study showed that 42% of participants consumed tea daily, 25.6% consumed sweetened soft drinks, and 23.3% consumed milk [38]. The nations in the Eastern Mediterranean Region (EMR) with the greatest average consumption of SSBs are Djibouti, with a mean consumption of 0.78 servings per day, then Lebanon with 0.72 servings, Jordan with 0.64 servings, Sudan with 0.62 servings, Syria with 0.52 servings, and Bahrain with 0.51 servings. The Kingdom of Saudi Arabia (KSA) has the highest documented juice intake in the EMR at 0.34 servings per day. Iran follows with 0.31 servings, then the United Arab Emirates (UAE) with 0.25 servings, and Bahrain with 0.24 servings [39].
There was no study in this region to specifically evaluate factors related to SSB consumption. Adolescents in Kurdistan frequently consume takeaway food, and the vast majority of these meals are accompanied by SSBs. However, a study from Iraq showed that 41.4% consumed soft drinks, 8.15% consumed artificial fruit juice, and 16% consumed milk and dairy products each day [40]. The study indicated that 37.4% of participants sometimes consume fast food at home, whereas 38.1% rarely consume fast food from external sources. There was a strong correlation between consuming snacks and fast meals at home and an individual’s BMI. However, there was no substantial correlation between consuming fast foods outside of the home and an individual’s BMI [40]. The economy’s rapid growth has led to an increase in electronic devices, particularly cell phones, being used for online fast-food orders. This consumption is linked to higher energy, fat, carbohydrates, added sugars, and SSBs, posing public health concerns and weight gain due to high-energy, high-fat/sugar foods [41,42]. Among the fourteen schools surveyed, only one implemented restriction on the sale of carbonated and energy drinks. However, the sale of tea, coffee, artificial fruit juices, and milkshakes was permitted in the school canteen.
The prevalence of overweight and obesity in this study was 41.7%, similar to previous studies in Iraq, where 43.2% and 46.32% were overweight and obese respectively [17,18]. In another study in Erbil, Iraq, the prevalence of overweight and obesity among older students aged 16–18 years was reported to be 30% [19]. Internationally, the pooled prevalence of obesity among children aged 5–11 years was 5.8% overall, with rates of 7.0% in boys and 4.8% in girls. In adolescents aged 12–19 years, obesity prevalence was 8.6% overall, with 10.1% in boys and 6.2% in girls. For overweight status, children had an overall prevalence of 11.2%, with 11.7% in boys and 10.9% in girls. Among adolescents, the overall overweight prevalence was 14.6%, with boys at 15.9% and girls at 13.7%. Sensitivity analyses confirmed the robustness of these findings, consistently showing higher prevalence rates for both obesity and overweight in boys compared to girls across both age groups (children: obesity 7.0% vs. 4.8%, overweight 11.7% vs. 10.9%; adolescents: obesity 10.1% vs. 6.2%, overweight 15.9% vs. 13.7%; p < 0.001 for all comparisons) [43]. The WHO has indicated that being overweight and obese during childhood may result from lifestyle changes, such as consuming energy-dense diets rich in fats and carbohydrates but lacking in vitamins and minerals, combined with reduced physical activity due to more sedentary habit [44].
In this study, SSB consumption was higher among overweight and obese adolescents, aligning with findings from recent systematic reviews and meta-analyses. A revised systematic review and meta-analysis provided consistent evidence that SSB consumption contributes to weight gain in both children and adults [45]. These results align with prior reviews that have demonstrated a positive association between SSB intake and weight increase across these age groups. Additionally, a systematic review and meta-analysis indicated that SSB consumption is linked to a higher risk of type 2 diabetes, obesity, coronary heart disease, and stroke in adults [46].
Conversely, a study on Saudi Arabian adolescents found that a lower frequency of sugary drink consumption was associated with a higher likelihood of being overweight and obese [47]. Similarly, research found no significant association between BMI and SSB consumption [48]. Additionally, a study on Mexican adolescents revealed that increased SSB intake was correlated with changes in body fat percentage and waist circumference but did not significantly affect BMI [49].
The Finnish Health in Teens Cohort study provided further insights, showing that high sugary product consumption was associated with increased thinness, while lower consumption correlated with higher obesity levels. This suggests that overweight children may exhibit restricted, regulated, or inaccurately reported sugary intake patterns [50].
Adding complexity, a WHO-commissioned systematic review and meta-analysis found that although SSB intake was associated with higher body fat percentage, there was limited evidence of a direct effect on BMI or BMI z-scores, especially in younger children. This highlights that SSB consumption’s impact on obesity-related metrics may vary according to specific population characteristics [51].
Further, a systematic review suggested that SSB consumption could increase waist circumference by 14%, though the finding lacked statistical significance due to study variability [52]. However, the general trend supports an association between higher SSB intake and increased abdominal obesity, potentially attributable to the role of SSBs in raising overall calorie intake and promoting high-glycemic index foods. This, in turn, may lead to elevated insulin secretion and fat accumulation, particularly in the abdominal area [53,54].
The study demonstrated several strengths: Firstly, it adopted a comprehensive approach to assessing SSB consumption and habitual food intake among adolescents. Utilizing 24 h recall data allowed for the capture of all food consumed by individuals, enabling adjustments for total caloric intake, including SSB calories, and enhancing result accuracy. Moreover, employing multiple-pass techniques ensured the validity of the 24-h recall data [25,26]. The exposure assessment spans two days, covering both weekdays and weekends, providing a holistic view of the consumption frequencies of SSBs. A strength of using Myfood 24 in this study was that the software includes Middle Eastern food items and recipes, which facilitated the creation of culturally relevant recipes for local foods like dolma, enhancing the accuracy of our dietary assessment. Objective assessments of BMI and waist circumference were utilized, mitigating potential biases associated with self-reported anthropometrics. Lastly, the study addresses a wide range of confounding variables, although residual confounding effects cannot be entirely eliminated. Nevertheless, the study was subject to several limitations: diet was self-reported, a common method in nutrition research, which introduces measurement error and response bias. Underreporting and overreporting of dietary intake are potential issues, especially concerning foods perceived as unhealthy or involving obese participants [55]. Conversely, an issue of overreporting that could arise pertains to individuals who are underweight [55]. This study did not assess the stages of sexual development or puberty among adolescents; however, evaluating sexual maturity was recommended for assessing obesity in teenagers [56]. Additionally, as a cross-sectional study, it could not establish causation, nor could it evaluate changes in beverage consumption over time. The lack of data on seasonal variations further limited the ability to assess potential seasonal patterns in SSB consumption [57]. Another limitation of this study was the challenges in portion size estimation, particularly in the absence of a comprehensive region-specific food atlas. To address this, the Abu Dhabi Food Atlas was utilized, along with portion size references developed by local nutritionists tailored specifically for Kurdish cuisine and the MyFood24 recipe formation aid. These efforts improved accuracy, but some variability in portion size reporting may have persisted. Additionally, MyFood24 was not used directly by participants due to limitations such as internet accessibility, language barriers, and cognitive capacities. Instead, data were collected by interviewers and entered manually, which may have introduced additional variability.
6. Conclusions
This study revealed high levels of SSB consumption among adolescents in Erbil, with a mean daily intake of (686.71 ± 197.50 mL). Male participants consumed significantly more SSBs (719.8 ± 185.9 mL) compared to females (658.0 ± 185.3 mL) (p = 0.001). Additionally, 41.7% of the participants were classified as overweight or obese. SSB consumption, along with sedentary behavior and total caloric intake, was significantly associated with increased BMI and waist circumference (p < 0.001). These findings underscore the role of SSBs in adolescent obesity and emphasize the need for targeted public health interventions to reduce SSB consumption and encourage health-promoting behaviors within this population.
To help prevent obesity and related health issues, it is essential to limit SSB intake and raise awareness of their contribution to early metabolic and cardiovascular problems. Additionally, to create effective strategies for reducing SSB consumption, it is necessary to identify and address the key factors influencing SSB intake. Therefore, we recommend further studies to explore the determinants of SSB consumption among adolescents in the KRG/Iraq.
Supplementary Materials
The following supporting information can be downloaded at: https://www.mdpi.com/article/10.3390/beverages11010015/s1, Table S1: Total Kcal.
Author Contributions
Conceptualization, H.I.H. and S.M.O.; Data curation, H.I.H.; Formal analysis, S.M.O.; Investigation, H.I.H.; Methodology, H.I.H. and S.M.O.; Resources, H.I.H.; Supervision, S.M.O.; Writing—original draft, H.I.H.; Writing—review and editing, H.I.H. and S.M.O. All authors have read and agreed to the published version of the manuscript.
Funding
This research received no specific grant from any funding agency in the public, commercial, or not-for-profit sectors.
Institutional Review Board Statement
The study was conducted according to the guidelines of the Declaration of Helsinki and approved by the Ethics Committee of the College of Dentistry, Hawler Medical University (protocol code meeting 4, paper 10, approved on 13 July 2021).
Informed Consent Statement
Informed consent for participation was obtained from all subjects involved in the study.
Data Availability Statement
The data supporting this study are contained within the article. Additionally, the total kilo-caloric intake of the participants is provided in the Supplementary Materials.
Acknowledgments
The authors express their gratitude to all individuals and institutions whose assistance contributed to this research project. Before conducting the research and collecting data, all institutions and individuals were informed that acknowledgments would be made without mentioning any specific names or identifiers. Their consent was obtained for this purpose. During the preparation of this manuscript, we used the ChatGPT AI tool (Version 3.0) for language assistance. The authors have carefully reviewed and edited the output to ensure its accuracy and appropriateness and take full responsibility for the content of this publication.
Conflicts of Interest
The authors declare no conflict of interest.
References
- WHO. Guideline: Sugars Intake for Adults and Children—Fluoride Action Network. Available online: https://fluoridealert.org/news/who-guideline-sugars-intake-for-adults-and-children/ (accessed on 25 April 2024).
- Reilly, J.J.; Methven, E.; McDowell, Z.C.; Hacking, B.; Alexander, D.; Stewart, L.; Kelnar, C.J.H. Health Consequences of Obesity. Arch. Dis. Child. 2003, 88, 748–752. [Google Scholar] [CrossRef] [PubMed]
- Te Morenga, L.; Mallard, S.; Mann, J. Dietary Sugars and Body Weight: Systematic Review and Meta-Analyses of Randomised Controlled Trials and Cohort Studies. BMJ 2012, 346, e7492. [Google Scholar] [CrossRef] [PubMed]
- Malik, V.S.; Pan, A.; Willett, W.C.; Hu, F.B. Sugar-Sweetened Beverages and Weight Gain in Children and Adults: A Systematic Review and Meta-Analysis. Am. J. Clin. Nutr. 2013, 98, 1084–1102. [Google Scholar] [CrossRef] [PubMed]
- Park, S.; Sherry, B.; Foti, K.; Blanck, H.M. Self-Reported Academic Grades and Other Correlates of Sugar-Sweetened Soda Intake among US Adolescents. J. Acad. Nutr. Diet. 2012, 112, 125–131. [Google Scholar] [CrossRef]
- Ooi, J.Y.; Wolfenden, L.; Sutherland, R.; Nathan, N.; Oldmeadow, C.; Mclaughlin, M.; Barnes, C.; Hall, A.; Vanderlee, L.; Yoong, S.L. A Systematic Review of the Recent Consumption Levels of Sugar-Sweetened Beverages in Children and Adolescents From the World Health Organization Regions With High Dietary–Related Burden of Disease. Asia Pac. J. Public Health 2022, 34, 11–24. [Google Scholar] [CrossRef]
- Agha, S.Y.; Rasheed, B.A. Dietary habits and physical activity among youth in Duhok, Iraq. Duhok Med. J. 2021, 15, 29–38. [Google Scholar] [CrossRef]
- Joury, E.; Al-Kaabi, R.; Tappuni, A.R. Constructing Public Health Policies in Post Crisis Countries: Lessons to Learn from the Associations between Free-Sugars Consumption and Diabetes, Obesity and Dental Caries before, during and after Sanctions in Iraq. J. Public Health 2016, 24, 563–569. [Google Scholar] [CrossRef]
- Taylor, F.C.; Satija, A.; Khurana, S.; Singh, G.; Ebrahim, S. Pepsi and Coca Cola in Delhi, India: Availability, Price and Sales. Public Health Nutr. 2011, 14, 653–660. [Google Scholar] [CrossRef]
- Kleiman, S.; Ng, S.W.; Popkin, B. Drinking to Our Health: Can Beverage Companies Cut Calories While Maintaining Profits? Obes. Rev. Off. J. Int. Assoc. Study Obes. 2012, 13, 258–274. [Google Scholar] [CrossRef]
- Pabayo, R.; Spence, J.C.; Cutumisu, N.; Casey, L.; Storey, K. Sociodemographic, Behavioural and Environmental Correlates of Sweetened Beverage Consumption among Pre-School Children. Public Health Nutr. 2012, 15, 1338–1346. [Google Scholar] [CrossRef]
- Ratnayake, N.; Ekanayake, L. Soft Drink Consumption in Sri Lankan Adolescents. Public Health Nutr. 2012, 15, 1333–1337. [Google Scholar] [CrossRef]
- Story, M.; Neumark-Sztainer, D.; French, S. Individual and Environmental Influences on Adolescent Eating Behaviors. J. Am. Diet. Assoc. 2002, 102 (Suppl. S3), S40–S51. [Google Scholar] [CrossRef] [PubMed]
- Watts, A.W.; Miller, J.; Larson, N.I.; Eisenberg, M.E.; Story, M.T.; Neumark-Sztainer, D. Multicontextual Correlates of Adolescent Sugar-Sweetened Beverage Intake. Eat. Behav. 2018, 30, 42–48. [Google Scholar] [CrossRef] [PubMed]
- NCD Risk Factor Collaboration (NCD-RisC). Worldwide Trends in Body-Mass Index, Underweight, Overweight, and Obesity from 1975 to 2016: A Pooled Analysis of 2416 Population-Based Measurement Studies in 128·9 Million Children, Adolescents, and Adults. Lancet Lond. Engl. 2017, 390, 2627–2642. [Google Scholar] [CrossRef] [PubMed]
- Lobstein, T. Obesity prevention and the Global Syndemic: Challenges and opportunities for the World Obesity Federation. Obes. Rev. 2019, 20, 6–9. [Google Scholar] [CrossRef]
- Shwaish, Z.; Alatbee, M.; Al-Kawaz, W.H.; Al-Kawaz, N.H. Prevalence of Overweight and Obesity Among Students of Intermediate Schools in Basra: Prevalence of Overweight and Obesity Among Students of Intermediate Schools in Basra. Iraqi Natl. J. Med. 2023, 5, 58–65. [Google Scholar] [CrossRef]
- Ibrahim, S.; Al-Hadithi, T.; Ismail, K. Overweight and Obesity Associated Factors among High School Students: A Cross Sectional Study in Erbil. Medico-Leg. Update 2022, 20, 1296–1301. [Google Scholar]
- Mohammed, S.S.; Shabu, S.A.S. Prevalence and Associated Risk Factors of Childhood Obesity and Overweight in Erbil City, Kurdistan, Iraq: A Household Survey. Kurd. J. Appl. Res. 2024, 9, 1–13. [Google Scholar] [CrossRef]
- Guerra Valencia, J.; Saavedra-Garcia, L.; Vera-Ponce, V.J.; Espinoza-Rojas, R.; Barengo, N.C. Factors Associated with Normal-Weight Abdominal Obesity Phenotype in a Representative Sample of the Peruvian Population: A 4-Year Pooled Cross-Sectional Study. J. Clin. Med. 2023, 12, 3482. [Google Scholar] [CrossRef]
- Al-Jawaldeh, A.; Taktouk, M.; Naalbandian, S.; Aguenaou, H.; Al Hamad, N.; Almamary, S.; Al-Tamimi, H.A.; Alyafei, S.A.; Barham, R.; Hoteit, M.; et al. Sugar Reduction Initiatives in the Eastern Mediterranean Region: A Systematic Review. Nutrients 2023, 15, 55. [Google Scholar] [CrossRef]
- Ministry of Education, Kurdistan Regional Government. Personal Communication. Available online: https://gov.krd/moe-en/contact/ (accessed on 25 December 2024).
- Moor, I.; Winter, K.; Bilz, L.; Bucksch, J.; Finne, E.; John, N.; Kolip, P.; Paulsen, L.; Ravens-Sieberer, U.; Schlattmann, M.; et al. The 2017/18 Health Behaviour in School-Aged Children (HBSC) Study—Methodology of the World Health Organization’s Child and Adolescent Health Study. J. Health Monit. 2020, 5, 88–102. [Google Scholar] [CrossRef] [PubMed]
- Gosadi, I.M.; Alatar, A.A.; Otayf, M.M.; AlJahani, D.M.; Ghabbani, H.M.; AlRajban, W.A.; Alrsheed, A.M.; Al-Nasser, K.A. Development of a Saudi Food Frequency Questionnaire and Testing Its Reliability and Validity. Saudi Med. J. 2017, 38, 636–641. [Google Scholar] [CrossRef] [PubMed]
- Arsenault, J.E.; Moursi, M.; Olney, D.K.; Becquey, E.; Ganaba, R. Validation of 24-h Dietary Recall for Estimating Nutrient Intakes and Adequacy in Adolescents in Burkina Faso. Matern. Child. Nutr. 2020, 16, e13014. [Google Scholar] [CrossRef] [PubMed]
- Conway, J.M.; Ingwersen, L.A.; Moshfegh, A.J. Accuracy of dietary recall using the USDA five-step multiple-pass method in men: An observational validation study. J. Am. Diet. Assoc. 2004, 104, 595–603. [Google Scholar] [CrossRef]
- Al-Marzooqi, M.; Burke, S.; Ghazali, M.; Duffy, E. The Development of a Food Atlas of Portion Sizes for the United Arab Emirates. J. Food Compos. Anal. 2015, 43, 140–148. [Google Scholar] [CrossRef]
- Carter, M.C.; Albar, S.A.; Morris, M.A.; Mulla, U.Z.; Hancock, N.; Evans, C.E.; Alwan, N.A.; Greenwood, D.C.; Hardie, L.J.; Frost, G.S.; et al. Development of a UK Online 24-h Dietary Assessment Tool: Myfood24. Nutrients 2015, 7, 4016–4032. [Google Scholar] [CrossRef]
- AlTamimi, J.Z.; Alshwaiyat, N.M.; Alkhalidy, H.; AlKehayez, N.M.; Alagal, R.I.; Alsaikan, R.A.; Alsemari, M.A.; BinMowyna, M.N.; AlFaris, N.A. Sugar-sweetened beverages consumption in a multi-ethnic population of young men and association with sociodemographic characteristics and obesity. Int. J. Environ. Res. Public Health 2023, 20, 4861. [Google Scholar] [CrossRef]
- Murphy, M.; Porter, J.; Yusuf, H.; Ntouva, A.; Newton, T.; Kolliakou, A.; Crawley, H.; Tsakos, G.; Pikhart, H.; Watt, R.G. Considerations and Lessons Learned from Designing a Motivational Interviewing Obesity Intervention for Young People Attending Dental Practices: A Study Protocol Paper. Contemp. Clin. Trials 2013, 36, 126–134. [Google Scholar] [CrossRef]
- Halasi, S.; Djordjević, M.; Kiss, F.; Šoronja-Simović, D.; Maravić, N.; Horvat, O.; ŠaranovićŽ, Ž. Aligning nutrition knowledge and dietary habits of generation Z-is there a room for improvement? Food Feed. Res. 2021, 48, 41–55. [Google Scholar] [CrossRef]
- Alsubaie, A.S. Associations between Self-Rated Health, Life Satisfaction and Physical Activity among Adolescents in Saudi Arabia. J. Med. Life 2021, 14, 651–657. [Google Scholar] [CrossRef]
- Kohoutek, J.; Maráček, M.; Ng, K.; Hamrik, Z. Test–Retest Reliability of Selected HBSC Items in Vietnam: Well-Being, Physical and Sedentary Activities, and Eating Behaviours. BMC Med. Res. Methodol. 2022, 22, 135. [Google Scholar] [CrossRef] [PubMed]
- Paruthi, S.; Brooks, L.J.; D’Ambrosio, C.; Hall, W.A.; Kotagal, S.; Lloyd, R.M.; Malow, B.A.; Maski, K.; Nichols, C.; Quan, S.F.; et al. Recommended Amount of Sleep for Pediatric Populations: A Consensus Statement of the American Academy of Sleep Medicine. J. Clin. Sleep Med. 2016, 12, 785–786. [Google Scholar] [CrossRef] [PubMed]
- Corell, M.; Chen, Y.; Friberg, P.; Petzold, M.; Löfstedt, P. Does the Family Affluence Scale Reflect Actual Parental Earned Income, Level of Education and Occupational Status? A Validation Study Using Register Data in Sweden. BMC Public Health 2021, 21, 1995. [Google Scholar] [CrossRef] [PubMed]
- Evans, D.S.; O’Farrell, A.; Sheridan, A.; Kavanagh, P. Social Connectedness and Smoking among Adolescents in Ireland: An Analysis of the Health Behaviour in Schoolchildren Study. Int. J. Environ. Res. Public Health 2023, 20, 5667. [Google Scholar] [CrossRef] [PubMed]
- World Health Organization. WHO Guidelines on Physical Activity and Sedentary Behaviour; WHO Guidelines Approved by the Guidelines Review Committee; World Health Organization: Geneva, Switzerland, 2020. [Google Scholar]
- Hasheminejad, N.; Malek Mohammadi, T.; Mahmoodi, M.R.; Barkam, M.; Shahravan, A. The Association between Beverage Consumption Pattern and Dental Problems in Iranian Adolescents: A Cross-sectional Study. BMC Oral Health 2020, 20, 74. [Google Scholar] [CrossRef]
- Al-Jawaldeh, A.; Abbass, M.M.S. Unhealthy Dietary Habits and Obesity: The Major Risk Factors Beyond Non-Communicable Diseases in the Eastern Mediterranean Region. Front. Nutr. 2022, 9, 817808. [Google Scholar] [CrossRef]
- Saleh, B.B.; Ma, E.G. Impact of Fast Foods and Snacks upon Adolescents’ BMI at Secondary Schools in Baghdad City. Iraqi Natl. J. Nurs. Spec. 2015, 28, 1–7. [Google Scholar] [CrossRef]
- Ren, J.; Luo, X.; Zhao, X.; Yang, W.; Yang, M.; Wang, Y.; Wang, W.; Zou, X.; Yuan, P. Takeaway Food in Chengdu, Sichuan Province, China: Composition and Nutritional Value. Asia Pac. J. Clin. Nutr. 2020, 29, 883–898. [Google Scholar] [CrossRef]
- Okuyama, K.; Li, X.; Abe, T.; Hamano, T.; Franks, P.W.; Nabika, T.; Sundquist, K. Fast Food Outlets, Physical Activity Facilities, and Obesity among Adults: A Nationwide Longitudinal Study from Sweden. Int. J. Obes 2020, 44, 1703–1711. [Google Scholar] [CrossRef]
- Mazidi, M.; Banach, M.; Kengne, A.P. Prevalence of Childhood and Adolescent Overweight and Obesity in Asian Countries: A Systematic Review and Meta-Analysis. Arch. Med. Sci. AMS 2018, 14, 1185–1203. [Google Scholar] [CrossRef]
- WHO. Noncommunicable Diseases: Childhood Overweight and Obesity. Available online: https://www.who.int/news-room/questions-and-answers/item/noncommunicable-diseases-childhood-overweight-and-obesity (accessed on 5 April 2024).
- Nguyen, M.; Jarvis, S.E.; Tinajero, M.G.; Yu, J.; Chiavaroli, L.; Mejia, S.B.; Khan, T.A.; Tobias, D.K.; Willett, W.C.; Hu, F.B.; et al. Sugar-Sweetened Beverage Consumption and Weight Gain in Children and Adults: A Systematic Review and Meta-Analysis of Prospective Cohort Studies and Randomized Controlled Trials. Am. J. Clin. Nutr. 2023, 117, 160–174. [Google Scholar] [CrossRef] [PubMed]
- Luger, M.; Lafontan, M.; Bes-Rastrollo, M.; Winzer, E.; Yumuk, V.; Farpour-Lambert, N. Sugar-Sweetened Beverages and Weight Gain in Children and Adults: A Systematic Review from 2013 to 2015 and a Comparison with Previous Studies. Obes. Facts 2018, 10, 674–693. [Google Scholar] [CrossRef] [PubMed]
- Al-Hazzaa, H.M.; Abahussain, N.A.; Al-Sobayel, H.I.; Qahwaji, D.M.; Musaiger, A.O. Lifestyle Factors Associated with Overweight and Obesity among Saudi Adolescents. BMC Public Health 2012, 12, 354. [Google Scholar] [CrossRef] [PubMed]
- Al-Awwad, N.; Tayyem, R.; Allehdan, S.; Agraib, L.; Al-Mannai, M.; Musaiger, A. Beverages Consumption Is Not Related to Weight Status Among Adolescents Living in the Capital of Jordan. Curr. Nutr. Food Sci. 2019, 15, 165–174. [Google Scholar] [CrossRef]
- English, L.; Carmona, Y.R.; Peterson, K.E.; Jansen, E.C.; Téllez Rojo, M.M.; Torres Olascoaga, L.; Cantoral, A. Changes in Sugar Sweetened Beverage Intake Are Associated with Changes in Body Composition in Mexican Adolescents: Findings from the ELEMENT Cohort. Nutrients 2022, 14, 719. [Google Scholar] [CrossRef]
- Lommi, S.; de Figueiredo, R.A.O.; Tuorila, H.; Viljakainen, H. Frequent Use of Selected Sugary Products Associates with Thinness, but Not Overweight during Preadolescence: A Cross-Sectional Study. Br. J. Nutr. 2020, 124, 631–640. [Google Scholar] [CrossRef]
- Rousham, E.K.; Goudet, S.; Markey, O.; Griffiths, P.; Boxer, B.; Carroll, C.; Petherick, E.S.; Pradeilles, R. Unhealthy Food and Beverage Consumption in Children and Risk of Overweight and Obesity: A Systematic Review and Meta-Analysis. Adv. Nutr. 2022, 13, 1669–1696. [Google Scholar] [CrossRef]
- Ardeshirlarijani, E.; Jalilpiran, Y.; Daneshzad, E.; Larijani, B.; Namazi, N.; Azadbakht, L. Association between Sugar-Sweetened Beverages and Waist Circumference in Adult Populations: A Meta-Analysis of Prospective Cohort Studies. Clin. Nutr. ESPEN 2021, 41, 118–125. [Google Scholar] [CrossRef]
- Papier, K.; D’Este, C.; Bain, C.; Banwell, C.; Seubsman, S.; Sleigh, A.; Jordan, S. Consumption of Sugar-Sweetened Beverages and Type 2 Diabetes Incidence in Thai Adults: Results from an 8-Year Prospective Study. Nutr. Diabetes 2017, 7, e283. [Google Scholar] [CrossRef]
- Nouri, M.; Shateri, Z.; Rezaei, M.; Zangene, A.; Homayounfar, R.; Keshani, P. Healthy Beverage Index Could Decrease Odds of Metabolic Syndrome: A Cross-Sectional Study. Food Sci. Nutr. 2023, 11, 4562–4571. [Google Scholar] [CrossRef]
- Bel-Serrat, S.; Julián-Almárcegui, C.; González-Gross, M.; Mouratidou, T.; Börnhorst, C.; Grammatikaki, E.; Kersting, M.; Cuenca-García, M.; Gottrand, F.; Molnár, D.; et al. Correlates of Dietary Energy Misreporting among European Adolescents: The Healthy Lifestyle in Europe by Nutrition in Adolescence (HELENA) Study. Br. J. Nutr. 2016, 115, 1439–1452. [Google Scholar] [CrossRef] [PubMed]
- Hoffman, W.H.; Barbeau, P.; Litaker, M.S.; Johnson, M.H.; Howe, C.A.; Gutin, B. Tanner Staging of Secondary Sexual Characteristics and Body Composition, Blood Pressure, and Insulin in Black Girls. Obes. Res. 2005, 13, 2195–2201. [Google Scholar] [CrossRef] [PubMed]
- Haughton, C.F.; Waring, M.E.; Wang, M.L.; Rosal, M.C.; Pbert, L.; Lemon, S.C. Home Matters: Adolescents Drink More Sugar-Sweetened Beverages When Available at Home. J. Pediatr. 2018, 202, 121–128. [Google Scholar] [CrossRef] [PubMed]


Disclaimer/Publisher’s Note: The statements, opinions and data contained in all publications are solely those of the individual author(s) and contributor(s) and not of MDPI and/or the editor(s). MDPI and/or the editor(s) disclaim responsibility for any injury to people or property resulting from any ideas, methods, instructions or products referred to in the content. |
© 2025 by the authors. Licensee MDPI, Basel, Switzerland. This article is an open access article distributed under the terms and conditions of the Creative Commons Attribution (CC BY) license (https://creativecommons.org/licenses/by/4.0/).