Article

Effect of Partial Condensation (Dephlegmation) in Fruit Brandy Distillation Equipment on the Composition of Apple Brandies

Department of Yeast Genetics and Fermentation Technology, Institute of Food Science and Biotechnology, University of Hohenheim, Garbenstraße 23, 70599 Stuttgart, Germany
*
Author to whom correspondence should be addressed.
Current address: Botanical Garden, Ulm University, Hans-Krebs-Weg 1, 89081 Ulm, Germany.
Beverages 2025, 11(2), 52; https://doi.org/10.3390/beverages11020052
Submission received: 15 November 2024 / Revised: 24 March 2025 / Accepted: 28 March 2025 / Published: 17 April 2025

Abstract

:
Fruit brandy equipment commonly uses partial condensation (dephlegmation) to generate reflux in the distillation column. Here, we examined the effect of dephlegmation on the composition of fruit brandies in both lab-scale and large-scale settings. In lab-scale experiments, the dephlegmator led to a pronounced enrichment of ethanol in the distillate due to preferred condensation of water, while the concentration of flavor compounds was differentially affected. Some compounds were enriched in the distillate, some were depleted, and some were unaffected by dephlegmation compared with the control without a dephlegmator. Large-scale fruit brandy equipment relying exclusively on dephlegmation was compared as standard with an enrichment section containing three trays. In the equipment relying on dephlegmation, tail components such as fusel alcohols were less well separated from the middle run, which led to a reduced yield of clean spirit in the middle run. In triangle tests, the spirits from the two devices could be clearly differentiated, but there was no clear preference for one spirit or the other. This study provides for the first time detailed data on the influence of dephlegmators on the behavior of flavor compounds during fruit brandy distillation.

1. Introduction

In a dephlegmator, a gas mixture is partially condensed by continuous heat removal, generating reflux for the distillation column. This process influences the separation efficiency of the volatile components contained in the vapors. In the production of fruit brandies, a dephlegmator is commonly integrated into the upper part of the distillation column, which is equipped with multiple trays, such as sieve trays or bubble cap trays. As the fruit mash is heated, vapor rises through the column and contacts the liquid on each tray, allowing for mass transfer and the separation of components. The dephlegmator partially condenses the rising vapor, returning a portion of the condensed liquid (reflux) back to the column. This reflux provides additional stages of vapor–liquid contact. The device for partial condensation was invented by Isaac Bérard in the beginning of 19th century [1], and since then, the combination of trays and a dephlegmator has been preferably used in practice in the production of alcoholic beverages. The efficiency of a dephlegmator is influenced by various factors, including the pressure, temperature, fluid properties, flow rates, and the physical dimensions of the apparatus. Despite the complexity of the dephlegmator and the fact that it has been practically used in brandy production for a long time, literature on the dephlegmator is extremely scarce.
Previous studies on dephlegmation at the lab scale have focused extensively on rigorous calculations and modeling to better understand the process. Webber and Bridger provided a detailed analysis of dephlegmator efficiency using graphical methods with binary component mixtures, revealing variations in efficiency based on operating conditions such as reflux ratio and material properties [2]. Kent and Pigford offered insights into the fractionation of vapor mixtures during condensation, detailing the thermodynamic and mass transfer principles governing dephlegmation [3]. Roehm’s studies utilized simulations to understand both the unsteady and steady-state behaviors of dephlegmation in binary and multicomponent vapor mixtures [4,5]. Wang and Smith proposed a new design methodology for dephlegmators in low-temperature gas separation processes [6]. While these lab-scale studies have provided a comprehensive theoretical understanding and established sophisticated models for dephlegmation, much of the literature is now outdated and limited. Furthermore, existing studies often fail to address the practical implications of these findings in larger-scale applications, such as fruit brandy production.
Some studies have investigated the role of dephlegmators in large-scale brandy production. These studies applied various reflux strategies to optimize flavor profiles [7,8]. However, they focused only on their practical applications, and there was no further exploration of the underlying mechanisms responsible for the improved aroma compositions, particularly from the perspective of the behavior of individual compounds during distillation.
There has been a lack of detailed investigations of the effects of dephlegmators on the separation of compounds in fruit brandy distillation. Furthermore, the absence of discussions on translating theoretical models from lab-scale experiments to real-world applications leaves a significant gap in understanding dephlegmators’ influence in large-scale settings. This paper aims to address these gaps by examining the behavior of flavor compounds in both lab-scale and large-scale dephlegmators, offering a more comprehensive insight into the dephlegmators’ function in fruit brandy production.
In our previous work [9], a simple method for investigating the relative volatility (α) of compounds by using a simple distillation apparatus was introduced. The method provides a fast and straightforward alternative to the standard method for determining relative volatilities. Here, a lab-scale dephlegmator was set up by modifying the simple distillation apparatus. A Liebig condenser was positioned on top of a round flask, with water at a controlled temperature flowing through it. The vapor passing through the Liebig condenser was partially condensed by the surrounding water and returned to the round flask as reflux. Thus, this modified version of the simple distillation apparatus mimicked the function of a dephlegmator.

2. Materials and Methods

2.1. Lab-Scale Experiments

2.1.1. Preparations of Solutions

A total of 12 flavor compounds typical of apple brandies were selected. The preparation of sample solutions and their concentrations were as described previously [9]. The hydroalcoholic solutions were prepared by combining double-distilled water (ddH2O), ethanol (≥99.8%, Merck Millipore, Darmstadt, Germany) and selected flavor compounds to achieve the desired initial concentrations. Ethanol concentrations ranged from 5% to 85% (v/v), increasing in 10% (v/v) increments. All 12 flavor compounds used in the study were of analytical grade. Table 1 provides details on the functional groups, names, concentration in the hydroalcoholic solutions, molecular weights, boiling points, suppliers, and purities of these compounds.

2.1.2. Experimental Setup

A modified distillation setup was employed as a lab-scale dephlegmator for hydroalcoholic solution distillation. The setup included a 250 mL round-bottom flask and a 400 mm Liebig condenser, which served as the cooling element of the dephlegmator. On top of the Liebig condenser, a distillation bridge with a ground socket was installed, and a 400 mm Allihn condenser was connected at the end of the setup to function as a cooling device. The Liebig condenser was connected to a circulation water bath (Thermo Fisher Scientific, Karlsruhe, Germany) to maintain the temperature of the cooling water. The cooling water temperature in the Allihn condenser was maintained at the temperature of continuously supplied tap water.

2.1.3. Distillation of Solutions

A 100 mL portion of the solution was transferred to a 250 mL round-bottom flask. The flask was placed in a mantle heater (LabHEAT, SAF Wärmetechnik, Mörlenbach, Germany) and moderately heated at 180 W until sampling. Cooling water at a chosen temperature continuously flowed into the lab-scale dephlegmator during distillations. The first 5 mL of distillate was collected in a 5 mL graduated cylinder, and the sampling durations were recorded (Table A1 in the Appendix A). Experiments were performed in triplicate.
Screening experiments were conducted with ethanol–water solutions ranging from 5 to 85% (v/v) with a 10% (v/v) stepwise increase at six different temperatures in the Liebig condenser: 70, 75, 80, 85, 90, and 95 °C. The temperature of 75 °C was selected as the most appropriate. At temperatures below 75 °C, either it took too long to collect samples or no samples were obtained. At temperatures higher than 75 °C, there was little dephlegmation effect. Thus, all distillations of hydroalcoholic solutions were conducted with the cooling water maintained at 75 °C.

2.1.4. Calculation of Relative Volatility (α)

The partition coefficient ( K i ) represents how a volatile compound i is distributed between the vapor and liquid phases, and it is defined as
K i = y i x i
where y i and x i are the concentrations of compound i in the vapor and liquid phases, respectively. The relative volatility of compound i ( α i ) relative to ethanol is calculated as the ratio of the partition coefficient of the compound ( K i ) to that of ethanol ( K e t h a n o l ) and is expressed as
α i = K i K e t h a n o l
Relative volatility values of 1 imply that compound i and ethanol have equivalent volatilities. A value greater than 1 signifies that the compound is more prone to evaporation, while a value less than 1 suggests lower volatility compared with ethanol. In this work, samples obtained from the lab-scale dephlegmator were considered as the vapor phase, and solutions in the flask before heating were considered as the liquid phase.

2.2. Large-Scale Experiments

2.2.1. Apple Mash Preparation and Fermentation

Fruit mash was prepared and fermented using a standard method. Golden Delicious (Malus domestica) apples were cleaned with water and shredded using a fruit mill (Helmut Rink GmbH, Amtzell, Germany). During milling, 10 mL/hL of pectin lyase (IUB 4.2.2.10, Schliessmann, Schwäbisch Hall, Germany) was added to the mash to ensure sufficient substrate liquefaction. The disintegrated fruit mash was then transferred to a 1000 L stainless steel fermentation tank. The pH was adjusted to the range of 3.1–3.2 using phosphoric and lactic acid (Product No: 5862, Schliessmann, Schwäbisch Hall, Germany). The mash was inoculated with 15 g/hL yeast (Saccharomyces cerevisiae) strains (Aroma Plus, Schliessmann, Schwäbisch Hall, Germany). Fermentation was carried out at a room temperature of 20 °C for 4 weeks in the dark.

2.2.2. Distillation Profile Parameters and Equipment

Two distillation units were used to investigate the effects of the dephlegmator on the composition of flavor compounds in distillates. The main difference between the two setups was the number of trays and dephlegmators used to facilitate compound separations. A batch distillation still, with the standard setup, included three trays and one dephlegmator. For the design and further specifications of the equipment, refer to the work by Heller and Einfalt [10].
In contrast, the other batch distillation equipment included four dephlegmators without any trays. The schematic diagram of the equipment is shown in Figure 1. The equipment was equipped with a reboiler, four spherically shaped dephlegmators, a copper packing, and a product cooler. Inside each dephlegmator, there was a cooling plate through which cooling water flowed. The ascending vapor contacted the cooling plate, causing partial condensation, and the remaining vapor passed between the cooling plate and the wall of the spherically shaped dephlegmators. The separation of compounds was achieved through continuous thermodynamic cycles of condensation and evaporation within the dephlegmators. The vapor that passed through the dephlegmators reached the product cooler, where it condensed and was collected as the final product. The experiments were conducted with deactivated copper packing in both setups, utilizing reboilers of the same size, rectification columns, and product coolers. While the coolers differed in shape, their sole purpose was to condense vapor into liquid without altering compound composition, ensuring that the column configuration was the only variable in the setups.
A 100 L batch of fruit mash was transferred to the reboiler of the distillation system. Initially, the mash was heated at 450 W/L until the vapor reached the top tray of the distillation column. At that point, the heating power was reduced to 60 W/L, which was maintained until the distillation began. Throughout the distillation process, the energy input was adjusted to maintain a consistent flow rate of 6 L/h. Meanwhile, the cooling water flow rate in the dephlegmator was kept constant at 80 L/h. This heating profile was applied to both the C distillation, using the equipment with the standard setup as control, and the D distillation, using the equipment with multiple dephlegmators. The experiments were performed in duplicate. Because of a technical issue with the C distillation equipment, the distillation had to be postponed, and consequently, the mash for the C equipment was fermented 4 weeks longer than the mash for the D equipment.

2.2.3. Sampling

For all performed distillations, 100 fractions of 100 mL samples were continuously collected in glass bottles (DWK Life Sciences, Wertheim, Germany), making the total collected volume 10 L per distillation. In the C distillation, 5 mL samples from the top tray were taken simultaneously using glass syringes (Poulten and Graf GmbH, Wertheim, Germany) every 2 L until 4 L of the distillate was collected in total, and thereafter every 1 L until the end of the distillation. In the D distillation, no additional samples were taken from the distillation column due to the nature of the equipment. After each distillation, fractions were sensorially assessed by our experienced distiller, who identified the starting sample of the hearts and tails fractions.

2.2.4. Sensory Evaluation: Triangle Test

The sensory evaluation involved testing the heart fractions from both the C and D distillations. Each sample was diluted with water to achieve a final ethanol concentration of 40% (v/v) and filtered using a 50 cm cellulose-based folded filter (Schliessman, Schwäbisch Hall, Germany) to remove any cloudiness. A total of 57 panelists participated, with half receiving two C samples and one D sample while the other half received two D samples and one C sample. The test room was controlled for temperature and humidity, ensuring a comfortable environment free from extraneous odors and noise. Each glass was labeled with a different random three-digit code. After sniffing and tasting the three samples, panelists were asked to identify the odd sample and then state their preference between the different samples. The assessors were participants from a distillery course at our institute, all of whom had moderate to extensive experience in brandy tasting. The results were analyzed using the chi-squared (χ2) test. For the analysis of the preference test, only the responses from participants who correctly identified the odd sample in the triangle test were considered. The sensory evaluation conducted in this study involved voluntary participation by adult individuals as part of a distillery course at our institute. As the evaluations were noninvasive, utilized widely consumed alcoholic beverages, and adhered to standard sensory analysis protocols, formal ethical approval was not deemed necessary. All participants were fully informed about the study’s purpose and procedures and provided their consent to participate.

2.3. Gas Chromatography Headspace Analysis

2.3.1. GC Sample Preparations

For the samples from the lab-scale experiments, the ethanol content was measured using a density meter (DMA 4200 M, Anton Paar, Graz, Austria). The samples were then diluted with water to a final ethanol concentration of 40% (v/v) for GC analysis. After dilution, samples were stored overnight in a refrigerator at 3 ± 0.5 °C. A 3 mL liquid sample was then transferred to a 20 mL GC vial (neochrom, neoLab Migge, Heidelberg, Germany) and sealed with butyl/PTFE septa in metallic caps (neochrom, neoLab Migge, Heidelberg, Germany). GC analysis was performed on a single GC vial per sample.
Because of the high number of distillate samples the large-scale experiments, the number of GC samples was reduced by creating mixtures from five consecutively collected samples. Specifically, 3 mL were taken from each of five consecutive samples and combined, resulting in a total of 20 mixtures per distillation. The distillate mixtures were diluted in the same way as the samples from the lab-scale experiments. GC analysis was performed in triplicate, with three GC vials prepared per sample. For the top tray samples from the large-scale experiments, only ethanol concentrations were measured in triplicate, with three readings per sample.

2.3.2. Gas Chromatography Headspace Analysis Setup

Samples were analyzed using a gas chromatograph (GC-2010 Plus, Shimadzu Scientific Instruments, Kyoto, Japan) equipped with a flame ionization detector (FID). Separation was achieved with a 60 m × 0.32 mm × 1.50 μm Rtx-Volatiles capillary column containing a DB-Wax dephenyl dimethyl polysiloxane stationary phase (Restek Corp., Centre County, PA, USA). After equilibrating at 70 °C for 15 min, the headspace gas was automatically injected into the column using helium as the carrier gas, with a flow rate of 3.37 mL/min. The headspace sampler’s transfer line and sample line were maintained at 150 °C. The oven program started at 60 °C for 2 min, followed by a ramp of 2 °C/min to 70 °C, then 8 °C/min to 160 °C (held for 2 min), then 4 °C/min to 200 °C, and finally 15 °C/min to 250 °C (held for 10 min). The total runtime was 43.6 min. The FID was operated at 250 °C with hydrogen, air, and nitrogen flows set at 40 mL/min, 400 mL/min, and 30 mL/min, respectively. Samples were injected in split mode with a split ratio of 25:1. Data were processed using LabSolutions software (Version 5.81, Shimadzu Scientific Instruments, Kyoto, Japan). Quantification was based on the peak areas of analytes, compared against external standards prepared in 40% (v/v) ethanol–water (ddH2O) solutions, with R2 values of ≥0.98.

2.4. Statistical Analysis

The chi-squared (χ2) test and the Mann–Whitney U test were used to analyze the results from both the triangle test and the fraction yields of the distillation profiles. All the tests were performed with the SAS program (version 9.4, SAS Institute, Cary, NC, USA).

3. Results

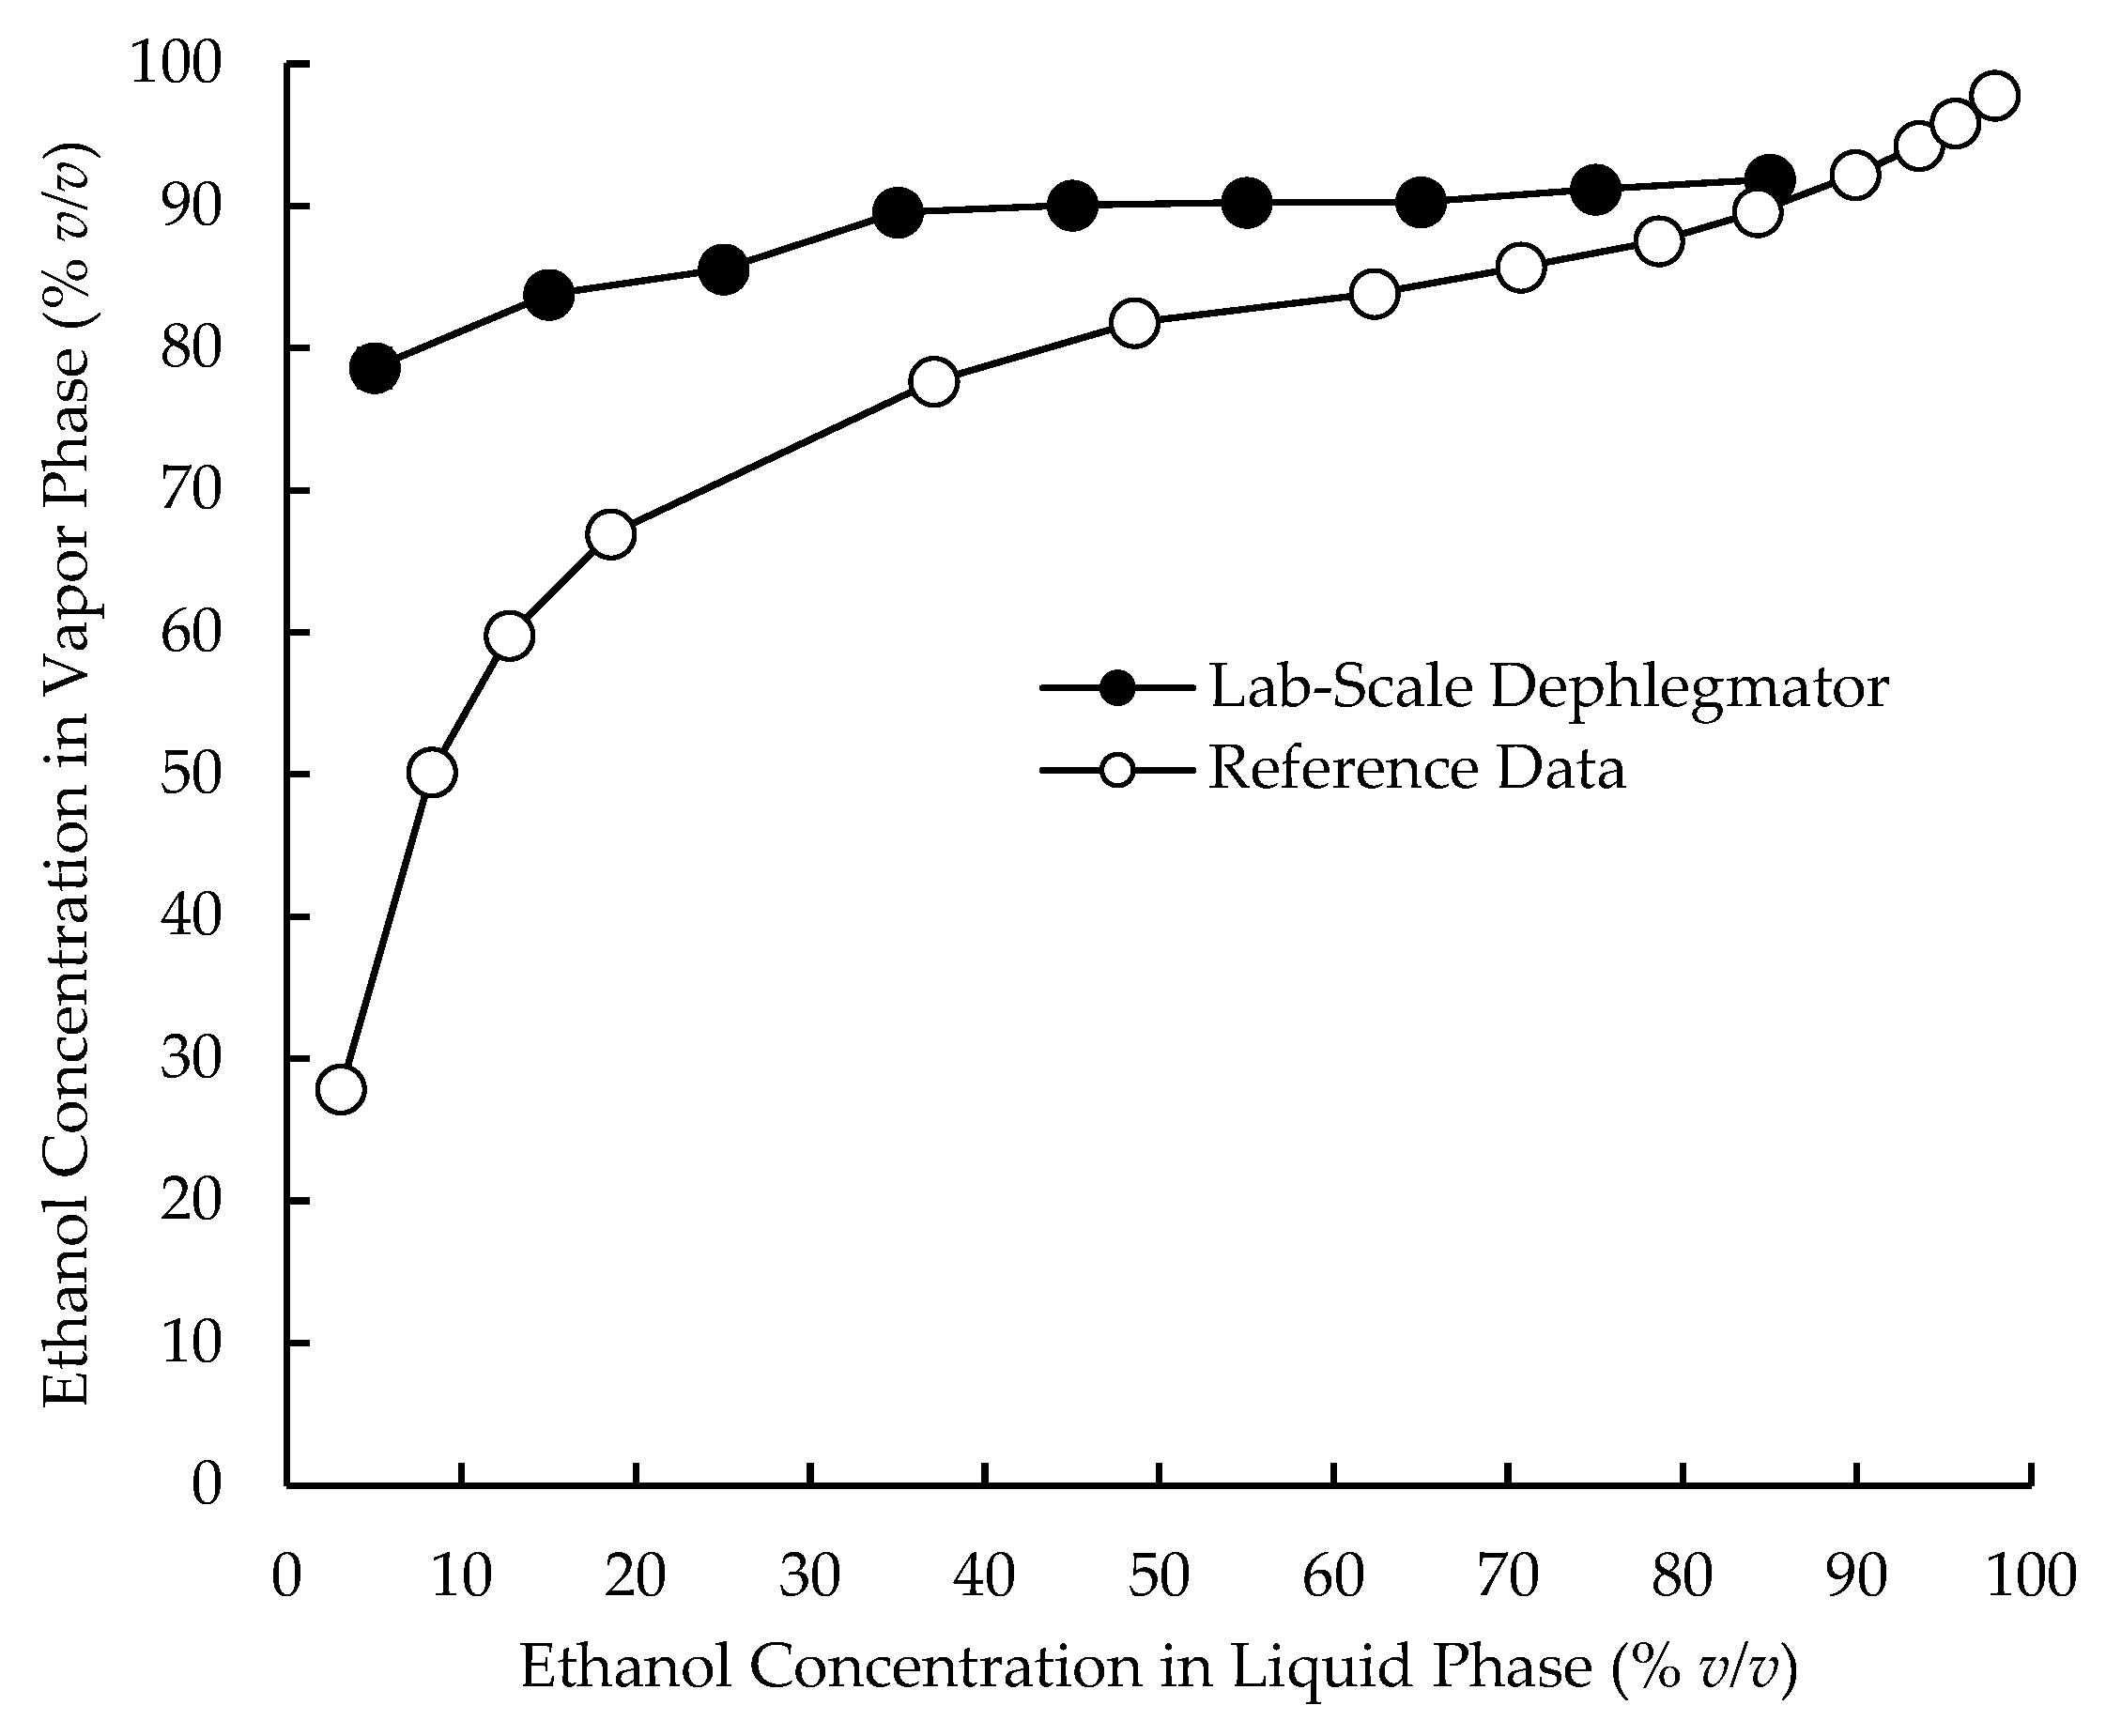
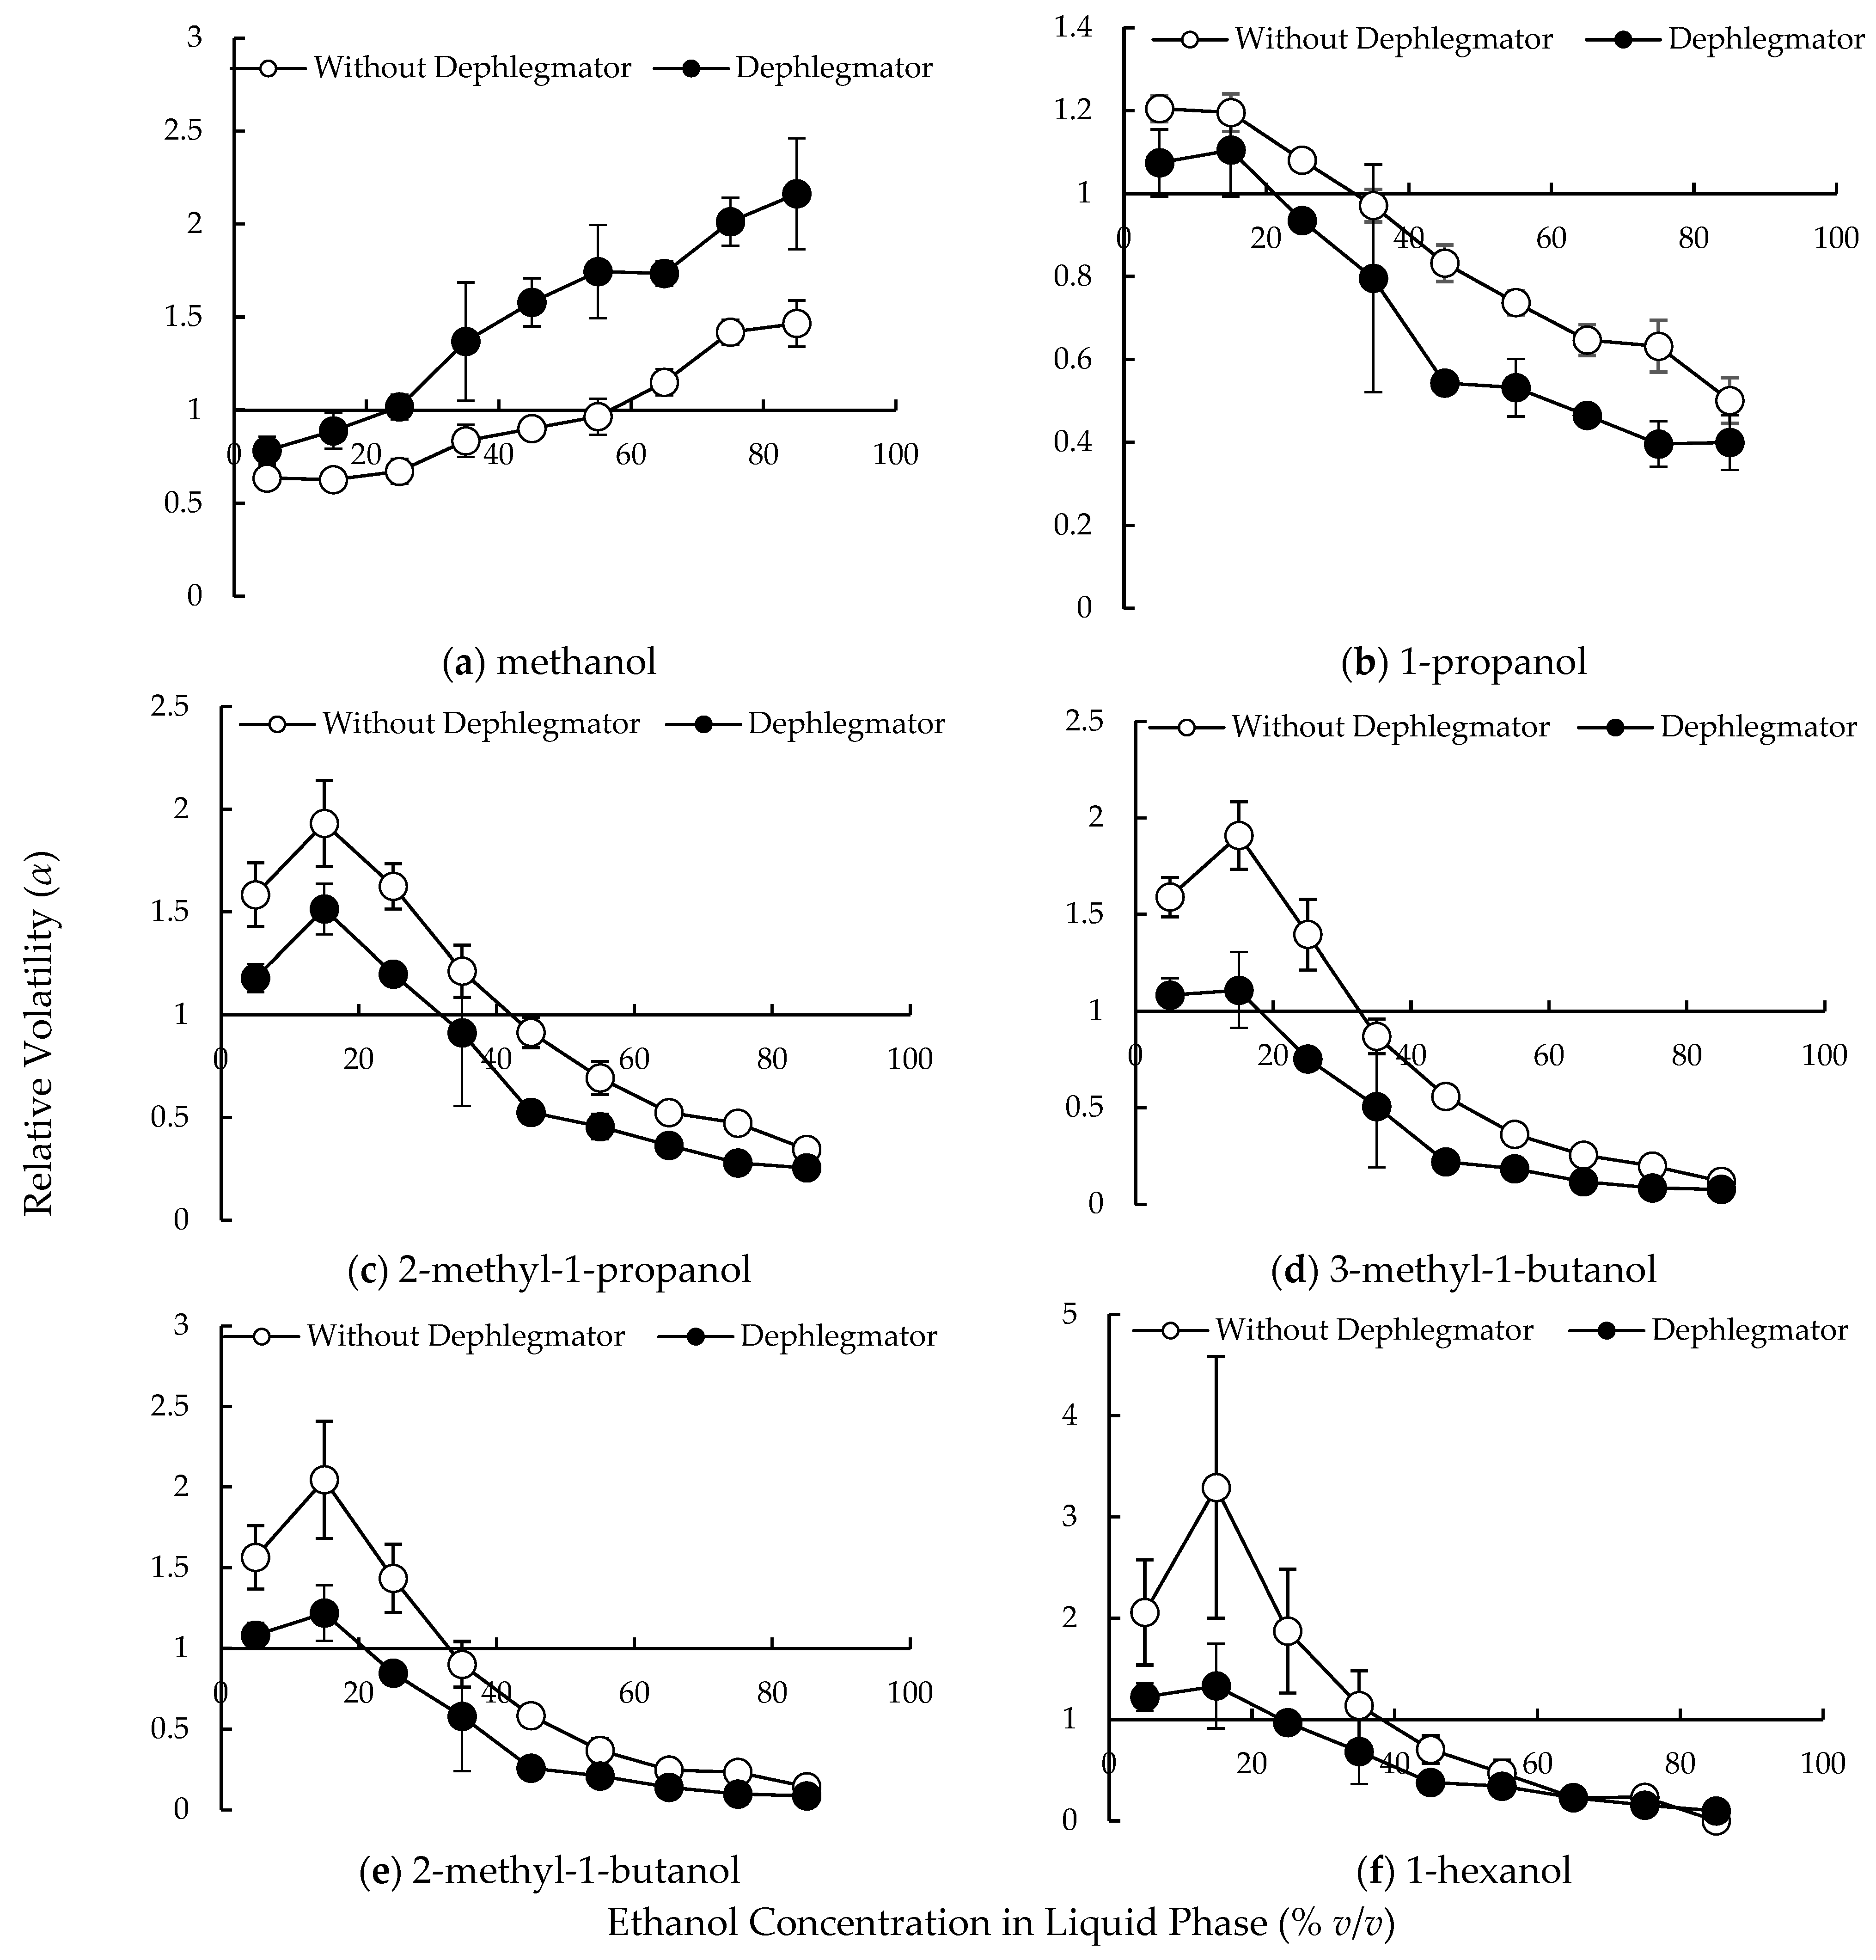
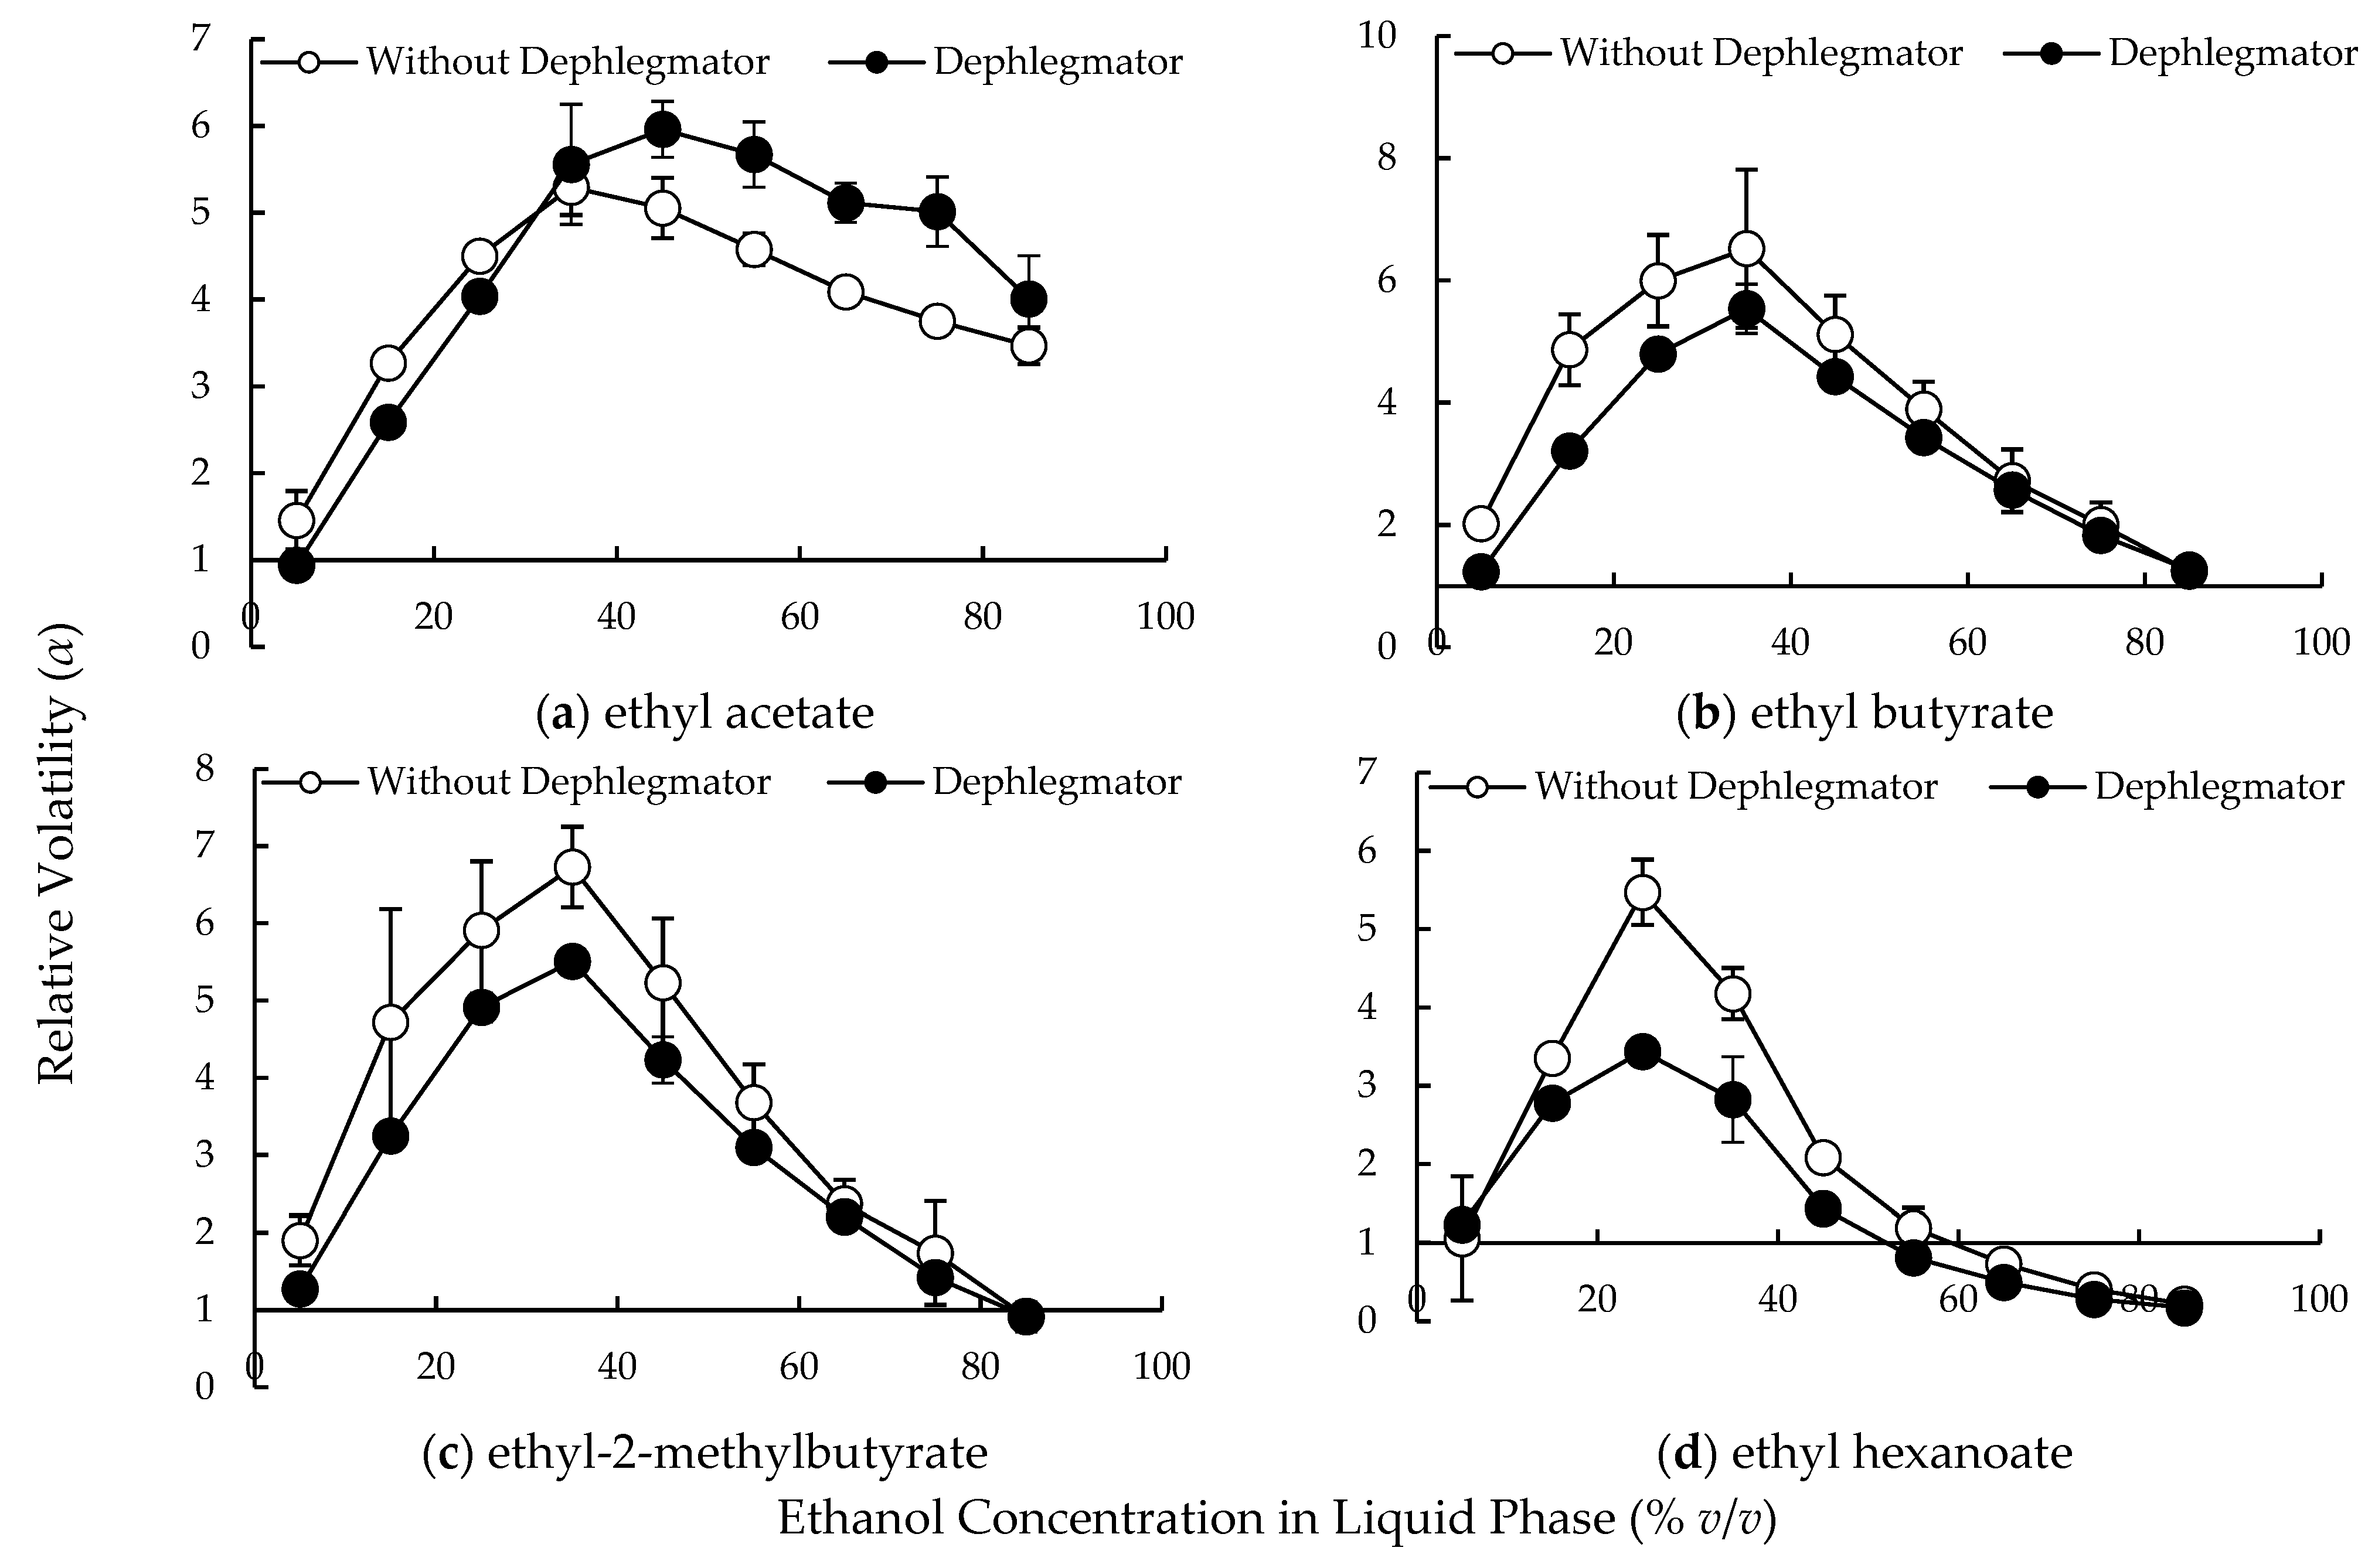
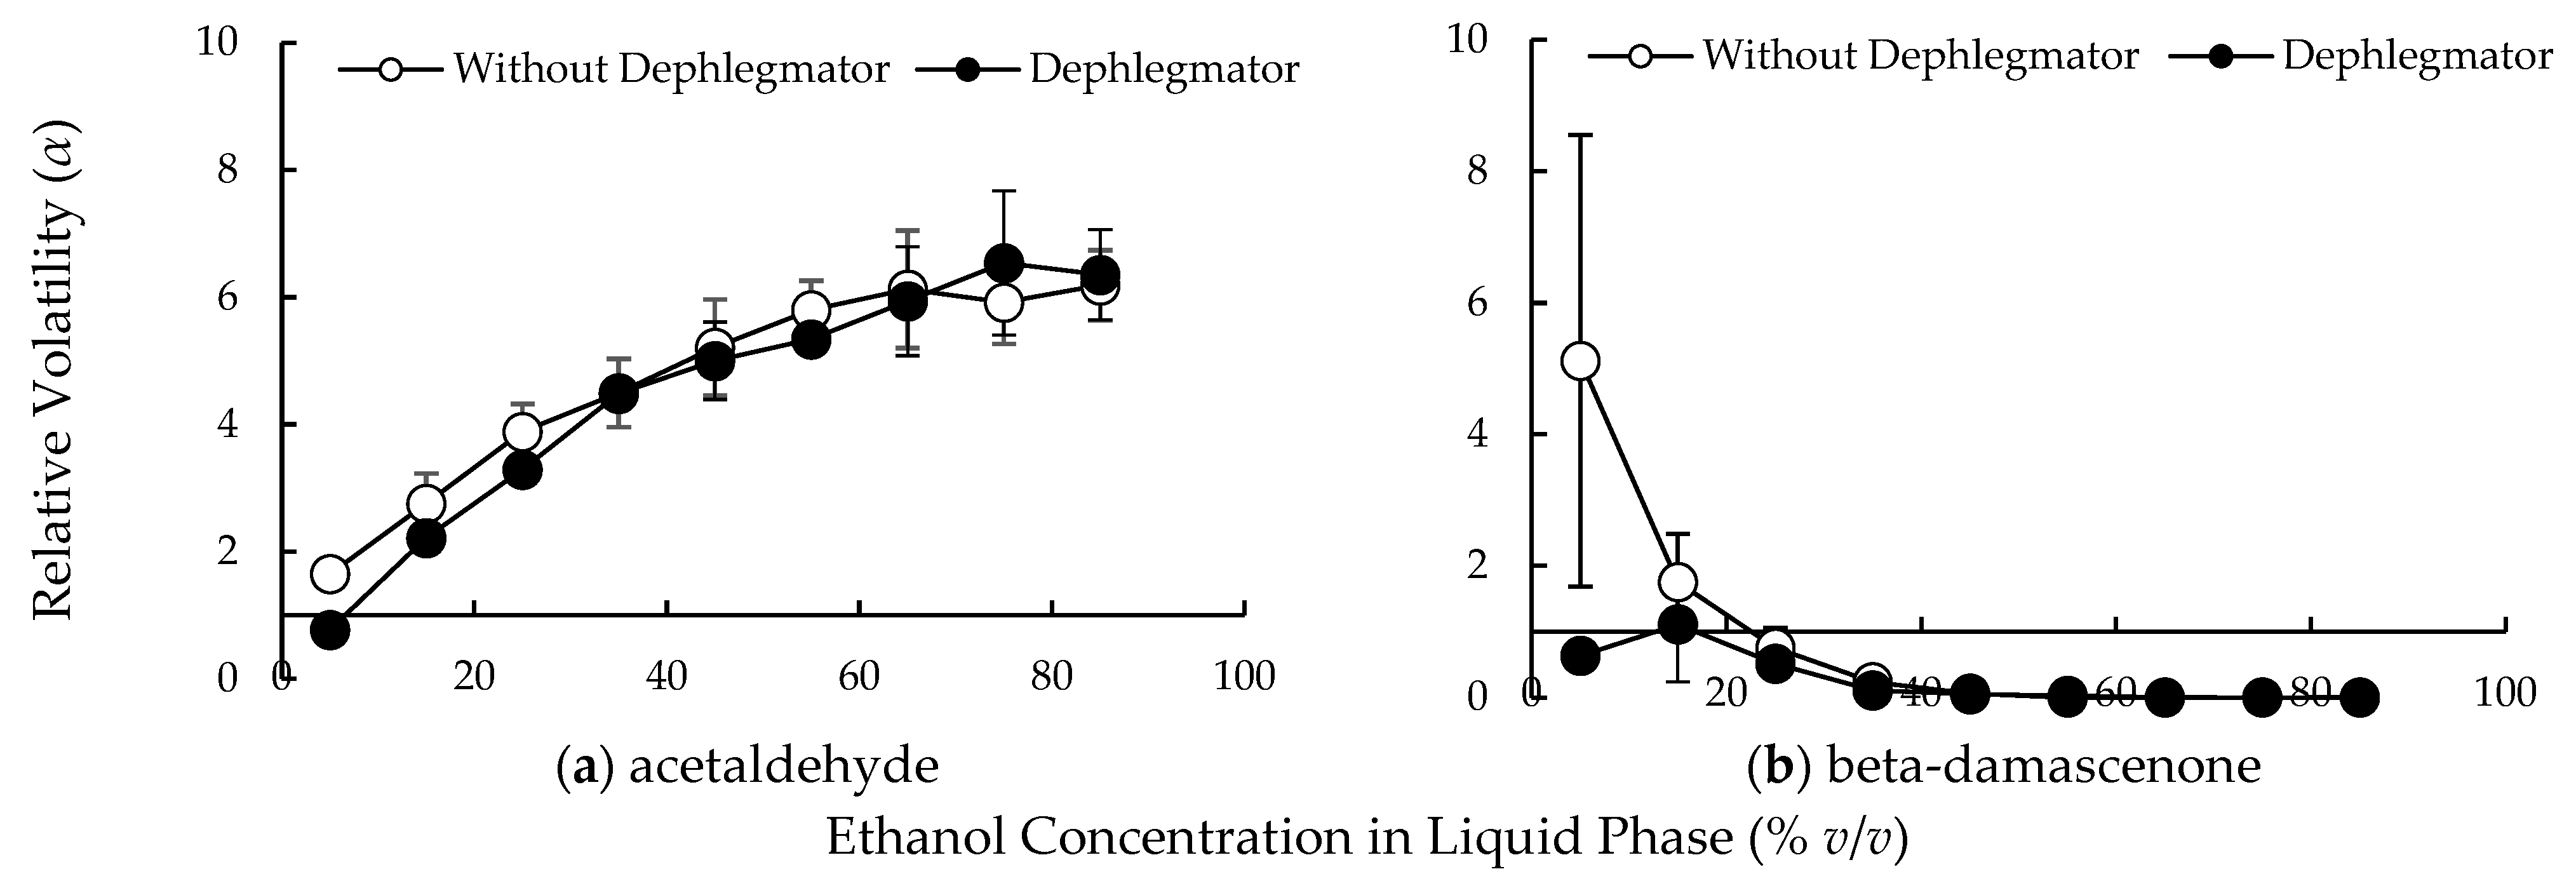
3.1. Relative Volatilities of Compounds in the Lab-Scale Dephlegmator

The equilibrium data are presented in Figure 2. Our data showed a significant difference compared to the reference data without dephlegmator. The lab-scale dephlegmator data started at 78.62% (v/v) in the vapor phase for a 5% (v/v) liquid phase ethanol concentration and increased consistently, reaching 91.88% (v/v) for an 85% (v/v) liquid phase ethanol concentration. Dephlegmation effects were observed across the entire range of ethanol concentrations in the liquid phase, with more significant effects at lower ethanol concentrations. The lab-scale dephlegmator data showed less sensitivity to changes in the liquid phase concentration than the reference data, maintaining high ethanol concentrations in the vapor phase. The data indicated that water molecules were selectively condensed in the lab-scale dephlegmator.
Figure 3 presents a comparison of the relative volatilities of aroma compounds between the reference data without dephlegmator and the data measured with the lab-scale dephlegmator. For methanol (Figure 3a) the relative volatility with and without the dephlegmator was similar at 5% (v/v) ethanol concentration, but it increased with the dephlegmator as the ethanol concentration in the liquid phase increased. The relative volatilities with the dephlegmator were higher than the reference data across all ethanol concentrations, with the difference becoming more significant at ethanol concentrations above 30% (v/v). With its low molecular weight (32.04 g/mol) and low boiling point (64.7 °C), methanol is less prone to condensation than ethanol, which aligns with these observations.
The relative volatilities of the long-chain alcohols, 1-propanol (Figure 3b), 2-methyl-1-propanol (Figure 3c), 3-methyl-1-butanol (Figure 3d), 2-methyl-1-butanol (Figure 3e), and 1-hexanol (Figure 3f), exhibited a similar pattern. Four of the five long-chain alcohols reached their peak relative volatility at 15% (v/v) ethanol concentration in the liquid phase, while the relative volatility of 1-propanol continuously declined with increasing ethanol concentration.
The relative volatilities of alcohols with the dephlegmator were consistently lower than in the reference without dephlegmator, with the exception of methanol, especially at lower ethanol concentrations in the liquid phase. This suggests that long-chain alcohols have a higher tendency to condense in the dephlegmator than ethanol.
Next, the relative volatilities of esters were measured with the dephlegmator and compared with the reference data without the dephlegmator Figure 4. Ethyl acetate exhibited a high volatility across all ethanol concentrations in the liquid phase (Figure 4a). At lower ethanol concentrations, the dephlegmator data closely followed the reference data. However, at ethanol concentrations above 35% (v/v), ethyl acetate exhibited a higher relative volatility with the dephlegmator compared with the reference, indicating a reduced tendency to condense.
The behaviors of the three esters, ethyl butyrate (Figure 4b), ethyl-2-methylbutyrate (Figure 4c), and ethyl hexanoate (Figure 4d), showed some similarities. All three reached their maximum volatility at low- to midrange ethanol concentrations (either 25% (v/v) or 35% (v/v)), after which their volatilities decreased as the ethanol concentration increased. Throughout the entire range, the dephlegmator data were consistently lower than the reference data, demonstrating a higher tendency to condense in the dephlegmator than ethanol. Despite the overall similarity, ethyl hexanoate behaved differently. Its relative volatilities dropped below 1 at ethanol concentrations above 55% (v/v) (Figure 4d), while the relative volatilities of the other two esters remained above 1 at all ethanol concentrations, indicating that ethyl hexanoate was less volatile than the other esters.
Figure 5 presents the relative volatilities of aldehydes and ketones with the dephlegmator. Acetaldehyde exhibited an extremely high relative volatility, particularly at higher ethanol concentrations in the liquid phase, with minimal differences between the dephlegmator data and the reference data (Figure 5a), reflecting its generally high volatility. The lack of effect of the dephlegmator suggests that acetaldehyde and ethanol have a similar tendency to condense in the dephlegmator. Beta-damascenone behaved similarly to long-chain alcohols, with its maximum relative volatility observed at 15% (v/v) ethanol concentration, after which its relative volatility decreased as ethanol concentration increased (Figure 5b). At lower ethanol concentrations, the relative volatility with the dephlegmator was significantly lower than the reference; however, at higher ethanol concentrations, the differences between the two datasets were minimal.

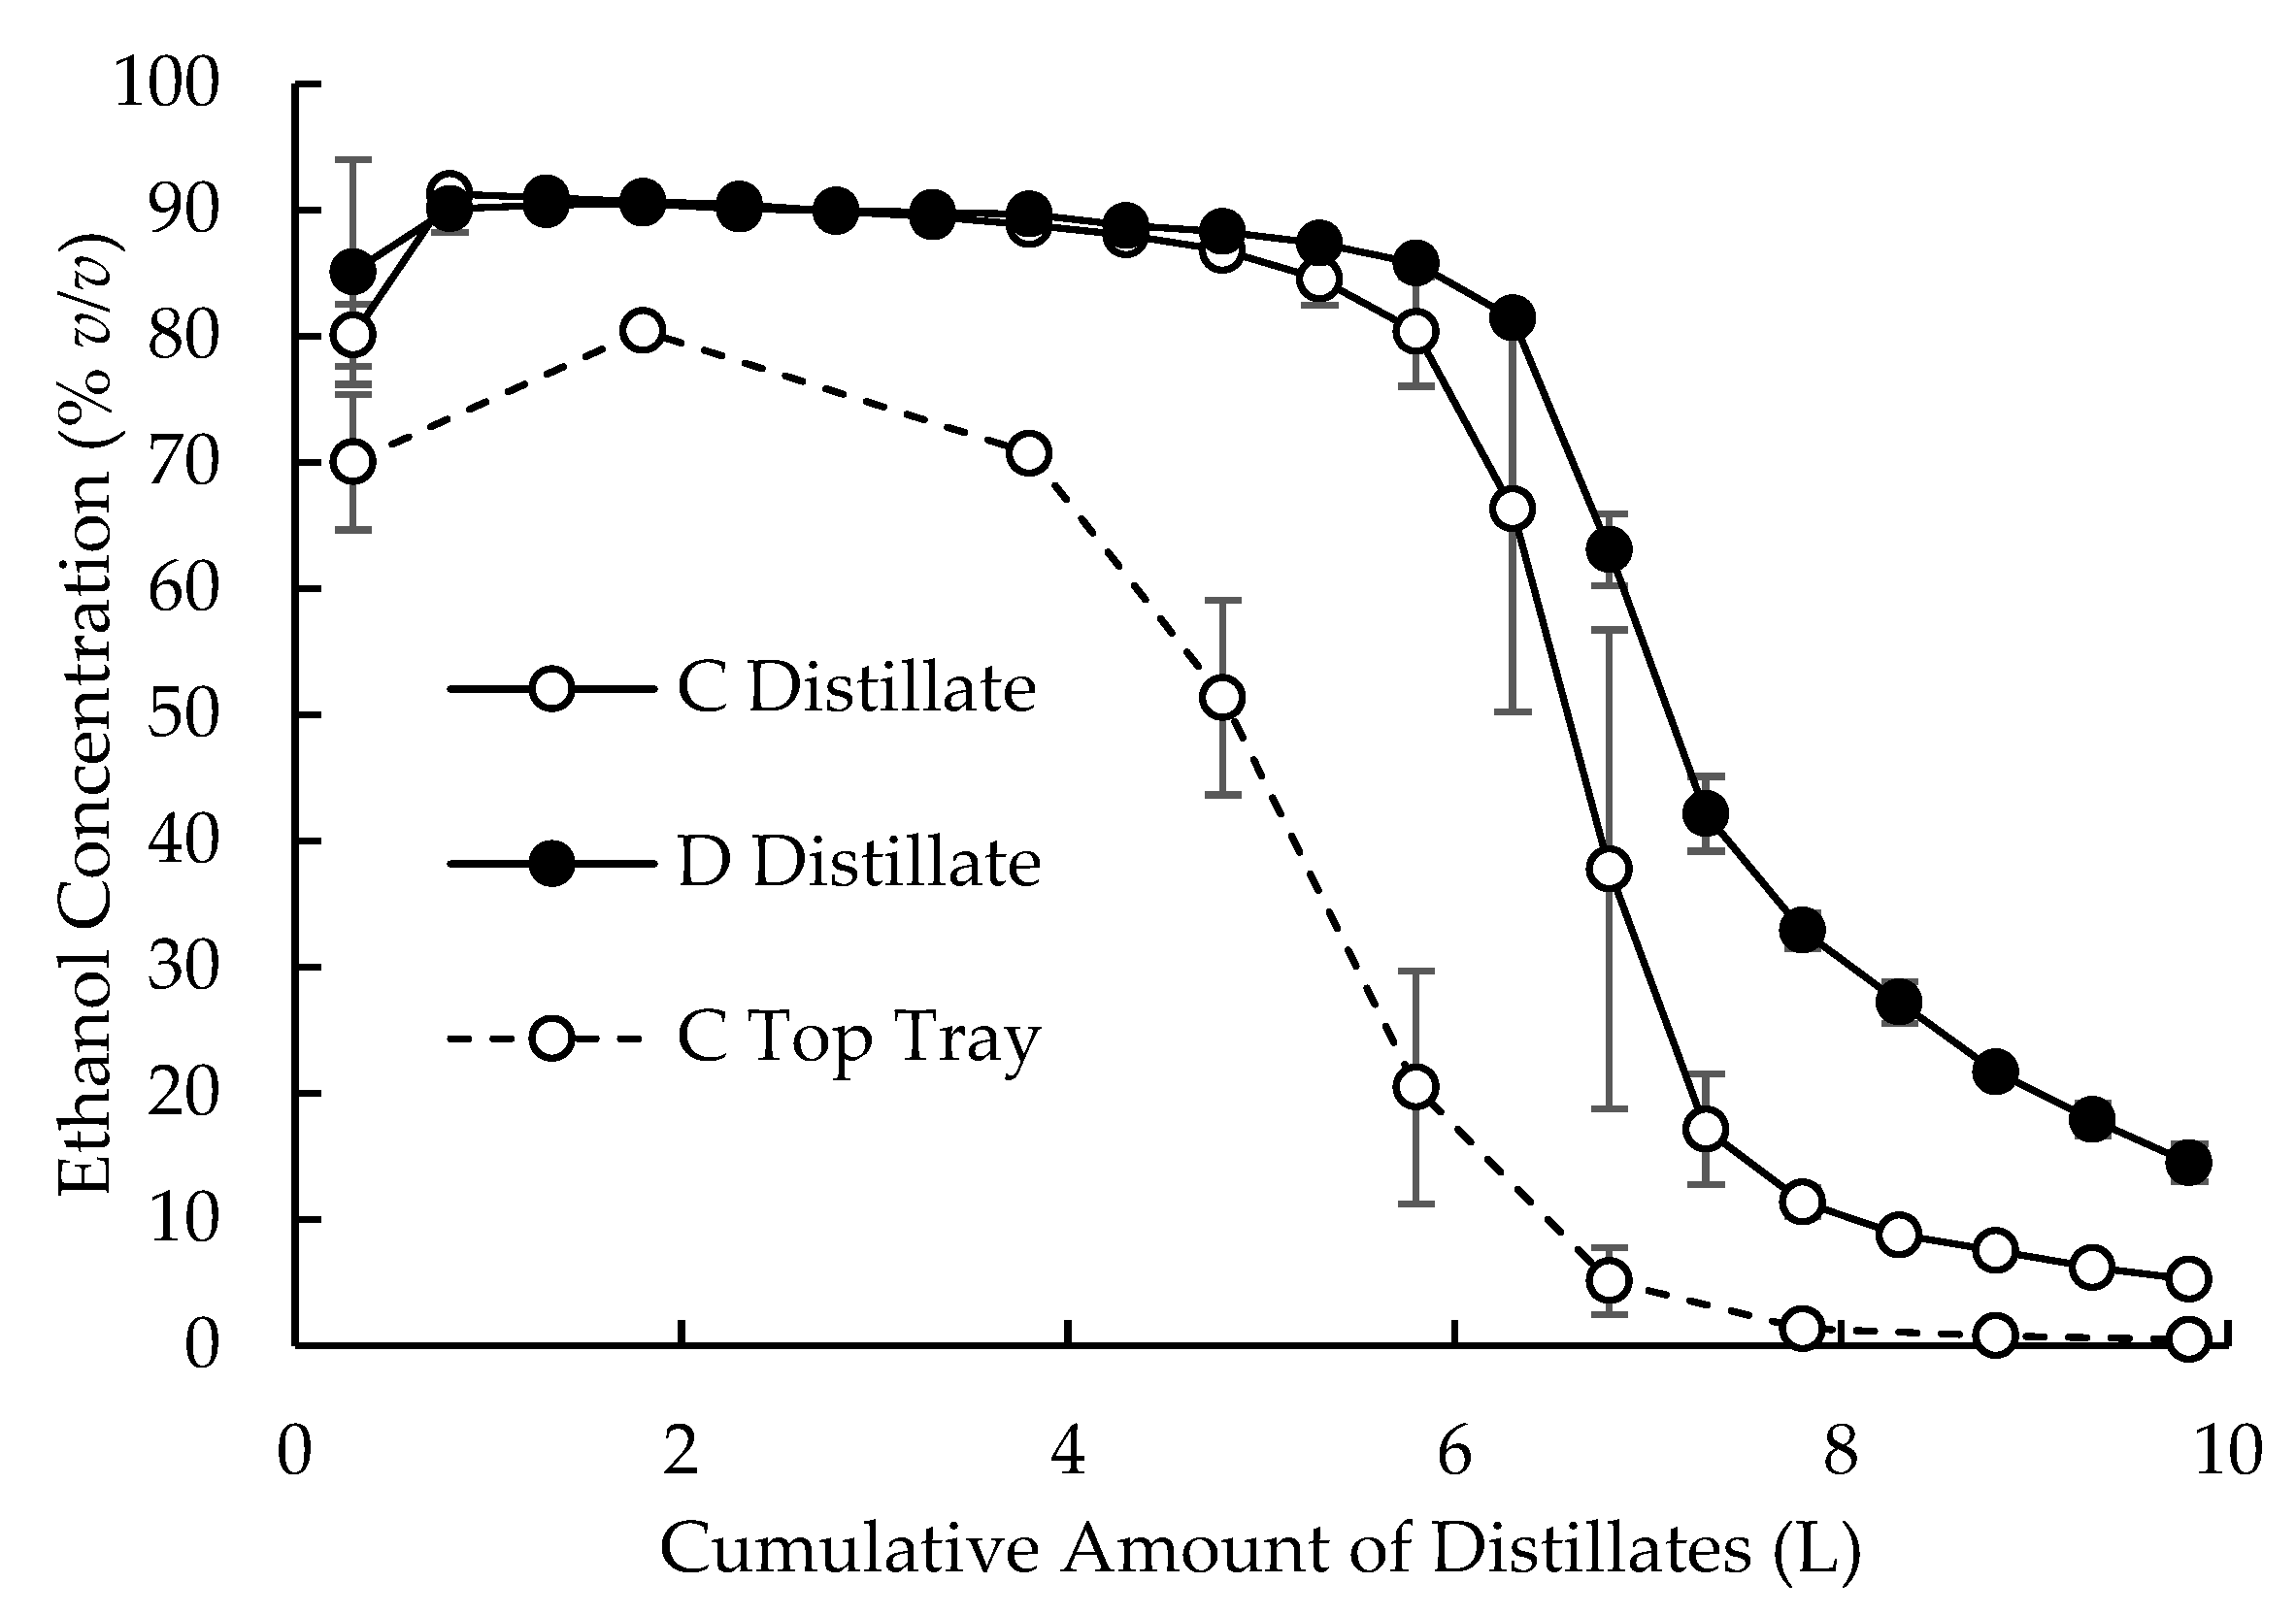
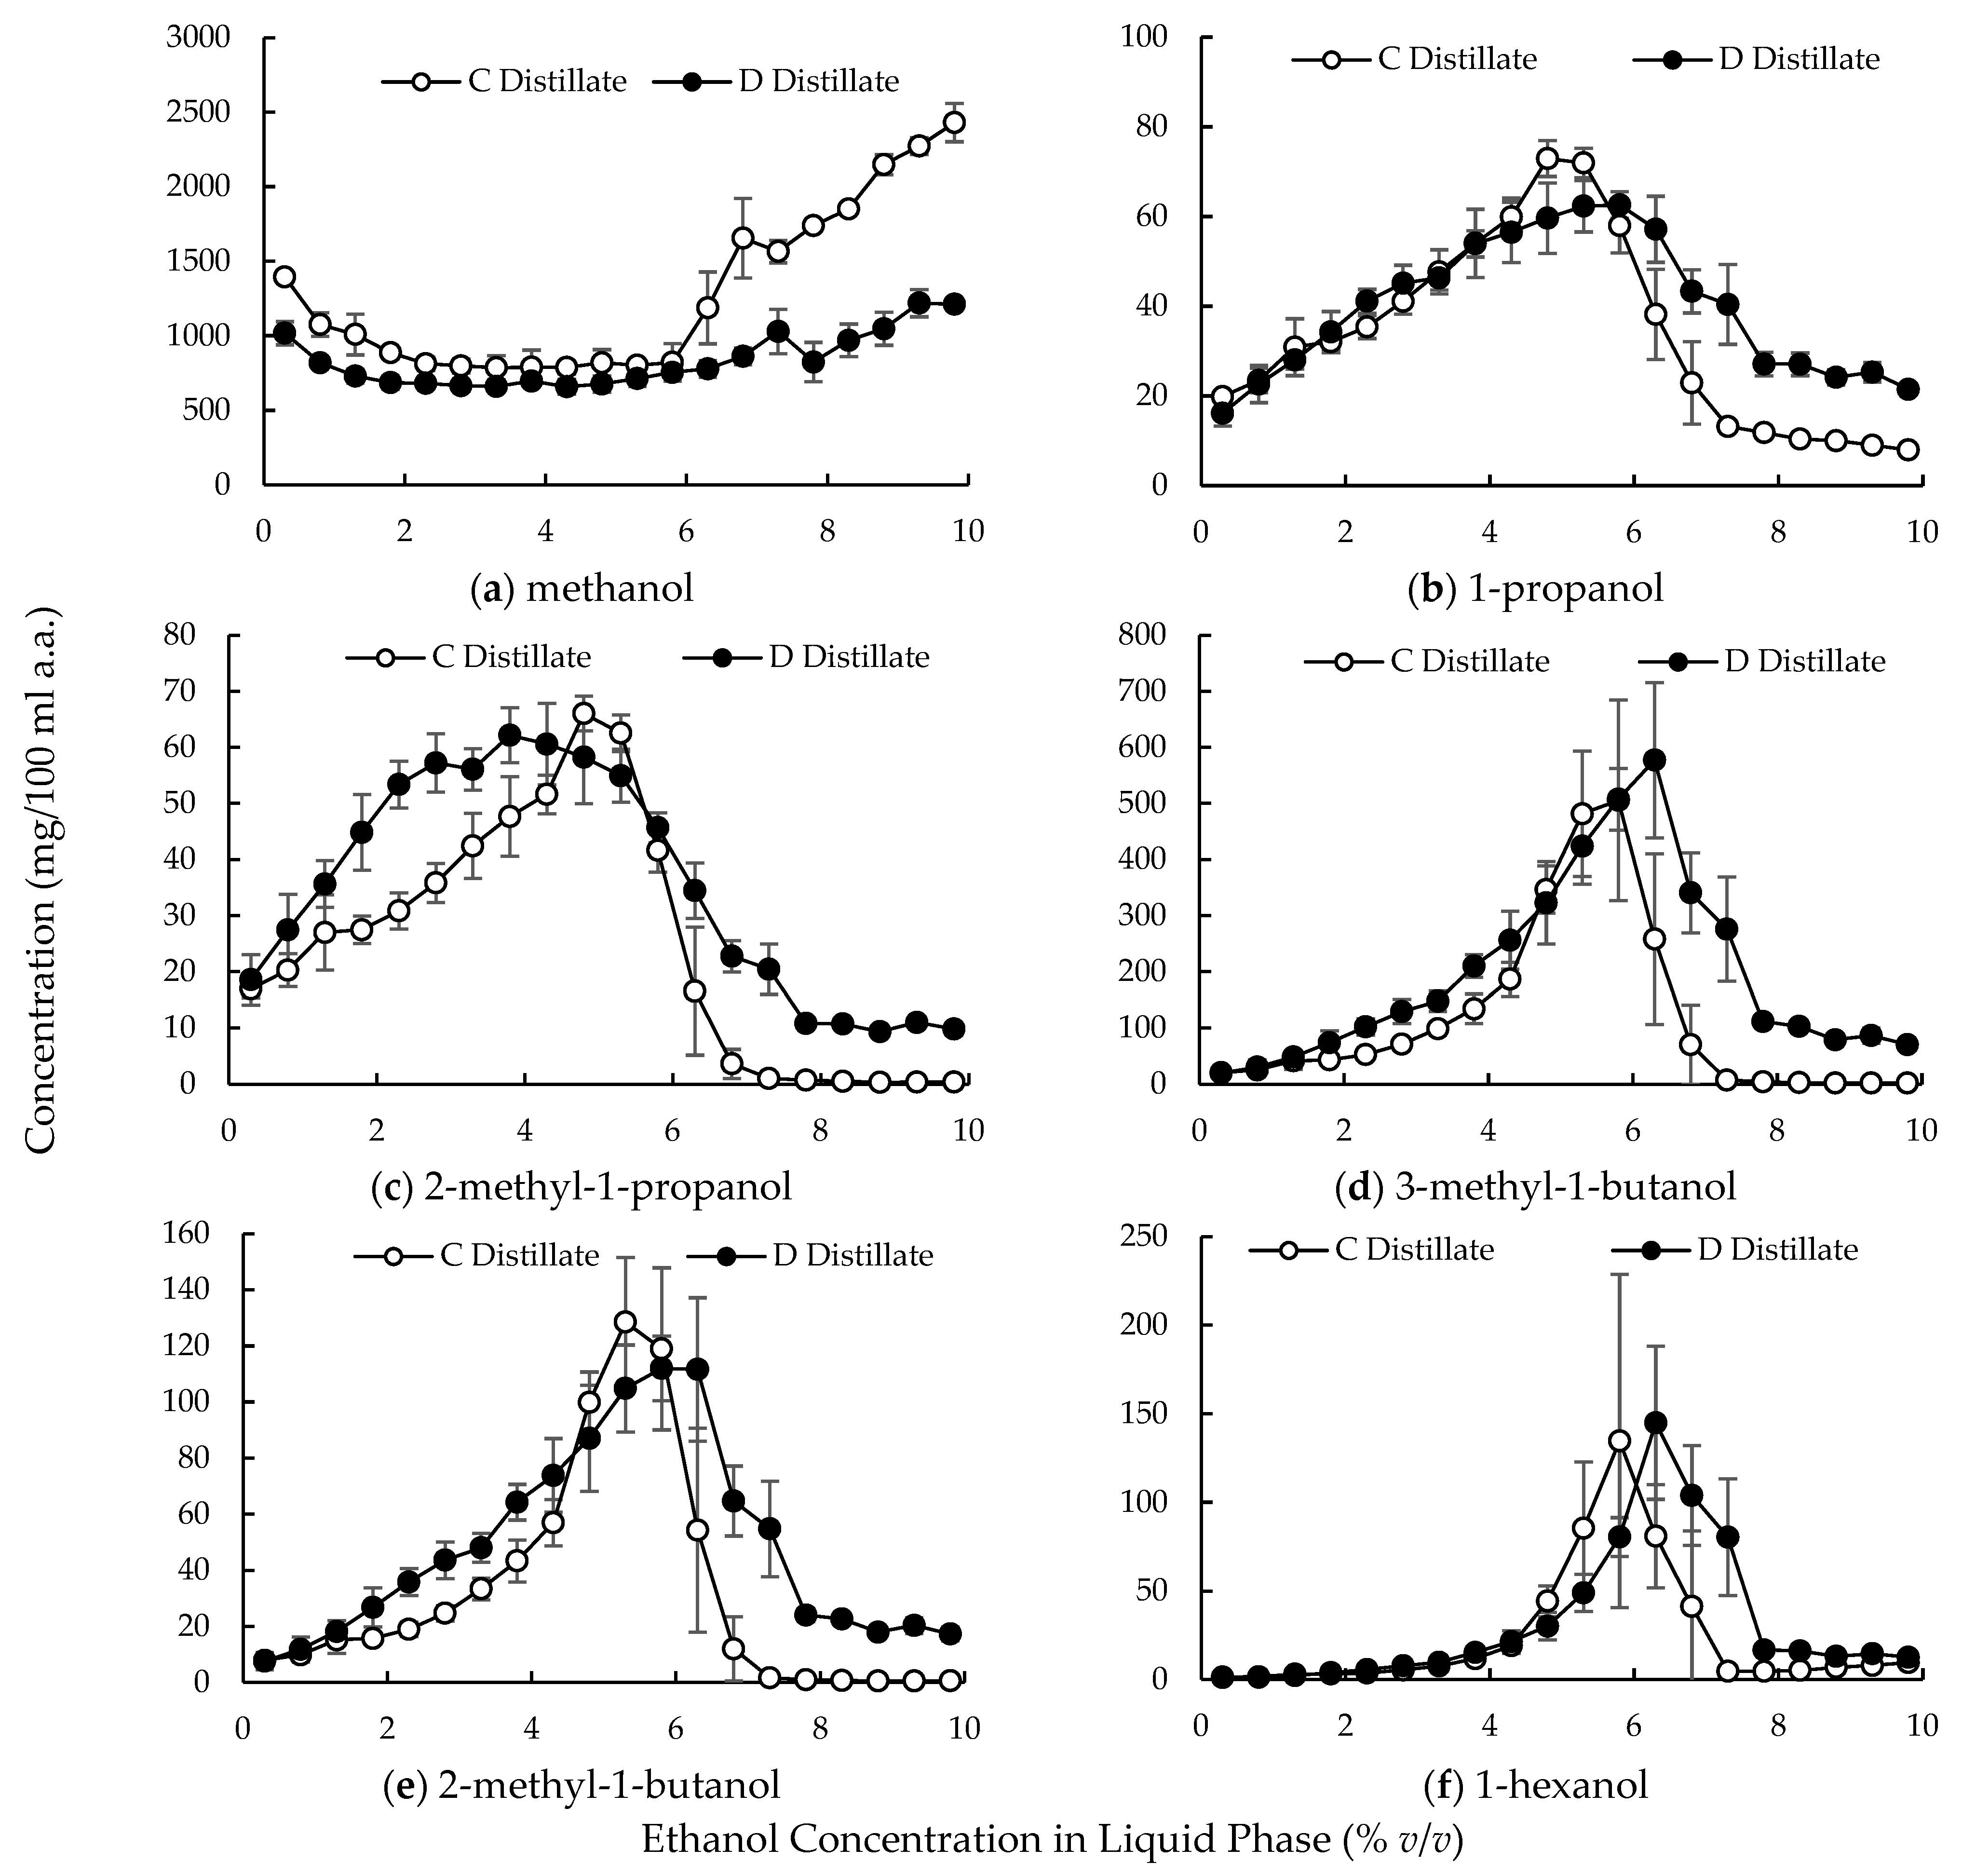
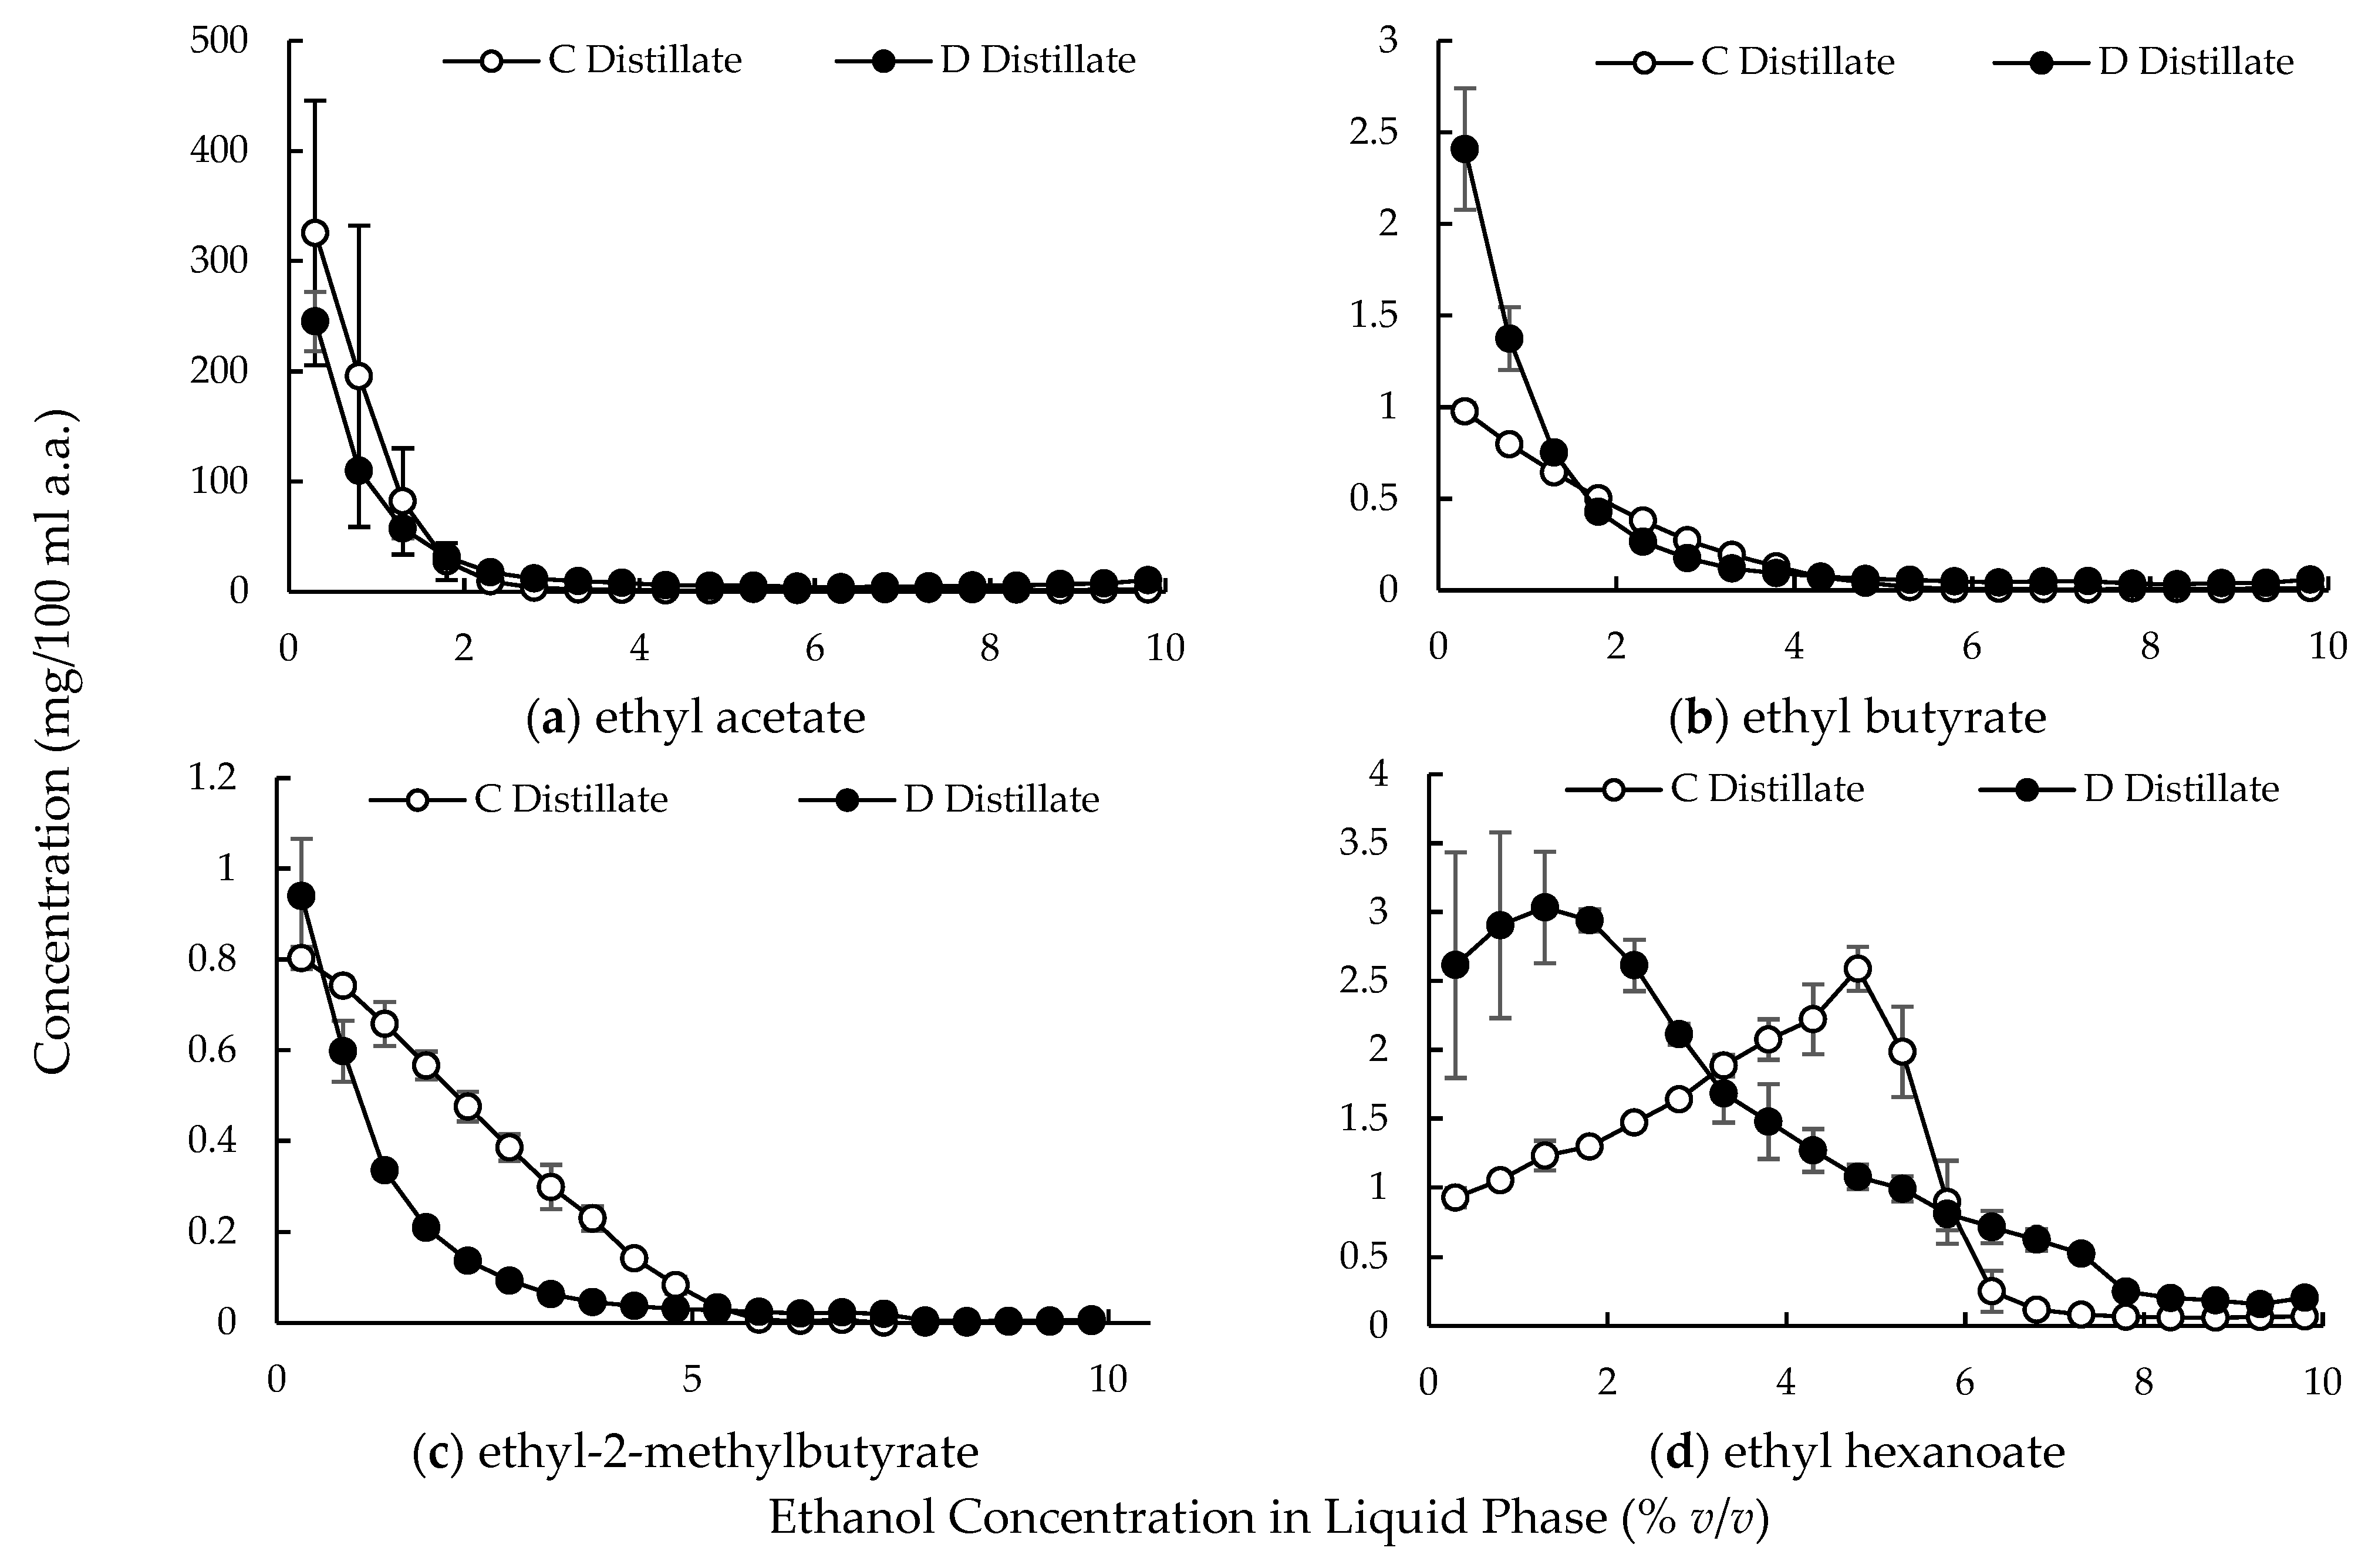
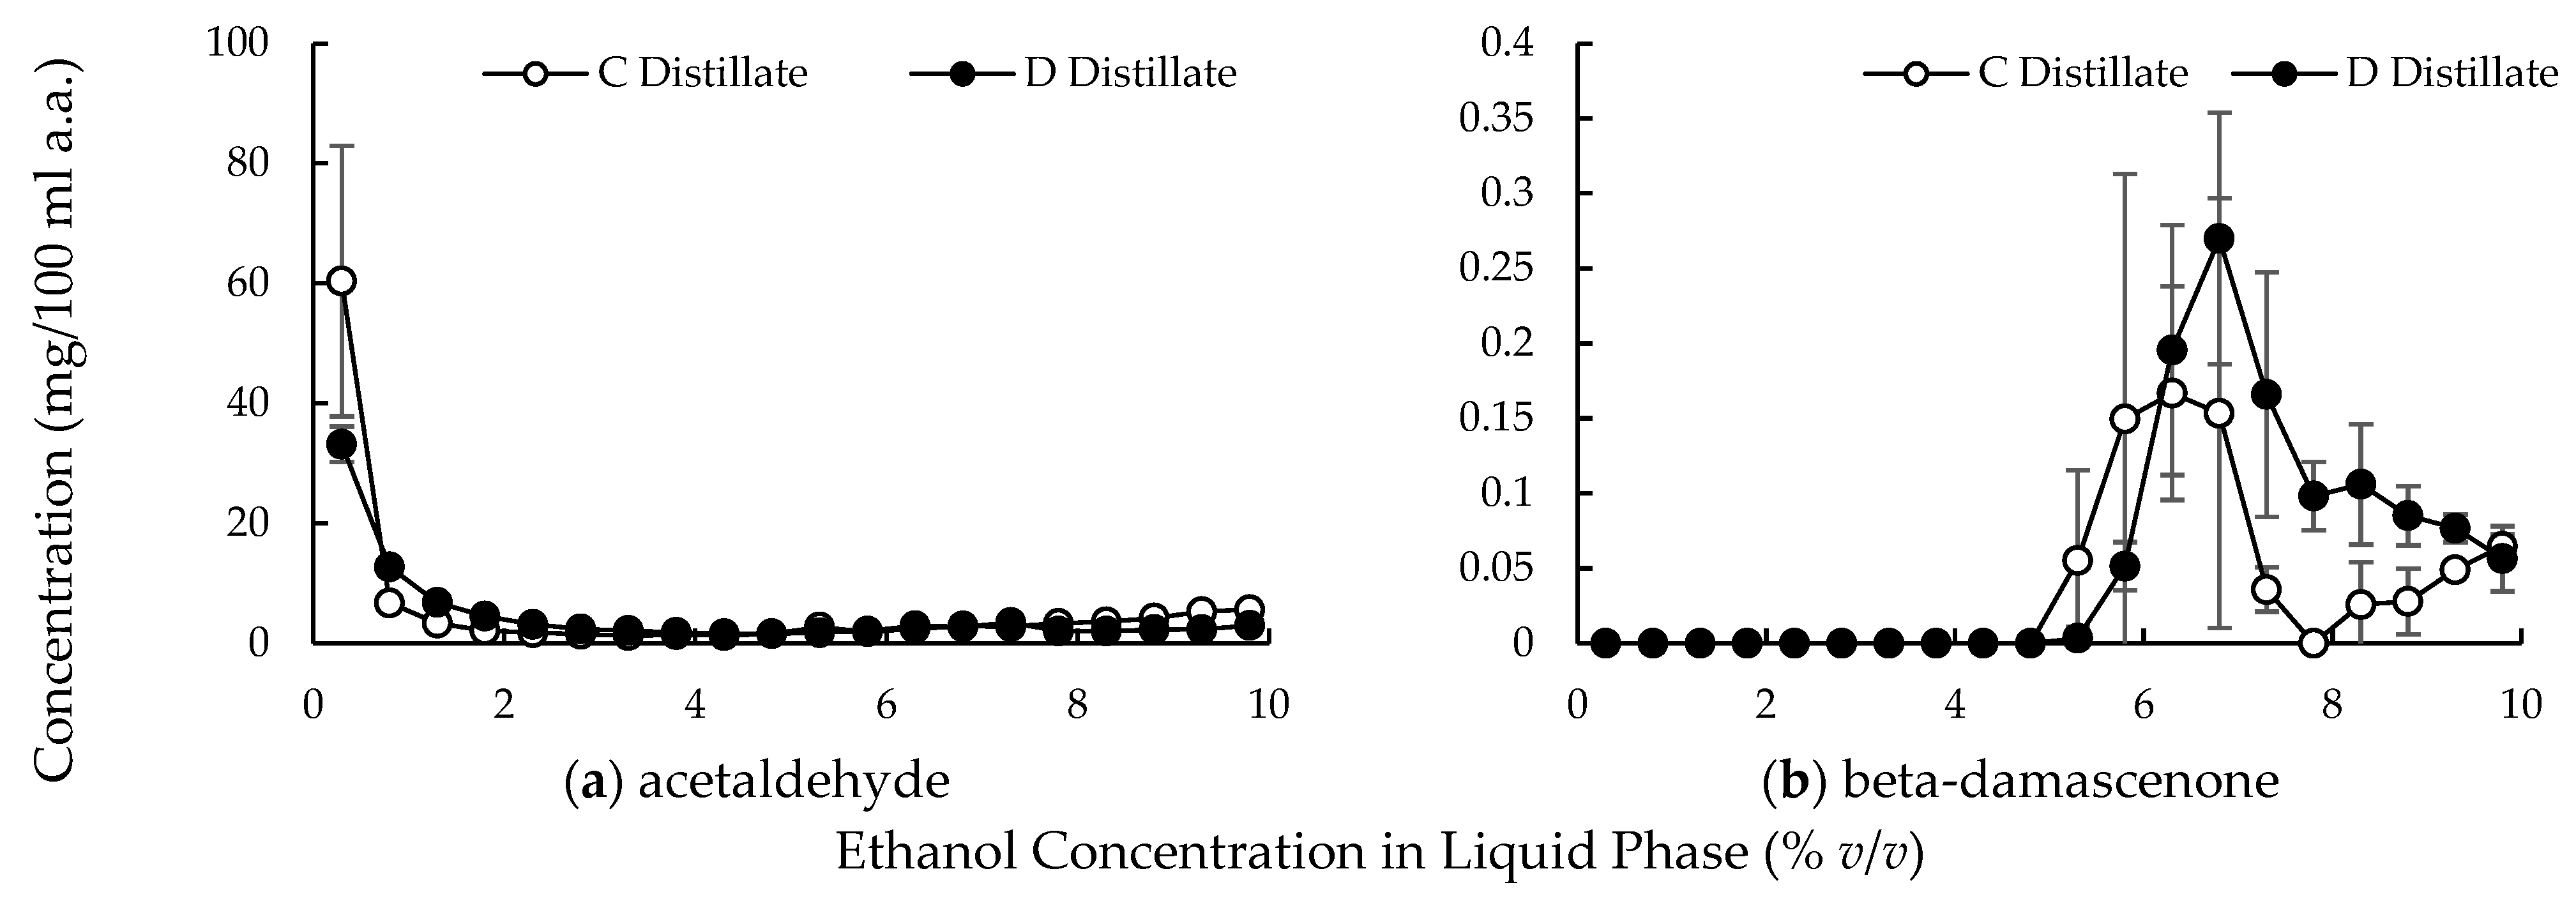
3.2. Large-Scale Experiments

Distillations were performed with fruit brandy equipment of different designs (see Materials & Methods). The ethanol concentrations (% (v/v)) in the samples collected during the C and D distillations as a function of the cumulative amount of distillate (in liters) are shown Figure 6. In the C distillation, the ethanol concentration started at approximately 80% (v/v), soon increased to 90% (v/v), and remained stable until around 6 L of distillate were collected, after which it declined sharply. The ethanol concentration on the top tray initially increased, peaking at about 80% (v/v) with 2 L collected. Despite an early decline in ethanol concentration on the top tray, the distillate maintained a high ethanol concentration for some time thereafter because of the dephlegmator’s effectiveness in sustaining ethanol levels even as the top tray concentration decreased. This efficiency was further evident in the D distillation, which maintained a high ethanol concentration, close to 90% (v/v), for a longer duration than the C distillation. The D distillation setup, featuring four dephlegmators without trays, clearly demonstrated the significant impact of dephlegmators in enhancing ethanol concentrations. These observations align with the data from the lab-scale dephlegmator, where a minimal condensation of ethanol molecules was observed (Figure 2).
Figure 7 presents the concentrations of six alcohols in the distillate fractions from the C and D distillations. Methanol was consistently detected in all fractions throughout both distillation processes, with concentrations in the D distillation consistently lower than those observed in the C distillation (Figure 7a). A distinctive increase in methanol concentration was observed toward the end of both processes, with this effect being more pronounced in the C distillation. Methanol peaks would have been expected in the early to middle phases of large-scale distillations, considering that the relative volatility of methanol shows a clear upward trend with increasing ethanol concentration in the liquid phase (Figure 3a). However, this anticipated outcome was not reflected in the actual data.
Methanol possesses distinct chemical properties, including strong hydrogen bonding capabilities and significant polarity. These characteristics, combined with its tendency to form azeotropes, complicate its separation during distillation, leading to inconsistencies between expected and observed methanol concentrations in distillates, despite the data from the lab-scale dephlegmator.
The consistently higher methanol concentration in the C distillation compared with the D distillation suggests that the total amount of methanol produced in the C distillation was greater. This difference likely resulted from the longer fermentation time of the fruit mash used in the C distillation, which was due to a technical issue that caused a delay in the planned distillations. Methanol is formed exclusively through the enzymatic hydrolysis of the methoxyl groups in pectins during fermentation [12]. The extended fermentation period allowed for more extensive hydrolysis of pectins, leading to increased methanol production in the mash.
The five alcohols, 1-propanol (Figure 7b), 2-methyl-1-propanol (Figure 7c), 3-methyl-1-butanol (Figure 7d), 2-methyl-1-butanol (Figure 7e), and 1-hexanol (Figure 7f), exhibited a similar behavior, with peaks appearing in both distillation profiles during the later phase, specifically between 5.5 and 6.5 L of cumulative distillate collected. The D distillation, however, demonstrated different behavior than the C distillation. In the earlier phases of distillation, when the heart fractions of the distillate were collected, the concentration of the fusel alcohols in the D distillations was generally higher than in the C distillations (especially for 2-methyl-1-propanol (Figure 7c)), resulting in broader peaks, as opposed to the sharper peaks observed in the C distillation. This trend was consistently observed across all five fusel alcohols.
Figure 8 displays the concentrations of four esters in the distillate fractions from C and D distillations. Ethyl butyrate (Figure 8b) and ethyl-2-methylbutyrate (Figure 8c) exhibited similar behavior during distillation, with their concentrations peaking at the very beginning. The peaks were sharper in the D distillation than in the C distillation. Ethyl acetate also peaked early in both distillations; however, no significant difference was observed between the D and C distillations (Figure 8a). In contrast, ethyl hexanoate behaved differently from the other esters, with its concentration peak occurring later, around 1 L in the D distillation and 5 L in the C distillation (Figure 8d). This indicates that ethyl hexanoate was less volatile than the other esters. This observation is consistent with the relative volatility data from the lab-scale dephlegmator (Figure 4d).
Acetaldehyde and beta-damascenone concentrations were measured during the C and D distillations (Figure 9). Acetaldehyde exhibited peaks early in the distillation process, reflecting its high volatility (Figure 9a). In contrast, beta-damascenone showed a behavior similar to long-chain alcohols, with its peak concentration occurring later in the process, at around 7 L of cumulative distillate (Figure 9b). The differences in the two distillation profiles were not clearly reflected in the data, likely because of the extreme volatility of acetaldehyde and the relatively large standard deviations for beta-damascenone, which resulted from their low concentrations in the samples.

3.3. Yields of Hearts and Tails Fractions from C and D Distillations

An experienced distiller sniffed distillate samples and identified the starting points of the hearts and tails fractions for both the C and D distillations (Table 2). The hearts fractions started at similar sample numbers, 6.5 for C and 7.0 for D, while the tails fraction began at sample 53 for C and 45.5 for D. The statistical test showed that the yield of heart fractions in the D distillation was significantly lower than that in the C distillation (p < 0.05).

3.4. Sensory Evaluation

The results of the sensory evaluation are presented in Table 3 and Table 4, comparing hearts fractions from the C and D distillations from two groups of participants. The triangle test revealed a statistically significant difference between the samples (p < 0.01), with 31 correct answers out of 57 participants in total. However, the preference test showed no statistical significance, with 15 participants preferring the C sample and 16 favoring the D sample in total. This suggests that while participants could detect a difference between the two samples, there was no clear preference for one over the other.

4. Discussion

4.1. Complex Condensation Behavior in the Lab-Scale Dephlegmator

The compounds entering the lab-scale dephlegmator with the vapor stream are subjected to selective condensation, i.e., they are condensed to different degrees. The degree of condensation was particularly high for water molecules (Figure 2). This phenomenon is primarily driven by water’s low volatility, which creates conditions in the dephlegmator that preferentially facilitate the condensation of water molecules.
To investigate the influence of the dephlegmator on the composition of the distillate, the relative volatilities of different aroma compounds with respect to ethanol were determined. For most of the compounds, the relative volatility was reduced over the whole range of ethanol concentrations when the dephlegmator was used. This means that these compounds are condensed in the dephlegmator to a higher degree than ethanol. Alcohols, being polar because of their hydroxyl (-OH) groups, are capable of forming hydrogen bonds, which enhanced their condensation in the dephlegmator (Figure 3). Esters and ketones, through dipole–dipole interactions and Van der Waals forces, also exhibited increased condensation in the dephlegmator compared with ethanol (Figure 4 and Figure 5b). This behavior can be explained by their boiling points and molecular weights, as higher alcohols, esters, and ketones generally have higher boiling points and molecular weights, particularly with longer carbon chains, which favor condensation. This observation is consistent with findings from several studies, which highlight how intermolecular interactions, such as hydrogen bonding and acid–base ion pairs, significantly enhance condensation and reduce evaporation [13,14,15].
Two compounds, methanol (Figure 3a) and ethyl acetate (Figure 4a), showed a higher relative volatility with respect to ethanol with the dephlegmator, i.e., they had a lower tendency to condense in the dephlegmator than ethanol. For methanol, this can be explained by the lower molecular weight (32.04) and the lower boiling point (64.7 °C); for ethyl acetate this could be due to a lack of hydrogen bond formation. For acetaldehyde, the dephlegmator had no effect on the relative volatility with respect to ethanol (Figure 5a); the reason could be that both molecules have basically the same size.
However, the vapor within the dephlegmator represents a complex system where interactions among various compounds with differing volatilities occur. Consequently, the molecular weights, boiling points, and intermolecular interactions of pure substances alone are insufficient to fully explain the behavior of compounds within a mixture. Ethyl acetate, despite having a relatively high molecular weight, has a reduced tendency to condense, illustrating this complexity. Nonetheless, the fundamental properties of molecules provide a baseline that explains the general tendencies of compound behavior within the mixture in the dephlegmator.

4.2. Compound Behavior in the Distillation Column with Multiple Dephlegmators

Key observations from the D distillation include the broader peaks exhibited by fusel alcohols, in contrast to the sharper peaks observed in the C distillation (Figure 7). Ethyl butyrate (Figure 8b) and ethyl-2-methylbutyrate (Figure 8c) displayed distinctive and sharp concentration peaks at the very beginning of the D distillation, in contrast to the more gradual peaks observed in the C distillation. Additionally, the peak of ethyl hexanoate occurred much earlier in the D distillation, at 1 L of cumulative distillate, whereas it peaked at 5 L in the C distillation (Figure 8d). These observations suggest higher volatilities of those compounds in the D distillations than in the C distillations.
This result seems to be at odds with the lab-scale experiment, where dephlegmation reduced the relative concentration of fusel alcohols and three esters (ethyl butyrate, ethyl-2-methylbutyrate, and ethyl hexanoate) in the distillate. Thus, the situation in the D device appears to be more complex. Apparently, we see a combination of evaporation and condensation effects. In addition to condensation, a countercurrent flow of vapors and liquid also exists in the D device. Thus, the enrichment section in the D device in part also acts like trays in a conventional system, but with a lower efficiency. The enrichment of ethanol through evaporation appears to have been lower than in the conventional system with three trays. This lower ethanol concentration could have been due to the selective condensation of water molecules as observed in the lab-scale experiments (Figure 2). At lower ethanol concentrations, the volatility of the fusel alcohols was much higher than the volatility of ethanol, whereas at higher ethanol concentrations (in the range of 35–45% (v/v)), the fusel alcohols switched sides, i.e., the relative volatility became lower than 1 (Figure 3) and they were retained in the system. Interestingly, 2-methyl-1-propanol showed the highest enrichment in the first 5 L of the D distillates compared with the C distillates. This compound switched sides (relative volatility = 1) at the highest ethanol concentration value of all fusel alcohols tested (45% (v/v)) (Figure 3c). Thus, we suspect that the ethanol concentration of the liquid that gives rise to the vapors in the last dephlegmation system is around 40% (v/v). At this concentration, the volatility of 2-methyl-1-propanol would still be high, while the volatility of the other fusel alcohols would be low. The dephlegmator reduces some of these compounds in the collected distillate by selective condensation, but this effect cannot completely compensate for the lack of retention achieved by trays.
This theory aligns well with the observed behavior of esters. Because of the consistently high relative volatilities of ethyl butyrate and ethyl-2-methylbutyrate across all ethanol concentrations (relative volatility > 1) (Figure 4b,c), these compounds appeared prominently at the beginnings of both the C and D distillation processes (Figure 8b,c). However, the peaks in the D distillation were sharper than those in the C distillation. This difference was attributed to their relative volatilities peaking at an ethanol concentration of 40% (v/v), resulting in higher volatility in the D distillation. In contrast, ethyl hexanoate exhibited lower volatility than other esters (Figure 4d), with its volatility switching sides (relative volatility = 1) at high ethanol concentrations in the liquid phase (60% (v/v)). With an estimated 40% (v/v) ethanol concentration in the D device, the volatility of ethyl hexanoate would be elevated, while at the higher ethanol concentration found in the C device, its volatility would be reduced. This discrepancy explains the distinctive peak shift observed between the two distillation profiles for ethyl hexanoate.
Ethyl acetate (Figure 8a) and acetaldehyde (Figure 9a) showed no significant differences between the C and D distillations, likely because of their extremely high relative volatility at moderate to high ethanol concentrations (Figure 4a and Figure 5a), which were the most influential ethanol concentration ranges in the distillation process. The reduction in ethanol concentration in the D distillation did not significantly impact the relative volatility of these compounds, resulting in similar behavior across both distillation setups.
Another reason for the higher relative volatilities of these compounds is the high temperature of the cooling water in the dephlegmators. In large-scale fruit brandy production, cooling water in dephlegmators is at room temperature at the beginning but gradually rises as vapor passes through the column, eventually reaching nearly 100 °C by the end of the process. The high temperature of the cooling water during the collection of the tails fractions reduces the condensation effects of the dephlegmators; thus, the tails fractions from the D distillation showed higher concentrations of fusel alcohols than those from the C distillation. These factors explain in part the broader peaks and higher fusel alcohol concentrations observed in the D distillation.

Author Contributions

Conceptualization, investigation, and writing, M.Y.; investigation, O.R.; investigation, D.A.; supervision and editing, R.K.; funding acquisition and project administration, D.E. All authors have read and agreed to the published version of the manuscript.

Funding

This IGF Project of the FEI was supported by AiF within the program for promoting the Industrial Collective Research (IGF) of the German Ministry of Economic Affairs and Energy (BMWi), based on a resolution of the German Parliament, grant number AiF 21620 N.

Institutional Review Board Statement

Ethical review and approval were waived for this study, due to the ethics committee members unanimously agree that this project clearly has no ethical concerns.

Informed Consent Statement

Informed consent was obtained from all subjects involved in the study.

Data Availability Statement

All data generated or analyzed during this study are included in this published article.

Acknowledgments

The authors are grateful for support from Lars Urhahn.

Conflicts of Interest

The authors declare no conflict of interest.

Appendix A

Table A1. Average sampling duration for lab-scale dephlegmator experiments (n = 3).
Ethanol Concentration (% v/v)Sampling Duration (s)
5735 ± 94
15422 ± 45
25364 ± 35
35324 ± 25
45318 ± 46
55244 ± 18
65186 ± 14
75204 ± 27
85156 ± 28

References

  1. Kockmann, N. 200 years in innovation of continuous distillation. Chem. Bio Eng. Rev. 2014, 1, 40–49. [Google Scholar] [CrossRef]
  2. Webber, A.H.; Bridger, L.G. Dephlegmator efficiency typical data and graphical calculation. Ind. Eng. Chem. 1938, 30, 315–318. Available online: https://pubs.acs.org/sharingguidelines (accessed on 14 May 2022). [CrossRef]
  3. Kent, R.E.; Pigford, L.R. Fractionation during condensation of vapor mixtures. AIChE J. 1956, 2, 363–371. [Google Scholar] [CrossRef]
  4. Röhm, J.H. Simulation of the unsteady state behaviour of the dephlegmation of binary vapour mixtures. Lett. Heat Mass Transf. 1978, 5, 307–314. [Google Scholar] [CrossRef]
  5. Röhm, J.H. The simulation of steady state behavior of the dephlegmation of multi-component mixed vapours. Int. J. Mass Transf. 1980, 23, 141–146. [Google Scholar] [CrossRef]
  6. Wang, J.; Smith, R. Dephlegmator design in low temperature gas separation. Chem. Eng. Res. Des. 2005, 83, 1133–1144. [Google Scholar] [CrossRef]
  7. Matias-Guiu, P.; Rodríguez-Bencomo, J.J.; Orriols, I.; Pérez-Correa, R.J.; López, F. Floral aroma improvement of Muscat spirits by packed column distillation with variable internal reflux. Food Chem. 2016, 213, 40–48. [Google Scholar] [CrossRef] [PubMed]
  8. Rodríguez-Bencomo, J.J.; Pérez-Correa, R.J.; Orriols, I.; López, F. Spirit distillation strategies for aroma improvement using variable internal column reflux. Food Bioprocess Technol. 2016, 9, 1885–1892. [Google Scholar] [CrossRef]
  9. Yagishita, M.; Kölling, R.; Einfalt, D. Introducing a simple method to investigate relative volatilities of flavour compounds in fruit brandies. Beverages 2023, 9, 32. [Google Scholar] [CrossRef]
  10. Heller, D.; Einfalt, D. Reproducibility of fruit spirit distillation processes. Beverages 2022, 8, 20. [Google Scholar] [CrossRef]
  11. Lei, Z.; Wang, H.; Zhou, R.; Duan, Z. Influence of salt added to solvent on extractive distillation. Chem. Eng. J. 2002, 87, 149–156. [Google Scholar] [CrossRef]
  12. Tsakiris, A.; Kallithraka, S.; Kourkoutas, Y. Grape brandy production, composition and sensory evaluation. J. Sci. Food Agric. 2014, 94, 404–414. [Google Scholar] [CrossRef] [PubMed]
  13. Kane, D.; Samy Ei-Shall, M. Condensation of supersaturated vapors of hydrogen bonding molecules: Ethylene glycol, propylene glycol, trimethylene glycol, and glycerol. J. Chem. Phys. 1996, 105, 7617–7631. [Google Scholar] [CrossRef]
  14. Zhao, J.; Khalizov, A.; Zhang, R.; McGraw, R. Hydrogen-bonding interaction in molecular complexes and clusters of aerosol nucleation precursors. J. Phys. Chem. A 2009, 113, 680–689. [Google Scholar] [CrossRef] [PubMed]
  15. Chen, J. Studies on the conformation, thermodynamics, and evaporation rate characteristics of sulfuric acid and amines molecular clusters. Results Chem. 2022, 4, 100527. [Google Scholar] [CrossRef]
Figure 1. Instrumentation diagram of the batch distillation setup equipped with four dephlegmators. (A): 120 L reboiler; (B): rectification column with four dephlegmators; (C): copper packing section (bypassed during all distillation runs in this study); (D): product cooler. Black lines: flow of distillate vapor; blue lines: flow of cooling water; green lines: water flow for cleaning the equipment.
Beverages 11 00052 g001
Figure 2. Vapor–liquid phase equilibrium data of ethanol and water mixtures (n = 3). The Reference Data (open circles), measured by means of extractive distillation, were adapted from Lei et al. [11] with permission from Elsevier B.V., © 2002. The Lab-Scale Dephlegmator data (black circles) were obtained in this study.
Beverages 11 00052 g002
Figure 3. Comparison of the relative volatility of alcohols as a function of the ethanol concentration in the liquid phase between lab-scale dephlegmator and reference data (n = 3). The datasets without the dephlegmator were taken from our previous work [9], © 2023 by the authors, published by MDPI. The dephlegmator data were measured using a lab-scale dephlegmator in this study. The measured compounds included (a) methanol, (b) 1-propanol, (c) 2-methyl-1-propanol, (d) 3-methyl-1-butanol, (e) 2-methyl-1-butanol, and (f) 1-hexanol.
Beverages 11 00052 g003
Figure 4. Comparison of the relative volatility of esters as a function of ethanol concentration in the liquid phase between the lab-scale dephlegmator and reference data (n = 3). The data without dephlegmator for ethyl hexanoate were newly determined using our previous method, while the other datasets without the dephlegmator were taken from [9], © 2023 by the authors, published by MDPI. The measured compounds included (a) ethyl acetate, (b) ethyl butyrate, (c) ethyl-2-methylbutyrate, and (d) ethyl hexanoate.
Beverages 11 00052 g004
Figure 5. Comparison of the relative volatility of aldehydes and ketones as a function of ethanol concentration in the liquid phase between the lab-scale dephlegmator and reference data (n = 3). The datasets without the dephlegmator were taken from our previous work [9], © 2023 by the authors, published by MDPI. The dephlegmator data were measured using a lab-scale dephlegmator in this study. The measured compounds included (a) acetaldehyde and (b) beta-damascenone.
Beverages 11 00052 g005
Figure 6. Ethanol concentrations in distillate fractions from the C and D distillations and top tray samples from the C distillations. Experiments performed in duplicate with triplicate measurements per sample (n = 2 × 3 = 6).
Beverages 11 00052 g006
Figure 7. Concentrations of alcohols in distillate fractions from the C and D distillations. Note: a.a. = anhydrous alcohol. Experiments performed in duplicate with triplicate measurements per sample (n = 2 × 3 = 6). The measured compounds included (a) methanol, (b) 1-propanol, (c) 2-methyl-1-propanol, (d) 3-methyl-1-butanol, (e) 2-methyl-1-butanol, and (f) 1-hexanol.
Beverages 11 00052 g007
Figure 8. Concentrations of esters in distillate fractions from the C and D distillations. Note: a.a. = anhydrous alcohol. Experiments performed in duplicate with triplicate measurements per sample (n = 2 × 3 = 6). The measured compounds included (a) ethyl acetate, (b) ethyl butyrate, (c) ethyl-2-methylbutyrate, and (d) ethyl hexanoate.
Beverages 11 00052 g008
Figure 9. Concentrations of aldehydes and ketones in distillate fractions from C distillations and D distillations. Note: a.a. = anhydrous alcohol. Experiments performed in duplicate with triplicate measurements per sample (n = 2 × 3 = 6). The measured compounds included (a) acetaldehyde and (b) beta-damascenone.
Beverages 11 00052 g009
Table 1. Physicochemical properties of compounds and their concentrations in hydroalcoholic solutions for lab-scale experiments.
Functional GroupCompoundConcentration in Solutions (mg/100 mL a.a. *)MW (g/mol)Boiling Point (°C)SupplierPurity (≥%)
alcoholmethanol130032.0464.7CARL ROTH, Karlsruhe, Germany99.9
1-propanol35060.197Merck, Darmstadt, Germany99.5
2-methyl-1-propanol7074.12108Fluka Chemie, Buchs, Schweiz99.5
3-methyl-1-butanol15088.15131Sigma-Aldrich Chemie, Taufkirchen Germany98.5
2-methyl-1-butanol5088.15129ROTH, Karls-ruhe, Germanyh97.5
1-hexanol15102.16157Fluka Chemie, Buchs, Schweiz99
aldehydeacetaldehyde8044.0520.2ROTH, Karls-ruhe, Germanyh99.5
esterethyl butyrate5116.16121Sigma-Aldrich ChemieSig-ma-Aldrich, Taufkirchen Germany99.5
ethyl hexanoate5144.21168Sigma-Aldrich ChemieSig-ma-Aldrich, Taufkirchen Germany99.0
ethyl-2-methylbutyrate5130.18133Sigma-Aldrich ChemieSig-ma-Aldrich, Taufkirchen Germany98
ethyl acetate50088.1177.1Sigma-Aldrich ChemieSig-ma-Aldrich, Taufkirchen Germany99.9
ketoneβ-damascenone5190.28116Sigma-Aldrich ChemieSig-ma-Aldrich, Taufkirchen Germany98
* a.a. = anhydrous alcohol.
Table 2. Sample numbers indicating the starting points of hearts and tails fractions across 100 distillate samples per distillation (n = 2).
FractionsStarting PointU
C distillationD distillation
Hearts6.5 ± 0.57.0 ± 00.5
Tails53 ± 045.5 ± 0.50 *
* Statistically significant at p < 0.05 by Mann–Whitney U test.
Table 3. Results of the triangle test between C hearts and D hearts.
ParticipantsCorrect AnswerWrong Answerχ2 Value
Group 1 a2815135.16 *
Group 2 a2916136.22 *
Triangle test total57312611.38 **
a Group 1 was provided with two C samples and one D sample, while Group 2 was provided with one C sample and two D samples. Statistically significant at * p < 0.05 and ** p < 0.01 by chi-squared (χ2) test.
Table 4. Results of the preference test between C hearts and D hearts.
Participants aC FavoredD Favoredχ2 Value
Group 1151051.67
Group 2165112.25
Preference test total3115163.92
a Only the participants who correctly identified the odd sample in the triangle test were included in the preference test. Statistically significant at p < 0.05 by chi-squared (χ2) test.
Disclaimer/Publisher’s Note: The statements, opinions and data contained in all publications are solely those of the individual author(s) and contributor(s) and not of MDPI and/or the editor(s). MDPI and/or the editor(s) disclaim responsibility for any injury to people or property resulting from any ideas, methods, instructions or products referred to in the content.

