
Development and Validation of an HPLC-DAD Method to Determine Alkylphenols in Milk


Highlights
- First validated use of Chem Elut S cartridges for alkylphenol extraction in milk
- The HPLC-DAD method achieved high linearity (R2>0.999), recoveries of 92–98%, and low LOD/LOQ values.
- This development provides a rapid, ecofriendly, and cost-effective routine method for food safety monitoring.
- Our method supports regulatory compliance and consumer protection against endocrine-disrupting contaminants in dairy products.
Abstract
1. Introduction
2. Materials and Methods
2.1. Solvents
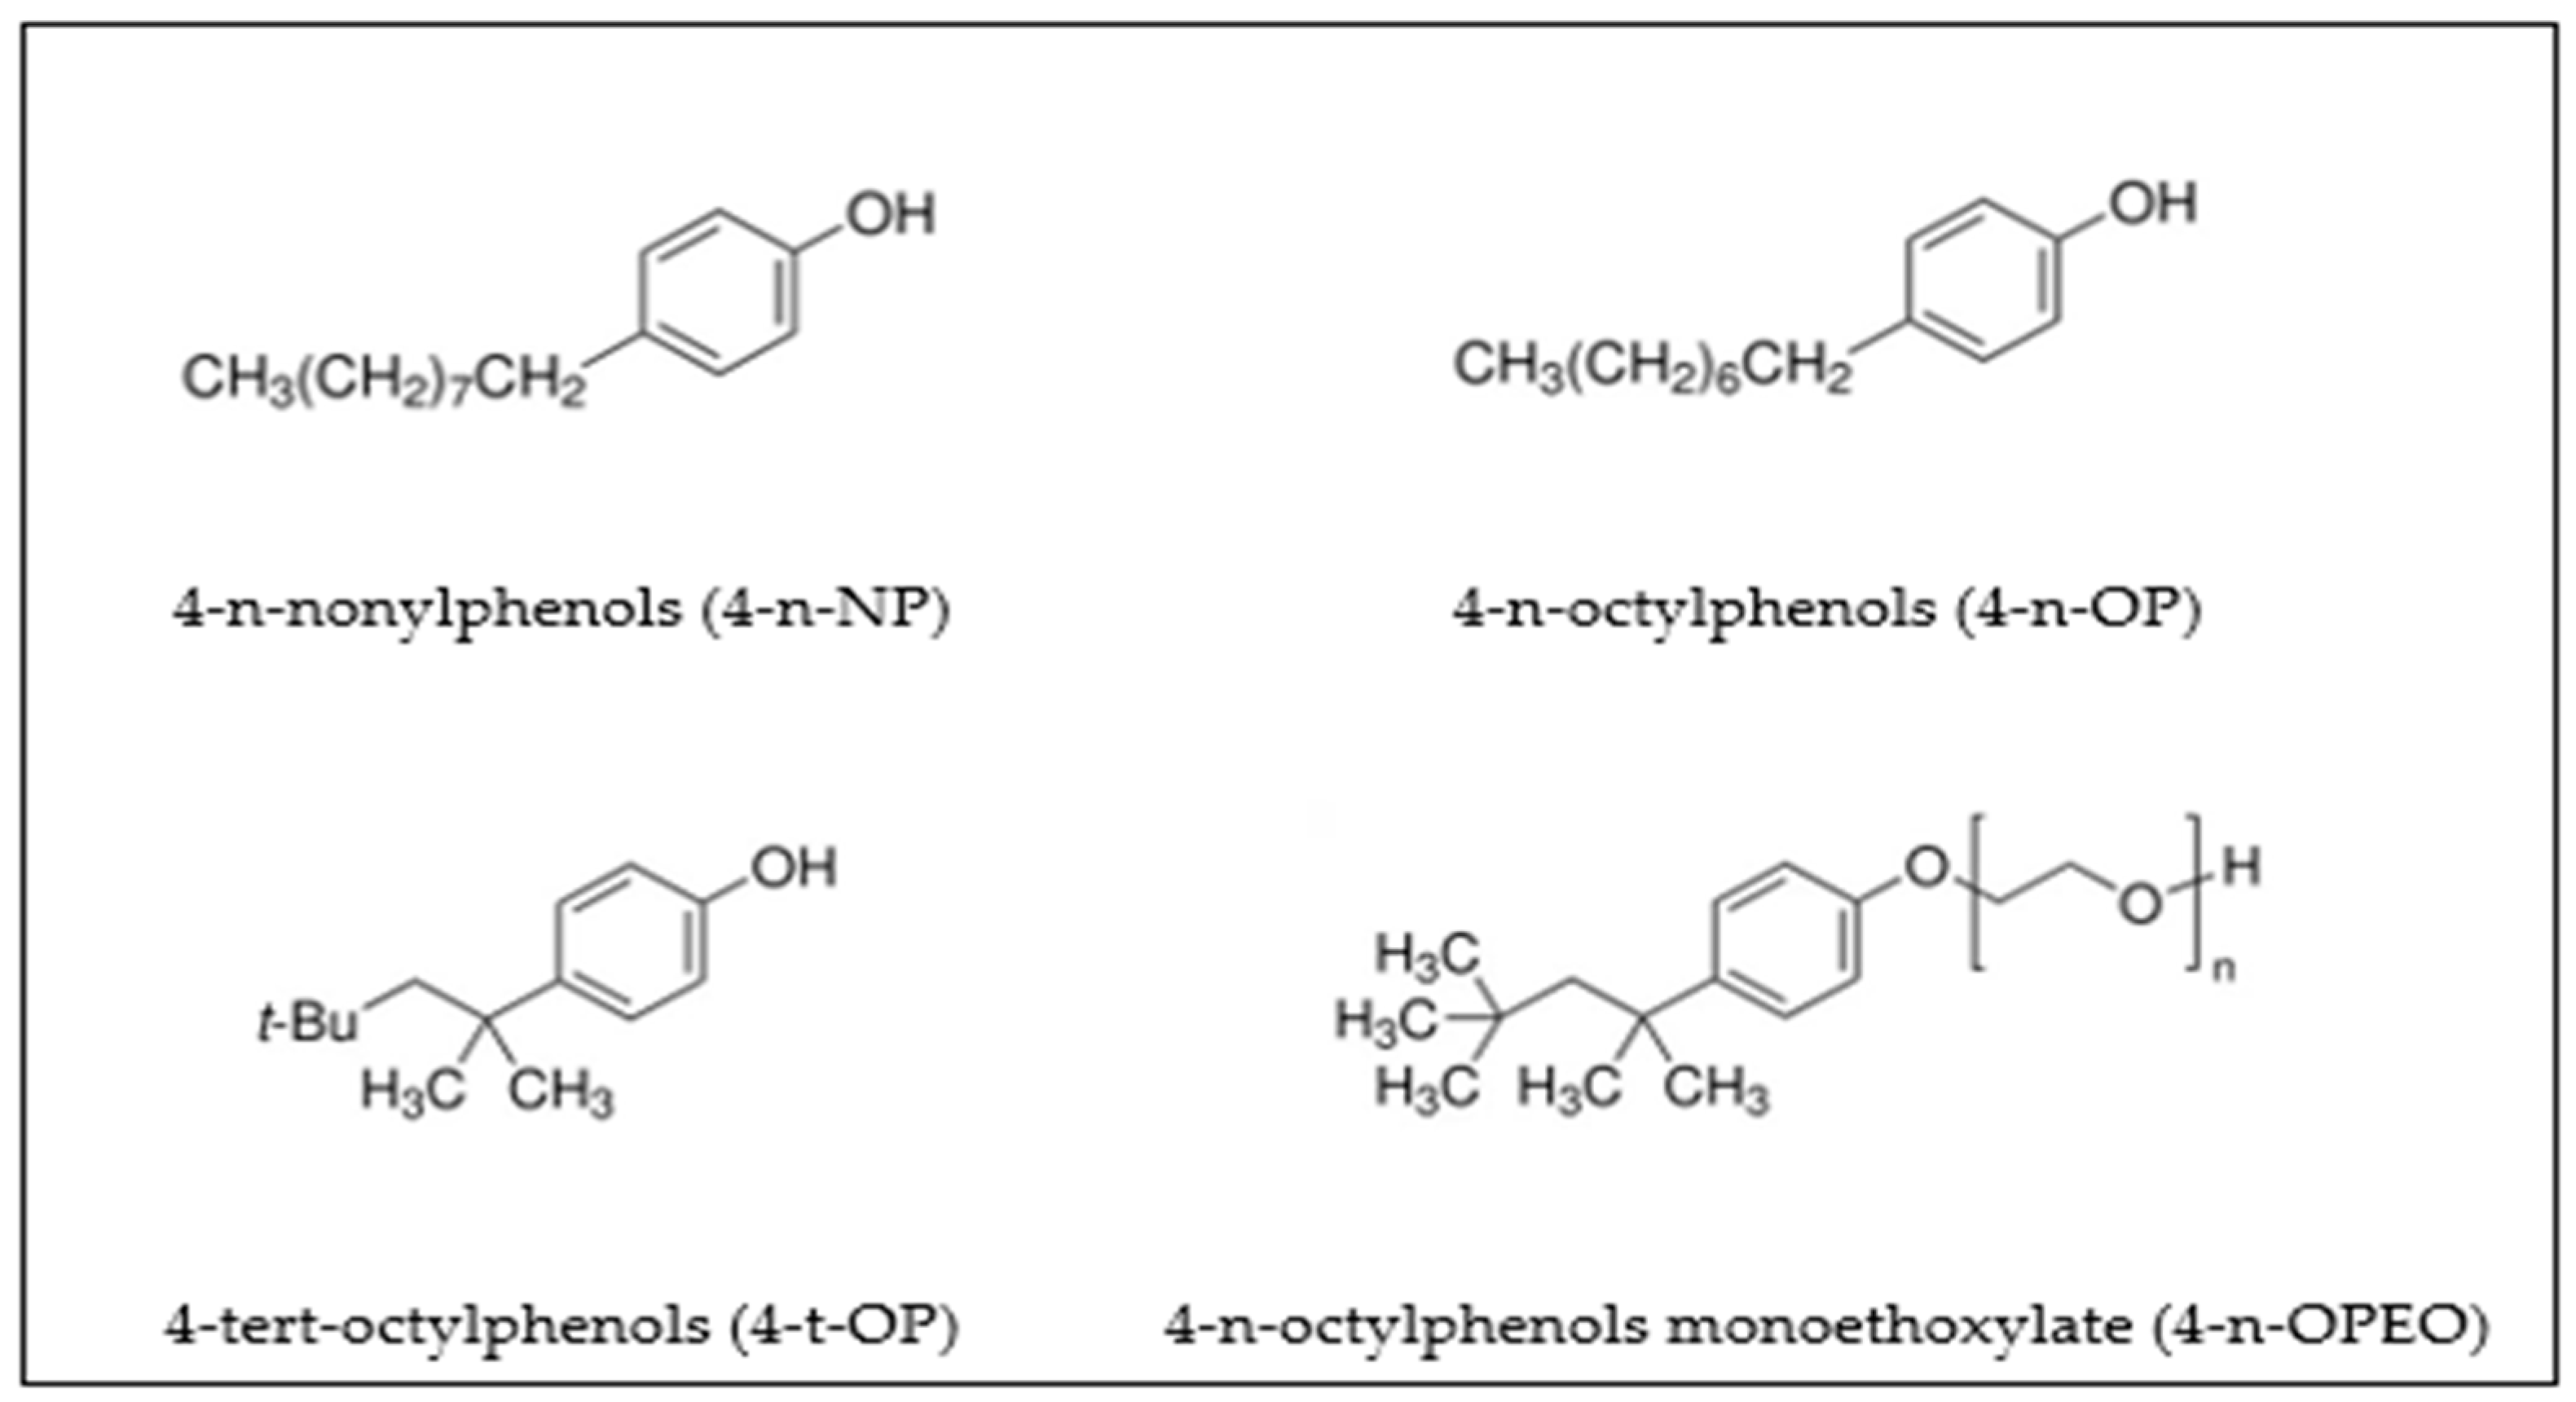
2.2. Analytical Standards
2.3. Apparatus
2.4. Sample
2.5. Sample Extraction and Cleanup with Chem Elut S Cartridge
2.6. HPLC (High-Performance Liquid Chromatography) Chromatography’s Parameters
2.7. Method Validation
2.7.1. Experimental Designs
2.7.2. Calibration Standards
2.7.3. Validation Standards
2.7.4. Matrix Effect
2.7.5. Limits of Detection (LOD) and Quantification (LOQ)
2.7.6. Trueness
- Xmeas = measured value
- Xexp = expected value
2.7.7. Precision
- S = sample standard deviation
- = sample mean
2.7.8. Uncertainty
2.8. Statistical Analysis
3. Results
3.1. Cleanup Procedure Optimization
3.2. Method Validation
3.2.1. Linearity
3.2.2. Matrix Effect
3.2.3. LOD and LOQ
3.2.4. Trueness
3.2.5. Precision
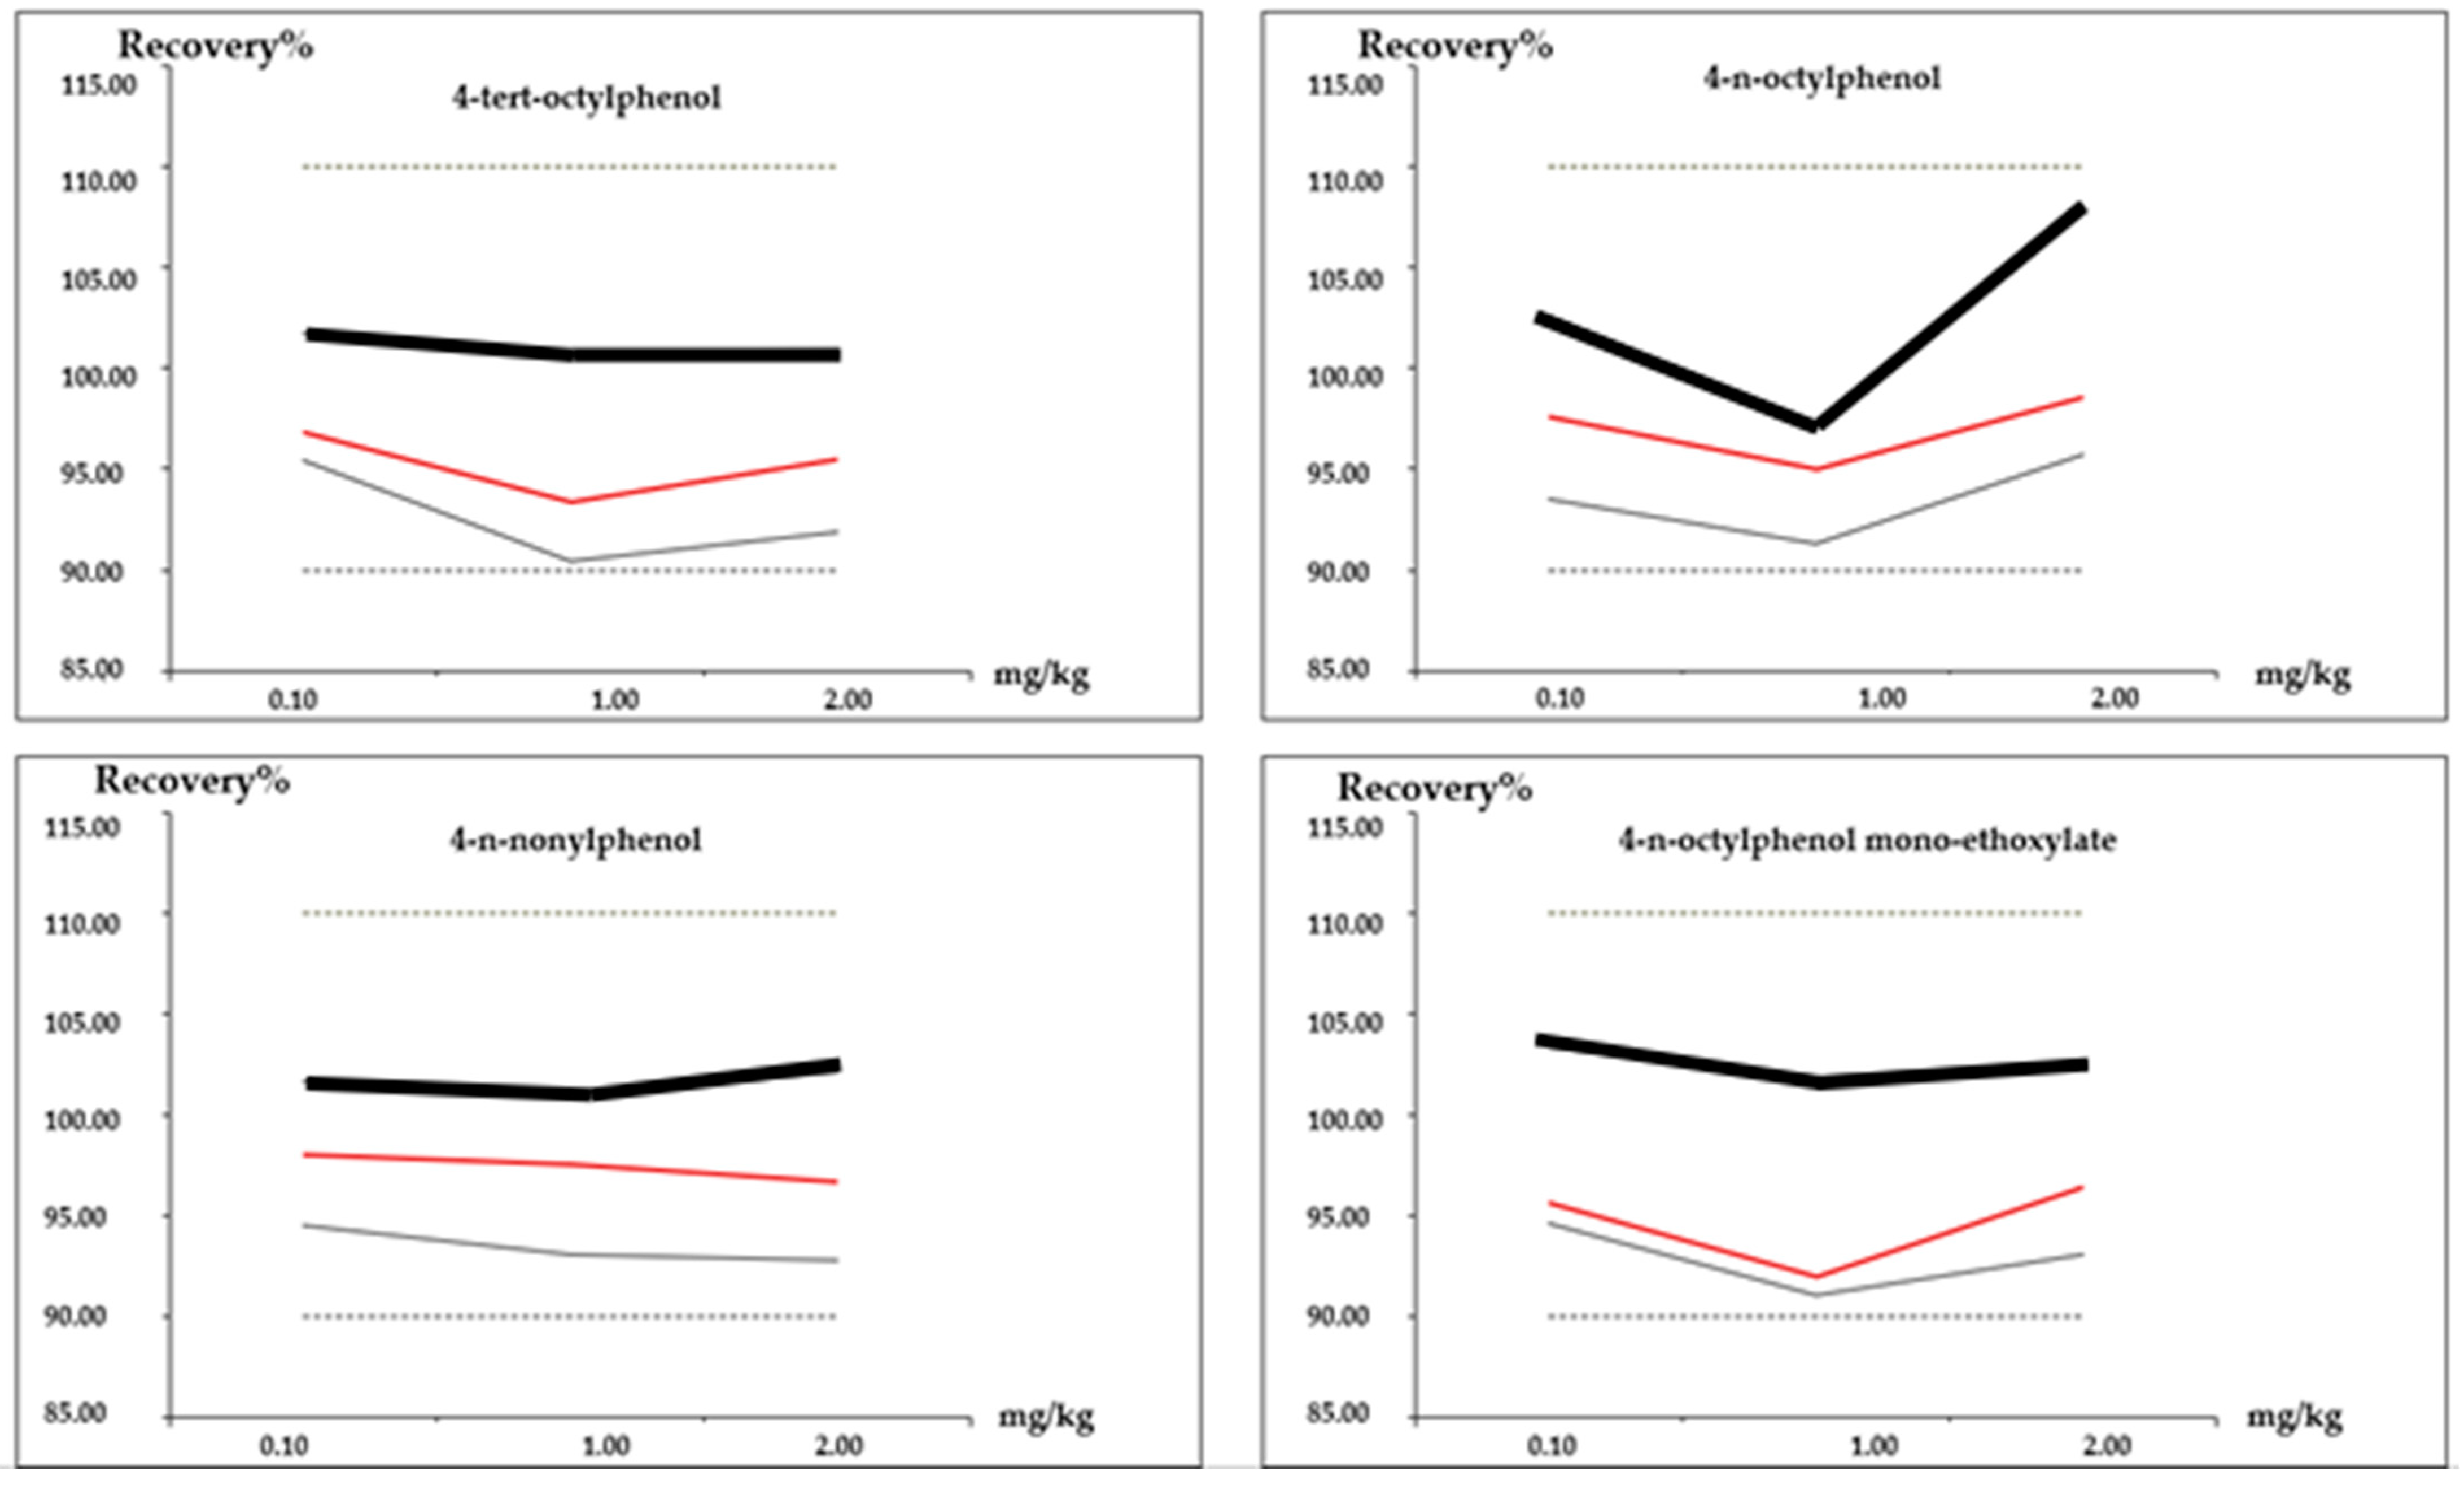
3.2.6. Accuracy
3.2.7. Uncertainty
4. Discussion
- X = result;
- Z = unknown “true” value.
5. Conclusions
Author Contributions
Funding
Institutional Review Board Statement
Informed Consent Statement
Data Availability Statement
Conflicts of Interest
References
- Scholz-Ahrens, K.E.; Ahrens, F.; Barth, C.A. Nutritional and health attributes of milk and milk imitations. Eur. J. Nutr. 2020, 59, 19–34. [Google Scholar] [CrossRef] [PubMed]
- United Nations Environment Programme. Secretariat of the Basel, Rotterdam and Stockholm Conventions; Chemicals in Plastics: A Technical Report; United Nations Environment Programme: Geneva, Switzerland, 2023; 128p, Available online: https://www.unep.org/resources/report/chemicals-plastics-technical-report (accessed on 14 October 2023).
- Seccia, S.; Albrizio, S.; Morelli, E.; Dini, I. Development and Validation of a High-Performance Liquid Chromatography Diode Array Detector Method to Measure Seven Neonicotinoids in Wheat. Foods 2024, 13, 2235. [Google Scholar] [CrossRef]
- Schiano, M.E.; Sodano, F.; Cassiano, C.; Magli, E.; Seccia, S.; Grazia Rimoli, M.; Albrizio, S. Monitoring of seven pesticide residues by LC-MS/MS in extra virgin olive oil samples and risk assessment for consumers. Food Chem. 2024, 442, 138498. [Google Scholar] [CrossRef] [PubMed]
- Weis, J.S.; Alava, J.J. (Micro)Plastics Are Toxic Pollutants. Toxics 2023, 11, 935. [Google Scholar] [CrossRef] [PubMed]
- Rejeesh, C.R.; Anto, T. Packaging of Milk and Dairy Products: Approaches to Sustainable Packaging. Mater. Today Proc. 2022, 72, 2946–2951. [Google Scholar] [CrossRef]
- Seccia, S.; Fattore, M.; Grumetto, L.; Albrizio, S. Bisphenols and Alkylphenols in Food: From Farm to Table. Curr. Anal. Chem. 2018, 14, 325–343. [Google Scholar] [CrossRef]
- Meng, W.; Sun, H.; Su, G. Plastic packaging-associated chemicals and their hazards—An overview of reviews. Chemosphere 2023, 331, 138795. [Google Scholar] [CrossRef]
- Zhang, K.; Wang, J.; Guo, R.; Nie, Q.; Zhu, G. Acid induce dispersive liquid–liquid microextraction based on in situ formation of hydrophobic deep eutectic solvents for the extraction of bisphenol A and alkylphenols in water and beverage samples. Food Chem. 2024, 442, 138425. [Google Scholar] [CrossRef]
- de Almeida, W.; Matei, J.C.; Kitamura, R.S.A.; Gomes, M.P.; Leme, D.M.; de Assis, H.C.S.; Vicari, T.; Cestari, M.M. Alkylphenols cause cytotoxicity and genotoxicity induced by oxidative stress in RTG-2 cell line. Chemosphere 2023, 313, 137387. [Google Scholar] [CrossRef]
- Salgueiro-González, N.; Muniategui-Lorenzo, S.; López-Mahía, P.; Prada-Rodríguez, D. Trends in analytical methodologies for the determination of alkylphenols and bisphenol A in water samples. Anal. Chim. Acta 2017, 962, 1–14. [Google Scholar] [CrossRef]
- Ahn, C.; Jeung, E.-B. Endocrine-Disrupting Chemicals and Disease Endpoints. Int. J. Mol. Sci. 2023, 24, 5342. [Google Scholar] [CrossRef] [PubMed]
- Markey, C.M.; Michaelson, C.L.; Sonnenschein, C.; Soto, A.M. Alkylphenols and Bisphenol A as environmental estrogens. In The Handbook of Environmental Chemistry. Part L, Endocrine Disruptors—Part I; Metzler, M., Ed.; Springer: Berlin/Heidelberg, Germany, 2001; Volume 3, pp. 129–153. [Google Scholar]
- Gautam, P.; Dubey, S.K. Biodegradation of Neonicotinoids: Current Trends and Future Prospects. Curr. Pollut. Rep. 2023, 9, 410–432. [Google Scholar] [CrossRef]
- Gea, M.; Toso, A.; Bentivegna, G.N.; Buganza, R.; Abrigo, E.; De Sanctis, L.; Schilirò, T. Oestrogenic Activity in Girls with Signs of Precocious Puberty as Exposure Biomarker to Endocrine Disrupting Chemicals: A Pilot Study. Int. J. Environ. Res. Public Health 2023, 20, 14. [Google Scholar] [CrossRef] [PubMed]
- Silva, A.B.P.; Carreiró, F.; Ramos, F.; Sanches-Silva, A. The role of endocrine disruptors in female infertility. Mol. Biol. Rep. 2023, 50, 7069–7088. [Google Scholar] [CrossRef]
- Schiano, M.E.; Sodano, F.; Cassiano, C.; Fiorino, F.; Seccia, S.; Rimoli, M.G.; Albrizio, S. Quantitative Determination of Bisphenol A and Its Congeners in Plant-Based Beverages by Liquid Chromatography Coupled to Tandem Mass Spectrometry. Foods 2022, 11, 3853. [Google Scholar] [CrossRef]
- Commission Regulation (EU). No 10/2011 on Plastic Materials and Articles Intended to Come into Contact with Food (EC) 1935/2004. Available online: https://eur-lex.europa.eu/legal-content/EN/TXT/HTML/?uri=CELEX:32011R0010 (accessed on 14 January 2021).
- Jia, X.X.; Yao, Z.Y.; Liu, S.; Gao, Z.X. Suspension array for multiplex immunoassay of five common endocrine disrupter chemicals. Microchim. Acta 2021, 188, 1–9. [Google Scholar] [CrossRef]
- Boti, V.; Kobothekra, V.; Albanis, T.; Konstantinou, I. QuEChERS-Based Methodology for the Screening of Alkylphenols and Bisphenol A in Dairy Products Using LC-LTQ/Orbitrap MS. Appl. Sci. 2021, 11, 9358. [Google Scholar] [CrossRef]
- Yu, Y.; Kuang, M.; Zheng, B.; Wang, M.; Liu, Z.; Xu, H.; Wang, J. Detection of multiple endocrine-disrupting chemicals in milk: Improved and safe high performance liquid chromatography tandem mass spectrometry method. J. Sep. Sci. 2022, 45, 1538–1549. [Google Scholar] [CrossRef]
- Chang, J.; Zhou, J.; Gao, M.; Zhang, H.; Wang, T. Research Advances in the Analysis of Estrogenic Endocrine Disrupting Compounds in Milk and Dairy Products. Foods 2022, 11, 3057. [Google Scholar] [CrossRef]
- Tang, J.W.; Wang, J.X.; Yuan, L.J.; Xiao, Y.; Wang, X.; Yang, Z. Trace analysis of estrogens in milk samples by molecularly imprinted solid phase extraction with genistein as a dummy template molecule and high-performance liquid chromatography-tandem mass spectrometry. Steroids 2019, 145, 23–31. [Google Scholar] [CrossRef]
- Qiao, L.; Sun, R.; Tao, Y.; Yan, Y. New low viscous hydrophobic deep eutectic solvents for the ultrasound-assisted dispersive liquid-liquid microextraction of endocrine-disrupting phenols in water, milk and beverage. J. Chromatogr. A 2022, 1662, 462728. [Google Scholar] [CrossRef] [PubMed]
- Huang, X.C.; Ma, J.K.; Wei, S.L. Preparation and application of a novel magnetic molecularly imprinted polymer for simultaneous and rapid determination of three trace endocrine disrupting chemicals in lake water and milk samples. Anal. Bioanal. Chem. 2020, 412, 1835–1846. [Google Scholar] [CrossRef]
- Yang, D.; Li, G.; Wu, L.; Yang, Y. Ferrofluid-based liquid-phase microextraction: Analysis of four phenolic compounds in milks and fruit juices. Food Chem. 2018, 261, 96–102. [Google Scholar] [CrossRef]
- Chammui, Y. Rapid analysis of some endocrine disruptor chemicals leaching from baby milk feeding bottles Using SPME and SDME techniques. Food Anal. Methods 2017, 10, 2607–2618. [Google Scholar] [CrossRef]
- Palacios Colón, L.; Rascón, A.J.; Ballesteros, E. Simultaneous determination of phenolic pollutants in dairy products held in various types of packaging by gas chromatography–mass spectrometry. Food Control 2023, 146, 109564. [Google Scholar] [CrossRef]
- Chen, G.-W.; Ding, W.-H.; Ku, H.-Y.; Chao, H.-R.; Chen, H.-Y.; Huang, M.-C.; Wang, S.-L. Alkylphenols in human milk and their relations to dietary habits in central Taiwan. Food Chem. Toxicol. 2010, 48, 1939–1944. [Google Scholar] [CrossRef] [PubMed]
- Bai, Y.; Hu, J.Y.; Liu, S.Z.; Zhang, W.Y.; Zhang, J.; He, J.; Li, P.D.; Li, X.H.; Jin, J.J.; Wang, Z.H. Production of antibodies and development of an enzyme-linked immunosorbent assay for 17β-estradiol in milk. Food Agric. Immunol. 2017, 28, 1519–1529. [Google Scholar] [CrossRef]
- Huang, Y.-F.; Huang, Y.-M.; Lee, H.-J. Simultaneous Analysis of Seven Neonicotinoids in Commercial Milk Samples Using an UHPLC-MS/MS Method. Appl. Sci. 2020, 10, 6775. [Google Scholar] [CrossRef]
- ISO/IEC 17025; Testing and Calibration Laboratories. ISO: Geneva, Switzerland. Available online: https://www.iso.org/ISO-IEC-17025-testing-and-calibration-laboratories.html (accessed on 6 November 2020).
- Aaziz, H.; Saffaj, T.; Benchekroun, Y.H.; Ihssane, B. Simultaneous Quantification of Two Neonicotinoids Using QuEChERS–LC–MS/MS in Moroccan Spearmint (Mentha Spicata L.): Qualimetry of the Method by Uncertainty Estimation Using Generalized Pivotal Quantities Approach and Monte Carlo Simulation. AOAC Inter. 2024, 107, 217–225. [Google Scholar] [CrossRef]
- Feinberg, M. Validation of analytical methods based on accuracy profiles. J. Chromatogr. A 2007, 1158, 174–183. [Google Scholar] [CrossRef]
- Hubert, P.; Nguyen-Huu, J.J.; Boulanger, B.; Chapuzet, E.; Cohen, N.; Compagnon, P.A.; Dewé, W.; Feinberg, M.; Laurentie, M.; Mercier, N.; et al. Harmonization of strategies for the validation of quantitative analytical procedures. A SFSTP proposal—Part III. J. Pharm. Biomed. Anal. 2007, 45, 82–96. [Google Scholar] [CrossRef]
- González, A.G.; Herrador, M.Á. A Practical guide to analytical method validation, including measurement uncertainty and accuracy profiles. Trends Anal. Chem. 2007, 26, 227–238. [Google Scholar] [CrossRef]
- Ouakhssase, A.; Fatini, N.; Ait Addi, E. Chemometric Approach Based on Accuracy Profile and Data Chronological Distribution as a Tool to Detect Performance Degradation and Improve the Analytical Quality Control for Aflatoxins’ Analysis in Almonds Using UPLC–MS/MS. ACS Omega 2021, 6, 12746–12754. [Google Scholar] [CrossRef] [PubMed]
- Ashraf, D.; Morsi, R.; Usman, M.; Meetani, M.A. Recent Advances in the Chromatographic Analysis of Emerging Pollutants in Dairy Milk: A Review (2018–2023). Molecules 2024, 29, 1296. [Google Scholar] [CrossRef]
- Sayon, D.R.S.; Fakih, A.; Mercier, F.; Kondjoyan, N.; Meurillon, M.; Ratel, J.; Engel, E. Targeted quantification and untargeted exploration of furan and derivatives in infant food by headspace extraction-gas chromatography-Q Exactive Orbitrap mass spectrometry. Food Res. Inter. 2024, 191, 114614. [Google Scholar] [CrossRef] [PubMed]
- Mancusi, A.; Seccia, S.; Izzi, A.; Coppola, D.; Tessieri, M.; Santini, A.; Dini, I. Chemometric Validation of a High-Performance Liquid Chromatography Method to Detect Ochratoxin A in Green Coffee. Beverages 2025, 11, 32. [Google Scholar] [CrossRef]
- Dini, I.; Seccia, S.; Senatore, A.; Coppola, D.; Morelli, E. Development and Validation of an Analytical Method for Total Polyphenols Quantification in Extra Virgin Olive Oils. Food Anal. Methods 2019, 13, 457–464. [Google Scholar] [CrossRef]
- Liu, J.; You, J.; Zhang, S.; Song, C.; Ji, Z.; Zhuang, J.; Yu, Y. New fluorescent labeling reagent Benzimidazo [2,1-b]quinazoline-12(6H)-one-5-ethylimidazole ester and its application in the analysis of endocrine disrupting compounds in milk by high performance liquid chromatography with fluorescence detection. Microchem. J. 2018, 138, 309–315. [Google Scholar] [CrossRef]
- Jalloul, A.B.; Ayadi, N.; Klai, A.; Abderrabba, M. Functionalization of Pasteurized Milk Using Rosemary, Thyme, and Ammoides Aqueous Extracts for Better Microbial Quality and an Improved Antioxidant Activity. Molecules 2022, 27, 3725. [Google Scholar] [CrossRef]
- Czarczyńska-Goślińska, B.; Grześkowiak, T.; Frankowski, R.; Lulek, J.; Pieczak, J.; Zgoła-Grześkowiak, A. Determination of bisphenols and parabens in breast milk and dietary risk assessment for Polish breastfed infants. J. Food Compos. Anal. 2021, 98, 103839. [Google Scholar] [CrossRef]
- Ohmuro, S.; Ishizaki, R.; Tsukamoto, M.; Nasu, S.; Yasui, T.; Takada, K.; Yuchi, A. Effects of residual silanol on solid phase extraction of organic compounds to octadecylsilyl silica. Anal. Sci. 2021, 37, 879–885. [Google Scholar] [CrossRef] [PubMed]


| APs | Slope | Intercept | R2 | Residuals (%) | Matrix Effect | |
|---|---|---|---|---|---|---|
| 4-tert-OP | solvent | 23,319 ± 0.001 | 618.5 ± 0.002 | 0.9997 | ±0.2 | 99.96 |
| matrix | 23,328 ± 0.003 | 508.4 ± 0.003 | 0.9990 | ±1.7 | ||
| 4-n-OPEO1 | solvent | 17,901 ± 0.002 | −273.5 ± 0.001 | 0.9997 | ±5.3 | 99.92 |
| matrix | 17,916 ± 0.003 | −250.2 ± 0.003 | 0.9991 | ±3.5 | ||
| 4-n-OP | solvent | 27,065 ± 0.001 | −355.5 ± 0.002 | 0.9996 | ±2.1 | 99.99 |
| matrix | 27,068 ± 0.004 | −346.8 ± 0.005 | 0.9994 | ±3.8 | ||
| 4-n-NP | solvent | 26,576 ± 0.002 | 133 ± 0.001 | 0.9998 | ±4.4 | 99.95 |
| matrix | 26,588 ± 0.004 | 120 ± 0.002 | 0.9996 | ±1.8 |
| APs | LOD (mg/Kg) | LOQ (mg/Kg) |
|---|---|---|
| 4-tert-OP | 0.0090 | 0.03 |
| 4-n-OPEO1 | 0.0090 | 0.03 |
| 4-n-OP | 0.015 | 0.05 |
| 4-n-NP | 0.0060 | 0.02 |
| Concentration (mg/Kg) | 4-tert-OP | 4-n-OPEO1 | 4-n-OP | 4-n-NP | |
|---|---|---|---|---|---|
| Trueness | 0.1 | −3.2 | −4.4 | −2.4 | −2.0 |
| (n = 3) | 1.0 | −6.6 | −8.0 | −5.0 | −2.4 |
| Relative bias (%) | 2.0 | −4.5 | −3.6 | −1.4 | −3.3 |
| Recovery (%) | 0.1 | 96.8 | 95.6 | 97.6 | 98.0 |
| 1.0 | 93.4 | 92.0 | 95.0 | 97.6 | |
| 2.0 | 95.5 | 96.4 | 98.6 | 96.7 | |
| Precision | 0.1 | 2.6 | 2.3 | 2.5 | 2.1 |
| (n = 3) | 1.0 | 1.5 | 1.0 | 1.8 | 1.7 |
| Repeatability (RSD%) | 2.0 | 1.1 | 2.6 | 2.7 | 3.0 |
| Precision | 0.1 | 3.9 | 3.5 | 3.8 | 3.2 |
| (n = 3) | 1.0 | 2.3 | 1.5 | 2.7 | 2.6 |
| Intermediate (RSD%) | 2.0 | 1.7 | 3.8 | 4.0 | 4.5 |
| Accuracy | 0.1 | −1.4; 5.0 | −1.0; 7.8 | −4.1; 4.9 | −3.5; 3.6 |
| (n = 3) | 1.0 | −3.0; 7.3 | −0.9; 9.8 | −3.7; 2.1 | −4.5; 3.4 |
| Tolerance limits β (%) | 2.0 | −3.6; 5.4 | −3.3; 6.2 | −2.9; 9.5 | −3.2; 5.3 |
| Uncertainty | 0.1 | 6.8 | 5.6 | 7.2 | 8.8 |
| (n = 3) | 1.0 | 8.2 | 6.6 | 11.0 | 9.1 |
| Relative expanded uncertainty (%) | 2.0 | 9.7 | 5.5 | 6.5 | 7.4 |
Disclaimer/Publisher’s Note: The statements, opinions and data contained in all publications are solely those of the individual author(s) and contributor(s) and not of MDPI and/or the editor(s). MDPI and/or the editor(s) disclaim responsibility for any injury to people or property resulting from any ideas, methods, instructions or products referred to in the content. |
© 2025 by the authors. Licensee MDPI, Basel, Switzerland. This article is an open access article distributed under the terms and conditions of the Creative Commons Attribution (CC BY) license (https://creativecommons.org/licenses/by/4.0/).
Share and Cite
Seccia, S.; Dini, I. Development and Validation of an HPLC-DAD Method to Determine Alkylphenols in Milk. Beverages 2025, 11, 59. https://doi.org/10.3390/beverages11030059
Seccia S, Dini I. Development and Validation of an HPLC-DAD Method to Determine Alkylphenols in Milk. Beverages. 2025; 11(3):59. https://doi.org/10.3390/beverages11030059
Chicago/Turabian StyleSeccia, Serenella, and Irene Dini. 2025. "Development and Validation of an HPLC-DAD Method to Determine Alkylphenols in Milk" Beverages 11, no. 3: 59. https://doi.org/10.3390/beverages11030059
APA StyleSeccia, S., & Dini, I. (2025). Development and Validation of an HPLC-DAD Method to Determine Alkylphenols in Milk. Beverages, 11(3), 59. https://doi.org/10.3390/beverages11030059