Abstract
Pathogenic bacteria surviving acidic conditions in foods pose a persistent public health risk, with acid adaptation potentially enhancing their virulence in low-pH environments like fruit juices. In this study, we hypothesized that foodborne bacteria exhibit enhanced survival and pathogenic potential in fruit juice after undergoing prior acid adaptation. Thus, our aim was to investigate the pathogenic potential and survival of acid-adapted Salmonella Enteritidis and Escherichia coli O157:H7 in orange juice. Cells were acid-adapted by cultivation in a glucose-rich medium, resulting in an increase in bacterial populations from 3.0–3.1 to 8.7–9.0 log10 CFU/mL, compared to non-acid-adapted controls. After 2 days at the common temperature storage of the fruit juices (4 °C), the acid-adapted S. Enteritidis and E. coli survived at higher levels in orange juice compared to non-acid-adapted populations (differences of around 1.7 log units between both). Finally, acid-adapted bacteria showed greater survival during passage through simulated gastrointestinal tract conditions, indicating increased pathogenic potential. Regarding the pathogenic potential, acid-adapted E. coli O157:H7 showed an adhesion capability of around 3.5 times higher in comparison with non-acid-adapted E. coli O157:H7. These results highlight the importance of considering the adaptability of foodborne bacteria to acidic conditions in food safety and security studies.
1. Introduction
Foodborne illnesses continue to pose a significant threat to public health worldwide, with hundreds of cases reported annually [1]. In recent years, the consumption of non-pasteurized or minimally processed orange juices has increased due to consumer demand for products with fresh-like qualities [2,3]. However, the absence of thermal treatments capable of eliminating potential foodborne pathogens makes these beverages a potential risk to consumer health [4]. Orange juice typically exhibits a pH ranging from 3.2 to 3.9 and contains antimicrobial substances naturally occurring in fruits and vegetables, such as citric or ascorbic acid [5]. Despite these characteristics, several studies have demonstrated that acid-tolerant pathogens such as Salmonella Enteritidis and Eschericha coli can survive in this acidic environment, highlighting the importance of evaluating their persistence and potential virulence under such conditions [6,7,8]. This persistence is largely attributed to their capability for acid adaptation, a phenomenon characterized by the ability of bacteria to endure acidic conditions through genetic and physiological adaptations [9,10].
The process of acid adaptation involves intricate molecular mechanisms that allow pathogens to sense and respond to changes in pH, thereby modulating gene expression and cellular functions to enhance survival [11]. Key adaptations include the upregulation of acid resistance systems, such as the Acid Tolerance Response (ATR), which involves the induction of specific genes encoding proteins, transporters, and enzymes involved in pH homeostasis and protection against acid-induced damage. Furthermore, acid-adapted pathogens may undergo structural changes in their cell envelope, altering membrane composition and permeability to counteract the deleterious effects of acidic stress [12]. These adaptive responses not only promote survival but also sustain the pathogenic potential of these organisms, enabling them to initiate infections and cause disease upon ingestion [13,14].
Understanding the pathogenic potential mechanisms and survival strategies employed by these pathogens in acidic environments is crucial for developing effective control measures to mitigate the risk of foodborne illnesses associated with orange juice consumption. This study aims to evaluate the acid adaptation of S. Enteritidis and E. coli O157:H7 using different methodologies and to determine its effects on their survival and pathogenicity in orange juice.
2. Materials and Methods
2.1. Strain and Cell Culture Maintenance
Two foodborne pathogens strains were used in the present study: Salmonella enterica subsp. enterica serovar Enteritidis (CECT 4300) and Escherichia coli O157:H7 (NCTC 12900). S. Enteritidis and E. coli O157:H7 were streaked onto Tryptone Soy Agar (TSA; Biokar; Allonne, France) plates and incubated at 37 ± 1 °C for 24 ± 1 h. To prepare bacterial fresh culture, a single colony was added to 100 mL of Tryptone Soy Broth (TSB; Biokar; Allonne, France) and incubated at 37 ± 1 °C for 20 ± 1 h. This resulted in cultures that were in a late stationary phase of growth. After incubation, grown bacteria were harvested by centrifugation at 9800× g at 25 ± 1 °C for 10 min and the pellet was suspended in Saline Solution (SS; 8.5 g/L NaCl; VWR; Radnor, PA, USA). Bacterial populations were determined by plating tenfold dilutions in Saline Peptone (SP; 8.5 g/L NaCl; VWR; Radnor, PA, USA, and 1 g/L peptone; Biokar; Allonne, France) onto TSA. Plates were incubated at 37 ± 1 °C for 24 ± 2 h.
The Caco-2 cell line (human colon adenocarcinoma cell line, ECACC 86010202) was grown in 75 cm2 flasks (Cellstar, Greiner Bio-One, Thermo Fisher Scientific; Waltham, MA, USA) with Dulbecco’s Modified Eagle Medium (DMEM; Hyclone VWR; Radnor, PA, USA) supplemented with 15% heat-inactivated foetal bovine serum (FBS, Hyclone VWR; Radnor, PA, USA) and 1% penicillin/streptomycin (10,000 units/mL penicillin and 10,000 µg/mL streptomycin; (Sigma-Aldrich; San Luis, MO, USA) and preserved in a humidified incubator at 37 °C/5% CO2/95% humidity, replacing the DMEM three times per week.
2.2. Production of Acid-Adapted and Non-Acid-Adapted Cultures
Both strains were subjected to the following conditions: two different methods to obtain acid-adapted (AA) cultures were evaluated using TSB without glucose (TSB-w/o; Sigma-Aldrich; San Luis, USA) as the growth medium. Specifically, two media were used: TSB-w/o with 1% glucose (TSB-G) to promote the anaerobic fermentation, and media TSB-w/o acidified with citric acid (Thermo Fisher Scientific; Waltham, MA, USA)to pH 5 (TSB-CA). Among different organic acids, citric acid was selected because it is the main acid present in orange juice. Fresh bacterial cultures (50 µL) were added to 20 mL of TSB-G or TSB-CA to reach a final concentration of 103 CFU/mL. To obtain non-acid-adapted cultures (NAA), 20 mL of TSB-w/o were inoculated with fresh culture to achieve the same final concentration. Both AA and NAA cultures were incubated under static conditions at 37 ± 1 °C for 24 ± 2 h. Populations were counted by plating appropriate tenfold dilutions in SP onto TSA. Then, plates were incubated at 37 ± 1 °C for 24 ± 2 h. Also, the initial and final pH values of each culture condition were measured (GLP22 pH-meter model, Crison Instruments S.A; Alella, Spain and 2 PORE F TEMP BNC electrode, XS Instruments; Carpi, Italy).
2.3. Survival of Acid-Adapted and Non-Acid-Adapted Bacterial Pathogens in Orange Juice at Different Temperature Storage
Aliquots of 4 mL of each culture (AA and NAA bacteria) were centrifuged at the conditions previously mentioned and each pellet was resuspended in 40 mL of SS. Then, a corresponding aliquot of this suspension was once more centrifuged and 20 mL of commercially pasteurized orange juice (pH 3.51 ± 0.02; 11.6 ± 0.1 °Brix) previously tempered at 4, 15 or 25 °C was added to obtain a concentration of 105 CFU/mL in the fruit juice. Pasteurized juice was used to ensure the absence of interfering background microbiota and to maintain consistency in the physicochemical properties of the matrix throughout all experiments. Samples were stored at 4, 15 and 25 °C for 6 days. The population count was carried out after inoculation and at 1, 2 and 6 days by plating serial dilutions in SP onto proper selective media (Xylose Lysine Deoxycholate agar, XLD; Biokar; Allonne, France, for S. Enteritidis and MacConkey Sorbitol agar, CT-SMAC; Biokar; Allonne, France, for E. coli O157:H7). Plates were incubated at 37 ± 1 °C for 24 ± 2 h. pH of AA and NA cultures was measured at the initial and final points.
2.4. Influence of Acid Adaptation on the Pathogenic Potential of S. Enteritidis and E. coli O157:H7 in Orange Juice at 4 °C
This low storage temperature (4 °C) was selected because pathogens previously demonstrated higher survival under this temperature (Results Section 3.2) and is also the recommended storage condition for fruit juices.
2.4.1. Effect of Gastrointestinal Tract Conditions After Orange Juice Storage
The survival of AA (in TSB-G) and NAA populations was evaluated in orange juice for 2 days at 4 °C, as described in Section 3.3. Subsequently, orange juice samples were subjected to gastrointestinal tract simulation. Gastrointestinal tract simulation in vitro assay was carried out according to the method described by Minekus et al. [15] with some modifications. The method is an international consensus which describes a three-step procedure simulating digestive progress: oral, gastric, and intestinal phases. Due to the fact that liquid foods (as fruit juices are) can be exposed directly to the gastric phase, therefore in the present study oral phase was omitted. Before the simulation experiments, the simulated gastric fluid (SGF) and simulated intestinal fluid (SIF) solutions were preheated at 37 ± 1 °C in a water bath. A gastrointestinal tract simulation assay was performed after inoculation of AA and NA bacteria in orange juice and after inoculation and after 2 days of storage at 4 °C. At each sampling point, 5 mL of inoculated orange juice with 9.8 mL of SGF (pH 3.0) was added to a sterile flask and the pH of the mixture was adjusted to 3.0 with hydrochloric acid (HCl, 1 mol/L; Panreac S.L.A; Barcelona, Spain). After 2 h at 37 ± 1 °C, the pH was measured again, and the microbiological population was determined per duplicate (post-SGF count). Then, 19.7 mL of SIF (pH 7.0) was added to the mixture and the pH was adjusted again to 7.0 with sodium hydroxide (NaOH, 1 mol/L; VWR; Radnor, PA, USA). The samples were maintained at 37 ± 1 °C for a period of 2 h. Following incubation, the pH of the resulting mixture was recorded, and two aliquots were taken for microbiological analysis (post-SIF). For all microbiological analyses, tenfold dilutions were prepared using SP and enumeration was performed by plating on proper selective media. The plates were incubated at 37 ± 1 °C for 24 ± 1 h. At each sampling point, all the cell counts were calculated considering the dilution factors due to the continuous addition of gastrointestinal fluids.
2.4.2. Adhesion and Invasion Capability to Caco-2 Cells After Overcoming Orange Juice Storage and Gastrointestinal Tract Simulation
Caco-2 cells were used to evaluate the adhesion and invasion capability of AA and NA bacteria according to Ortiz-Solà et al. [16] with modifications. For the experiment, cells were cultivated in 12 wells plates (Thermo Scientific; Waltham, MA, USA) and incubated under the same conditions mentioned until achieving monolayer cells confluence (final concentration of 7 × 10⁴ cells per well). For adhesion and invasion assay, Caco-2 cells culture medium was removed, and a double washing procedure was applied with warmed Sterile Phosphate-Buffered Saline (PBS, Gibco, Thermo Scientific; Waltham, MA, USA), and 1 mL/well of warmed DMEM without antibiotics was added.
The adhesion and invasion capability were determined in samples at the end of the acid-adaptation step (subjected to TSB-G adaptation) (centrifuged and resuspended in SS, and before orange juice inoculation), samples of inoculated orange juice on the initial day after gastrointestinal tract simulation and the same samples after 2 days at 4 °C after exposition to gastrointestinal tract simulation. To obtain a similar multiplicity of infection (MOI) among the evaluated steps, an aliquot of each sample was centrifuged for 10 min at 25–9800× g and then re-suspended in 6 mL of DMEM without antibiotics. Bacterial suspensions were enumerated by plating onto proper selective media to determine the initial bacterial concentrations in the adhesion and invasion assay.
Two wells with a monolayer of cells for each assay were inoculated with 1 mL of the bacterial suspensions. Then, incubation was carried out at 37 °C under 5% CO2 and 95% humidity. For adhesion capability, the media of two wells was aspirated after 1 h of incubation, and to remove non-adhered bacteria, the monolayers of cells were washed twice with PBS. Cells were lysed using 1 mL of 0.1% (v/v) Triton-X100 (Sigma-Aldrich; San Luis, USA) in PBS and collected to determine adhered bacteria by plating onto selective media. For the invasion capability, after 1 h of incubation, the media of each well was aspirated, washed twice with PBS and 1 mL per well of DMEM supplemented with 150 µg Gentamicin/mL (50 mg/mL, Gibco, Thermo Scientific, Waltham, MA, USA) was added and incubated for 2 h in the same conditions to eliminate the extracellular bacteria. Then, the media was aspirated, and cells were washed, lysed, and collected as described above. To enumerate invaded bacteria samples were plated onto proper selective media and all plates were incubated at 37 ± 1 °C for 24 ± 1 h.
2.5. Data and Statistical Analysis
Each experiment had 3 repetitions and was replicated twice (n = 6). In the adhesion and invasion capability assay, 2 wells were inoculated for each repetition and experiments were duplicated (n = 12). The population of each pathogen throughout storage were calculated as colony-forming units per millilitre (CFU/mL) and then log-transformed.
The fit of the survival curves was performed using GInaFIT v1.8 software [17]. The Log-linear regression model, is expressed by Equation (1):
where N represents the bacterial population at a specific time point (CFU/mL), N (0) is the initial bacterial population (CFU/mL), kmax is the first-order inactivation constant (h), and D is the decimal reduction time (h). The performance of the linear model was evaluated based on the root mean square error (RMSE) and the adjusted correlation coefficient (R2-adj). Adhesion and invasion abilities were determined by calculating the mean values of Nt/N0, where Nt refers to the bacterial count (CFU) at a specific time and N0 corresponds to the bacterial count (CFU) of the inoculum added to Caco-2 cells. All data were reported as the mean ± standard deviation (SD).
Data were analysed using an analysis of variance (ANOVA) with JMP Pro 16 software (SAS Institute Inc., Cary, NC, USA). The statistical significance was judged at the level of p < 0.05. When the analysis was statistically significant, Tukey’s test or t-student test was used to evaluate differences between samples.
3. Results
3.1. Bacterial Growth in Different Acid-Adaptative Media
Figure 1 shows the growth of S. Enteritidis and E. coli O157:H7 in different acid-adaptative media, along with the mean pH values at initial time and after 24 h at 37 °C. Populations after inoculation ranged from 3.0 ± 0.1 to 3.1 ± 0.1 log10 CFU/mL. For S. Enteritidis (Figure 1A) and E. coli O157:H7 (Figure 1B), the populations after 24 h in the TSB-w/o and TSB-G media increased significantly, reaching levels that ranged from 8.7 ± 0.2 to 9.0 ± 0.2 log10 CFU/mL. On the contrary, in the TSB-CA media, only the population of S. Enteritidis grew, reaching levels around 7.6 log10 CFU/mL. The population of E. coli O157:H7 in the same media decreased by 1.6 ± 0.3 logarithmic units. The pH in the TSB-w/o media was only reduced by 0.7 ± 0.1 in S. Enteritidis and E. coli O157:H7 samples after incubation. Meanwhile, in the TSB-G media, the pH decreased by 2.4 ± 0.1. The pH of the TSB-CA media remained stable in all samples. As shown in Figure 1, bacterial growth was supported in TSB-G but not in TSB-CA, particularly in the case of E. coli. This initial evaluation aimed to identify appropriate conditions for acid adaptation. Based on these results, TSB-G was selected for subsequent assays, as it allowed sufficient growth and potential for adaptation, while TSB-CA was excluded due to the lack of bacterial growth.
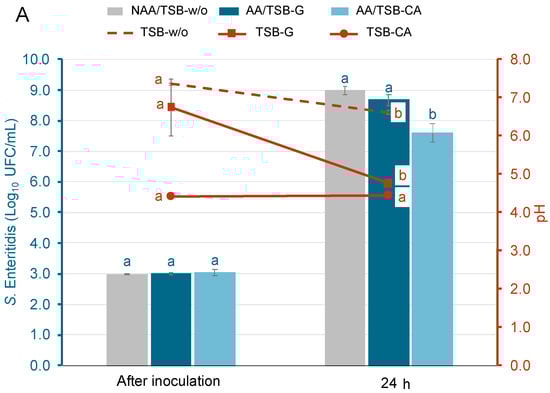

Figure 1.
Population of acid-adapted (AA) and non-acid-adapted (NAA) S. Enteritidis (A) and E. coli O157:H7 (B), and the evolution of pH in each growth media: Tryptone Soy Broth without glucose (TSB-w/o), Tryptone Soy Broth with 1% glucose (TSB-G), and Tryptone Soy Broth adjusted to pH 5 with citric acid (TSB-CA). Bars represent bacterial populations (log10 CFU/mL) and are color-coded for each treatment, while lines represent the evolution of pH and correspond to the right Y-axis. Bars represent means and error bars represent the standard deviation of the mean (n = 6). According to Tukey’s test (p < 0.05), different letters above bars represent significant differences between bacteria populations at the same time point. In addition, different letters above markers represent significant differences between pH throughout incubation.
3.2. Survival of Acid-Adapted and Non-Acid-Adapted Bacterial Pathogens in Orange Juice at Different Temperature Storage
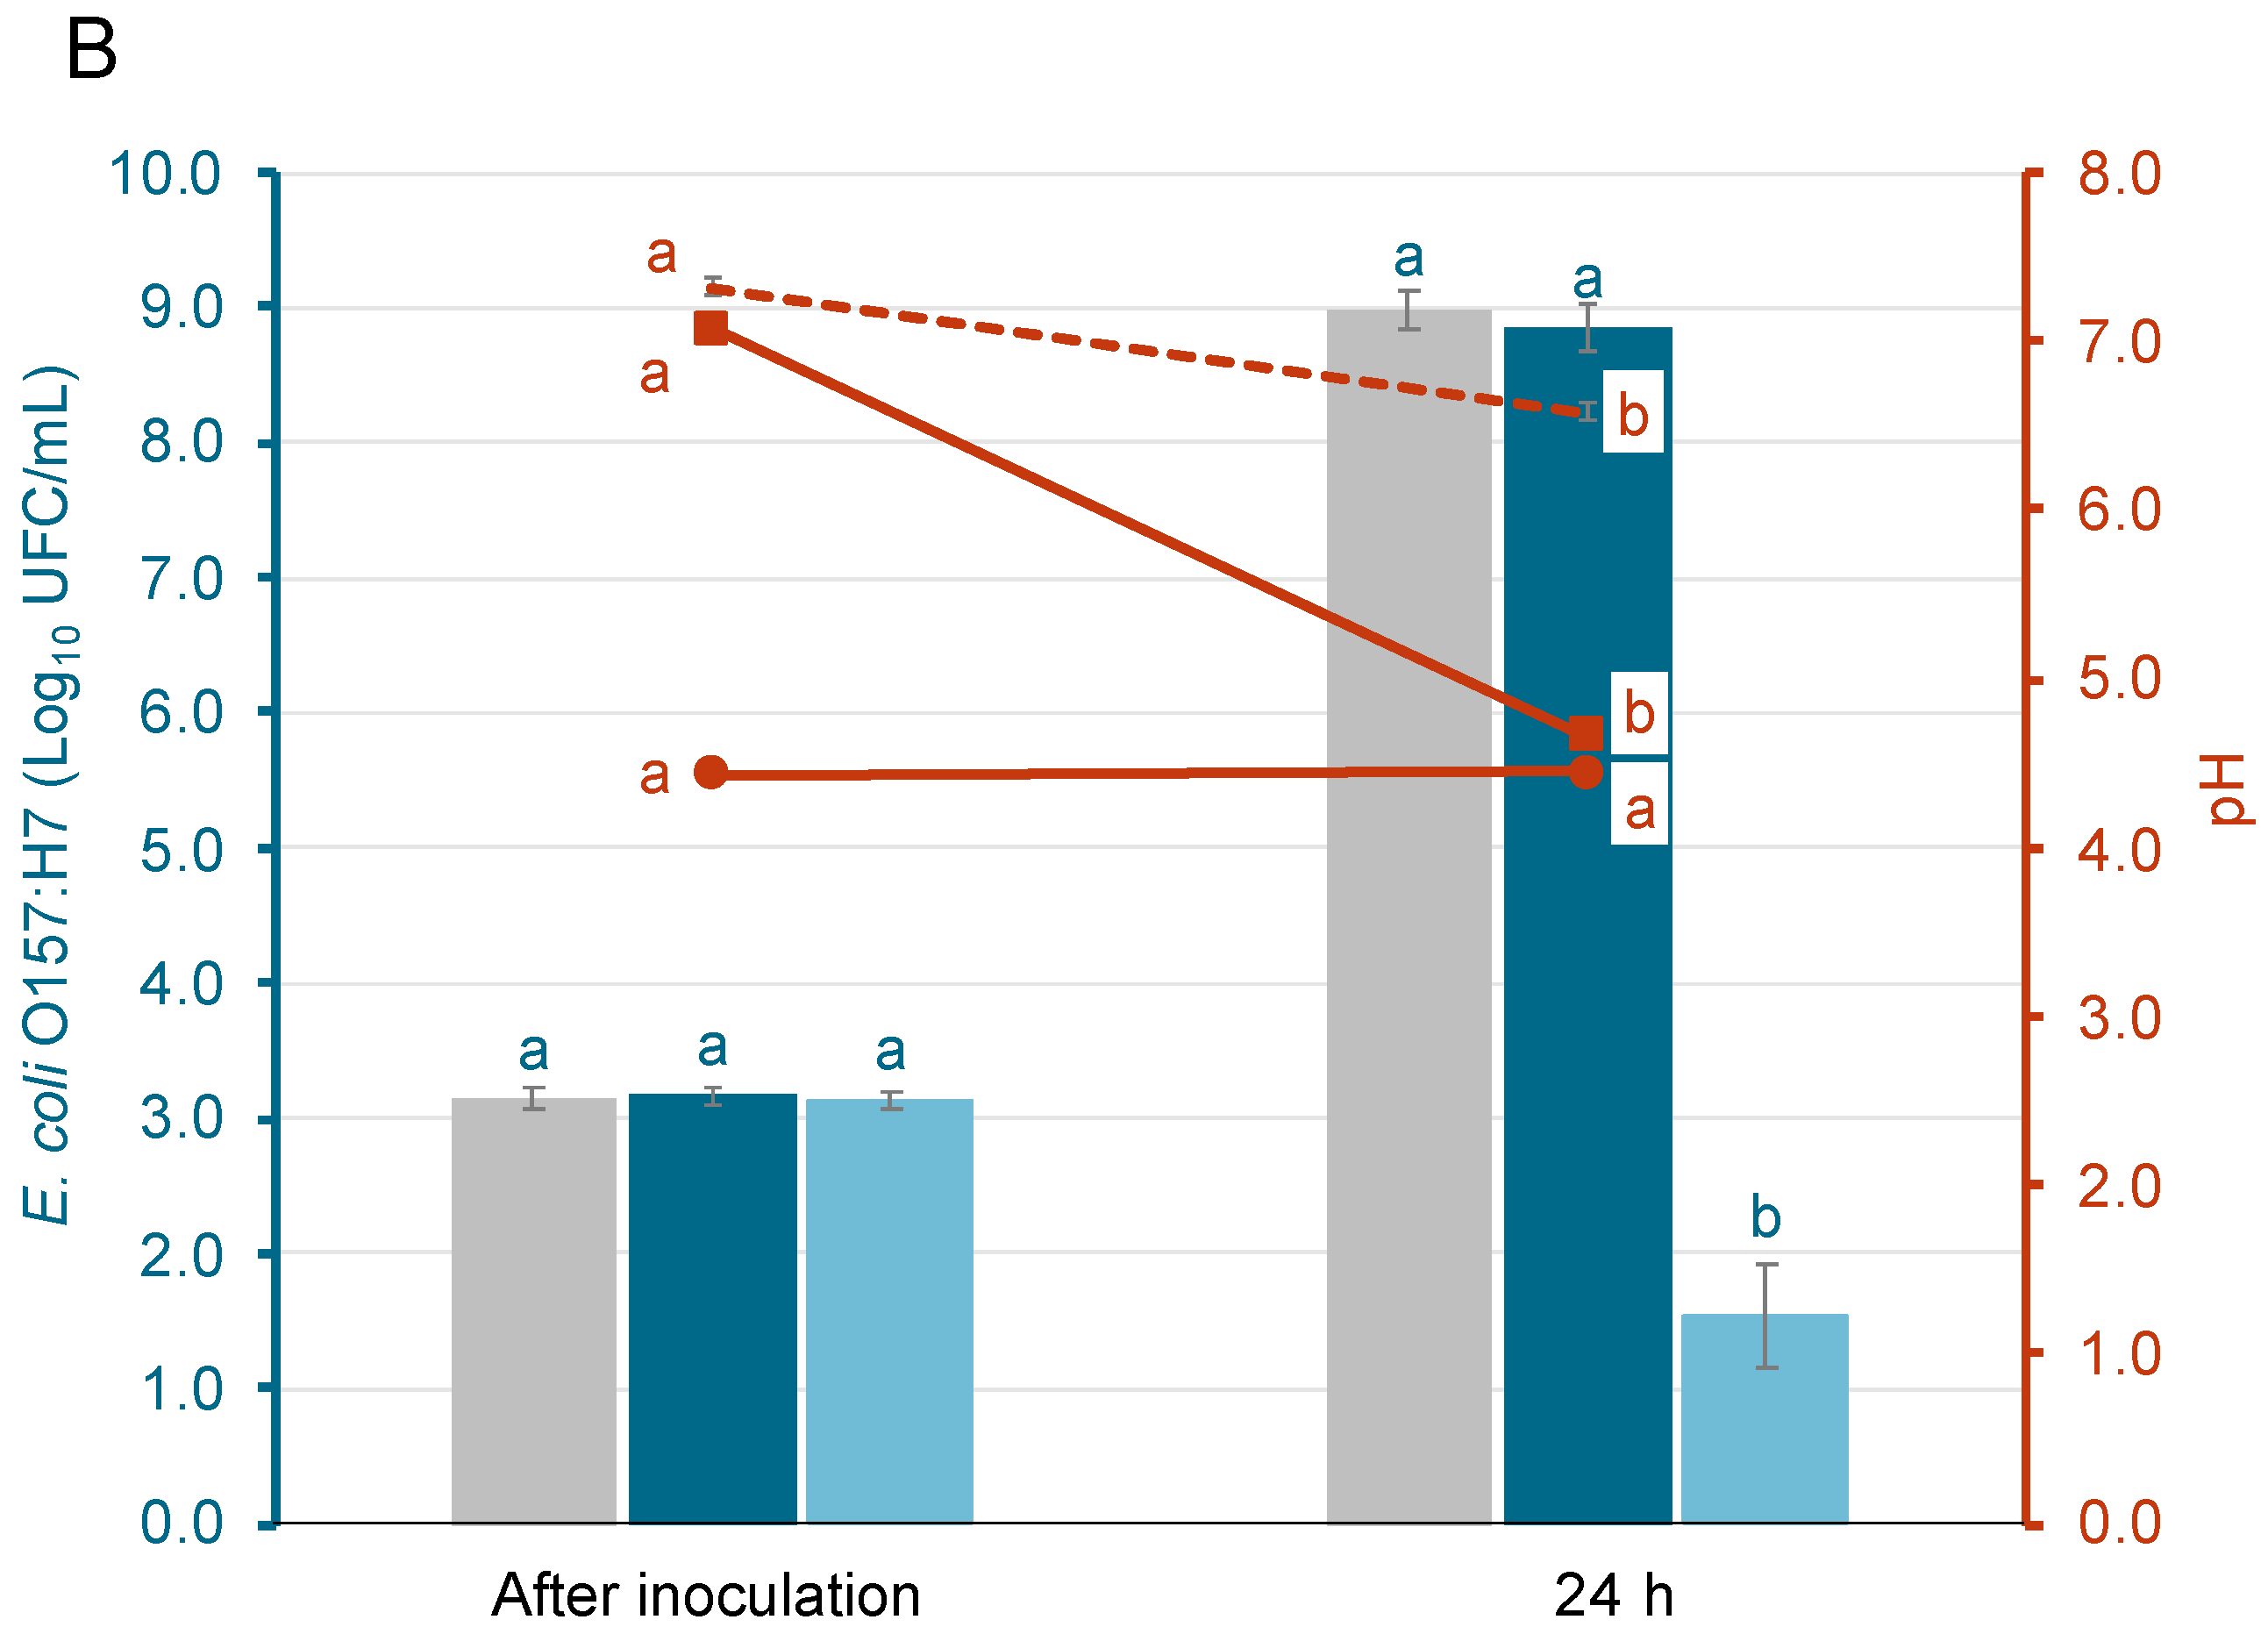
Figure 2 represents the survival of AA, using glucose-enriched media (TSB-G), and NAA S. Enteritidis (Figure 2A) and E. coli O157:H7 (Figure 2B) inoculated in orange juice at three different storage temperatures. The differences observed between the AA and NAA populations at different temperatures after inoculation in orange juice are due to variations in inoculation levels and not the effect of the food matrix. These results were confirmed by an inoculation control in sterile water.

Figure 2.
Survival of acid-adapted (AA) and non-acid-adapted (NAA) S. Enteritidis (A) and E. coli O157:H7 (B) inoculated in orange juice and stored for 6 days at three different temperatures (4, 15 and 25 °C). Different letters represent significant differences between acid-adapted and non-acid-adapted cells at the same time point, according to the t-student test (p < 0.05).
Although slight population decreases of S. Enteritidis were observed after 2 days, the AA population presented higher levels in comparison with the NAA populations at all storage temperatures. At 4 °C, differences of around 1.7 logarithmic units were observed between AA and NAA bacteria, and around 2.1 and 1.5 logarithmic units at 15 and 25 °C, respectively. Regarding E. coli O157:H7 populations, AA bacteria were almost 1 logarithmic unit above the levels of NAA bacteria at 4 °C, but at 15 and 25 °C, there were no significant differences between them. At this point, both AA and NAA E. coli O157:H7, reduced around 0.6 logarithmic units at 15 °C and 1.4 logarithmic units at 25 °C.
After 6 days of storage, AA S. Enteritidis populations were 3.7 ± 0.1 and 4.5 ± 0.1 log10 CFU/mL at 4 and 15 °C, respectively. These levels are higher in comparison with the NAA S. Enteritidis, which decreased, reaching a population below 1 log10 CFU/mL. No differences were observed between AA and NAA cells after 6 days of storage at 25 °C. Regarding E. coli O157:H7, AA bacteria at 4 and 15 °C only decreased around 0.5 logarithmic units after 6 days, while NAA bacteria decreased around 1.5 and 2 logarithmic units, respectively. There were no significant differences between AA and NAA E. coli O157:H7 populations at 25 °C, with both population levels below the limit of quantification (LOQ = 0.3 log10 CFU/mL).
To further support these observations, the inactivation kinetics of both pathogens under the tested conditions were fitted using a linear model. Statistical indices (root mean squared error (RMSE) and coefficient of determination adjusted (R2-adj)) along with Kmax values, are presented in Table 1 and Table 2, respectively. Not all experimental conditions could be fitted to the linear model. In particular, datasets where no relevant population decrease was observed could not be modeled. For S. Enteritidis, Kmax values were obtained under all tested conditions. At each temperature, NAA populations exhibited higher Kmax values than AA populations. For E. coli O157:H7, model fitting was only possible at 25 °C. The Kmax value of the NAA population was slightly lower than that of the AA population, which supports the observed reduction trends described in the experimental data.

Table 1.
Statistical indices of the linear model used to estimate acid-adapted (AA) and non-acid-adapted (NAA) S. Enteritidis and E. coli O157:H7 in orange juice under different storage temperatures.
Table 2.
First-order inactivation rate constant (Kmax) values derived from the linear model fitting to the survival curves of acid-adapted (AA) and non-acid-adapted (NAA) S. Enteritidis and E. coli O157:H7 in orange juice stored at different temperatures.
3.3. Influence of Acid Adaptation on the Pathogenic Potential of S. Enteritidis and E. coli O157:H7 in Orange Juice at 4 °C
3.3.1. Effect of Gastrointestinal Tract Conditions After Orange Juice Storage
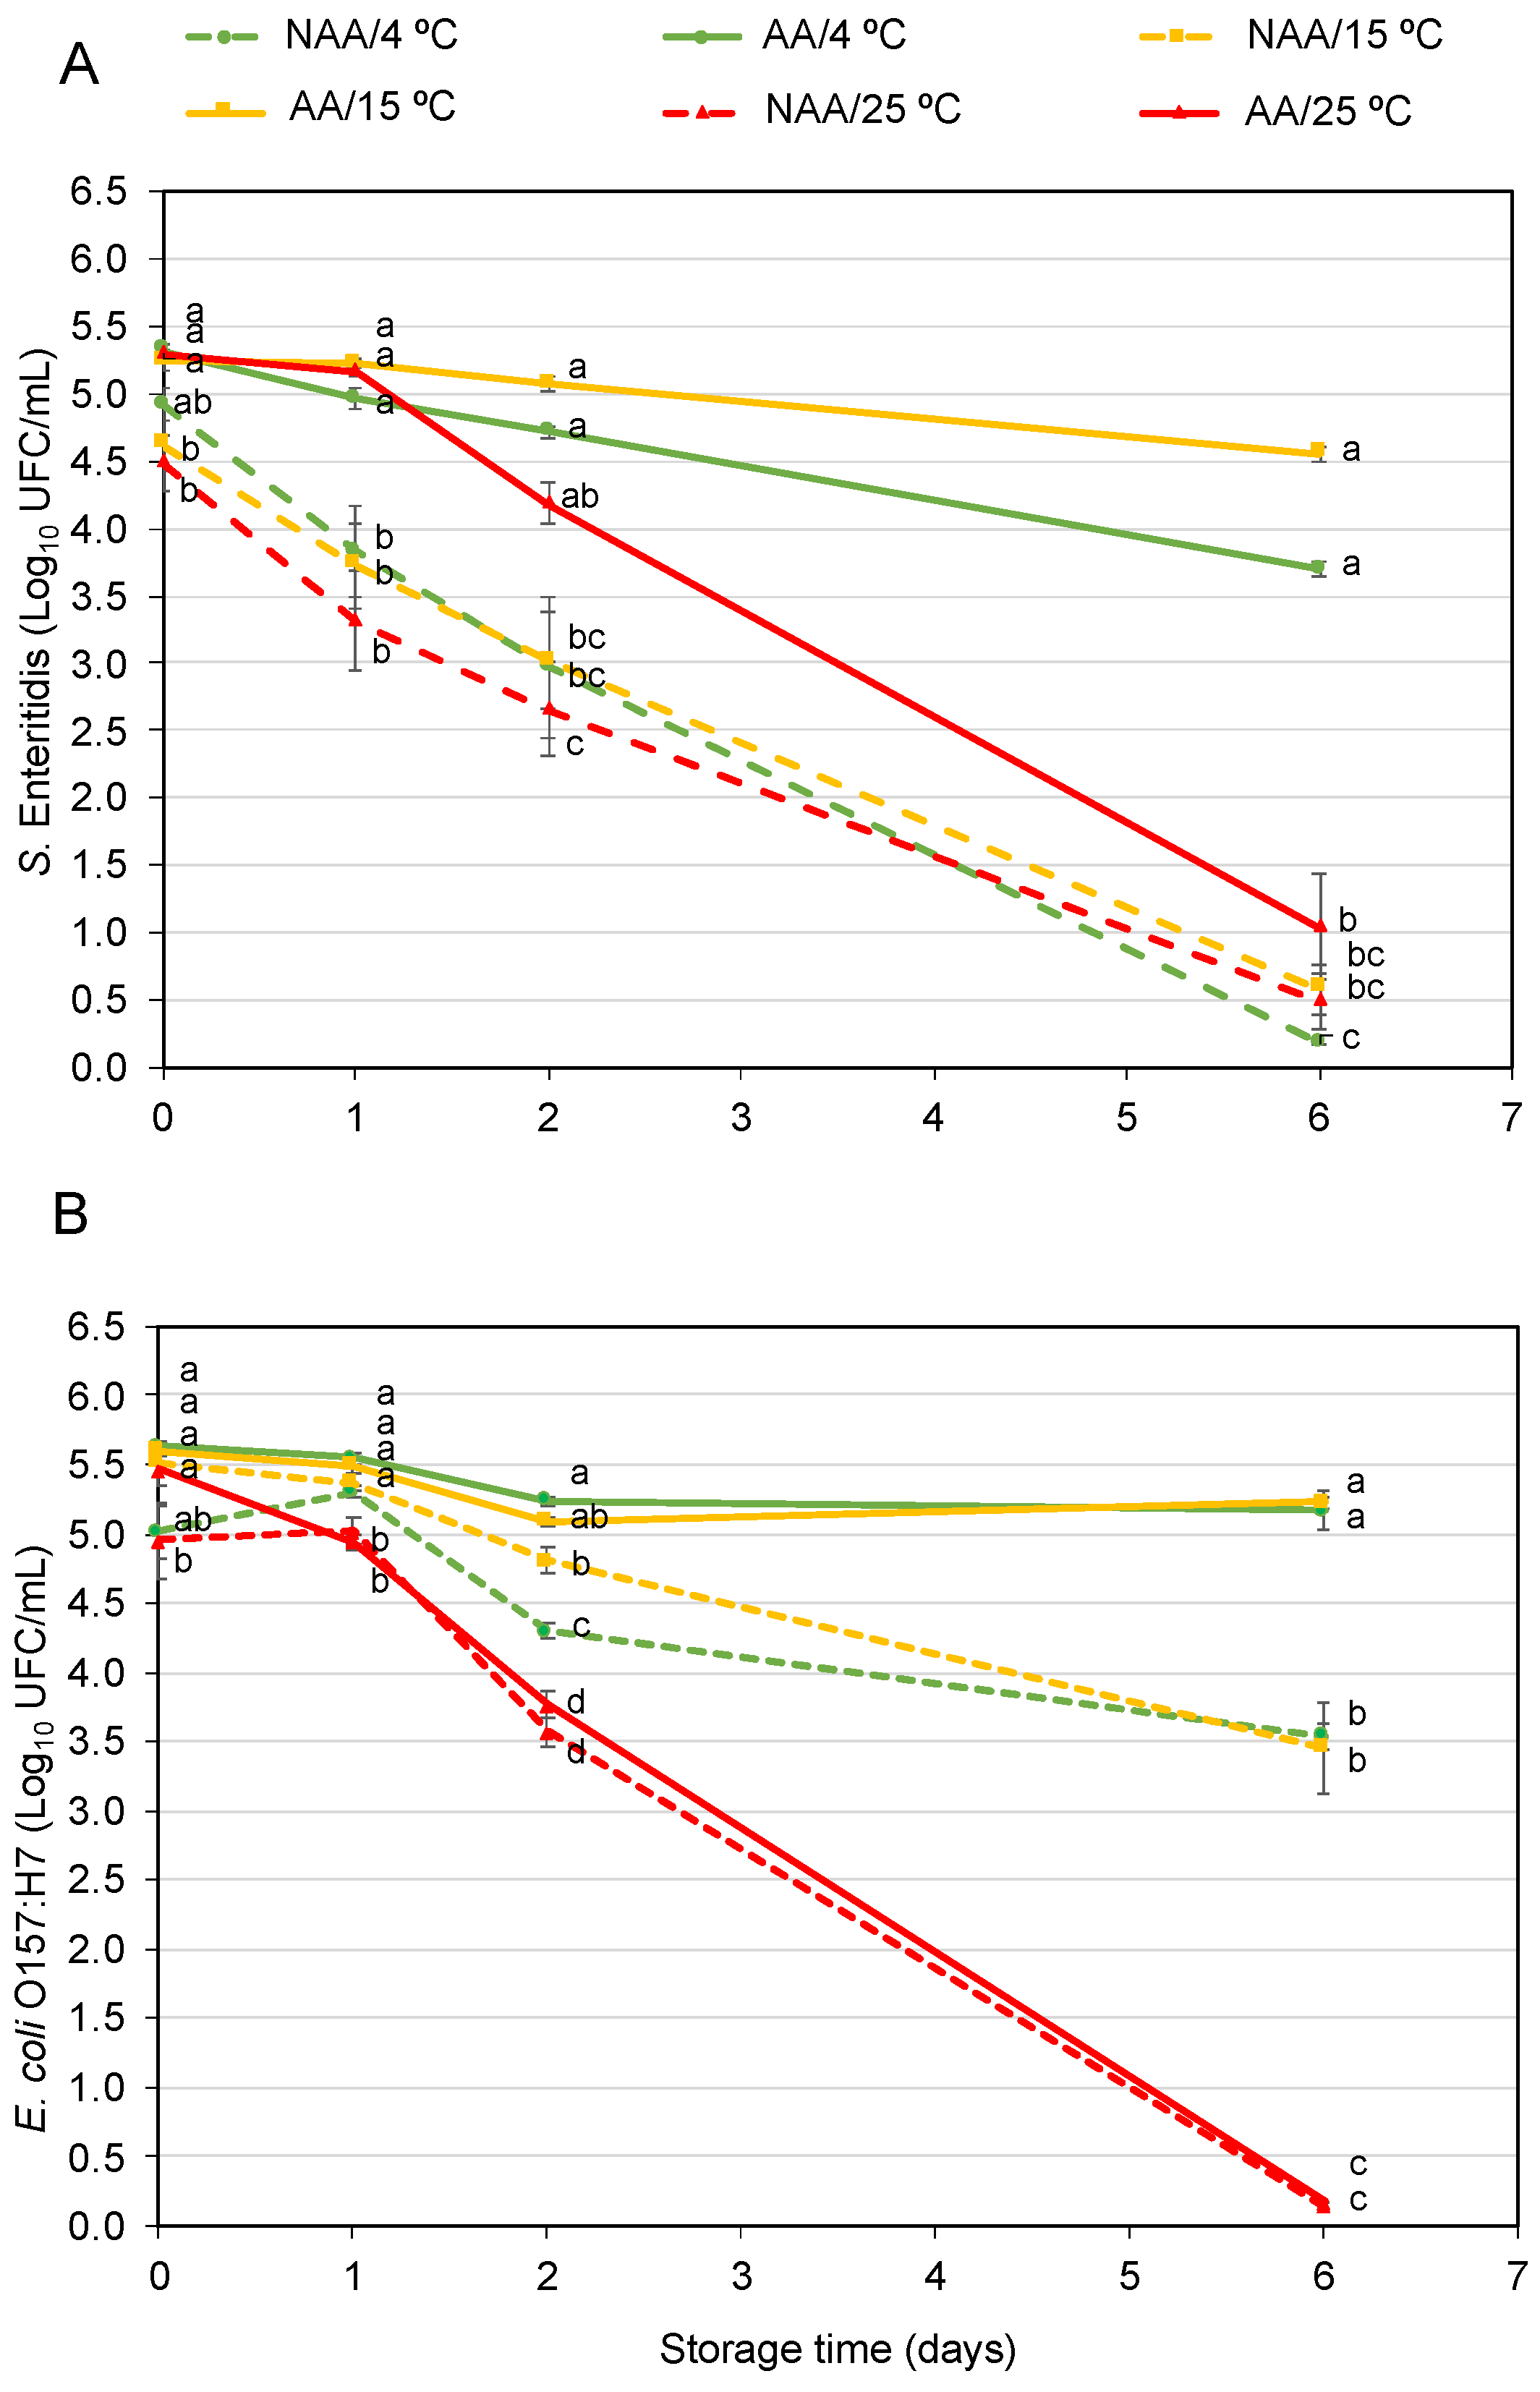
The survival of AA and NAA S. Enteritidis and E. coli O157:H7 in orange juice stored at 4 °C is illustrated in Figure 3A and Figure 3B, respectively.

Figure 3.
Survival behaviour of acid-adapted (AA) and non-acid-adapted (NAA) S. Enteritidis (A) and E. coli O157:H7 (B) in orange juice at 4 °C after gastrointestinal tract simulation. Bars represent means and error bars represent the standard deviation of the mean (n = 6). Asterisks indicate statistically significant differences between AA and NAA cells at the same sampling point according to the t-student test (p < 0.05).
The population of AA S. Enteritidis after inoculation in fruit juice was 6.1 ± 0.1 log10 CFU and decreased around 0.2 logarithmic units after 2 days in the food matrix. Meanwhile, the population of NAA after inoculation was 5.6 ± 0.5 log10 CFU and showed a higher reduction, decreasing by about 1.6 logarithmic units after storage. Regarding gastrointestinal simulation, there were significant differences between AA and NAA bacteria at the initial time, post-SGF and SIF. The population of NAA cells was reduced by 1.6 ± 0.3 logarithmic units when the bacteria were exposed to the SGF but increased by 1.0 ± 0.1 logarithmic units after the SIF, reaching a final population of 5.1 ± 0.3 log10 CFU. On the contrary, the population of AA cells survived, maintaining the levels after the SGF and SIF stages, reaching similar population levels at the end of the tract. After 2 days, the same trends were observed, and AA cell population was maintained during SGF and SIF, while NAA cells decreased during the SGF step. In this sampling time, the population recovered after the SIF step was lower than the initial population regardless of AA and NAA cells with final populations of 5.5 ± 0.3 and 3.2 ± 0.2 log10 CFU at the end of gastrointestinal tract simulation, respectively.
For E. coli O157:H7, there were no significant differences between AA and NAA bacteria after inoculation in orange juice, post-SGF SGF and post-SIF at the initial time. In both AA and NAA E. coli O157:H7, a slight increase in population was observed after gastrointestinal tract simulation, reaching a population of almost 7 log10 CFU. After 2 days, the AA and NAA E. coli reduced less than 0.5 logarithmic units in orange juice. Regarding gastrointestinal simulation after 2 days, the population of NAA cells reduced by 1.0 ± 0.2 logarithmic units in the SGF meanwhile lower decrease was reached for AA cells (0.4 ± 0.1 logarithmic units). At the end of the gastrointestinal tract simulation, the AA cell population increased around 0.2 logarithmic units compared to the initial population, but NAA cells maintained around initial population levels at 2 days.
3.3.2. Adhesion and Invasion Capability to Caco-2 Cells After Overcoming Orange Juice Storage and Gastrointestinal Tract Simulation
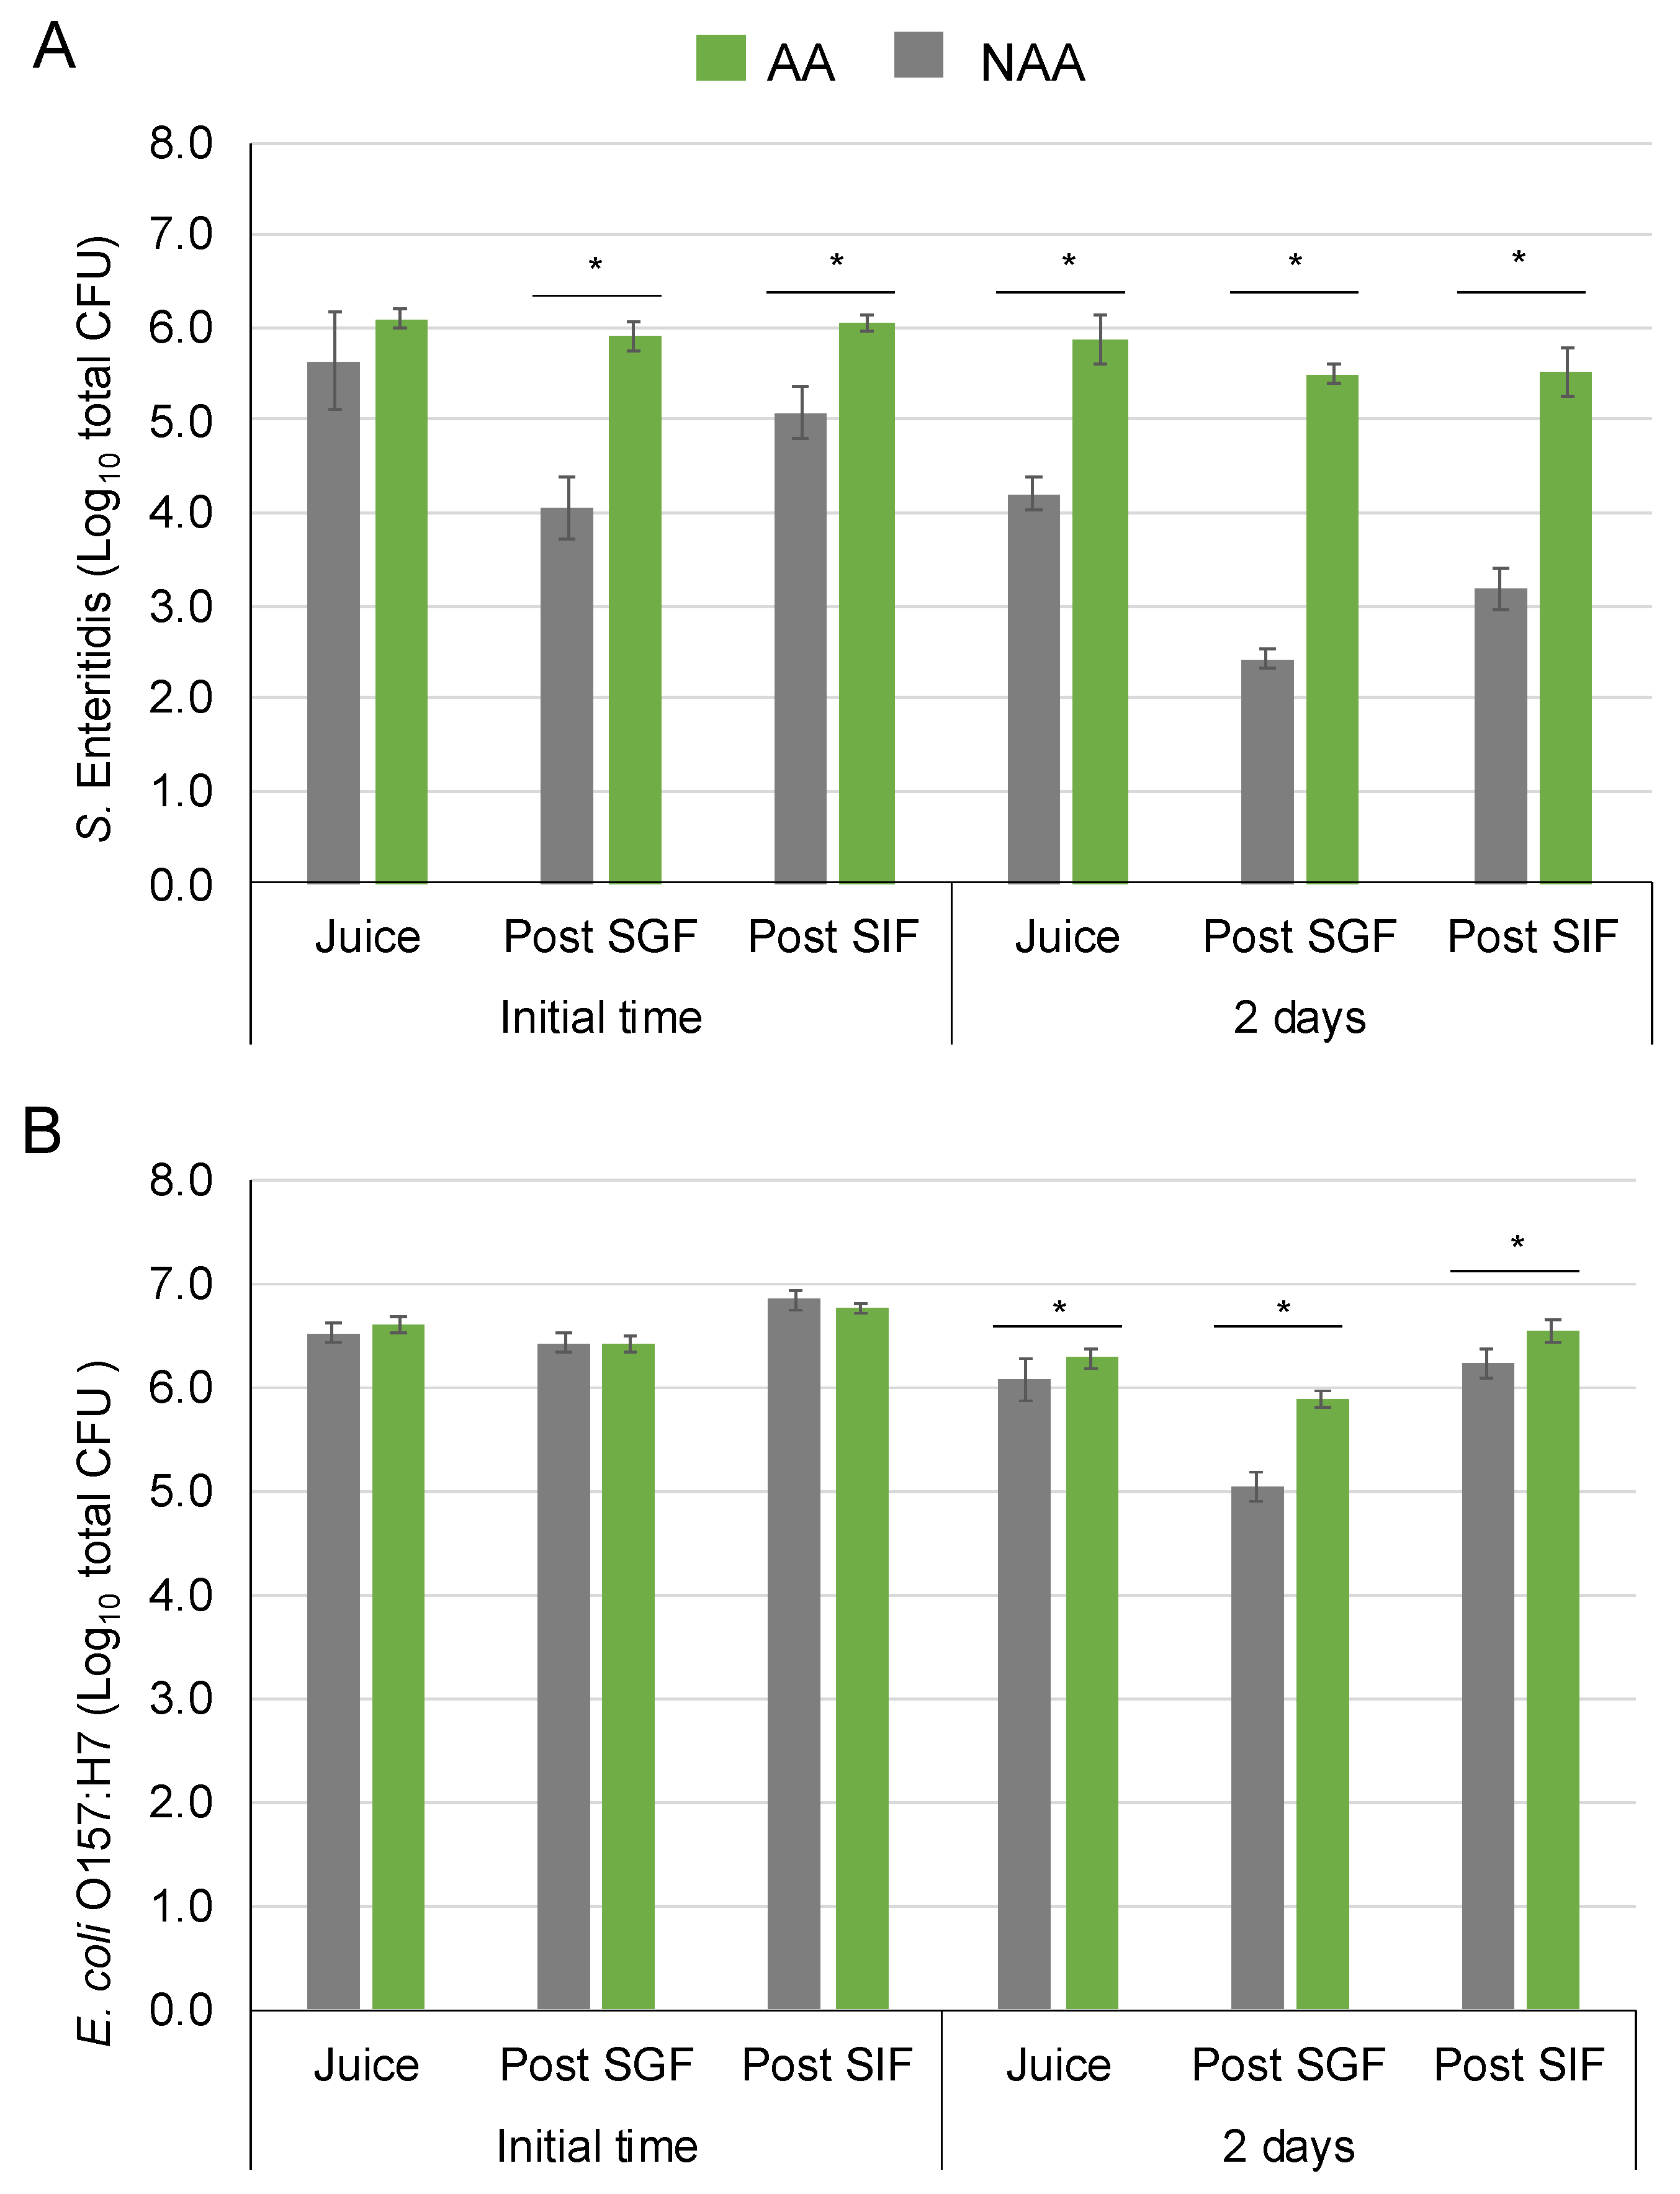
Table 3 shows the adhesion capability (Nt/N0) of AA and NAA cells of S. Enteritidis and E. coli O157:H7. Prior to the inoculation of AA and NAA cells in orange juice at 4 °C, their adhesion and invasion capacities were determined as a control of the pathogen (after 24 h in adaptation media), without the interaction with the food product or the effects of gastrointestinal stresses. Significant differences were observed in the adhesion capacity of S. Enteritidis and E. coli O157:H7 following the acid-adaptation step, with AA cells exhibiting greater adhesion than NAA. After inoculation in the orange juice and followed by the gastrointestinal tract, AA and NAA adhesion capacity increased in all samples but there were no differences between AA and NAA. The adhesion capacity decreased in all samples after 2 days in fruit juice except for AA E. coli O157:H7. The bacteria maintained their adhesion capability with a mean value of 0.43 ± 0.20. There was no invasion capability in any of the conditions analysed.
Table 3.
Adhesion ability of acid-adapted (AA) and non-acid-adapted (NAA) S. Enteritidis and E. coli O157:H7 to Caco-2 cells.
4. Discussion
In the present study, the hypothesis proposed was that pathogenic bacteria such as S. Enteritidis and E. coli O157:H7 have greater survival and pathogenic potential in fruit juice when they are previously acid-adapted. There are different methodologies to induce acid-enhanced responses, including acid shock and acid adaptation. Acid shock refers to the sudden exposure of cells to a significant pH shift, such as an abrupt transition from a high to a low pH environment. Conversely, acid-adapted cells undergo gradual exposure to fluctuations in environmental pH over time [18,19]. To test this, we employed different methodologies to induce acid-enhanced responses, including gradual pH reduction via glucose fermentation [20,21,22,23] and direct acidification with organic acids [24,25,26,27].
A previous study demonstrated that the addition of 1% glucose in the TSB medium can effectively induce acid adaptation, particularly for cells in the stationary phase under mildly acidic conditions [28]. Our results showed that in the TSB medium with 1% glucose, S. Enteritidis and E. coli O157:H7 reached the same population levels as in the non-adaptative medium (TSB-w/o). Glucose fermentation by pathogens growing in TSB with glucose resulted in a pH decrease, which aligns with other studies demonstrating that a low pH (ranging from 4.3 to 6.4) can induce the ATR in Salmonella and E. coli during both the logarithmic and stationary growth phases [29,30,31]. This highlights the importance of fermentable carbohydrates in promoting acid tolerance, a factor critical for food safety, especially in acidic food environments like orange juice.
As mentioned previously, the use of organic acids is a well-established approach to studying acid adaptation of foodborne pathogens. According to our results, only S. Enteritidis was able to grow in a medium acidified to pH 5 using citric acid. This aligns with findings that citric acid induces a strong ATR in S. typhimurium [32]. In contrast, we did not observe the growth of E. coli O157:H7 in culture media with citric acid. Oteiza et al. [33] aimed to evaluate the impact of acid adaptation on ten strains of E. coli O157 and non-O157 under low pH conditions, using either acid shock or gradual acidification in a glucose medium. Similarly to our results, no significant differences in survival were observed in orange juice for the acid shock experiments. However, following slow acidification, a significant increase in survival was observed across all evaluated strains.
Fruit and vegetable juices contain various nutrients, such as glucose, fructose, vitamins, and organic acids. While organic acids play a critical role in inhibiting bacterial growth by reducing the pH, several studies have reported that pathogenic bacteria can survive in moderately acidic environments despite this inhibition, and these surviving bacteria exhibit greater acid resistance in acidic foods or SGF [34,35,36]. This study demonstrates that S. Enteritidis and E. coli O157:H7 exhibited significantly higher survival in orange juice compared to non-acid-adapted bacteria after 24 h of adaptation in TSB with glucose. The differences in survival were more pronounced at lower storage temperatures which is consistent with Yan et al. [37], who linked enhanced acid resistance to altered membrane fluidity.
Significant differences in survival were noted between acid-adapted and non-acid-adapted E. coli O157:H7 and S. Enteritidis after exposure to simulated gastrointestinal conditions. These results suggest that acid adaptation enhances the resistance of pathogenic bacteria to gastrointestinal stress, potentially increasing their pathogenic potential [20]. Acid exposure may trigger regulatory mechanisms which are crucial for the survival of these bacteria in low-pH environments, such as the human gastrointestinal tract [18,38]. Moreover, our findings indicate a population decline of pathogenic strains after passage through the simulated gastric fluid (SGF), followed by a resurgence in growth after exposure to the simulated intestinal fluid (SIF). These results are consistent with Ortiz-Sola et al. [16], who observed a similar reduction for the same strain of S. Enteritidis in fresh-cut strawberries after a simulated gastric stage and a subsequent reactivation of growth after a simulated intestinal stage. The loss of viability observed post-SGF could result from the synergistic effect between acidic conditions and gastric enzymes. The reactivation of growth post-SIF may be due to less strict conditions such as pH values closer to neutrality compared to those in SGF. The same behaviour has been observed in Escherichia coli O26:H11 [39].
While it is commonly believed that higher acid resistance correlates with increased pathogenic potential, this is not always the case. Although our study observed heightened pathogenicity in acid-adapted bacteria following gastrointestinal passage, the same trend was not evident in adhesion and invasion assays. Researchers have reported that increased acid resistance often damages pathogenic potential and affects the overall phenotype of S. enterica, for example, Karatzas et al. [9]. The underlying mechanism linking increased stress resistance and altered pathogenic potential is poorly understood. While numerous reports on various bacterial species have shown that the presence of several stress proteins is essential for pathogenic potential, others have demonstrated that their constitutive overexpression could be associated with attenuated pathogenic potential [40,41,42].
Our findings reveal that although on the day of orange juice inoculation, there were no differences in adhesion capability when the bacteria were previously adapted to acid stress, differences in E. coli O157:H7 cells were observed after two days on orange juice storage at 4 °C. After two days of inoculation in the orange juice, the adhesion capability of acid-adapted E. coli O157:H7 remained stable in comparison with the initial time. These results suggest that the exposition in fruit juice may have an effect on the pathogenicity of pathogens when they are not previously subjected to stress. Guillen et al. [43] analysed the cellular adhesion of different Salmonella serovars in Caco-2 intestinal cells and observed a strong positive correlation between acid stress resistance and pathogenic potential mediated by cellular adhesion. The researchers attributed the disparities between their results and those from other studies to factors such as the type of strain, the food matrix, the growth and adaptation conditions, etc., used in each study.
In this study, no invasive capability was observed in the bacteria in any of the experiments performed. Several studies have reported that the mechanisms activated during exposure to acidic conditions can sometimes lead to a decrease in the invasive capability of pathogenic bacteria [9,14,16]. Additionally, although adhesion and invasion capacities are coordinated, different pathways modulate these separate pathogenic potential mechanisms [44,45], explaining why strains with high adhesion capability are not always the most invasive. Yin et al. [46] reported that S. typhimurium exhibited reduced adhesion and invasion capabilities in grapefruit juice. Our findings show that acid-adapted E. coli O157:H7, after two days in orange juice, not only does not decrease its pathogenic potential capability but also differs significantly from the non-acid-adapted population. This pathogenic potential capability and ability of E. coli O157:H7 to environmental stress opens the debate for new studies considering this pathogen and its capability in future assays.
5. Conclusions
This study provides significant insights into the survival and pathogenic potential of acid-adapted foodborne pathogens, specifically S. Enteritidis and E. coli O157:H7, in minimally processed orange juice. Our findings demonstrated that these pathogens, particularly when acid-adapted using a 1% glucose medium, exhibit enhanced survival capability and pathogenic potential in acidic environments like orange juice. The acid-adapted bacteria not only survived at higher levels, but they also showed increased resilience during simulated gastrointestinal transit, underscoring their potential threat to public health. Furthermore, the adhesion assay of Caco-2 cells revealed that acid-adapted E. coli O157 displayed significantly higher adhesion capability compared to non-acid-adapted counterparts, highlighting the need to consider acid adaptation in food safety assessments. However, in this study, no invasive capability was observed in the bacteria in any of the experiments performed. Future research should focus on further investigating the role of various food matrices, storage conditions, and other environmental factors in modulating acid adaptation which could provide a more comprehensive understanding of pathogen behaviour. Additionally, exploring potential interventions, such as the use of natural antimicrobial compounds present in citrus juices, may offer innovative approaches to mitigating the risk of foodborne illnesses. By integrating these findings into preventive measures, we could reduce the incidence of foodborne outbreaks associated with minimally processed fruit juices and other acidic food products.
Author Contributions
Conceptualization, M.B.B., P.C.-M., I.V. and I.A.; methodology, M.B.B., A.P.-A. and P.C.-M.; software, M.B.B.; validation, M.B.B., P.C.-M. and I.A.; formal analysis, M.B.B. and P.C.-M.; investigation, M.B.B., A.P.-A. and P.C.-M.; resources, I.V. and I.A.; data curation, M.B.B.; writing—original draft preparation, M.B.B.; writing—review and editing, P.C.-M. and I.A.; visualization, M.B.B.; supervision, I.V. and I.A.; project administration, I.V. and I.A.; funding acquisition, I.V. and I.A. All authors have read and agreed to the published version of the manuscript.
Funding
This research was financially supported by the Spanish Government (Ministerio de Economía y Competitividad, research project QUALISAFEJUICE (PID2019-106645RB-I00). Agència de Gestió d’Ajuts Universitaris i de Recerca (AGAUR) supported the PhD grant of M. B Bainotti (2022FI_B1 00225).
Institutional Review Board Statement
The Caco-2 cell line is human colon adenocarcinoma cell line, ECACC, 86010202.
Informed Consent Statement
Not applicable.
Data Availability Statement
The original contributions presented in this study are included in the article. Further inquiries can be directed to the corresponding author.
Conflicts of Interest
The authors declare no conflicts of interest. The funders had no role in the design of the study; in the collection, analyses, or interpretation of data; in the writing of the manuscript; or in the decision to publish the results.
References
- Elbehiry, A.; Abalkhail, A.; Marzouk, E.; Elmanssury, A.E.; Almuzaini, A.M.; Alfheeaid, H.; Alshahrani, M.T.; Huraysh, N.; Ibrahem, M.; Alzaben, F.; et al. An Overview of the Public Health Challenges in Diagnosing and Controlling Human Foodborne Pathogens. Vaccines 2023, 11, 725. [Google Scholar] [CrossRef] [PubMed]
- Neves, M.F.; Trombin, V.G.; Marques, V.N.; Martinez, L.F. Global Orange Juice Market: A 16-Year Summary and Opportunities for Creating Value. Trop. Plant Pathol. 2020, 45, 166–174. [Google Scholar] [CrossRef]
- MAPA (Ministry of Agriculture Fisheries and Food). Report on Food Consumption in Spain. Available online: https://www.mapa.gob.es/en/alimentacion/temas/consumo-tendencias/panel-de-consumo-alimentario/ultimos-datos/default.aspx (accessed on 9 April 2025).
- Lima Tribst, A.A.; De Souza Sant’ana, A.; De Massaguer, P.R. Review: Microbiological Quality and Safety of Fruit Juices—Past, Present and Future Perspectives. Crit. Rev. Microbiol. 2009, 35, 310–339. [Google Scholar] [CrossRef]
- Vavoura, M.V.; Karabagias, I.K.; Kosma, I.S.; Badeka, A.V.; Kontominas, M.G. Characterization and Differentiation of Fresh Orange Juice Variety Based on Conventional Physicochemical Parameters, Flavonoids, and Volatile Compounds Using Chemometrics. Molecules 2022, 27, 6166. [Google Scholar] [CrossRef]
- Vantarakis, A.; Affifi, M.; Kokkinos, P.; Tsibouxi, M.; Papapetropoulou, M. Occurrence of Microorganisms of Public Health and Spoilage Significance in Fruit Juices Sold in Retail Markets in Greece. Anaerobe 2011, 17, 288–291. [Google Scholar] [CrossRef]
- Krug, M.; Chapin, T.; Danyluk, M.; Goodrich-Schneider, R.; Schneider, K.; Harris, L.; Worobo, R. Outbreaks of foodborne disease associated with fruit and vegetable juices, 1922–2019: FSHN12-04/FS188, rev. 6/2020. Edis 2020, 2020. [Google Scholar]
- Cody, S.H.; Glynn, M.K.; Farrar, J.A.; Cairns, K.L.; Griffin, P.M.; Kobayashi, J.; Fyfe, M.; Hoffman, R.; King, A.S.; Lewis, J.H.; et al. An Outbreak of Escherichia coli O157:H7 Infection from Unpasteurized Commercial Apple Juice. Ann. Intern. Med. 1999, 130, 202–209. [Google Scholar] [CrossRef]
- Karatzas, K.A.G.; Hocking, P.M.; Jørgensen, F.; Mattick, K.; Leach, S.; Humphrey, T.J. Effects of Repeated Cycles of Acid Challenge and Growth on the Phenotype and Virulence of Salmonella enterica. J. Appl. Microbiol. 2008, 105, 1640–1648. [Google Scholar] [CrossRef] [PubMed]
- Ryu, J.H.; Beuchat, L.R. Influence of Acid Tolerance Responses on Survival, Growth, and Thermal Cross-Protection of Escherichia coli O157:H7 in Acidified Media and Fruit Juices. Int. J. Food Microbiol. 1998, 45, 185–193. [Google Scholar] [CrossRef]
- Wu, R.A.; Yuk, H.G.; Liu, D.; Ding, T. Recent Advances in Understanding the Effect of Acid-Adaptation on the Cross-Protection to Food-Related Stress of Common Foodborne Pathogens. Crit. Rev. Food Sci. Nutr. 2022, 62, 7336–7353. [Google Scholar] [CrossRef]
- Liu, Y.; Tang, H.; Lin, Z.; Xu, P. Mechanisms of Acid Tolerance in Bacteria and Prospects in Biotechnology and Bioremediation. Biotechnol. Adv. 2015, 33, 1484–1492. [Google Scholar] [CrossRef]
- Cavestri, C.; Savard, P.; Fliss, I.; Emond-Rhéault, J.G.; Hamel, J.; Kukavica-Ibrulj, I.; Boyle, B.; Daigle, F.; Malo, D.; Bekal, S.; et al. Salmonella enterica Subsp. enterica Virulence Potential Can Be Linked to Higher Survival within a Dynamic in Vitro Human Gastrointestinal Model. Food Microbiol. 2022, 101, 103877. [Google Scholar] [CrossRef]
- Guillén, S.; Marcén, M.; Fau, E.; Mañas, P.; Cebrián, G. Relationship between Growth Ability, Virulence, and Resistance to Food-Processing Related Stresses in Non-Typhoidal Salmonella. Int. J. Food Microbiol. 2022, 361, 109462. [Google Scholar] [CrossRef]
- Minekus, M.; Alminger, M.; Alvito, P.; Ballance, S.; Bohn, T.; Bourlieu, C.; Carrière, F.; Boutrou, R.; Corredig, M.; Dupont, D.; et al. A Standardised Static in Vitro Digestion Method Suitable for Food—An International Consensus. Food Funct. 2014, 5, 1113–1124. [Google Scholar] [CrossRef]
- Ortiz-Solà, J.; Colás-Medà, P.; Nicolau-Lapeña, I.; Alegre, I.; Abadias, M.; Viñas, I. Pathogenic Potential of the Surviving Salmonella Enteritidis on Strawberries after Disinfection Treatments Based on Ultraviolet-C Light and Peracetic Acid. Int. J. Food Microbiol. 2022, 364, 109536. [Google Scholar] [CrossRef]
- Geeraerd, A.H.; Valdramidis, V.P.; Van Impe, J.F. GInaFiT, a Freeware Tool to Assess Non-Log-Linear Microbial Survivor Curves. Int. J. Food Microbiol. 2005, 102, 95–105. [Google Scholar] [CrossRef] [PubMed]
- Kim, G.H.; Fratamico, P.; Breidt, F.; Oh, D.H. Survival and Expression of Acid Resistance Genes in Shiga Toxin-producing Escherichia coli Acid Adapted in Pineapple Juice and Exposed to Synthetic Gastric Fluid. J. Appl. Microbiol. 2016, 121, 1416–1426. [Google Scholar] [CrossRef] [PubMed]
- Usaga, J.; Worobo, R.W.; Padilla-Zakour, O.I. Effect of Acid Adaptation and Acid Shock on Thermal Tolerance and Survival of Escherichia coli O157:H7 and O111 in Apple Juice. J. Food Prot. 2014, 77, 1656–1663. [Google Scholar] [CrossRef] [PubMed]
- Malheiros, P.S.; Brandelli, A.; NoreÑa, C.P.Z.; Tondo, E.C. Acid and thermal resistance of a Salmonella Enteritidis strain involved in several foodborne outbreaks. J. Food Saf. 2009, 29, 302–317. [Google Scholar] [CrossRef]
- Breidt, F.; Hayes, J.; Mcfeeters, R.F. Determination of 5-Log Reduction Times for Food Pathogens in Acidified Cucumbers during Storage at 10 and 25 °C. J. Food Prot. 2007, 70, 2638–2641. [Google Scholar] [CrossRef]
- Liu, Y.; Zhang, Y.; Zhu, L.; Niu, L.; Luo, X.; Dong, P. The Acid Tolerance Responses of the Salmonella Strains Isolated from Beef Processing Plants. Food Microbiol. 2022, 104, 103977. [Google Scholar] [CrossRef]
- Oteiza, J.M.; Caturla, Y.R.; Do Prado-Silva, L.; Câmara, A.A.B.; Barril, P.A.; Sant’ana, A.S.; Giannuzzi, L.; Zaritzky, N. Adaptation of O157:H7 and Non-O157 Escherichia coli Strains in Orange Juice and Subsequent Resistance to UV-C Radiation. LWT-Food Sci. Technol. 2022, 157, 113107. [Google Scholar] [CrossRef]
- Wang, X.; Tian, S.; Wu, Y.; Li, H.; Bai, L.I.; Liu, H.; Zhang, X.; Dong, Q. Strain Variability in Growth and Thermal Inactivation Characteristics of Listeria monocytogenes Strains after Acid Adaptation. J. Food Prot. 2021, 84, 2229–2236. [Google Scholar] [CrossRef]
- Clemente-Carazo, M.; Leal, J.J.; Huertas, J.P.; Garre, A.; Palop, A.; Periago, P.M. The Different Response to an Acid Shock of Two Salmonella Strains Marks Their Resistance to Thermal Treatments. Front. Microbiol. 2021, 12, 691248. [Google Scholar] [CrossRef] [PubMed]
- Lianou, A.; Koutsoumanis, K.P. Evaluation of the Strain Variability of Salmonella enterica Acid and Heat Resistance. Food Microbiol. 2013, 34, 259–267. [Google Scholar] [CrossRef] [PubMed]
- Koutsoumanis, K.P.; Sofos, J.N. Comparative Acid Stress Response of Listeria monocytogenes, Escherichia coli O157:H7 and Salmonella Typhimurium after Habituation at Different PH Conditions. Lett. Appl. Microbiol. 2004, 38, 321–326. [Google Scholar] [CrossRef]
- Samelis, J.; Ikeda, J.S.; Sofos, J.N. Evaluation of the PH-Dependent, Stationary-Phase Acid Tolerance in Listeria monocytogenes and Salmonella Typhimurium DT104 Induced by Culturing in Media with 1% Glucose: A Comparative Study with Escherichia coli O157:H7. J. Appl. Microbiol. 2003, 95, 563–575. [Google Scholar] [CrossRef]
- Álvarez-Ordóñez, A.; Fernández, A.; Bernardo, A.; López, M. Acid Tolerance in Salmonella Typhimurium Induced by Culturing in the Presence of Organic Acids at Different Growth Temperatures. Food Microbiol. 2010, 27, 44–49. [Google Scholar] [CrossRef]
- Greenacre, E.J.; Brocklehurst, T.F.; Waspe, C.R.; Wilson, D.R.; Wilson, P.D.G. Salmonella enterica Serovar Typhimurium and Listeria monocytogenes Acid Tolerance Response Induced by Organic Acids at 20 °C: Optimization and Modeling. Appl. Environ. Microbiol. 2003, 69, 3945–3951. [Google Scholar] [CrossRef]
- Buchanan, R.L.; Edelson, S.G. Culturing Enterohemorrhagic Escherichia coli in the Presence and Absence of Glucose as a Simple Means of Evaluating the Acid Tolerance of Stationary-Phase Cells. Appl. Environ. Microbiol. 1996, 62, 4009–4013. [Google Scholar] [CrossRef]
- Álvarez-Ordóñez, A.; Fernández, A.; Bernardo, A.; López, M. Comparison of Acids on the Induction of an Acid Tolerance Response in Salmonella Typhimurium, Consequences for Food Safety. Meat Sci. 2009, 81, 65–70. [Google Scholar] [CrossRef]
- Oteiza, J.M.; do Prado-Silva, L.; Caturla, M.Y.R.; Barril, P.A.; Leda, G.; Sant’Ana, A.S. Variability in the Acid Adaptation of Ten Different O157:H7 and Non-O157 Escherichia coli Strains in Orange Juice and the Impact on UV Radiation Resistance. Food Microbiol. 2024, 124, 104610. [Google Scholar] [CrossRef] [PubMed]
- Yuk, H.G.; Schneider, K.R. Adaptation of Salmonella Spp. in Juice Stored under Refrigerated and Room Temperature Enhances Acid Resistance to Simulated Gastric Fluid. Food Microbiol. 2006, 23, 694–700. [Google Scholar] [CrossRef] [PubMed]
- Audia, J.P.; Webb, C.C.; Foster, J.W. Breaking through the Acid Barrier: An Orchestrated Response to Proton Stress by Enteric Bacteria. Int. J. Med. Microbiol. 2001, 291, 97–106. [Google Scholar] [CrossRef]
- Smith, J.L. The Role of Gastric Acid in Preventing Foodborne Disease and How Bacteria Overcome Acid Conditions. J. Food Prot. 2003, 66, 1292–1303. [Google Scholar] [CrossRef] [PubMed]
- Yang, Y.; Khoo, W.J.; Zheng, Q.; Chung, H.J.; Yuk, H.G. Growth Temperature Alters Salmonella Enteritidis Heat/Acid Resistance, Membrane Lipid Composition and Stress/Virulence Related Gene Expression. Int. J. Food Microbiol. 2014, 172, 102–109. [Google Scholar] [CrossRef]
- Álvarez-Ordóñez, A.; Prieto, M.; Bernardo, A.; Hill, C.; López, M. The Acid Tolerance Response of Salmonella Spp.: An Adaptive Strategy to Survive in Stressful Environments Prevailing in Foods and the Host. Food Res. Int. 2012, 45, 482–492. [Google Scholar] [CrossRef]
- Miszczycha, S.D.; Thévenot, J.; Denis, S.; Callon, C.; Livrelli, V.; Alric, M.; Montel, M.C.; Blanquet-Diot, S.; Thevenot-Sergentet, D. Survival of Escherichia coli O26:H11 Exceeds That of Escherichia coli O157:H7 as Assessed by Simulated Human Digestion of Contaminated Raw Milk Cheeses. Int. J. Food Microbiol. 2014, 172, 40–48. [Google Scholar] [CrossRef]
- Stewart, G.R.; Snewin, V.A.; Walzl, G.; Hussell, T.; Tormay, P.; O’Gaora, P.; Goyal, M.; Betts, J.; Brown, I.N.; Young, D.B. Overexpression of Heat-Shock Proteins Reduces Survival of Mycobacterium tuberculosis in the Chronic Phase of Infection. Nat. Med. 2001, 7, 732–737. [Google Scholar] [CrossRef]
- Karatzas, K.A.G.; Wouters, J.A.; Gahan, C.G.M.; Hill, C.; Abee, T.; Bennik, M.H.J. The CtsR Regulator of Listeria monocytogenes Contains a Variant Glycine Repeat Region That Affects Piezotolerance, Stress Resistance, Motility and Virulence. Mol. Microbiol. 2003, 49, 1227–1238. [Google Scholar] [CrossRef]
- Boddicker, J.D.; Jones, B.D. Lon Protease Activity Causes Down-Regulation of Salmonella Pathogenicity Island 1 Invasion Gene Expression after Infection of Epithelial Cells. Infect. Immun. 2004, 72, 2002–2013. [Google Scholar] [CrossRef]
- Guillén, S.; Marcén, M.; Mañas, P.; Cebrián, G. Differences in Resistance to Different Environmental Stresses and Non-Thermal Food Preservation Technologies among Salmonella enterica Subsp. enterica Strains. Food Res. Int. 2020, 132, 109042. [Google Scholar] [CrossRef] [PubMed]
- Velge, P.; Wiedemann, A.; Rosselin, M.; Abed, N.; Boumart, Z.; Chaussé, A.M.; Grépinet, O.; Namdari, F.; Roche, S.M.; Rossignol, A.; et al. Multiplicity of Salmonella Entry Mechanisms, a New Paradigm for Salmonella Pathogenesis. Microbiologyopen 2012, 1, 243–258. [Google Scholar] [CrossRef] [PubMed]
- Shah, D.H. RNA Sequencing Reveals Differences between the Global Transcriptomes of Salmonella enterica Serovar Enteritidis Strains with High and Low Pathogenicities. Appl. Environ. Microbiol. 2014, 80, 896–906. [Google Scholar] [CrossRef] [PubMed]
- Yin, X.; Gyles, C.L.; Gong, J. Grapefruit Juice and Its Constituents Augment the Effect of Low PH on Inhibition of Survival and Adherence to Intestinal Epithelial Cells of Salmonella enterica Serovar Typhimurium PT193. Int. J. Food Microbiol. 2012, 158, 232–238. [Google Scholar] [CrossRef]

Disclaimer/Publisher’s Note: The statements, opinions and data contained in all publications are solely those of the individual author(s) and contributor(s) and not of MDPI and/or the editor(s). MDPI and/or the editor(s) disclaim responsibility for any injury to people or property resulting from any ideas, methods, instructions or products referred to in the content. |
© 2025 by the authors. Licensee MDPI, Basel, Switzerland. This article is an open access article distributed under the terms and conditions of the Creative Commons Attribution (CC BY) license (https://creativecommons.org/licenses/by/4.0/).