
A Principal Components Analysis-Based Method for the Detection of Cannabis Plants Using Representation Data by Remote Sensing


Abstract
:1. Summary
2. Data Description
- the planning of flight campaigns on the Albanian territory
- the acquisition through the use of hyperspectral sensor CASI1500 of hyperspectral images
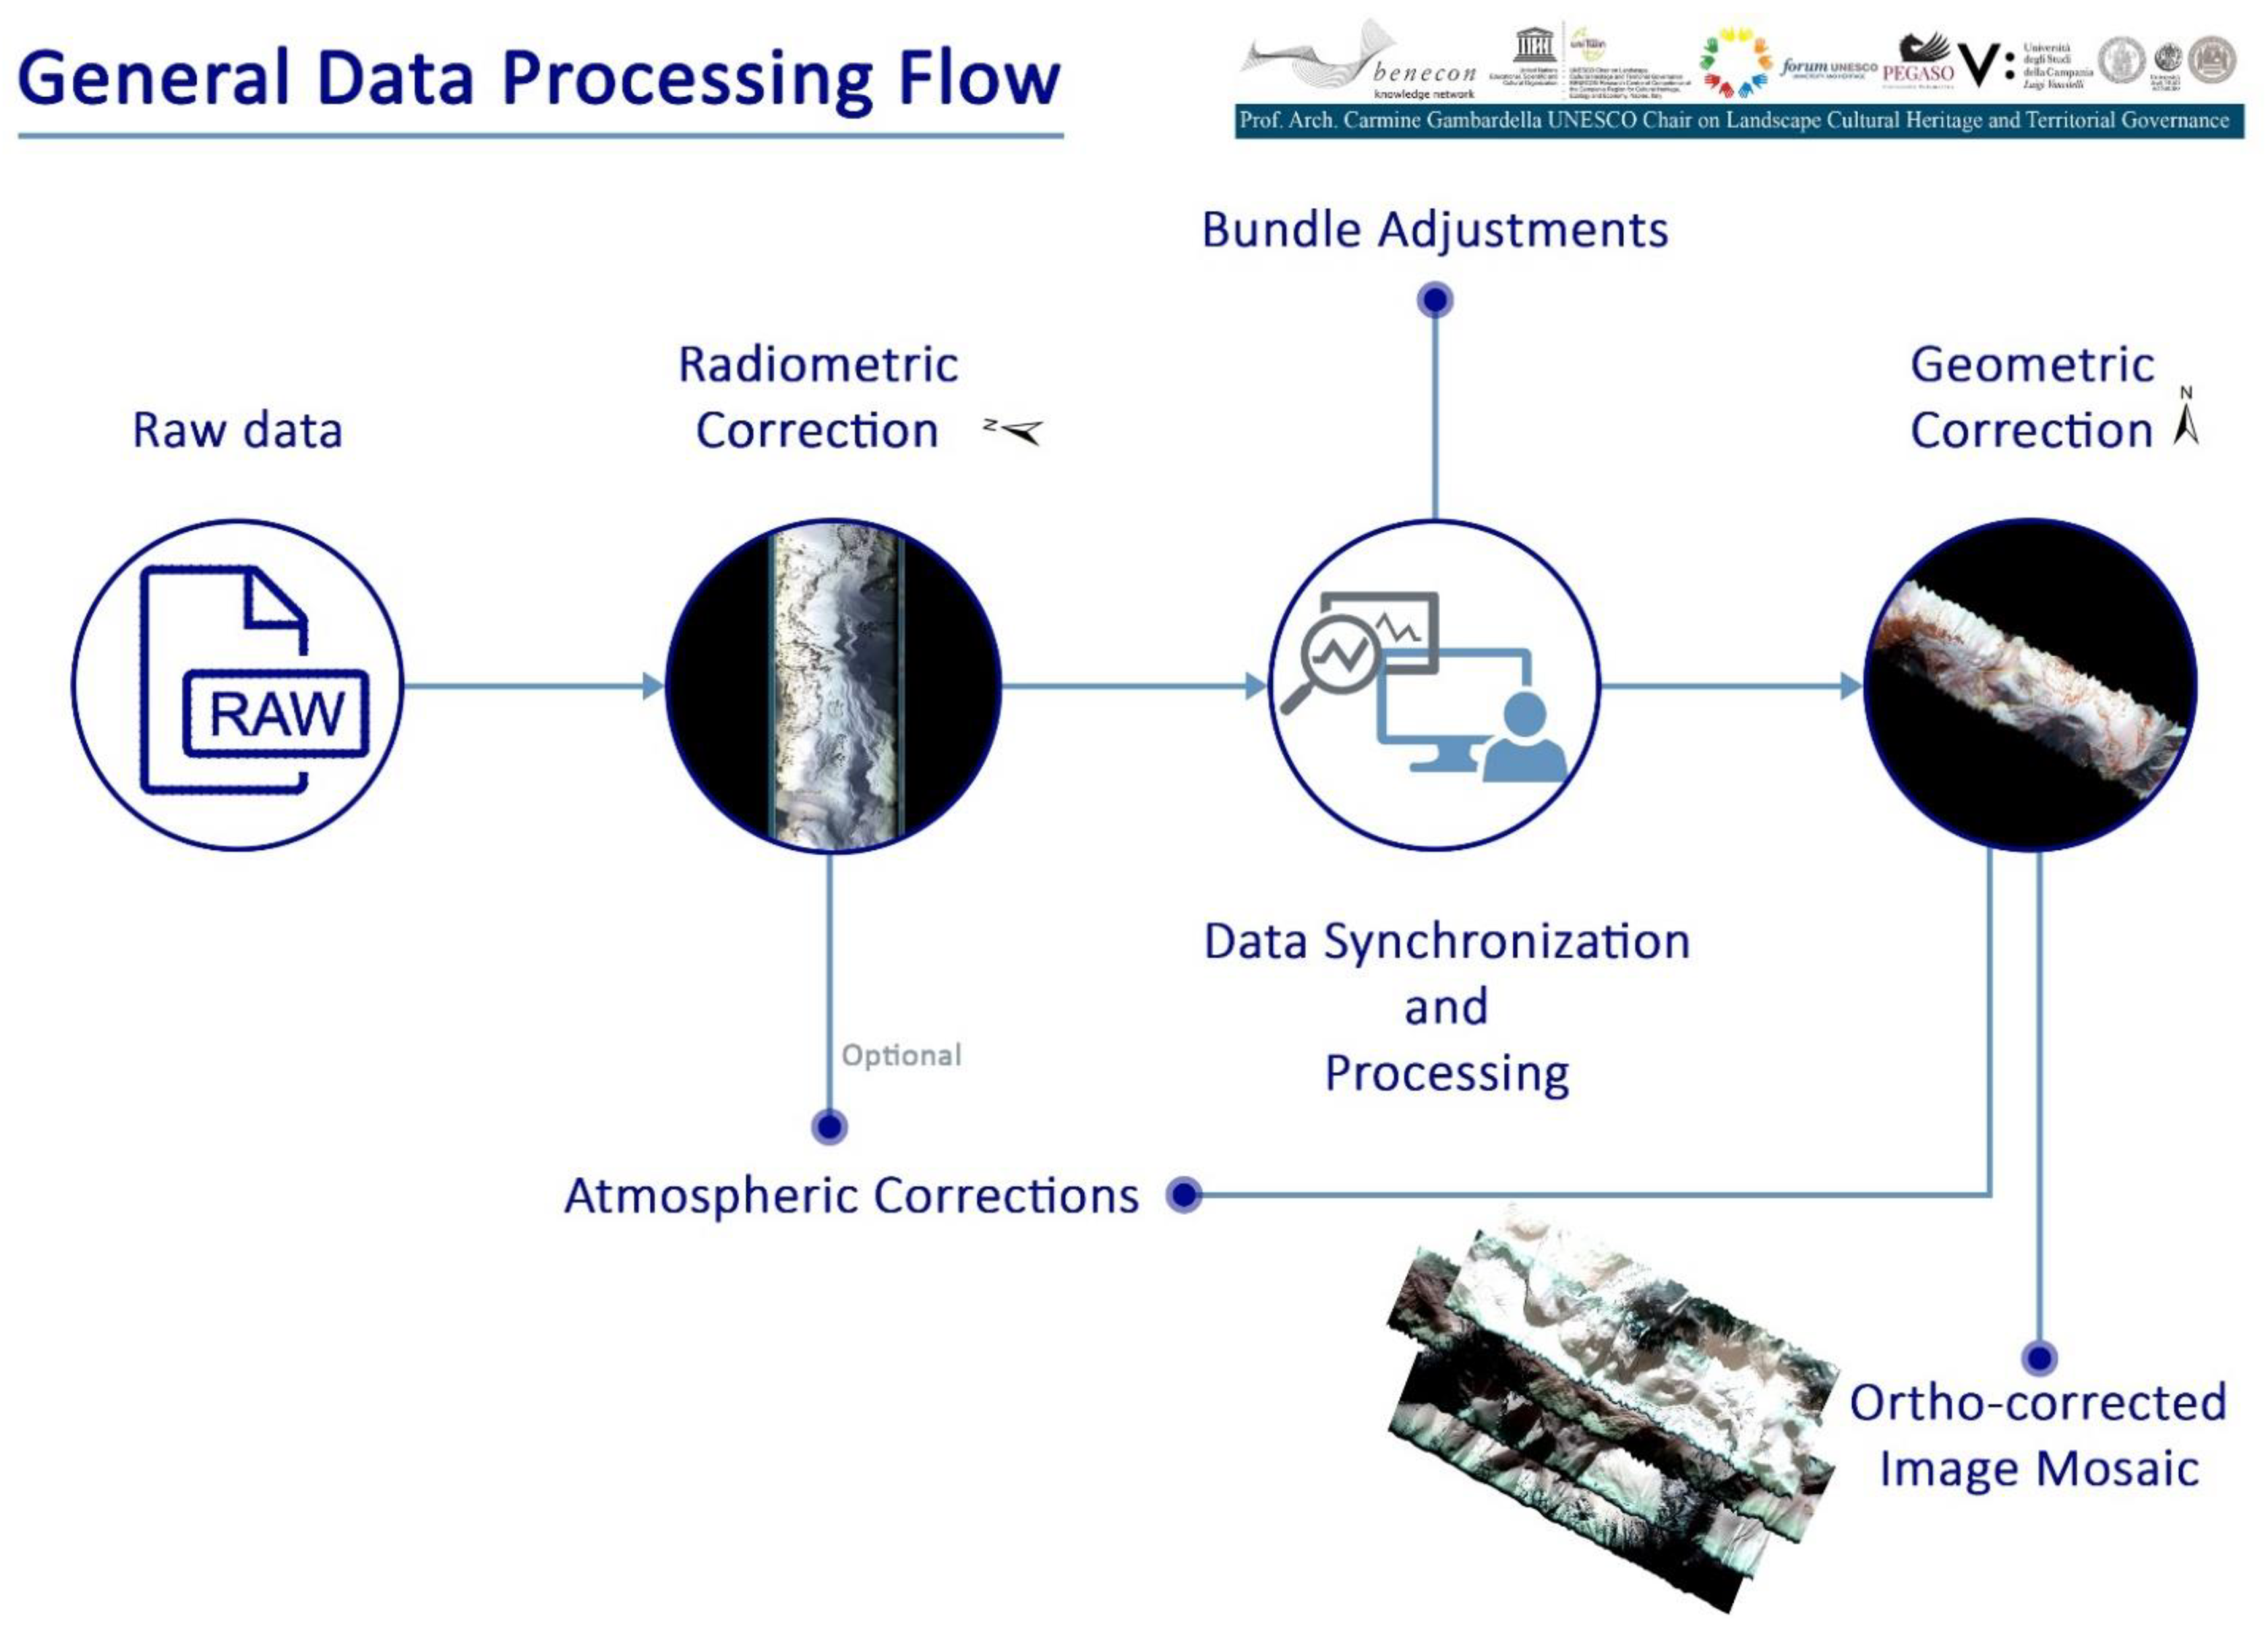
- the subsequent processing of the acquired data by the researchers of the BENECON Regional Competence Center
- the analysis of the elaborated data and the identification of cannabis plantations
- the writing of the report for Albanian police forces.
3. Methods
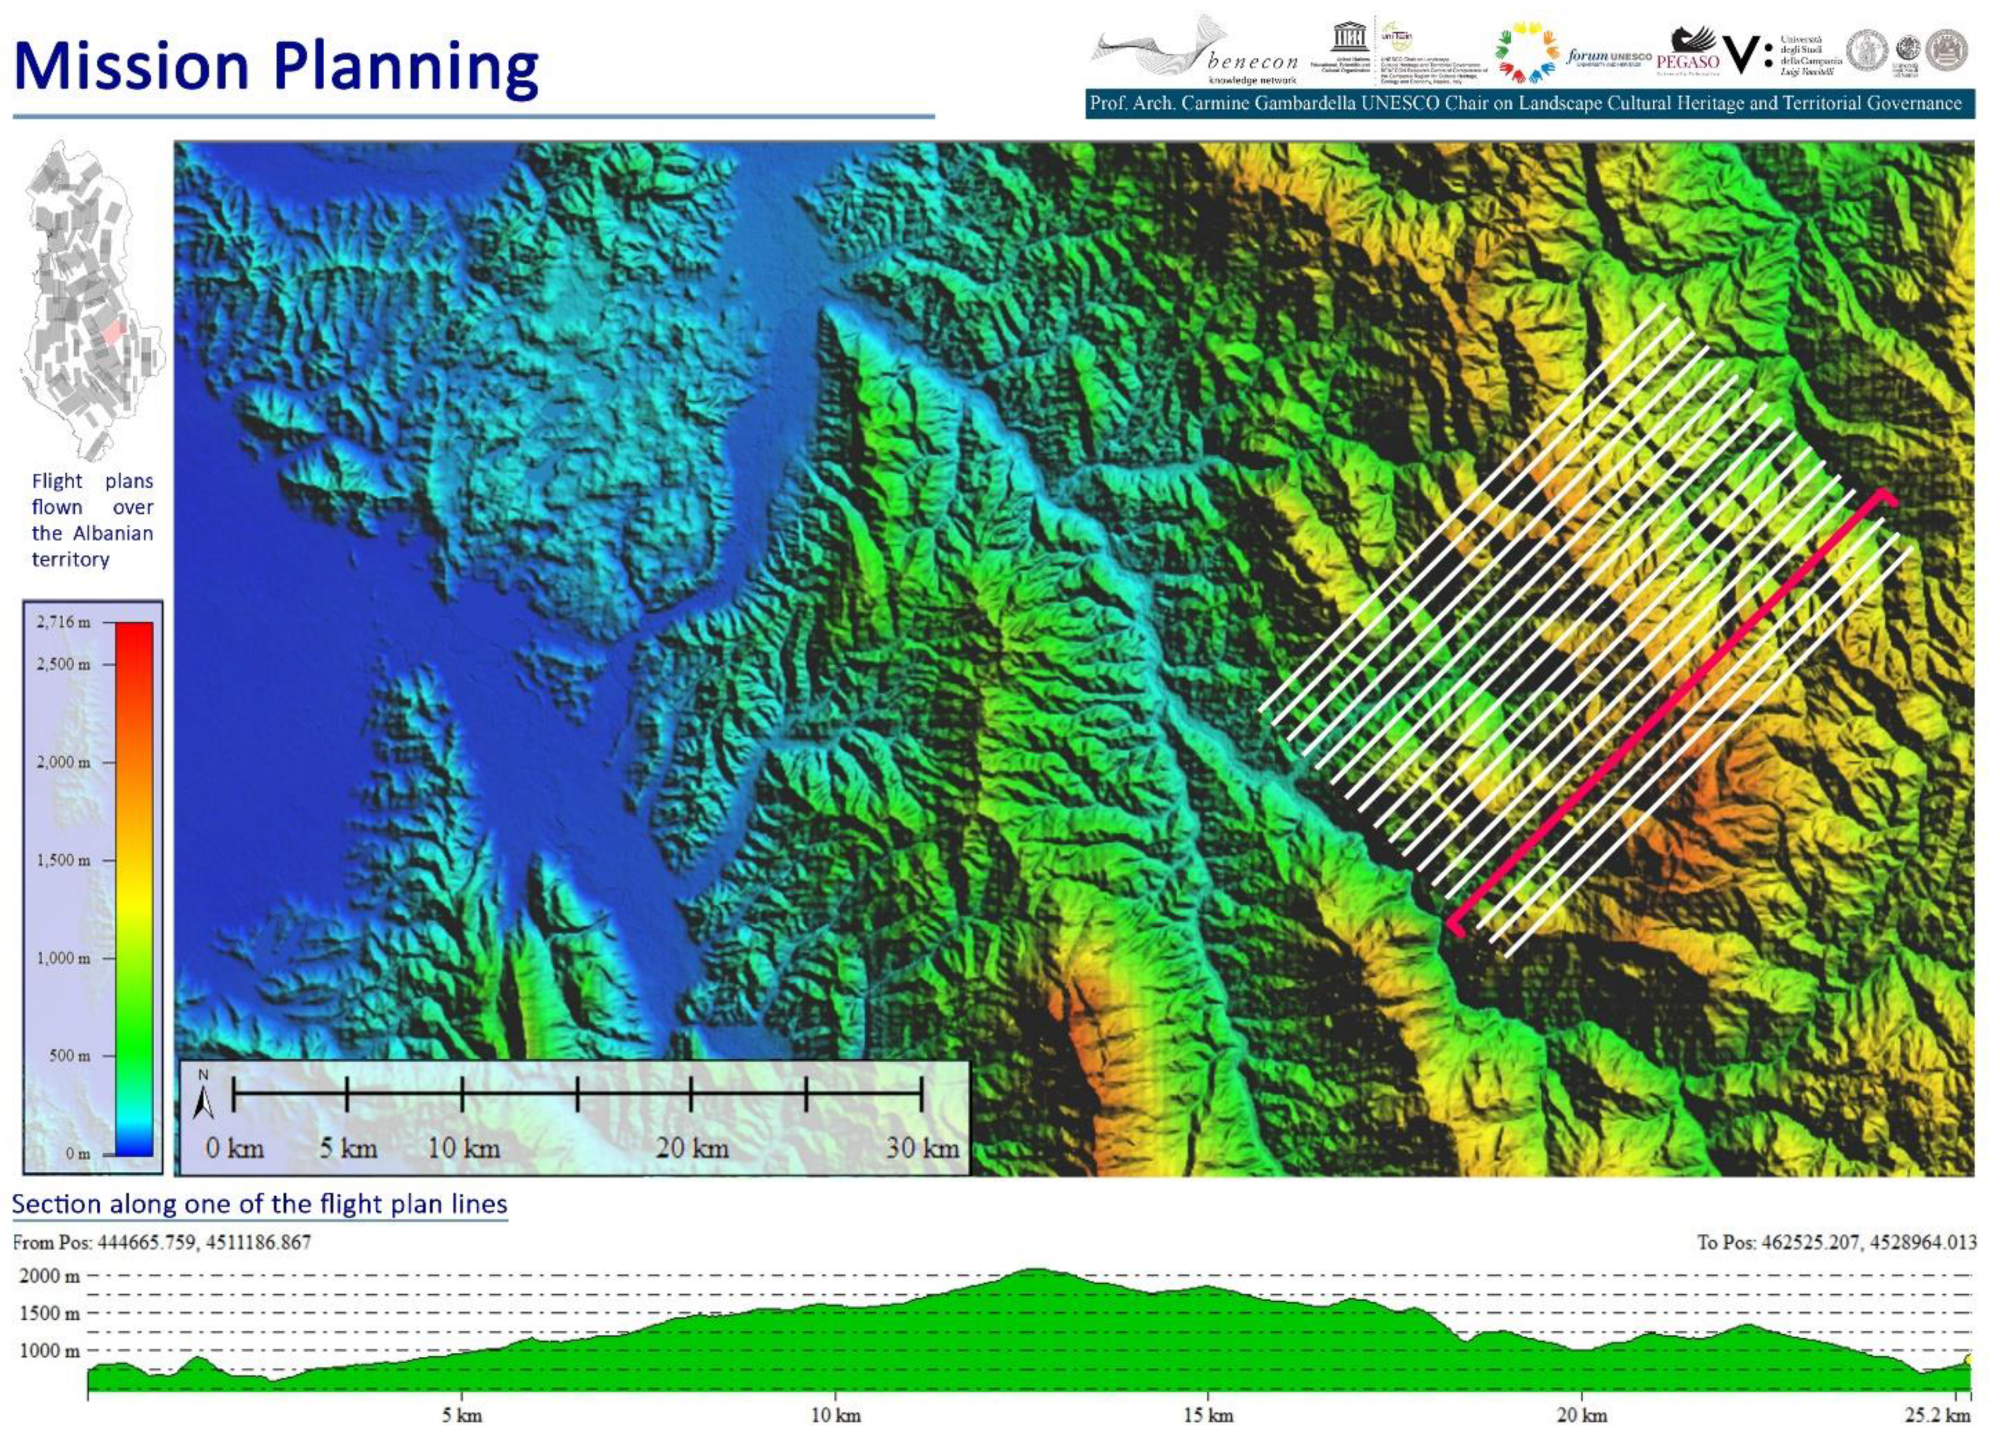
3.1. Remote Sensing Flight Planning Phase
3.2. The Acquisition Phase
- digital aeronautical maps
- digital elevation models; textured orthophoto
- topographic files in .shp format
- topographic paper maps.
- the existing cartography, the analysis of aerial patrol missions carried out in the early stages of the mission
- critical evaluations that take into consideration elements that characterize the cultivation of cannabis
- the reports of the local police.
3.3. Drawing the Territory
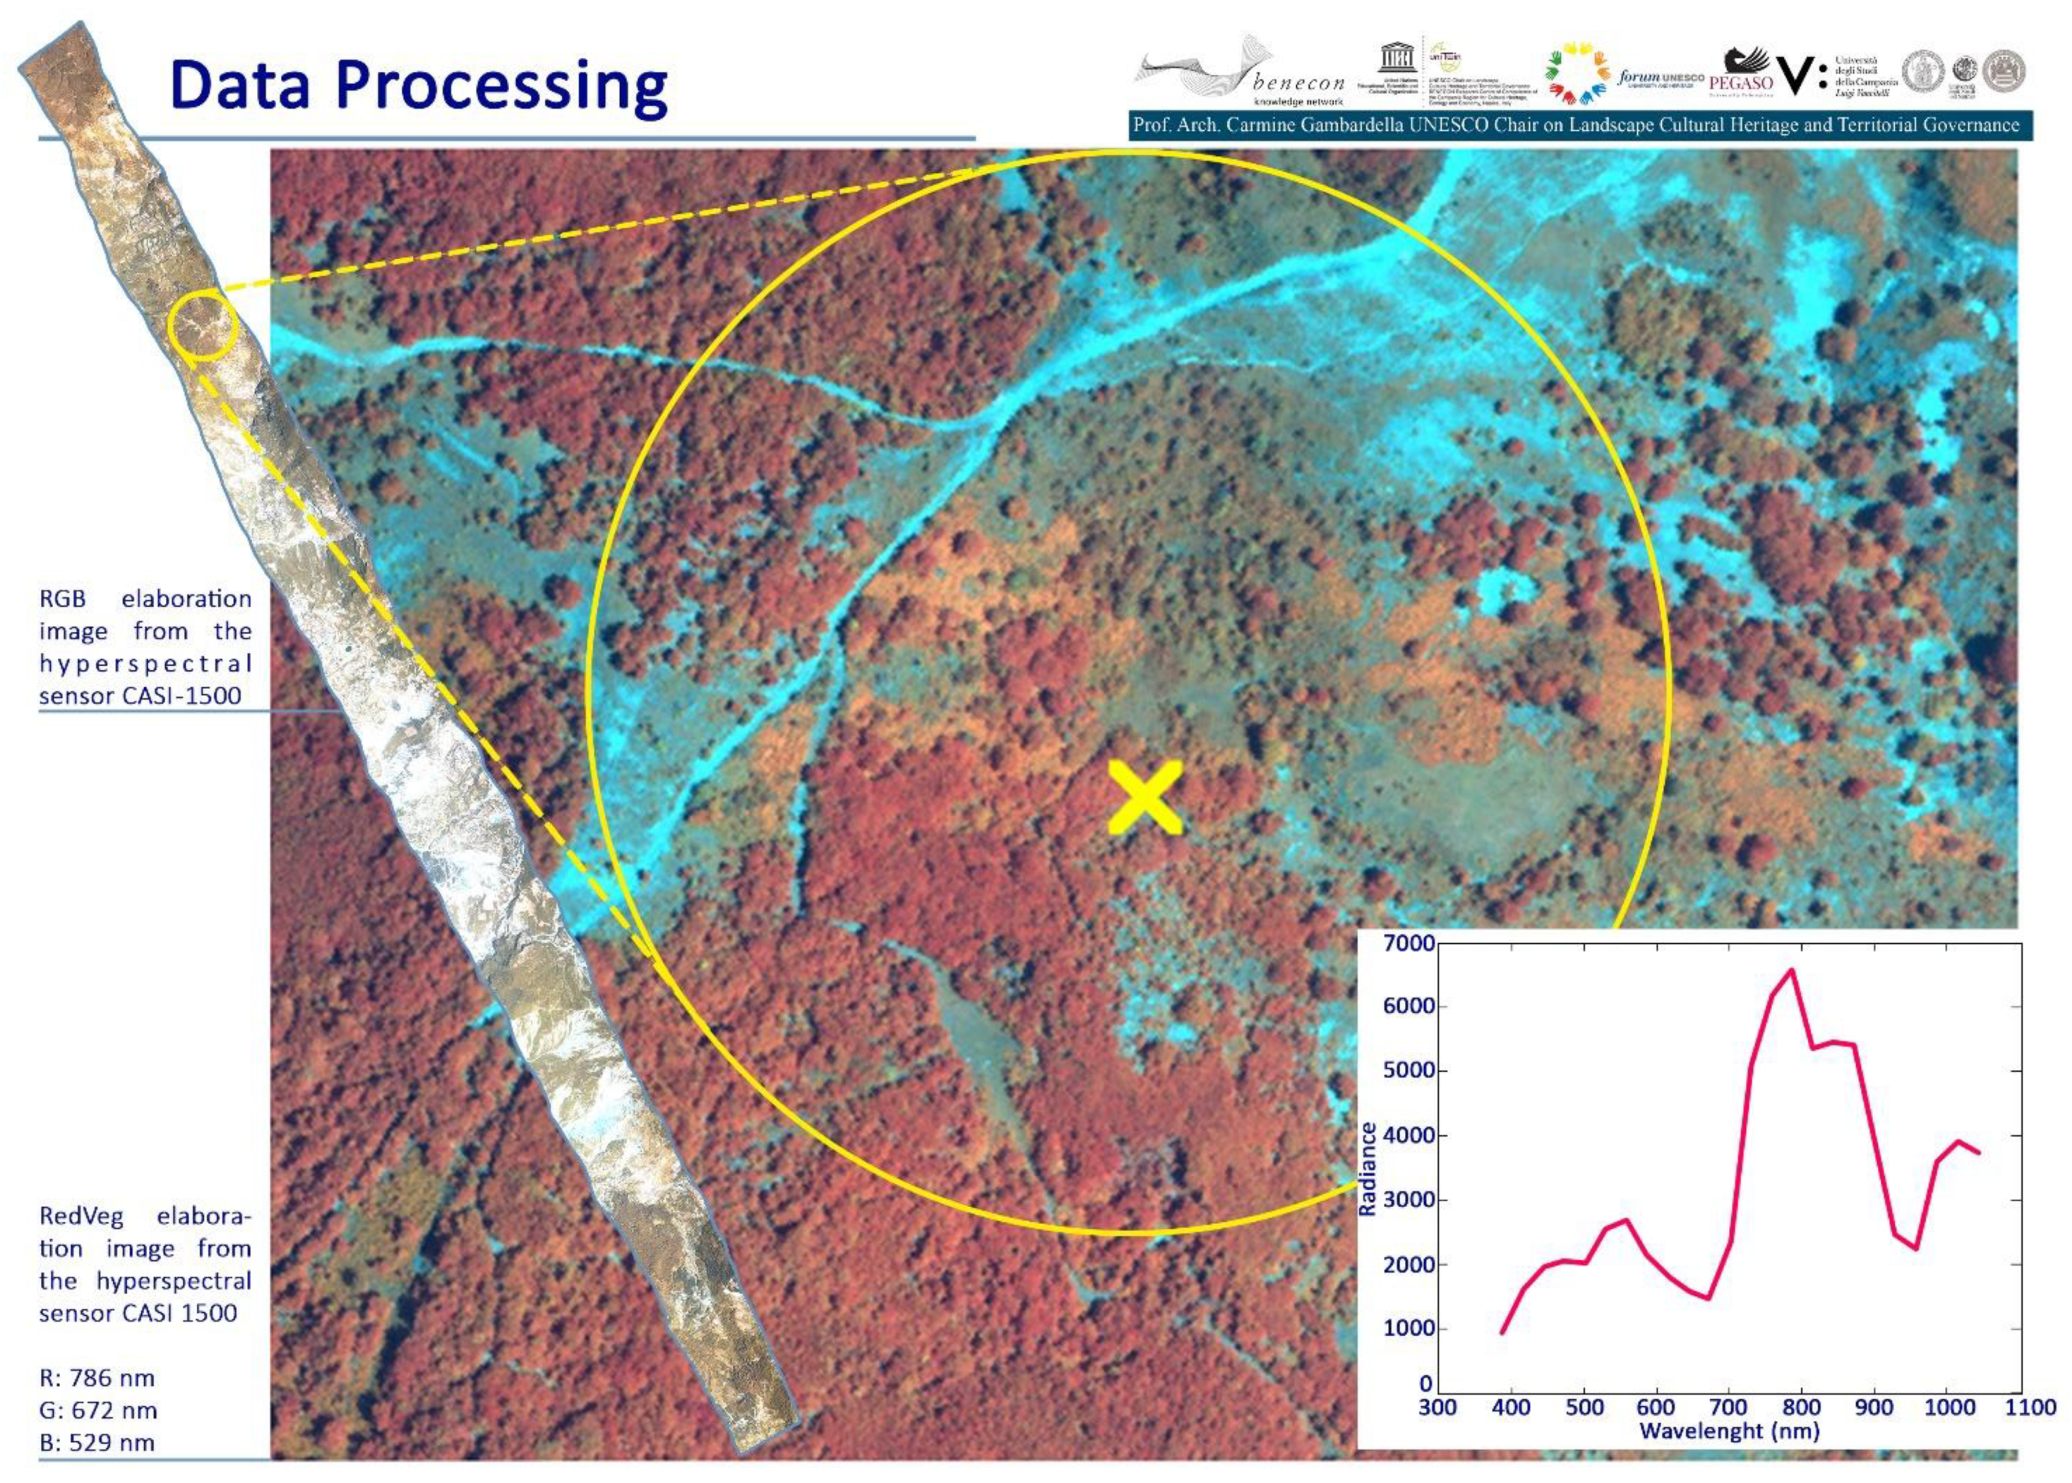
3.4. Qualitative and Quantitative Analysis of Hyperspectral Data
- “true color” images, sampled in the electromagnetic wavelengths distinguishable by the human eye, for the photo-realistic representation of the territory; this natural color representation associates 700 nm, 550 nm and 450 nm bands respectively to the red, green and blue channels of the monitor;
- redVeg images enhance the greater or lesser density of the vegetation with shades of red [17]. Indeed, for the representation of vegetated areas, this false color representation associates to each red, green and blue channel of the monitor the 789, 675 and 542 nm hyperspectral band respectively (Figure 3).
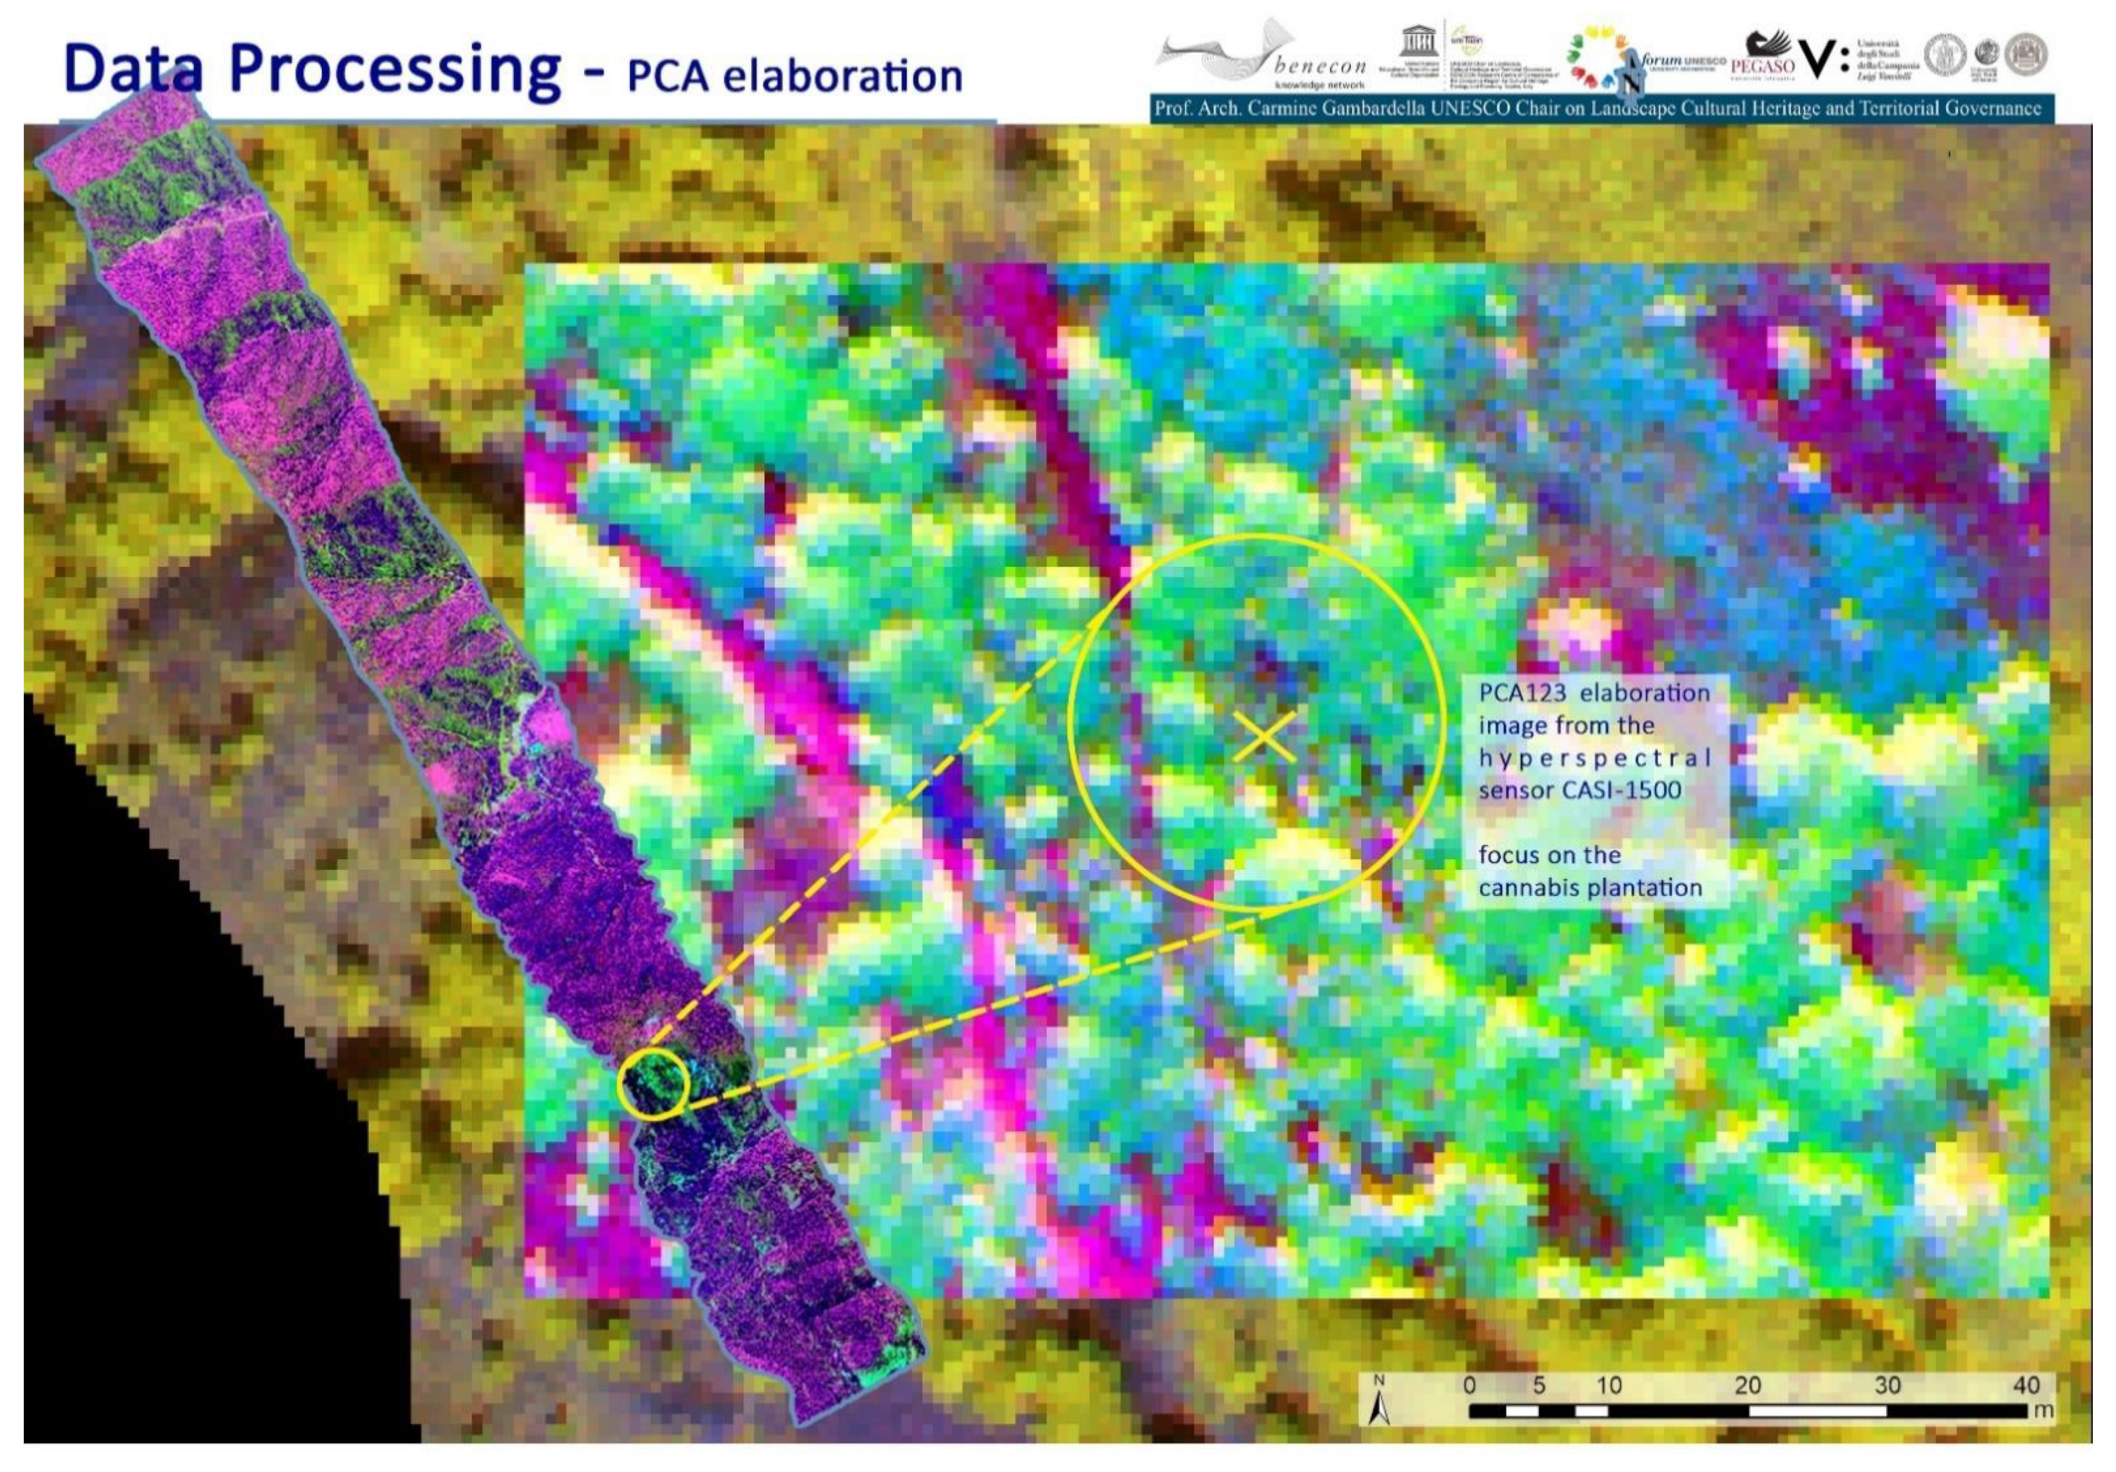
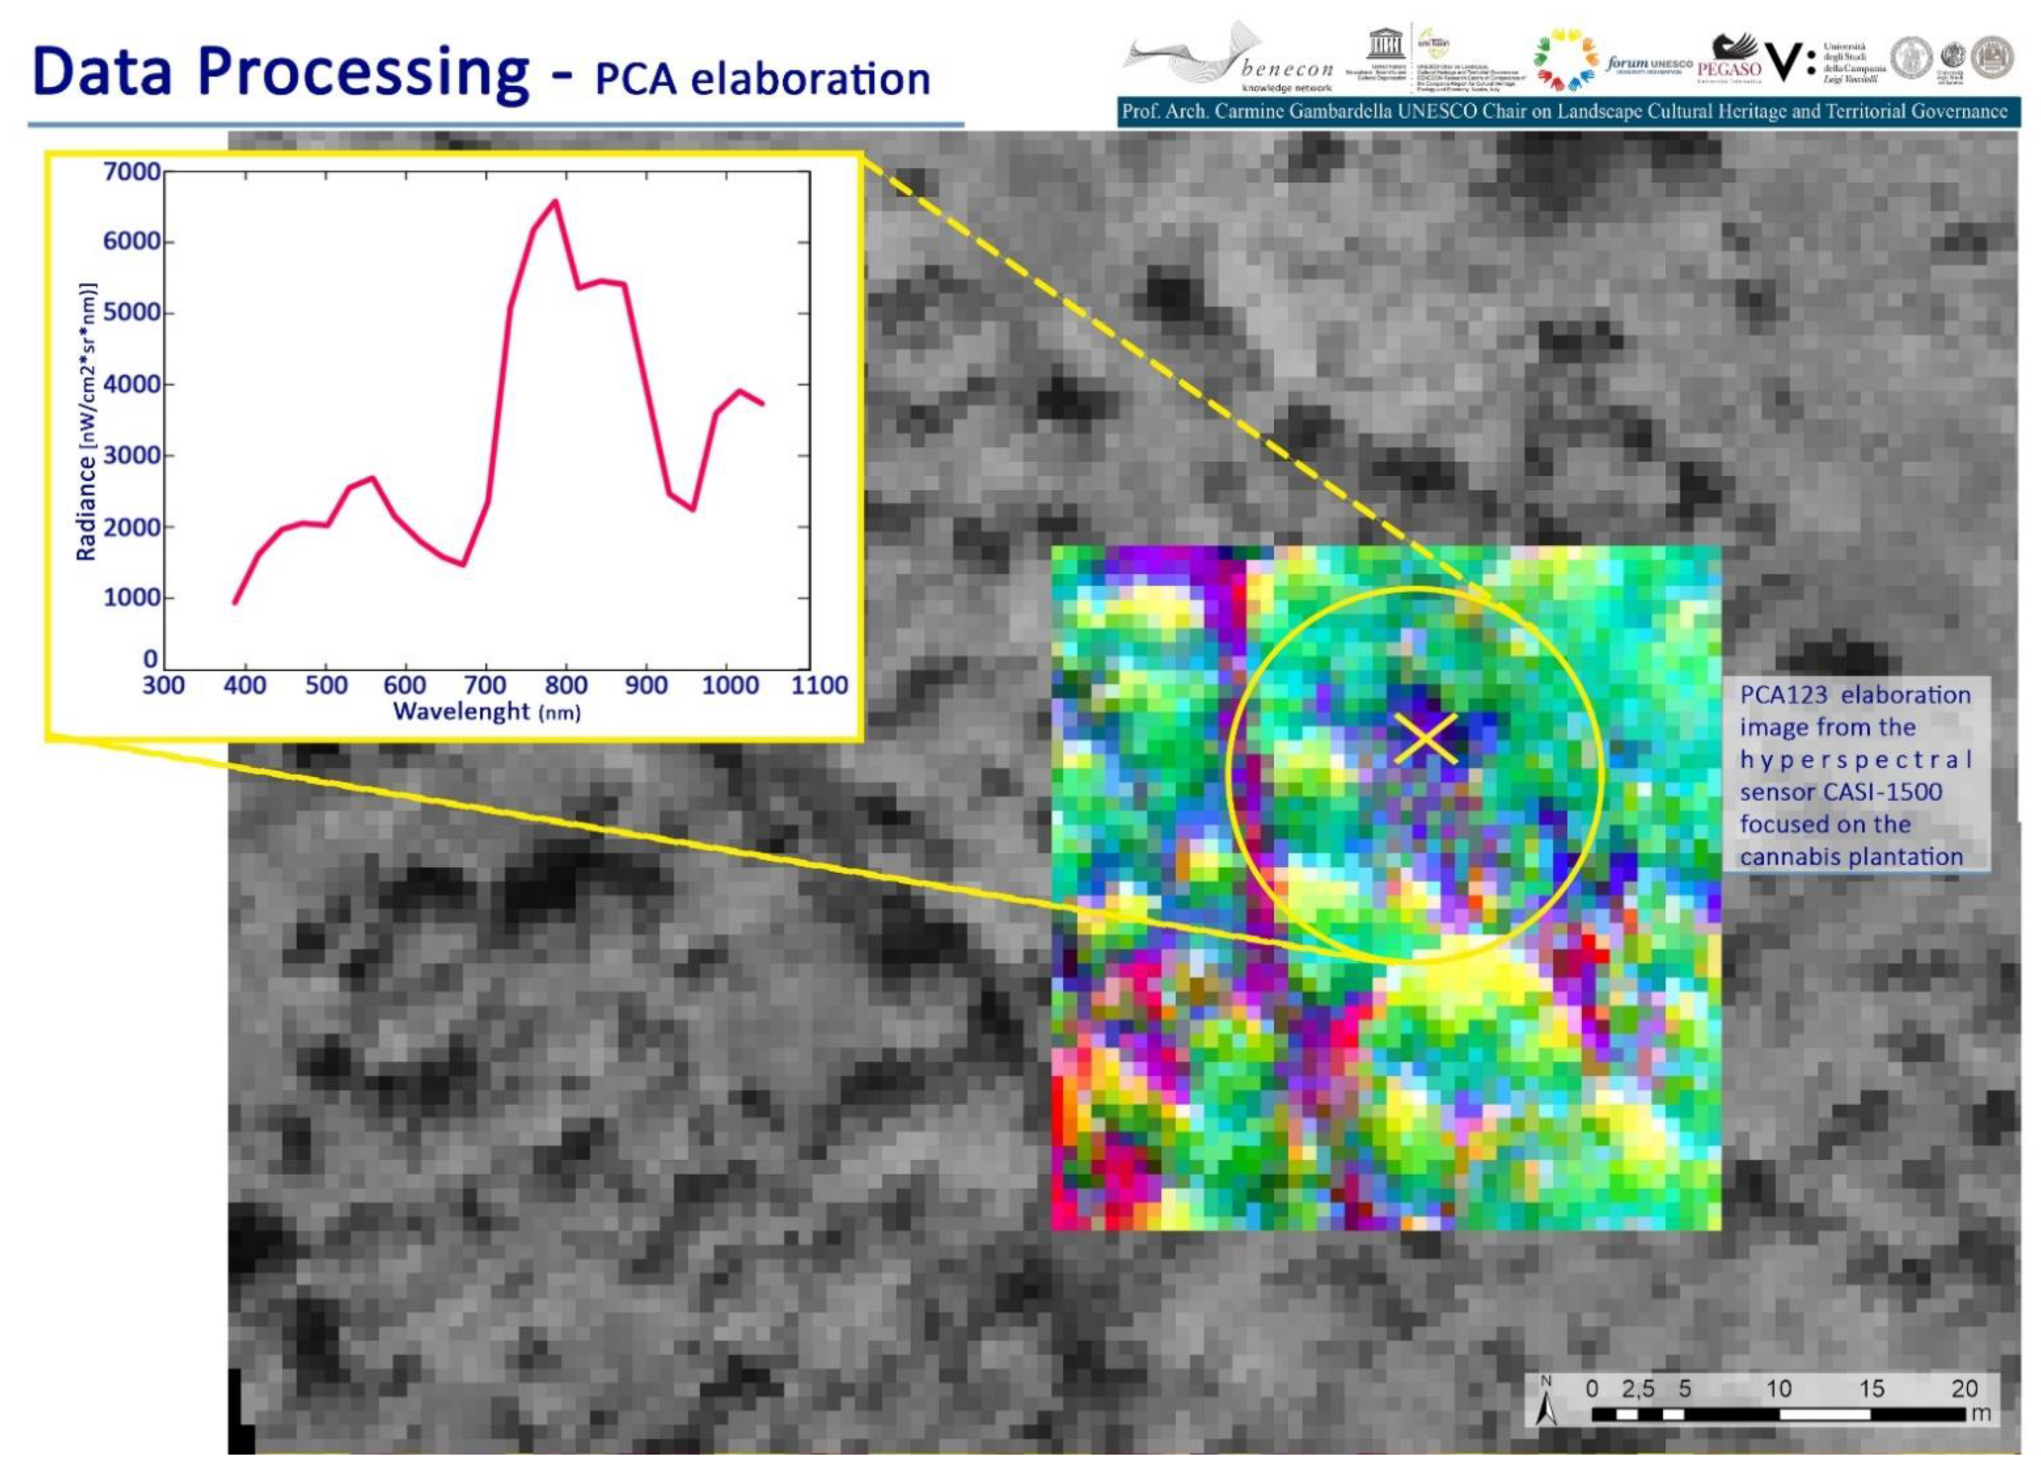
3.5. Principal Component Analysis (PCA)-Based Method
- the reduction of the original data with the consequent computational simplification
- the reinterpretation of these observations.
4. Results and Discussion
5. Conclusions
Author Contributions
Funding
Institutional Review Board Statement
Informed Consent Statement
Data Availability Statement
Conflicts of Interest
References
- Serious and Organised Crime Threat Assessment. A Corrupting Influence: The Infiltration and Undermining of Europe’s Economy and Society by Organised Crime. Report. Available online: https://www.europol.europa.eu/activities-services/main-reports/european-union-serious-and-organised-crime-threat-assessment (accessed on 5 July 2021).
- Dugato, M.; Calderoni, F.; Campedelli, G.M. Measuring organised crime presence at the municipal level. Soc. Indic. Res. 2020, 147, 237–261. [Google Scholar] [CrossRef]
- Djordjević, S.; Dobovšek, B. Organised crime in Western Balkans Six at the onset of coronavirus. Int. J. Soc. Soc. Policy 2020, 40, 807–820. [Google Scholar] [CrossRef]
- Omelchuk, O.; Kopanchuk, V.; Orlovskyi, B.; Shekhovtsova, L.; Yanishevska, K.; Kopanchuk, O. Illicit Trafficking in Narcotic Drugs and Their Analogues Using Computer Technology: A Criminal Law Study. Available online: http://ojs.ual.es/ojs/index.php/eea/article/view/4785 (accessed on 5 July 2021).
- Elezi, M.; Zenelaj, E. Drug Production and Trafficking in Albania. IJoSS. Available online: https://www.researchgate.net/publication/271529199_Drug_Production_and_Trafficking_in_Albania (accessed on 5 July 2021).
- Azaria, I.; Goldschleger, N.; Ben-Dor, E. Identification of Cannabis plantations using hyperspectral technology. Isr. J. Plant Sci. 2012, 60, 77–83. [Google Scholar] [CrossRef]
- Houmi, M.; Mohamadi, B.; Balz, T. A Hyperspectral Based Method to Detect Cannabis Plantation in inaccessible areas. Int. Arch. Photogramm. Remote Sens. Spat. Inf. Sci. 2018, 42, 547–551. [Google Scholar] [CrossRef] [Green Version]
- Itres CASI 1500 Sensor. Available online: https://itres.com/sensor-line-1-high-fidelity-hyperspectral-sensor-system/ (accessed on 5 July 2021).
- Bowker, D.E. Spectral Reflectances of Natural Targets for Use in Remote Sensing Studies. Available online: https://www.researchgate.net/publication/24330672_Spectral_Reflectances_of_Natural_Targets_for_Use_in_Remote_Sensing_Studies (accessed on 5 July 2021).
- Melesse, A.M.; Weng, Q.; Thenkabail, P.S.; Senay, G.B. Remote sensing sensors and applications in environmental resources mapping and modelling. Sensors 2007, 7, 3209–3324. [Google Scholar] [CrossRef] [PubMed] [Green Version]
- Guanter, L.; Estellés, V.; Moreno, J. Spectral calibration and atmospheric correction of ultra-fine spectral and spatial resolution remote sensing data. Application to CASI-1500 data. Remote Sens. Environ. 2007, 109, 54–65. [Google Scholar] [CrossRef]
- De Miguel, E.; Fernández-Renau, A.; Prado, E.; Jiménez, M.; de la Cámara, Ó.G.; Linés, C.; Muñoz, F. The processing of CASI-1500I data at INTA PAF. EARSeL Eproceedings 2014, 13, 30–37. [Google Scholar]
- Bachmann, C.M.; Nichols, C.R.; Montes, M.J.; Li, R.R.; Woodward, P.; Fusina, R.A.; Mcilhany, K. Retrieval of substrate bearing strength from hyperspectral imagery during the Virginia Coast Reserve (VCR’07) multi-sensor campaign. Mar. Geod. 2010, 33, 101–116. [Google Scholar] [CrossRef]
- Beisl, U. BRDF Correction in Hyperspectral Imagery. In Proceedings of the Digital Airborne Spectrometer Experiment (DAISEX) Final Results Workshop, Noordwijk, The Netherlands, 15–16 March 2001. [Google Scholar]
- Xiang, H.; Tian, L. Method for automatic georeferencing aerial remote sensing (RS) images from an unmanned aerial vehicle (UAV) platform. Biosyst. Eng. 2011, 108, 104–113. [Google Scholar] [CrossRef]
- Fisher, P.F.; Tate, N.J. Causes and consequences of error in digital elevation models. Prog. Phys. Geogr. 2006, 30, 467–489. [Google Scholar] [CrossRef]
- Kamble, B.; Kilic, A.; Hubbard, K. Estimating crop coefficients using remote sensing-based vegetation index. Remote Sens. 2013, 5, 1588–1602. [Google Scholar] [CrossRef] [Green Version]
- Daughtry, C.S.T.; Walthall, C.L. Spectral discrimination of Cannabis sativa L. leaves and canopies. Remote Sens. Environ. 1998, 64, 192–201. [Google Scholar] [CrossRef]
- Kruse, F.A.; Lefkoff, A.B.; Boardman, J.W.; Heidebrecht, K.B.; Shapiro, A.T.; Barloon, P.J.; Goetz, A.F.H. The spectral image processing system (SIPS)—Interactive visualization and analysis of imaging spectrometer data. Remote Sens. Environ. 1993, 44, 145–163. [Google Scholar] [CrossRef]
- Ready, P.; Wintz, P. Information extraction, SNR improvement, and data compression in multispectral imagery. IEEE Trans. Commun. 1973, 21, 1123–1131. [Google Scholar] [CrossRef]
- Reed, I.S.; Yu, X. Adaptive multiple-band CFAR detection of an optical pattern with unknown spectral distribution. IEEE Trans. Acoust. Speech Signal Process. 1990, 38, 1760–1770. [Google Scholar] [CrossRef]
- Motohka, T.; Nasahara, K.N.; Oguma, H.; Tsuchida, S. Applicability of green-red vegetation index for remote sensing of vegetationphenology. Remote Sens. 2010, 2, 2369–2387. [Google Scholar] [CrossRef] [Green Version]
- Sulova, A.; Jokar Arsanjani, J. Exploratory analysis of driving force of wildfires in Australia: An application of machine learning within Google Earth engine. Remote Sens. 2021, 13, 10. [Google Scholar] [CrossRef]
- Jolliffe, I. Principal Component Analysis. Available online: https://onlinelibrary.wiley.com/doi/abs/10.1002/0470013192.bsa501 (accessed on 5 July 2021).
- Wold, S.; Esbensen, K.; Geladi, P. Principal component analysis. Chemom. Intell. Lab. Syst. 1987, 2, 37–52. [Google Scholar] [CrossRef]
- Ringnér, M. What is principal component analysis? Nat. Biotechnol. 2008, 26, 303–304. [Google Scholar] [CrossRef] [PubMed]


| Feature | Specification | Feature | Specification |
|---|---|---|---|
| Airborne sensor | CASI-1500 | Band 01 | 367.2 nm ± 3.6 nm |
| Aircraft velocity | 120 knots | Band 72 | 1046.7 nm ± 3.6 nm |
| Aircraft altitude | ~3000 m AGL | File output format | .img; .hdr |
| Bandwidth | 7.2 nm | Resolution | 1.5 m pixel resolution |
| Date | 1 August 2012 | Sky Conditions | clear |
| Mission Year | Scanned Area (km2) | Suspected Plantation Detected |
|---|---|---|
| 2012 | 990 | 62 |
| 2013 | 3618 | 304 |
| 2014 | 4313 | 815 |
| 2015 | 4549 | 1368 |
| 2016 | 5066 | 2086 |
| 2017 | 7487 | 90 |
| 2018 | 7336 | 27 |
| 2019 | 7350 | 151 |
| 2020 | 5865 | 189 |
Publisher’s Note: MDPI stays neutral with regard to jurisdictional claims in published maps and institutional affiliations. |
© 2021 by the authors. Licensee MDPI, Basel, Switzerland. This article is an open access article distributed under the terms and conditions of the Creative Commons Attribution (CC BY) license (https://creativecommons.org/licenses/by/4.0/).
Share and Cite
Gambardella, C.; Parente, R.; Ciambrone, A.; Casbarra, M. A Principal Components Analysis-Based Method for the Detection of Cannabis Plants Using Representation Data by Remote Sensing. Data 2021, 6, 108. https://doi.org/10.3390/data6100108
Gambardella C, Parente R, Ciambrone A, Casbarra M. A Principal Components Analysis-Based Method for the Detection of Cannabis Plants Using Representation Data by Remote Sensing. Data. 2021; 6(10):108. https://doi.org/10.3390/data6100108
Chicago/Turabian StyleGambardella, Carmine, Rosaria Parente, Alessandro Ciambrone, and Marialaura Casbarra. 2021. "A Principal Components Analysis-Based Method for the Detection of Cannabis Plants Using Representation Data by Remote Sensing" Data 6, no. 10: 108. https://doi.org/10.3390/data6100108
APA StyleGambardella, C., Parente, R., Ciambrone, A., & Casbarra, M. (2021). A Principal Components Analysis-Based Method for the Detection of Cannabis Plants Using Representation Data by Remote Sensing. Data, 6(10), 108. https://doi.org/10.3390/data6100108