Article

Learning Interpretable Mixture of Weibull Distributions—Exploratory Analysis of How Economic Development Influences the Incidence of COVID-19 Deaths

1
MTA-PE “Lendület” Complex Systems Monitoring Research Group, Department of Process Engineering, University of Pannonia, Egyetem Street 10, H-8200 Veszprém, Hungary
2
University Center for Circular Economy Nagykanizsa, University of Pannonia, H-8800 Nagykanizsa, Hungary
*
Author to whom correspondence should be addressed.
Data 2021, 6(12), 125; https://doi.org/10.3390/data6120125
Submission received: 22 October 2021 / Revised: 20 November 2021 / Accepted: 24 November 2021 / Published: 26 November 2021
(This article belongs to the Special Issue Knowledge Extraction from Data Using Machine Learning)

Abstract

:
This paper presents an algorithm for learning local Weibull models, whose operating regions are represented by fuzzy rules. The applicability of the proposed method is demonstrated in estimating the mortality rate of the COVID-19 pandemic. The reproducible results show that there is a significant difference between mortality rates of countries due to their economic situation, urbanization, and the state of the health sector. The proposed method is compared with the semi-parametric Cox proportional hazard regression method. The distribution functions of these two methods are close to each other, so the proposed method can estimate efficiently.

1. Introduction

Weibull distributions are widely applied to estimate reliabilities [1], diffusion of innovations, and survival probabilities [2]. The limitation of the method is that it assumes that the population is homogeneous [3]. When this assumption is not valid, accurate results can be reached by mixture models [4]. Such a mixture of the Weibull model has already been built for modelling reliability [5] and time-to-event analysis [6]. The problem of the application of these approaches is that the resulting model is not easily interpretable.
Our main goal is to extend these methods with a clustering-based algorithm that can identify a mixture of Weibull distributions, where the homogeneous subgroups of the population are represented by interpretable fuzzy if-then rules. The key idea is based on supervised fuzzy clustering [7,8]. These special clustering algorithms generate clusters that can be interpreted in the form of fuzzy if-then rules. These if-then rules have a rule antecedent and a rule consequent part. Takagi-Sugeno fuzzy rules apply functions of the input variables in the rule consequent [9]. When Gaussian membership functions describe the operating regions of the variables, the resulting fuzzy model can be considered as a special case of Gaussian mixture models. The interpretability of the operating regimes of the Weibull distributions can be very informative if we compare what differentiates the homogeneous subgroups that can be described by the given distributions. To demonstrate this advantage of the method, a study is presented about how countries can be clustered based on the mortality rates of the COVID-19 pandemic and explanatory variables describing their economic situation, urbanization, and the health condition of the citizens.
The main contributions of the work can be summarized as: (1) An interpretable mixture of models for Weibull distributions is presented in Section 2.1. The operating regions of the Weibull distributions are represented by fuzzy sets that are useful in the visualisation of the model. (2) An alternating optimisation-based clustering algorithm that has been developed for the identification of this special model is presented in Section 2.2. (3) A reproducible case study and a potential benchmark problem is provided where the task is to model the COVID-19 mortality rate of countries based on variables related to their economic performance, urbanization level, and the health condition of the citizens in Section 3. (4) The proposed method is compared to Cox proportional hazard regression in Section 3. The results prove the goodness of the method and its applicability for feature selection. (5) The main novelty of the proposed technique is that it can estimate the operating region of local probabilistic models. (6) Cox regression is based on the proportional hazard assumption, which means that the hazard ratio for any two individuals is constant over time. The main benefit of the proposed method is that the distributions of the clusters can be independent of each other.
The presented results do not just show the applicability of the proposed open-source tool, but show that the clusters of countries which performed similarly in fighting COVID-19 also have similar economic development levels.

2. The Proposed Fuzzy Mixture of the Weibull Distributions Model and Its Clustering-Based Identification Method

In this section firstly the model structure is presented. The model defines a Gaussian mixture that can be identified based on the method of Expectation Maximisation (EM). The rule-based mixture of Weibull distributions is presented in Section 2.1. As shown in Section 2.2, the EM problem is solved by an alternating optimisation that defines a clustering algorithm.

2.1. The Rule-Based Mixture of Weibull Distributions

The aim of the modeling is to identify a cumulative distribution function
y = p ( Z z ) = F ( z )
that represents the probability that the random variable Z takes on a value less than or equal to z. Weibull functions are widely used to approximate such distributions:
y = exp z θ β
The distribution has two parameters, the θ scale parameter and the β shape parameter. The aim of the proposed method is to find and characterise homogeneous groups of objects that can be described by these distributions.
The proposed model is based on the modification of the Takagi-Sugeno fuzzy model, as the rule consequences are Weibull distributions:
  • r j : If x 1 is A j , 1 ( x 1 , k ) and x n is A j , n ( x n , k ) , then y = exp z θ j β j , [ ω j ]
where the A j , i ( x i ) fuzzy sets define the operating regions of the j = 1 , …, C-th model in the ith variable, θ j denotes the scale parameter, and β j the shape parameter of the jth local Weibull model and w j [ 0 , 1 ] is the weight of the rule.
The fuzzy sets A j , i ( x i ) are represented by Gaussian membership functions:
A j , i ( x ) = e x p 1 2 ( x j v j , i ) 2 ) σ j , i 2
where i = 1 , , n represents the index of the explanatory variables, and v j , i the center and σ j , i 2 the variance of the jth Gaussian curve defined on that variable.
The degree of fulfillment of the rule is then calculated as the product of the individual membership degrees and the weight of the rule:
B j ( x ) = ω j i = 1 n A j , i ( x i )
The C pieces of rules are aggregated by using the fuzzy-mean formula
y ^ = j = 1 C ϕ j ( x ) exp z θ j β j
where
ϕ j ( x ) = B j ( x ) l = 1 C B l ( x )
The developed method is a cluster-weighted model that divides the domain of variables x into local models by interpretable fuzzy rules.

2.2. Estimation of the Model Parameters

The parameters of the presented model are identified based on maximizing the log likelihood of the available n = 1 , , N data, so the negative log likelihood is minimized as:
L = n = 1 N ln p ( z n , x n ) = n = 1 N ln j = 1 C p ( z n | j ) p ( x n | j ) p ( j )
where N denotes the number of available data that can be used for the identification of the model, p ( z n | j ) stands for the Weibull distribution of the jth local model
p ( z n | j ) = exp z θ j β j ,
and p j ( x n | j ) is defined in the form of a multivariate Gaussian mixture distribution:
p ( x n | j ) = p ( x n | j ) = ( | F j 1 | ) 1 / 2 ( 2 π ) d / 2 e x p 1 2 x n v j T F j 1 x n v j .
and the p ( j ) stands for the unconditional cluster probability, where the diagonal elements of the F matrix contain variance parameters of the Gaussian membership functions:
F j = σ 1 , j 2 0 0 0 σ 2 , j 2 0 0 0 σ n , j 2
In the E-step (Expectation step), the clustering parameters are assumed to be correct. The posterior probabilities represent that a particular data point was generated by a particular cluster:
p ( j | z n , x n ) = p ( z n , x n | j ) p ( j ) p ( z n , x n ) = p ( z n | j ) p ( x n | j ) p ( j ) l = 1 C p l ( z n | l ) p ( x n | l ) p ( l )
This probability expresses how a given data point belongs to different clusters. In the M-step (Maximization step), it is assumed that the data distribution is correct and the clustering parameters that maximize the log likelihood of the data have been identified. Given that the E-step changed the membership values, the model parameters must be recalculated. The unconditional cluster probability can be calculated by the following equation:
p ( j ) = 1 N n = 1 N p ( j | z n , x n )
This unconditional cluster probability can be used to calculate the new mean (or centre) of the clusters:
v j = 1 N p ( j ) n = 1 N x n p ( j | z n , x n )
The weighted covariance matrix can be similarly calculated by the step below:
F j = 1 N p ( j ) n = 1 N x n v j x n v j T p ( j | z n , x n )
When the interpretability of the resulting model is important, only the diagonal elements of the matrices are calculated and stored, as these parameters will be used to define the fuzzy membership functions. The θ j and β j parameters of the local Weibull distributions are determined as usual, the only difference is that the samples are weighed at the minimization of Equation (7). The parameters of the cluster directly define the parameters of the fuzzy model, only the ω j rule weighs should be calculated as:
ω j = p ( j ) ( 2 π ) n / 2 | F j |

3. Analysis of the Distribution of the COVID-19 Mortality Rate

This section presents how the proposed method can be applied to analyse the mortality rate of COVID-19 disease in different countries to explore how the economic situation, the health condition of the citizens., and the level of urbanization influences the COVID-related mortality. In accordance with this aim, in Section 3.1, the dataset and their sources are introduced. In Section 3.2, the results are presented.

3.1. The Dataset and the Availability of the Program Code

The analysis aimed to highlight how the distribution of the COVID-19 morality rates in different countries vary according to explanatory variables related to the economic situation, the urbanization, and the health condition of the citizens in the given countries.
The dataset has been compiled from several sources. The integrated dataset contains the number of death cases per 100 K population and the explanatory variables of the studied countries. The n = 9 explanatory variables are detailed in Table 1. The mortality rates were downloaded from the web page of Johns Hopkins University [10]. All countries for which any of the variables were not available were removed from the analysis. Finally, data from N = 117 countries were studied.
The most important aspects in selecting the variables were their relevance and coverage (the number of countries where a given indicator is published). The selected variables mainly describe the population health. These variables are influenced by cultural effects, climate, and many other variables, and also the state of the health system. To describe the background of these effects we added variables related to the economical situation and urbanization of the countries. From the initial dataset some of the variables were eliminated as they were not significant in the studied models. The goodness of the feature selection was also confirmed by Cox regression, which will be presented in the following subsection.
The method was developed in MATLAB environment. The data and the programs can be downloaded from the Github (https://github.com/abonyilab/mixWeibull, accessed on 22 October 2021).

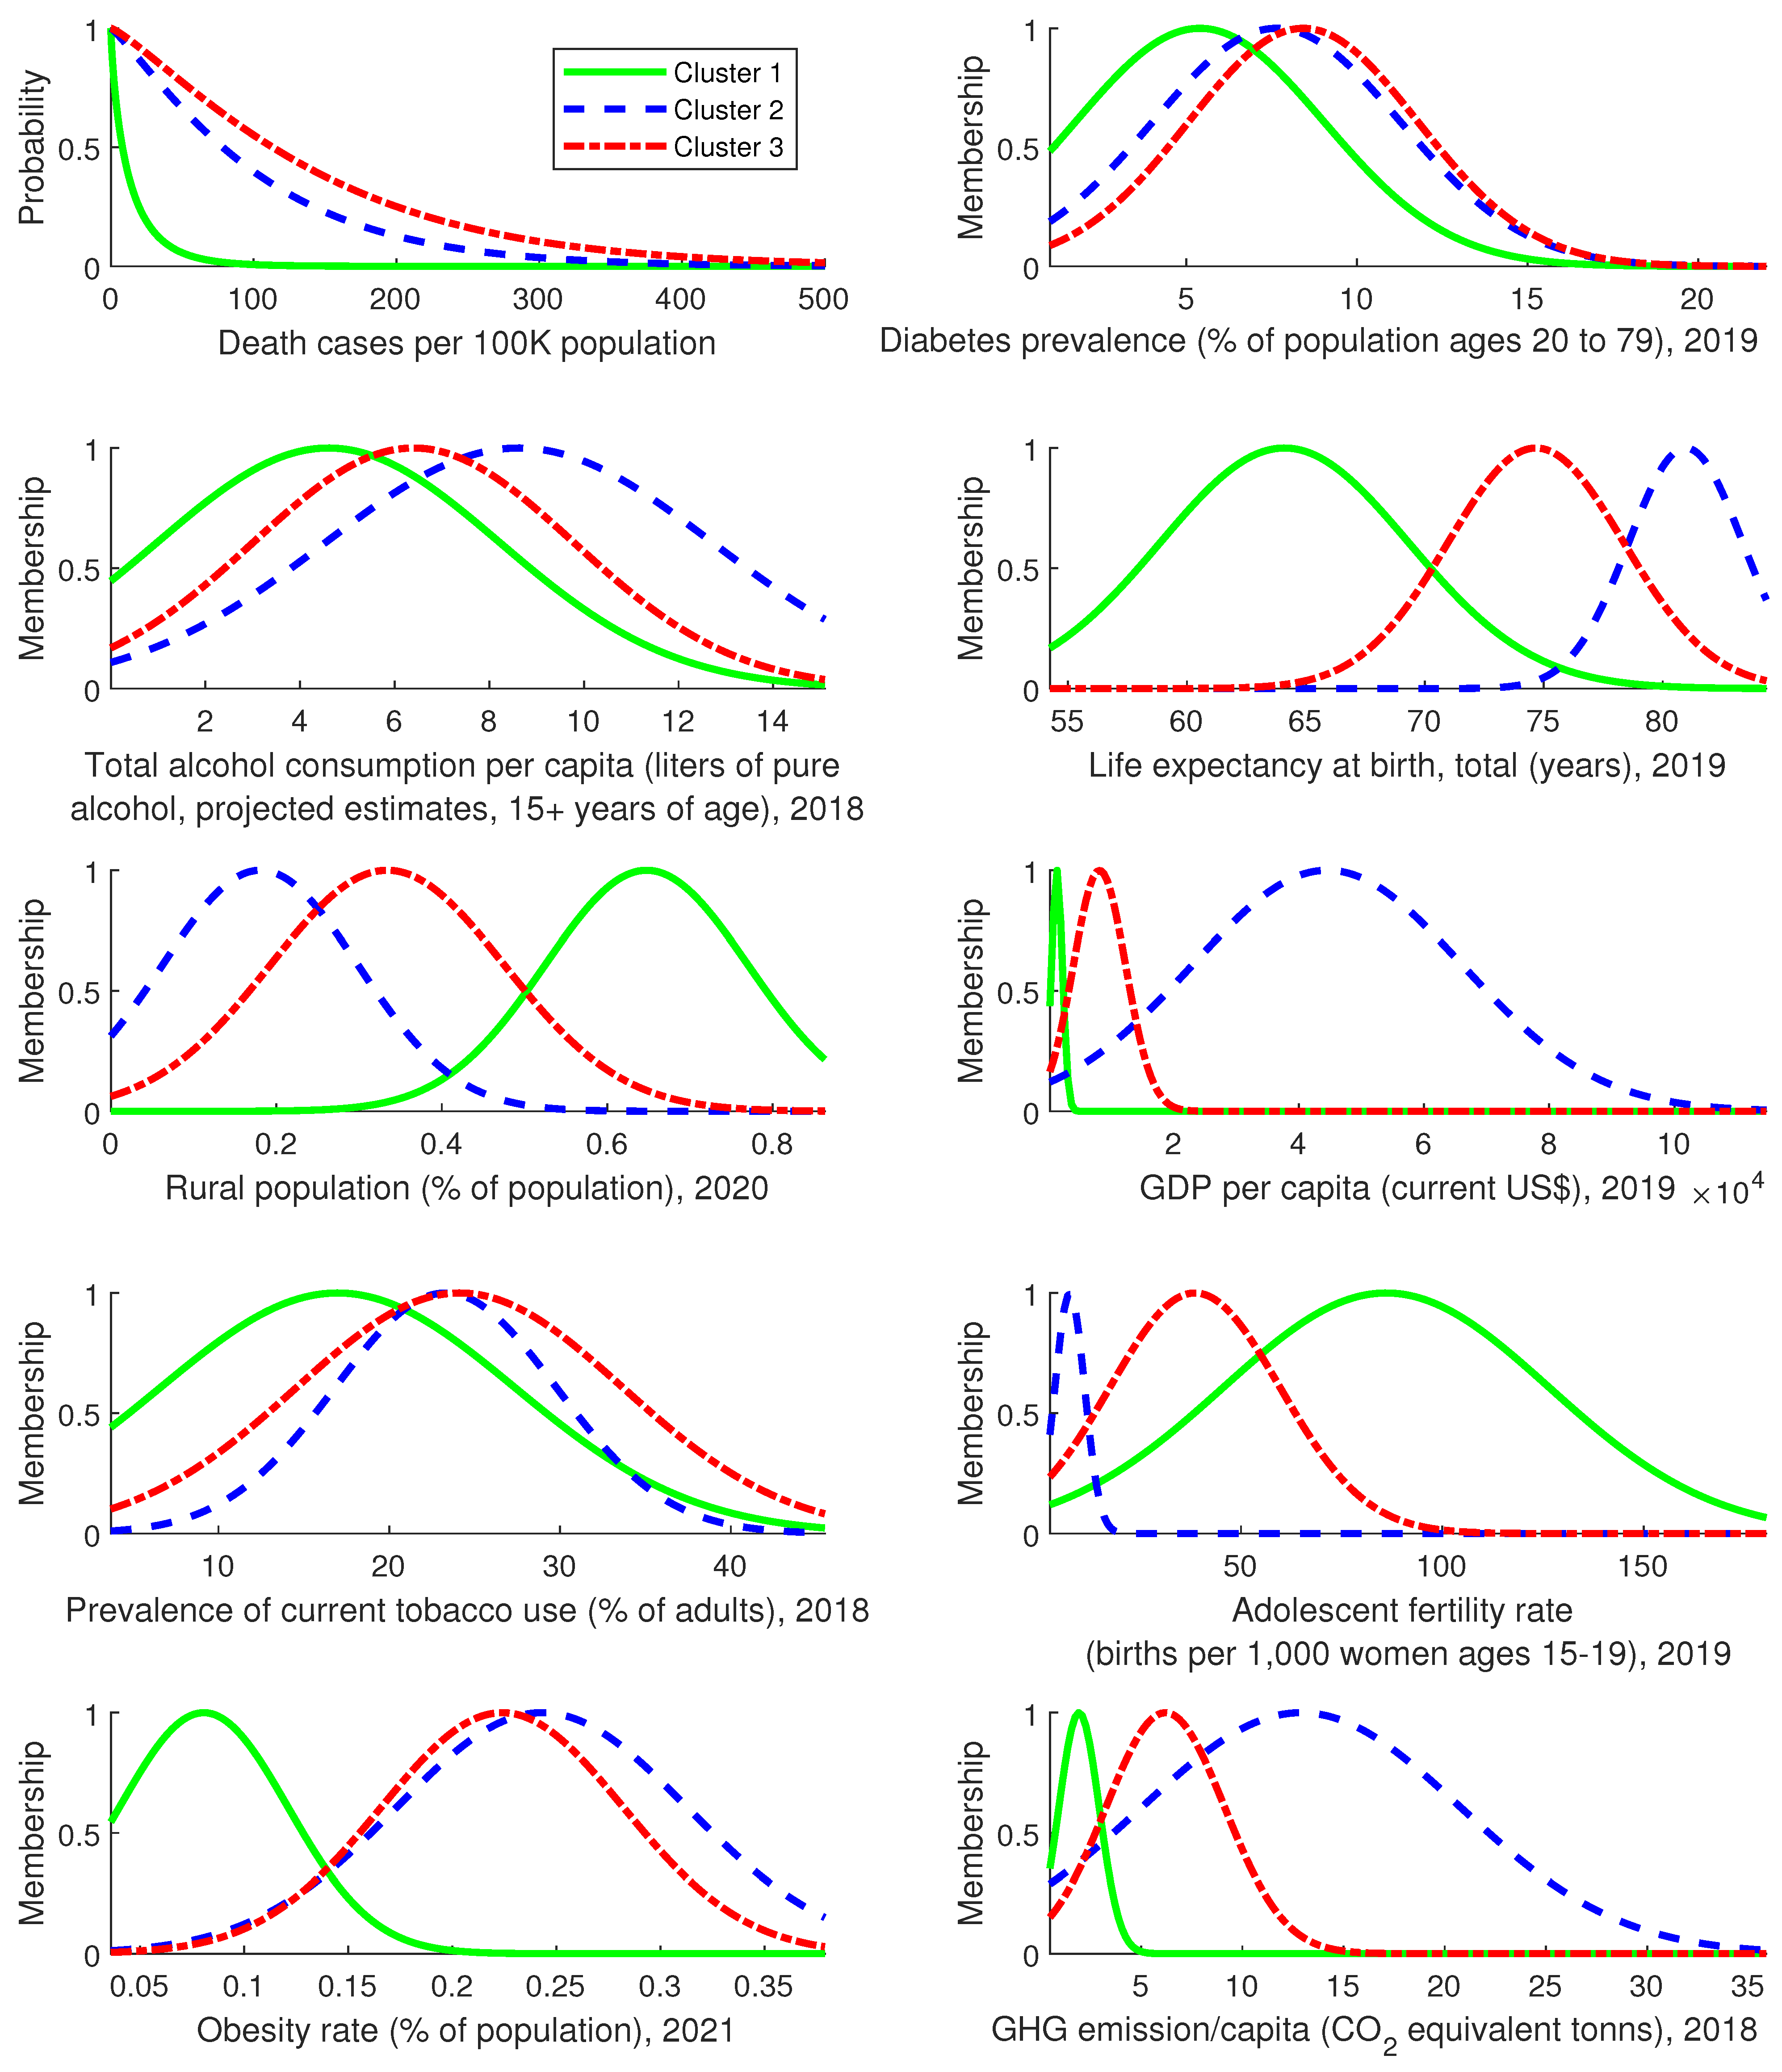
3.2. Results and Discussion

The application of the method requires selecting the number of clusters, which is the only hyperparameter of the algorithm. For the selection of this C parameter, clustering measures can be used, or the overlap of the membership functions can be studied, similarly to [8]. In this study, three clusters were identified based on the similarity of the resulting membership functions. The result of the clustering is depicted in Figure 1, where the identified Weibull distribution functions (at the first subplot in the top row) and the membership functions of all the variables are shown.
Although the clustering is based on fuzzy logic, the results indicate that countries are at least 0.99 likely to be included in one of the clusters. The histogram of the variables according to the clusters are illustrated in Figure 2. It can be observed that the shape of the histograms and membership functions are analogous. However, the number of these incidences can also indicate the weight of the variable and the goodness of fit.
The geographical distribution of the countries of different clusters are shown in Figure 3.
The resultant Weibull distribution functions are depicted on the first subfigure of Figure 1. As this plot shows, the distributions of deaths caused by COVID-19 significantly differ in the identified three groups of countries. The probability of 100 death cases per 100 K population in Cluster 1 is nearly 0, but in Cluster 3 is 0.55 , which implies that members of Cluster 1 have the best chances of surviving the pandemic. However, people living in countries assigned to Cluster 3 have the worst chances of surviving the COVID-19 pandemic.
The comparison of the membership functions of the clusters can provide information on what is different in the countries of the identified groups. As Figure 1 shows, the smallest number of smokers are in Cluster 1 and the most smokers are found in Cluster 3. The incidence of diabetes also follows a similar pattern. These results are logical since both smoking and diabetes are prone to cause increased mortality [13,14].
Wide, overlapping clusters can be observed for alcohol consumption, GHG emission per capita, and obesity rate variables, which suggests that these variables cannot characterise the death cases. A significant cluster separation can be recognized in the GDP per capita. Surprisingly, countries with low GDP are members of Cluster 1, and well-prospering nations are in Cluster 2 and 3. Since life expectancy correlates with the GDP per capita [15], there are more older citizens in wealthier countries. It is well known that COVID-19 is riskier for the senior population [16], and this implies that fewer people die in countries where few older adults live. However, this statement is valid only to a certain level of wealth. The wealthiest countries have made greater efforts and have more advanced health care system to protect their older population more efficiently.
The method successfully explores correlating variables. The membership functions of the GHG emission per capita and GDP per capita behave similarly, reflecting correction. This result proves the Kuznets theory since countries emit more GHG gas as GDP per capita grows. However, after a certain level of development, they have resources for reducing emissions [17], indicating a turning point in the Kuznets function. According to the membership functions, emissions are lower in poorer countries and higher in richer ones. Moreover, the variance of GDP per capita is much more comprehensive for the most prosperous countries because some countries have already passed the turning point. Recent studies suggest a link between air pollution and the COVID-19 mortality rate [18]. As there is a connection between GDP and GHG, we can say that although there is a minor connection between air pollution and COVID-19 mortality rate, this is an indirect relationship, as both variables are driven by the GDP.
The results illustrate that GDP per capita is the most important driving force of the modeling problem. GDP per capita also correlates with urbanization; the richer a country is, the more urbanized and centralized is its population. The more people live close to each other, the easier and more directly the virus spreads [19]. Furthermore, far more overweight people live in wealthier countries because they are well-fed, and these citizens carry a bigger risk of infection [20]. Alcohol consumption is also more significant in wealthier countries, thus it fundamentally reduces the resilience immune systems of people living in such countries, which leads to a higher risk factor [21].
The disadvantage of the method is that it cannot numerically measure how a variable directly contributes to the modelled probability. E.g., one can see that in countries where more people smoke, more people die. The clusters highlight the differences between the populations, which differences do not necessarily show causality. Therefore, the analysis of the results needs careful attention, similarly to other exploratory data analysis, clustering, and regression models. Moreover, it is essential to note that the results also depend on the quality of the data, which can be significantly different in countries. We assume that the efficiency of the data collection is most likely better, where the GDP per capita is also higher.
The proposed method has been compared to semi-parametric Cox regression, which is a widely applied technique for survival analysis. The resultant Cox model was evaluated at the cluster means, and the extracted distributions were compared to the local models identified by the proposed method. As Figure 4 shows, the local distributions are almost identical to the distributions estimated by the Cox regression model. The main benefit of the proposed technique is that it can estimate the operating region of the local models. Cox regression is based on the proportional hazard assumption, which means that the hazard ratio for any two individuals is constant over time. The main benefit of the proposed method is that the distributions of the clusters can be independent of each other, and the clustering algorithm can detect the operating regions of these local models.

4. Conclusions

This paper proposed a novel method for fuzzy clustering-based identification of the mixture of Weibull distributions. At the application of the Weibull distributions, it is assumed that the modelled population is homogeneous. Since populations are mostly heterogeneous, we aimed to simultaneously separate homogeneous sub-populations based on the explanatory variables and estimate their model parameters. The explanatory variables were characterized by fuzzy membership functions that ensure the interpretability of the resulted models. The resulting method is beneficial to explore the inhomogeneity of the data; the operating regions and the shapes of the Weibull distribution functions highlight the differences between the identified clusters.
The applicability of the proposed method was presented in a COVID-19 case study. We compared the mortality per 100 K population for different countries, and the results confirmed that the level of economic development significantly influences the COVID-19 mortality rate.
The primary objective of the case study was to demonstrate the applicability of the proposed method. The secondary objective was to provide a quantitative analysis of what influences the mortality rates. All the extracted information is validated by analysing the literature, which confirms the applicability of the proposed method. We extended the results and discussion section with a separate discussion of the novelty of the method and the findings. The results illustrated that the proposed method is a perfect tool for goal-oriented finding of homogeneous subgroups in data and generating hypotheses in an exploratory data analysis process.

Author Contributions

Conceptualization, J.A. and Z.B.; method, R.C.; software, R.C.; validation, Z.B., writing—original draft, R.C.; writing—review and editing, Z.B and J.A.; visualization, R.C.; supervision, J.A.; funding acquisition, J.A. All authors have read and agreed to the published version of the manuscript.

Funding

This research was funded by the National Laboratory for Climate Change (NKFIH-471-3/2021). Robert Csalodi acknowledges the support of the Doctoral Student Scholarship Program of the Co-operative Doctoral Program of the Ministry of Innovation.

Institutional Review Board Statement

Not applicable.

Informed Consent Statement

Not applicable.

Data Availability Statement

The method was developed in MATLAB environment. The data and the programs can be downloaded from https://github.com/abonyilab/mixWeibull (accessed on 22 October 2021).

Conflicts of Interest

The authors declare no conflict of interest.

References

  1. Song, K.Y.; Chang, I.H.; Pham, H. A software reliability model with a Weibull fault detection rate function subject to operating environments. Appl. Sci. 2017, 7, 983. [Google Scholar] [CrossRef] [Green Version]
  2. Looha, M.A.; Zarean, E.; Masaebi, F.; Pourhoseingholi, M.A.; Zali, M.R. Assessment of prognostic factors in long-term survival of male and female patients with colorectal cancer using non-mixture cure model based on the Weibull distribution. Surg. Oncol. 2021, 38, 101562. [Google Scholar] [CrossRef] [PubMed]
  3. Pan, X.H.; Xiong, Q.Q.; Wu, Z.J. New method for obtaining the homogeneity index m of Weibull distribution using peak and crack damage strains. Int. J. Geomech 2018, 18, 04018034. [Google Scholar] [CrossRef]
  4. Castet, J.F.; Saleh, J.H. Single versus mixture Weibull distributions for nonparametric satellite reliability. Reliab. Eng. Syst. Saf. 2010, 95, 295–300. [Google Scholar] [CrossRef]
  5. Elmahdy, E.E. Modelling reliability data with finite Weibull or lognormal mixture distributions. Appl Math Inf. Sci 2017, 11, 1081–1089. [Google Scholar] [CrossRef]
  6. Bennis, A.; Mouysset, S.; Serrurier, M. Estimation of Conditional Mixture Weibull Distribution with Right Censored Data Using Neural Network for Time-to-Event Analysis. In Advances in Knowledge Discovery and Data Mining; Springer: Cham, Switzerland, 2020; Volume 12084, pp. 687–698. [Google Scholar]
  7. Abonyi, J.; Babuska, R.; Szeifert, F. Modified Gath-Geva fuzzy clustering for identification of Takagi-Sugeno fuzzy models. IEEE Trans. Syst. Man Cybern. Part B (Cybern.) 2002, 32, 612–621. [Google Scholar] [CrossRef] [PubMed]
  8. Abonyi, J.; Szeifert, F. Supervised fuzzy clustering for the identification of fuzzy classifiers. Pattern Recognit. Lett. 2003, 24, 2195–2207. [Google Scholar] [CrossRef] [Green Version]
  9. Takagi, T.; Sugeno, M. Fuzzy identification of systems and its applications to modeling and control. IEEE Trans. Syst. Man Cybern. 1985, SMC-15, 116–132. [Google Scholar] [CrossRef]
  10. John Hopkins University, Coronavirus Resource Center: Cases and Mortality by Country. Available online: https://coronavirus.jhu.edu/data/mortality (accessed on 27 September 2021).
  11. World Data Bank. Available online: https://data.worldbank.org/ (accessed on 27 September 2021).
  12. Most Obese Countries. 2021. Available online: https://worldpopulationreview.com/country-rankings/most-obese-countries (accessed on 11 October 2021).
  13. Patanavanich, R.; Glantz, S.A. Smoking is associated with COVID-19 progression: A meta-analysis. Nicotine Tob. Res. 2020, 22, 1653–1656. [Google Scholar] [CrossRef] [PubMed]
  14. Peric, S.; Stulnig, T.M. Diabetes and COVID-19. Wien. Klin. Wochenschr. 2020, 132, 356–361. [Google Scholar] [CrossRef] [PubMed]
  15. Bulled, N.L.; Sosis, R. Examining the relationship between life expectancy, reproduction, and educational attainment. Hum. Nat. 2010, 21, 269–289. [Google Scholar] [CrossRef]
  16. Makaroun, L.K.; Bachrach, R.L.; Rosland, A.M. Elder abuse in the time of COVID-19—Increased risks for older adults and their caregivers. Am. J. Geriatr. Psychiatry 2020, 28, 876. [Google Scholar] [CrossRef] [PubMed]
  17. Katsoulakos, N.; Misthos, L.M.; Doulos, I.G.; Kotsios, V. Environment and Development. In Environment and Development; Elsevier: Amsterdam, The Netherlands, 2016; pp. 499–569. [Google Scholar]
  18. Konstantinoudis, G.; Padellini, T.; Bennett, J.; Davies, B.; Ezzati, M.; Blangiardo, M. Long-term exposure to air-pollution and COVID-19 mortality in England: A hierarchical spatial analysis. Environ. Int. 2021, 146, 106316. [Google Scholar] [CrossRef] [PubMed]
  19. Bhadra, A.; Mukherjee, A.; Sarkar, K. Impact of population density on Covid-19 infected and mortality rate in India. Model. Earth Syst. Environ. 2021, 7, 623–629. [Google Scholar] [CrossRef] [PubMed]
  20. Malik, P.; Patel, U.; Patel, K.; Martin, M.; Shah, C.; Mehta, D.; Malik, F.A.; Sharma, A. Obesity a predictor of outcomes of COVID-19 hospitalized patients—a systematic review and meta-analysis. J. Med. Virol. 2021, 93, 1188–1193. [Google Scholar] [CrossRef] [PubMed]
  21. Calina, D.; Hartung, T.; Mardare, I.; Mitroi, M.; Poulas, K.; Tsatsakis, A.; Rogoveanu, I.; Docea, A.O. COVID-19 pandemic and alcohol consumption: Impacts and interconnections. In Toxicology Reports; Elsevier: Amsterdam, The Netherlands, 2021. [Google Scholar]
Figure 1. The left upper subfigure shows the resultant Weibull distribution functions. The distributions of deaths caused by COVID-19 significantly differ in the identified three groups of countries. The probability of 100 death cases per 100 K population is nearly 0 in Cluster 1, but in Cluster 3 it is 0.55 , which implies that members of the first cluster have the best chances of surviving the pandemic. Other subfigures depict the membership functions that describe the operating regions of the models on each variable. The primary information sources for comparison are the mean and standard deviation values of the parameters belonging to the given clusters. Means describe the level of the variable, and the standard deviations can suggest a possible mixture of clusters. The main driving force of the analysis is GDP per capita. The method reflects correlating variables. Life expectancy correlates with the GDP per capita. COVID-19 is riskier for the older population, and this implies that fewer people die in countries where fewer older adults live.
Data 06 00125 g001
Figure 2. The histogram of the variables according to the clusters. It can be observed that the shape of the histograms and membership functions are analogous. However, the number of these incidences can also indicate the weight of the variable and the goodness of fit.
Data 06 00125 g002
Figure 3. The cluster membership of the countries. It can be observed that the clustering was indeed based on whether they were developing or developed countries.
Data 06 00125 g003
Figure 4. The comparison of the proposed methodology and the Cox regression. The distribution functions are calculated with the Cox regression method at the point of the cluster means and they are compared with the resultant distributions by the proposed method. The proposed method describes the distribution the same way as the Cox regression. The contribution of the variables can be measured by the Cox regression parameters.
Data 06 00125 g004
Table 1. The economic, urban, and health condition explanatory variables, and their dates, time interval, and sources.
SectorVariable NameTime IntervalDownloadedSource
EconomicGDP per capita01.01.201927.09.2021[11]
(current US$)31.12.2019
HealthAdolescent fertility rate01.01.201927.09.2021[11]
(births per 1000 women ages 15–19)31.12.2019
EconomicGHG emission/capita01.01.201827.09.2021[11]
(CO2 equivalent)31.12.2018
UrbanRural Population01.01.202027.09.2021[11]
(% of population)31.12.2020
HealthDiabetes prevalence01.01.201927.09.2021[11]
(% of population ages 20–79)31.12.201927.09.2021
HealthTotal alcohol consumption per capita01.01.201827.09.2021[11]
(liters of pure alcohol,31.12.2018
projected estimates, 15+ years of age)
HealthLife expectancy at birth01.01.201927.09.2021[11]
(years)31.12.2019
HealthPrevalence of current tobacco use01.01.201827.09.2021[11]
(% of adults)31.12.2018
HealthObesity Rate01.01.202111.10.2021[12]
(% of population)31.12.2021
Publisher’s Note: MDPI stays neutral with regard to jurisdictional claims in published maps and institutional affiliations.

