Data Descriptor

A Data Resource for Prediction of Gas-Phase Thermodynamic Properties of Small Molecules

1
Department of Earth, Atmospheric and Planetary Sciences, Massachusetts Institute of Technology, 77 Massachusetts Avenue, Cambridge, MA 02139, USA
2
School of Physics & Astronomy, Cardiff University, 4 The Parade, Cardiff CF24 3AA, UK
3
Department of Physics, Massachusetts Institute of Technology, 77 Massachusetts Avenue, Cambridge, MA 02139, USA
4
Department of Aeronautics and Astronautics, Massachusetts Institute of Technology, 77 Massachusetts Avenue, Cambridge, MA 02139, USA
*
Author to whom correspondence should be addressed.
Submission received: 21 February 2022 / Revised: 5 March 2022 / Accepted: 8 March 2022 / Published: 11 March 2022
(This article belongs to the Section Chemoinformatics)

Abstract

:
The thermodynamic properties of a substance are key to predicting its behavior in physical and chemical systems. Specifically, the enthalpy of formation and entropy of a substance can be used to predict whether reactions involving that substance will proceed spontaneously under conditions of constant temperature and pressure, and if they do, what the heat and work yield of those reactions would be. Prediction of enthalpy and entropy of substances is therefore of value for substances for which those parameters have not been experimentally measured. We developed a database of 2869 experimental values of enthalpy of formation and 1403 values for entropy for substances composed of stable small molecules, derived from the literature. We developed a model for predicting enthalpy of formation and entropy from semiempirical quantum mechanical calculations of energy and atom counts, and applied the model to a comprehensive database of 16,417 small molecules. The database of small-molecule thermodynamic properties will be useful for predicting the outcome of any process that might involve the generation or destruction of volatile products, such as atmospheric chemistry, volcanism, or waste pyrolysis. Additionally, the collected experimental thermodynamic values will be of value to others developing models to predict enthalpy and entropy.
Dataset: 10.5281/zenodo.4661783.
Dataset License: CC BY (SA).

1. Summary

We present a dataset for the prediction of thermodynamic parameters for compounds and its application to a set of 16,411 small molecules [1]. The dataset addresses the gas-phase enthalpy of formation, the entropy of molecules, and the change of both parameters with temperature. The dataset contains a compilation of measured enthalpy of formation for 2869 compounds, measured entropy for 1403 compounds, and temperature dependence of parameters for 172 compounds. These can be used as a reference source in their own right, or used to build a model for predicting these values for new compounds. We describe building such a model and applying it to 16,411 small molecules in the ‘All Small Molecules’ collection [1].
For context, we first provide material on the importance of enthalpy and entropy. The enthalpy and entropy of formation of a compound are key parameters for predicting whether reactions involving a compound will proceed spontaneously under isobaric and isothermal (constant pressure and temperature) conditions. Specifically, if the Gibbs free energy change (ΔG) of a system in which a chemical reaction takes place is negative, and the system is at constant pressure and temperature, then that system, at equilibrium, will contain more of the products of that reaction than of the reactants, and the reaction is said to proceed spontaneously in the forward direction. This condition is usually met in chemistry happening in an unenclosed space at the surface of a planet, where the pressure is constant but the reactants can change volume as they form products. (If volume is constant but pressure changes, as might be true in confined gas bubbles in a rock, for example, then the change in Helmholtz free energy (ΔF) is the appropriate measure of reaction spontaneity, but this can also be calculated from change in enthalpy and in pressure.) A negative ΔG does not imply that the reaction will proceed. How fast a reaction proceeds is the domain of kinetics, not of thermodynamics. However, if the reaction does proceed, then at equilibrium thermodynamics will predict whether the products of the reaction will dominate.
Because ΔG is only measured by changes of state of a system, the free energy of a chemical is practically defined as the free energy change when forming a molecule from its constituent elements at standard state (298 K, 1 bar), an energy change that is called the standard free energy of formation of a compound (ΔG°). Knowledge of the ΔG° values of the reactants and products of a reaction allows the Gibbs free energy change of that reaction to be calculated:
Δ G ° =   Δ G p °   Δ G r °
where Δ G p ° are the standard free energies of formation of the products and Δ G r ° are the standard free energies of formation of the reactants. ΔG° reactants can be calculated from the enthalpy of formation (ΔH, heat released when forming a compound from its elements) and the entropy change of the reaction (ΔS) via
Δ G   =   Δ H     T Δ S
where T is the absolute temperature and ΔS is defined as
Δ S ° =   S p °   S r °
where S p ° is the entropy of the products and S r ° is the entropy of the reactants. Thus, knowledge of ΔH and S of a substance is important in predicting the likely outcome of a chemical reaction involving that substance.
ΔH and S have been experimentally measured for thousands of compounds, but this is a small fraction of the millions known, and of the almost boundless number of possible molecules [2]. Computational methods for predicting ΔH and S are therefore valuable. A range of approaches have been used, including quantum mechanical (QM) ab initio and semiempirical methods, molecular mechanics (MM) methods, and group-additive methods, as well as combined methods (e.g., [3,4]). The QM methods seek to predict molecular properties from first principles based on the arrangement of electron orbitals around the nuclei in a molecule (for example, see [5,6,7,8,9]). MM methods treat atoms as indivisible and model their interactions through empirically derived force fields [10]. Group-additive methods seek an empirical approach of providing a table of ΔH and ΔS values contributed by different chemical groups in a molecule; the ΔH and ΔS of the molecule is then the sum of the values of those chemical groups (for example, [11,12,13]). MM and group-additive approaches can be very accurate when parameterized for narrowly defined sets of molecules (e.g., alkanes [5,6,10]), but are inaccurate if applied outside their specific domains.
In this paper, we present a dataset for a combined QM and group-additive approach. We provide a set of reference data on the measured gas-phase enthalpy and entropy of formation of compounds, computed QM and group parameters from which ΔH and ΔS can be calculated, the results of that modelling, and the application of those models to the ‘All Small Molecules’ dataset of 16,417 small, potentially volatile molecules generated for atmospheric chemistry studies [1]. Because this dataset was developed to be deployed in atmospheric chemistry studies, the relevant thermodynamic parameters for the gas phase have been collected and modelled. However, the presented data resource and model also provide a basis that can be built on to provide energies of vaporization and condensed phase data for compounds such as urea and glycine, which are unlikely to be present in the gas phase.

2. Data Description

2.1. Summary of Data

The dataset presented in this paper are a set of data for modelling the thermodynamic properties—enthalpy of formation and entropy—of arbitrary molecules in the gas phase containing the elements H, B, C, N, O, F, Si, P, S, Cl, Ge, As, Se, Br, and I. The data are used in two ways, as summarized in Figure 1. In building the models, molecular structures are used to generate quantum mechanics-calculated estimates of enthalpy and entropy, which are then adjusted to fit known values (red lines above) using an algorithm based on the count of the number of atoms in a molecule built in the StarDrop software (http://www.optibrium.com/stardrop/). The same model can then be used with the same input but without literature value input (i.e., without the red lines in Figure 1) to predict the thermodynamic properties of molecules for which the thermodynamic parameters are unknown. The semiempirical QM methods also directly predict the change in ΔH° and S°, and hence in ΔG°, with temperature.
In this paper, we present the training data for building the models, with links to the original literature, the model files for StarDrop, and the result of predicting the thermodynamic properties of 16,417 molecules in a comprehensive dataset of small molecules [1].

2.2. Enthalpy of Formation

2.2.1. Measured Values for Enthalpy

Enthalpy data were collected from 11 compilations of enthalpy, supplemented with 11 smaller sets of data to fill in the data for elements not commonly used in organic chemistry, notably B, Ge, Si, and Se. A number of collections contained enthalpy data on radicals and isolated ions; these were not included as the purpose of the dataset was to predict the enthalpy of stable molecules. Some of the collections had multiple values, and so are represented by several columns in the data. The statistics on the sources of data, number of columns, and number of compounds represented are shown in Table 1. Overall, enthalpy data on 2869 compounds were collected.
The data schema for this dataset is summarized in Table 2. The schema includes data used in modelling enthalpy (discussed below in Section 3.1).

2.2.2. Measured Values for Entropy

Entropy data were collected from eight data collections, as listed in Table 3. The data schema for the dataset is summarized in Table 4. Note that what is listed in this dataset is absolute entropy S, not entropy of formation ΔS. Entropy of formation can readily be derived from absolute entropy from Equation (3). As was the case for the enthalpy data, only molecules with conventional bonding, and not radicals or isolated ions, were included, and sources with multiple entries are represented by multiple columns. Only a subset of data was taken from Yaws. The statistics on the sources of data, number of columns, and number of compounds represented are shown in Table 3. Overall, entropy data on 1403 compounds were collected.

2.2.3. Measured Values for Change in Enthalpy with Temperature

Enthalpy of formation and entropy change with temperature. Data on the change in enthalpy of formation and entropy with temperature of a set of 174 molecules were extracted from [19]. The data for trichloromethylsilane (CH3SiCl3) and trifluoromethylsilane (CH3SiF3) were internally inconsistent, in that the tabulated free energy of formation was not the same as the free energy of formation that can be calculated from tabulated entropy, enthalpy of formation, and the respective elemental entropies. No other silicon or fluorine compound shows this inconsistency, so this is not a systemic problem with this dataset. As there is no obvious explanation for this inconsistency, or of which of the tabulated ΔH, S, or ΔG are in error, these entries were removed from the dataset. The resulting 172 molecules are provided in a dataset. The data are provided as described in Table 5 in the form of the difference between the respective values at temperatures between 300 and 1500 K and the value at 298 K (standard state).

2.2.4. All Small Molecules (ASM) Dataset

We previously described a list of 16,417 molecules (ASM) containing no more than 6 non-hydrogen atoms [1] as a repository of potentially volatile compounds. The ASM database of small molecules was built as a comprehensive list of potential biosignature gases, that is, gases that indicate the presence of life in a world (see [41,42,43,44] for a review of biosignatures). To extend the value of the ASM dataset, we calculated entropy and enthalpy of formation for these molecules, as described below. The extended dataset contains the original dataset, the calculated values required for calculating enthalpy and entropy as described in Section 3 below, and the output results. The schema for the data is described in Table 6.
The columns ‘Model + Measured_Enthalpy’ and ‘Model + Measured_Entropy’ list measured values for enthalpy and entropy, respectively, where those are known, and modelled values where no measured values are known. These values are therefore the most accurate values of enthalpy and entropy available. The Gibbs free energy (relevant to reaction at constant pressure and temperature, as noted) is listed. Calculating Gibbs free energy requires the elemental entropy and H−Ho values to be known; these are provided in the file ‘elemental_thermodynamics.xlsx’, with data for As, Se, and Ge derived from [25,46,47], and all other values from [19].
The ΔG values from the thermodynamic data have been integrated with the prior ‘All Small Molecules’ (ASM) database. The data schema for the flat file version of the dataset is shown in Table 7. The ASM dataset is available for download at www.allmols.org.

3. Methods

To calculate the free energy of formation of a substance, its enthalpy of formation and entropy need to be known. These values were calculated separately using quantum mechanical calculations, and then corrected for systematic biases using heuristics developed from reference datasets described above.

3.1. Measured Thermodynamic Values

Literature compilations of thermodynamic values were identified initially by search of Google Scholar (scholar.google.com) with keywords for thermodynamics (thermodynamics, entropy, enthalpy, free energy, heat of formation) and data collections (database, collection, table). Compounds of specific elements were further identified using thermodynamic terms and terms relevant to the element (e.g., arsenic, arsenous, organoarsenic). These initial papers were followed up by searching for (a) references in the papers identified as relevant and (b) papers citing the papers found.

3.1.1. Measured Enthalpy of Formation (ΔH°) Values

Measured values of enthalpy of formation (ΔH°) of compounds were collected from literature sources. Several papers [9,14,15,16,17,20,21,22,24,25] provide compilations of ΔH° as part of studies of the prediction of ΔH° using a variety of methods. For this study, only data for stable molecules were collected. These collections were complemented with data from more specific papers on the ΔH° for compounds containing arsenic, phosphorus, selenium, and silicon [26,27,28,29,30,31,32,33,34,35,36].

3.1.2. Inconsistencies and Errors in Published ΔH

Of 2869 substances, 1602 were present only in one data source. For substances for which ΔH° values were present in more than one source, in some cases there was substantial difference in the values provided by those sources. Thus, for example, the ΔH° of sulfur hexachloride (SCl6) is reported as 91.58 kJ/mol by [9] but −82.80 kJ/mol by [24]. Tetraiodomethane (CI
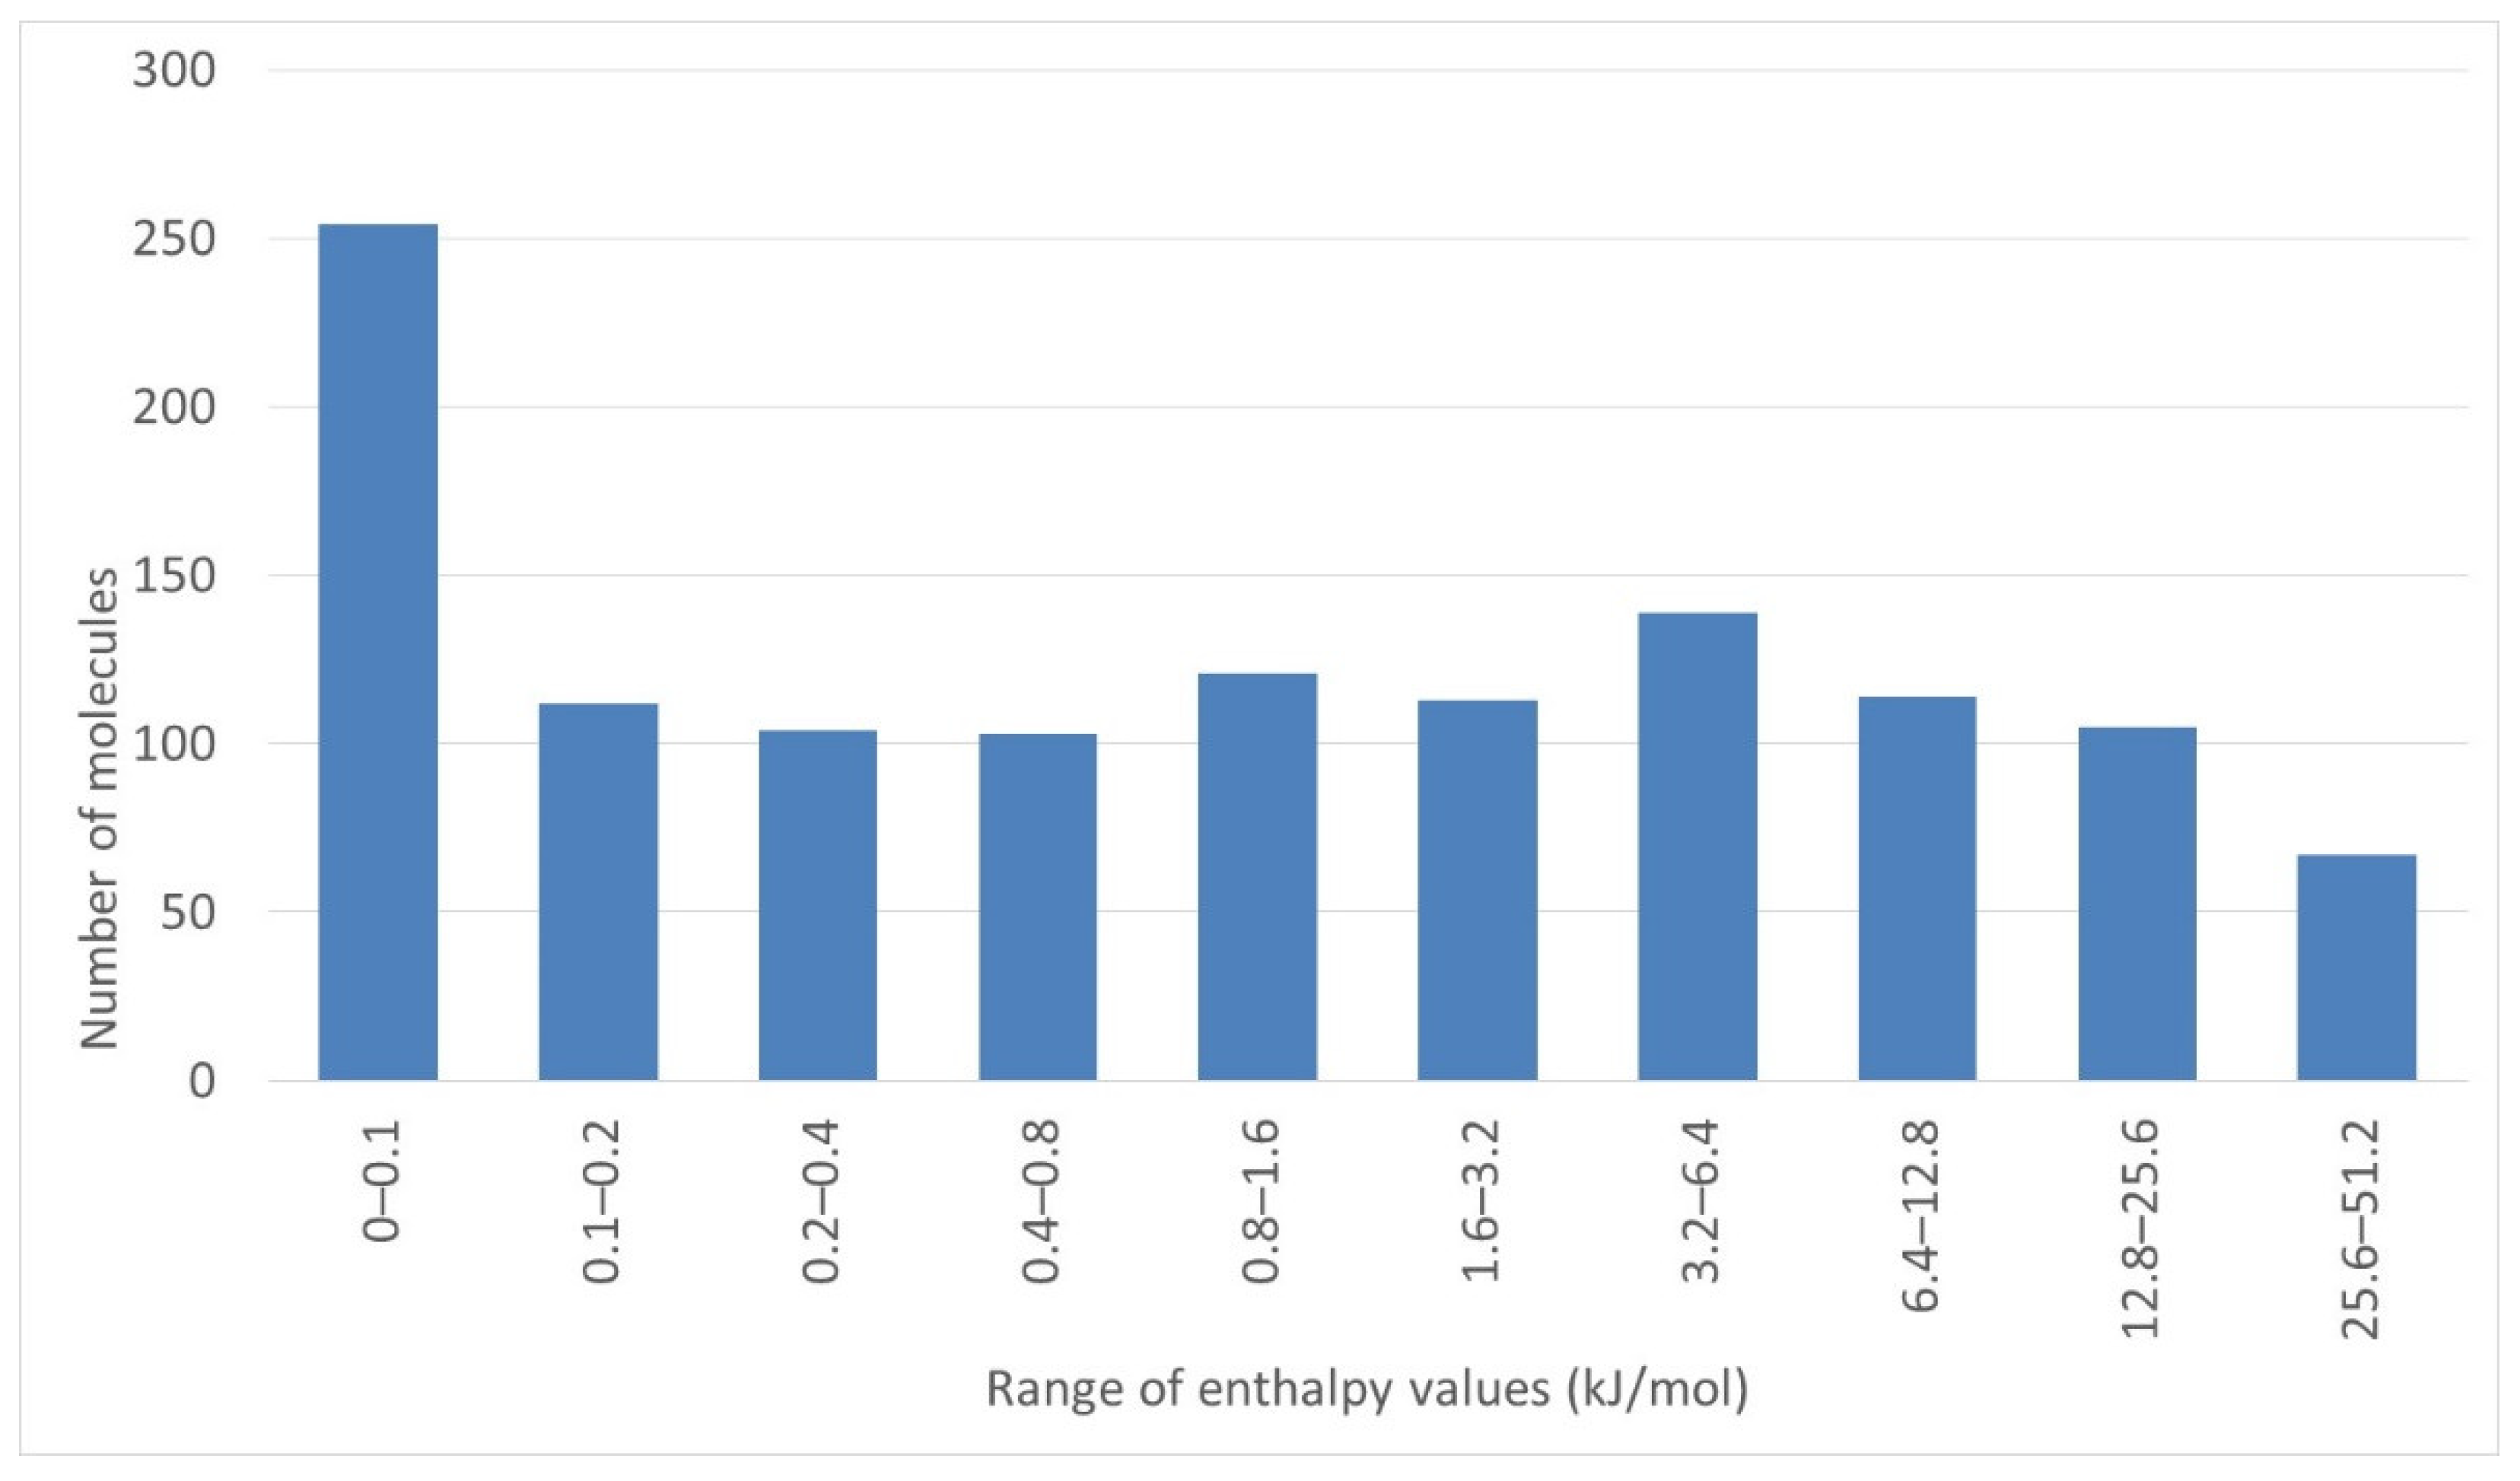
4) is variously reported to have a ΔH° of 267.94, 326.9, or 452.49 kJ/mol. While half of the 1236 substances represented by more than one data source had ranges of 1 kJ/mol or less, a substantial fraction of the range of ΔH° values was much larger (Figure 2). This was after correcting for typographical errors and correcting some of the most egregious differences by recalculating from the original literature. Despite these data correction procedures, 35 compounds listed a range of listed ΔH values in excess of 50 kJ/mol. Compounds with ranges of >50 kJ/mol were excluded from further analysis. Some spot checks suggested that applying a lower exclusion limit did not improve the match between QM-predicted ΔH and experimental values. The excluded values are retained in the database for future reference and flagged in column 27. The filtered set contained 2834 molecules, of which 1232 had more than one source for the DH° value.
The presented data correction and curation procedures do not remove all errors. For example, [22] lists the condensed phase ΔH of 2-fluoro-2,2-dinitroethanol as −480.3 kJ/mol but the gas-phase ΔH as −181.8 kJ/mol, implying a heat of vaporization of ~300 kJ/mol, which is similar to that of diamond. This example was excluded from the dataset, but others less obvious in error and present as only a single-source entry may have been retained.
Three entries in the NIST-JANAF online tables are inconsistent between the PDF version [18], including the PDFs on the online database, and the online version [19]. Specifically, entries for phosphoryl tribromide (Br3OP), thiophosphoryl tribromide (Br3PS) and phosphine (PH3) were significantly different between the two versions. In addition, the data in the PDF version of the entry for phosphine were internally inconsistent. The ΔG values tabulated were different from those that could be calculated from the tabulated ΔH and S° values. This was not a systematic error in phosphorus compounds, as other phosphorus compounds did not show these inconsistencies. The online database values of the ΔG° values for phosphine were systematically higher (i.e., more positive) than those from the PDF versions. We note that [50] used the values from the PDF version in [18] in all calculations. Bains et al.’s [50] conclusions would not be changed by using the updated online values; indeed they would be strengthened, suggesting that phosphine is less likely to be formed in Venus’s atmosphere than they calculated in their paper.
In some cases, initial modelling pointed to errors in experimental ΔH values, which we could correct. For example, on an initial run of the model the highest difference between modelled and experimental ΔH value was for diphenyl disulfone, with a modelled value of −279.09 kJ/mol and a reported experimental value of −481.02 kJ/mol. The extreme value of this difference for a relatively unexceptional molecule led us to recalculate the experimental value from the original data given in [51]. A small correction for the heat of formation of liquid water [18], assuming that sulfuric acid dissolved in water in the bomb calorimeter at the end of the experiment, would be in the form of sulfate ions and not undissociated sulfuric acid (ΔH values taken from [52]), and updating the heat of vaporization of water, we recalculated the heat of formation as −240.04 kJ/mol. This is not a unique example, and Stewart comments that one use of such modelling is to point out potentially questionable reported experimental data [7].
With these corrections made where this was possible, an average ΔH° was used in this work. Future work could recalculate ΔH° from original literature data for all the compounds (if the data are published, and not just the derived thermodynamic parameters), but using modern values for reference enthalpies of elements and end products of combustion.

3.1.3. Measured Entropy (S°) Values

Measured values of entropy (S°) of compounds were collected from literature sources [19,21,23,25,38,39,40]. In contrast to ΔH data, the entropy data were much more internally consistent. Among the 418 entries for which more than one value was available, 381 had ranges of <8 J/mol/K (Figure 3). The most extreme range was for acetic acid (CH3COOH), with values between 282.84 [21] and 404.04 [39]. A difference in S° of 167 J/mol/K at 298 K is equivalent to a difference of 36 kJ/mol in ΔG (Equation (2)). Although it is large, the S° difference for acetic acid implies a ΔG difference of less than the 50 kJ/mol cutoff used to eliminate extremely divergent values from the ΔH dataset, so for consistency with the enthalpy dataset, no values were excluded from the entropy dataset. The distribution of ranges in the 418 entries for which more than one value was found is shown in Figure 3.

3.2. Modelling Thermodynamic Values for New Molecules

3.2.1. Modelling Method

In principle, enthalpy of formation can be calculated for any molecules using ab initio quantum mechanics (QM) methods. In practice, this is impractical for the molecules considered here for two reasons. First, ab initio computational methods are computationally intensive, especially if high accuracy is required. The enthalpy of formation of a molecule can be calculated from the difference between the total energy of the molecule and the total energy of its component elements. Total energy (the energy released by assembling the molecule from nuclei and electrons at infinite separation) is an output of ab initio methods. However, the total energy is a very large number; for example, the total energies of H2, O2, and H2O calculated to B3LYP/6-311G level of accuracy are −3071.5, −394,346.8, and −200,532.4 kJ/mol, respectively. These values have to be calculated to at least five significant figures to calculate the enthalpy of formation to within 20 kJ/mol, which, due to computing time required, is impractical for a large number (16,417) of molecules collected in the ASM database. Second, the most accurate QM methods are not parameterized for atoms heavier than neon, and so most of the molecules of interest would be inaccessible to them.
We therefore chose the semiempirical QM methods [8] as the basis for calculating enthalpy of formation. Specifically, we used the MOPAC2016 [53] implementation of PM3 [24,54], PM6 [55], and PM7 [56] semiempirical calculations of thermodynamic parameters. The three methods represent a successive improvement of the semiempirical approach, so we used all three to test their accuracy on our specific dataset. We comment further on the comparison between ab initio and semiempirical methods below.
The accuracy of the three methods in predicting enthalpy of formation and entropy is listed in Table 8.
Unexpectedly, PM6 proved more accurate in this dataset for predicting entropy than PM7. It is unclear why this might be, but PM6 was used for entropy calculations and PM7 for enthalpy calculations for all subsequent modelling.
A ΔH that is only accurate to within 37 kJ/mol is not sufficiently accurate to predict the outcome of a reaction. As an example, the reaction of nitrogen with hydrogen to form ammonia
½N2 + 1½H2 ↔ NH3
has a free energy of reaction of −16.327 kJ/mol at 25 °C [18], predicting that the reaction will form NH3 at 25 °C if the reaction happens at all. An error of 38 kJ/mol on this value would suggest a range of −54.3 to +21.7 kJ/mol; the former value of ΔH° suggests that an equilibrium mixture of N2, H2, and NH3 at 25 °C would contain essentially 100% NH3; and the latter value of ΔH° suggests that an equilibrium mixture would contain 6·10−5 NH3. We therefore sought to improve the accuracy of the energy of formation calculation with a group additive approach. We tried atom counts, bond counts, and larger functional group counts as the basis for the possible improvement of the accuracy of the energy of formation calculation, but found that atom counts gave as good a match as bond or group counts, and required fewest free variables.
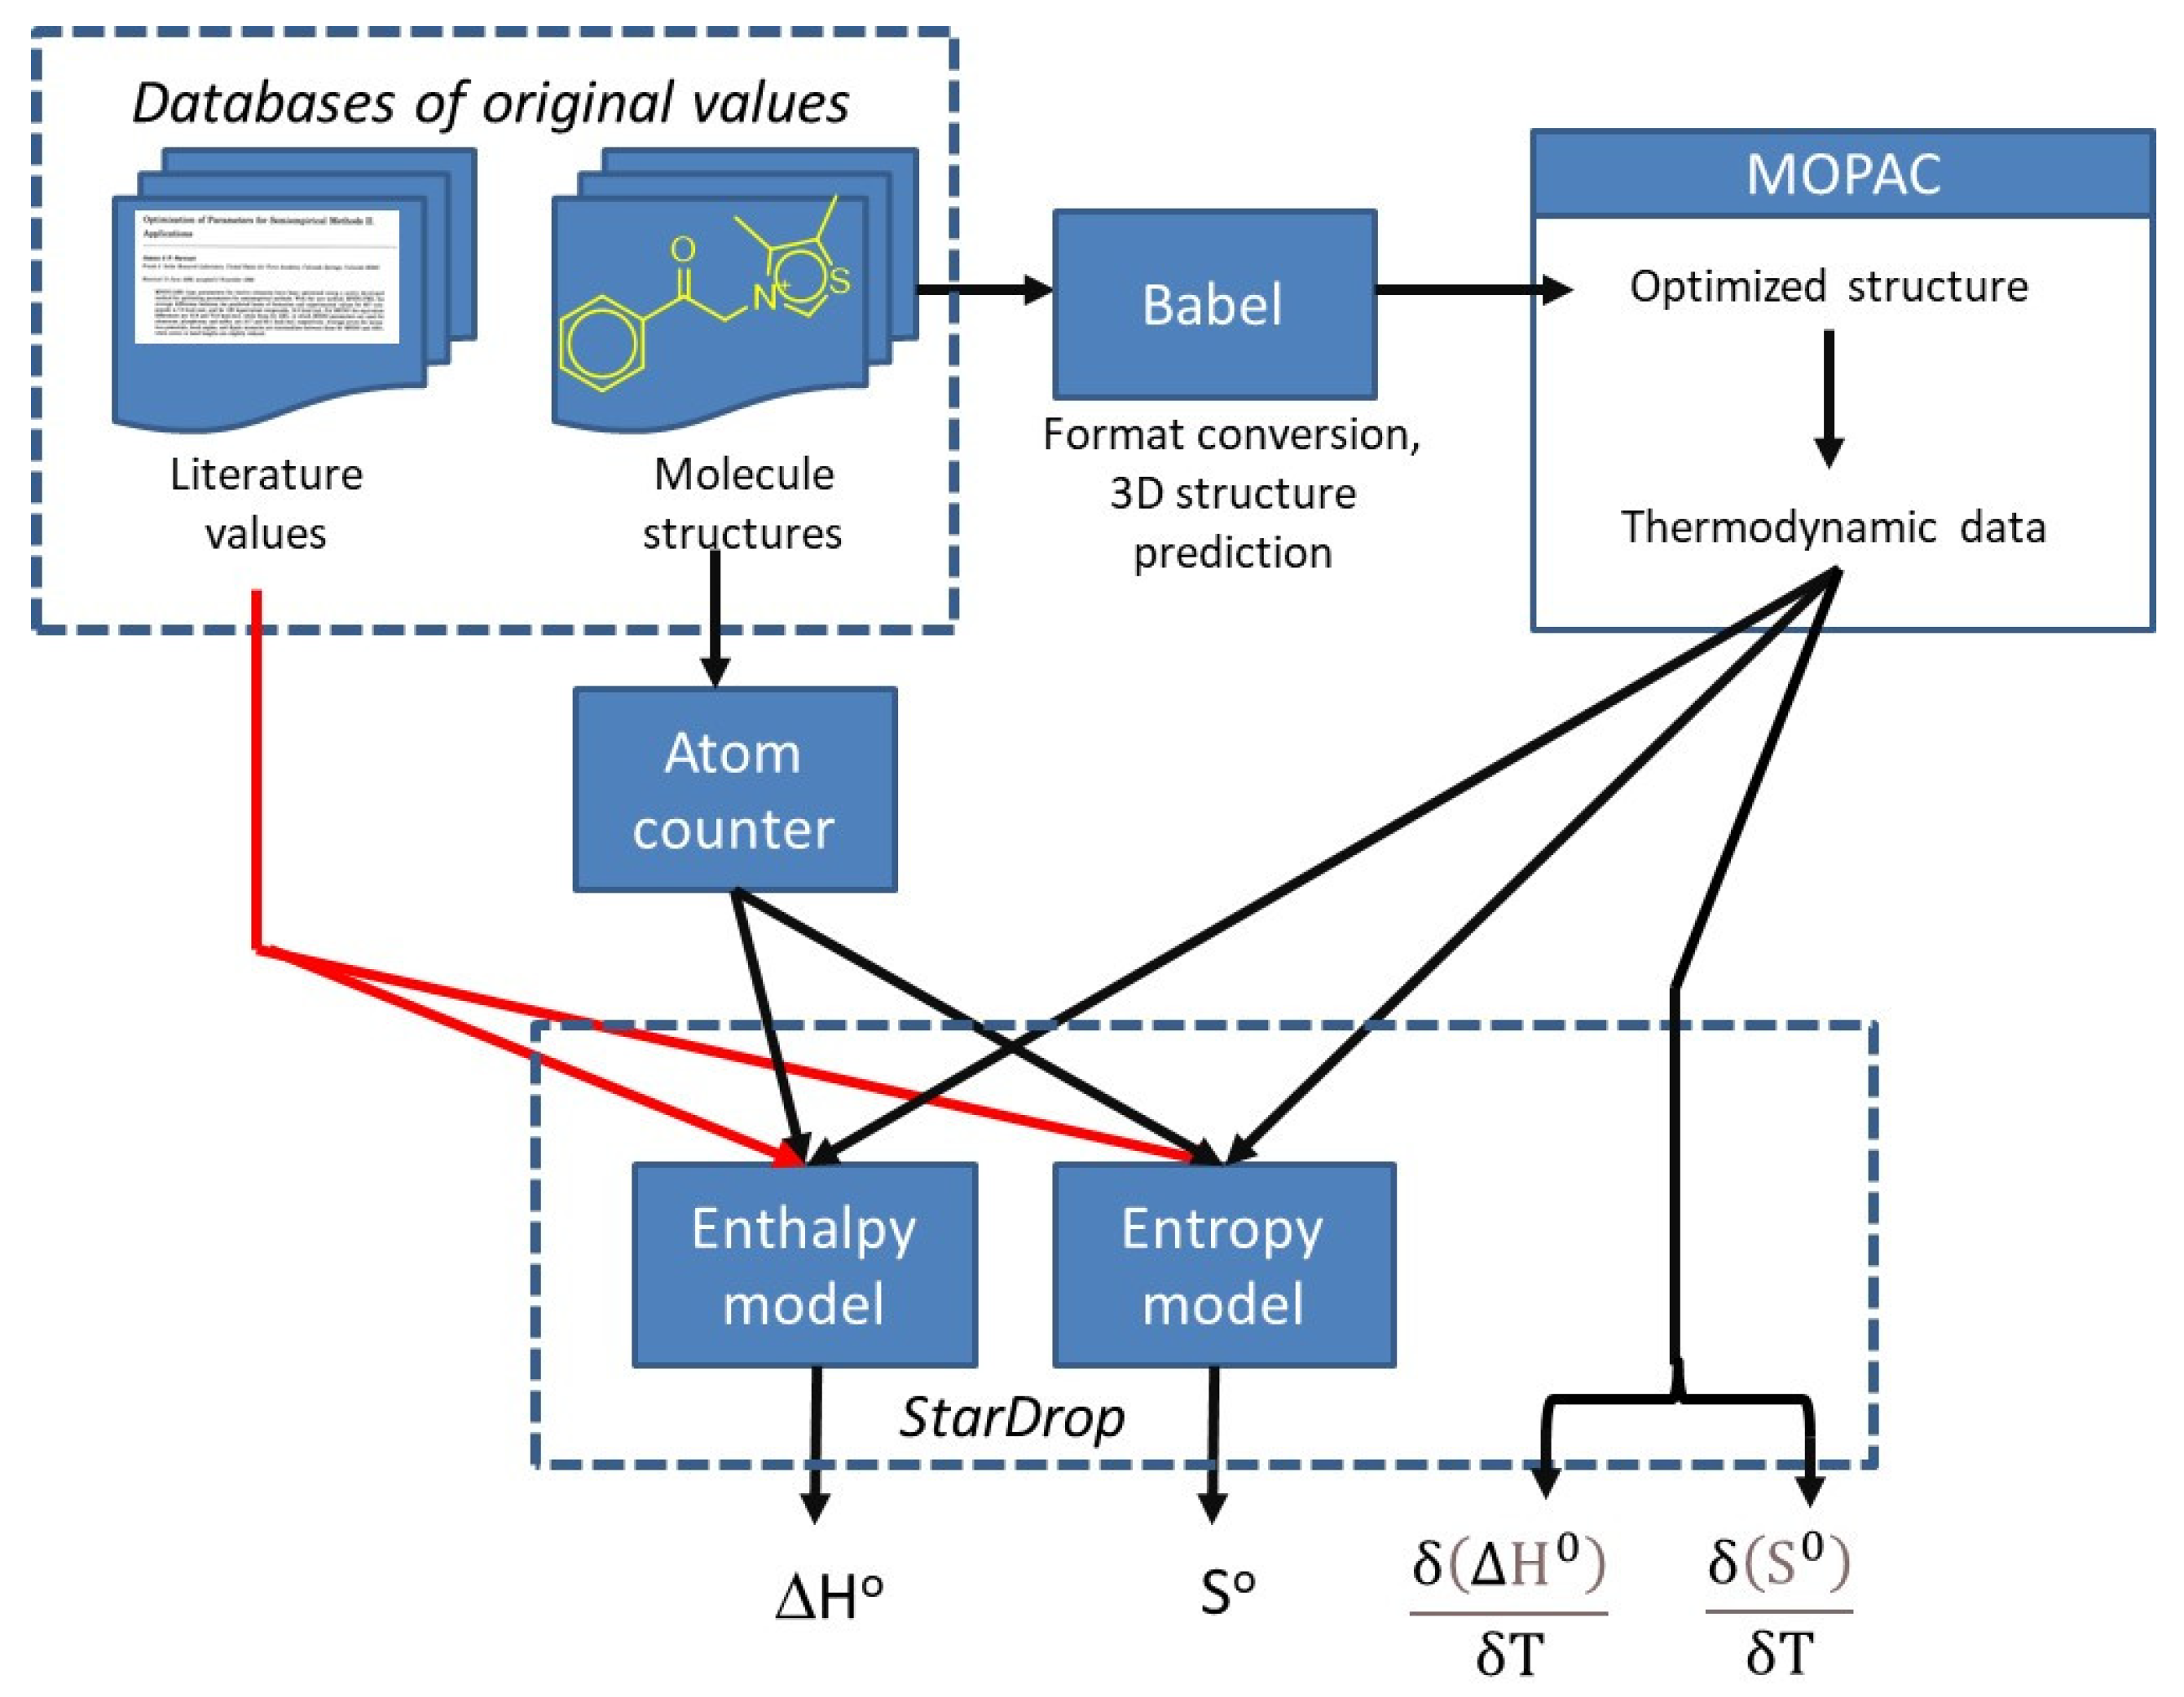
Modelling was performed in Optibrium’s StarDrop software (www.optibrium.com/startdrop), which is optimized for matching molecular properties to molecular structure [57]. The reader is directed to StarDrop user documentation for details of this technology. In summary, data are input as a set of structures (coded as SMILES strings), enthalpy endpoints, and atom counts. The AutoModeller function of StarDrop then follows the following procedure:
  • Splits the data into three sets: 50% of the structures into a training set, 25% into a validation set, 25% into a test set. Splitting is performed on the basis of Tanimoto coefficient clustering of molecules.
  • Attempts to fit the enthalpy data for the training set to a function of the molecular descriptors in that set using all of the following methods (readers are directed to StarDrop documentation for details of modelling methods):
    • Partial least squares
    • Radial basis function
    • Random forest regression
    • Gaussian process
    • Radial basis function with input descriptors selected by genetic algorithm
  • Applies all models to the independent validation set and selects the best model based on validation set fit.
  • Applies this model to the test set to provide an independent measure of model accuracy.

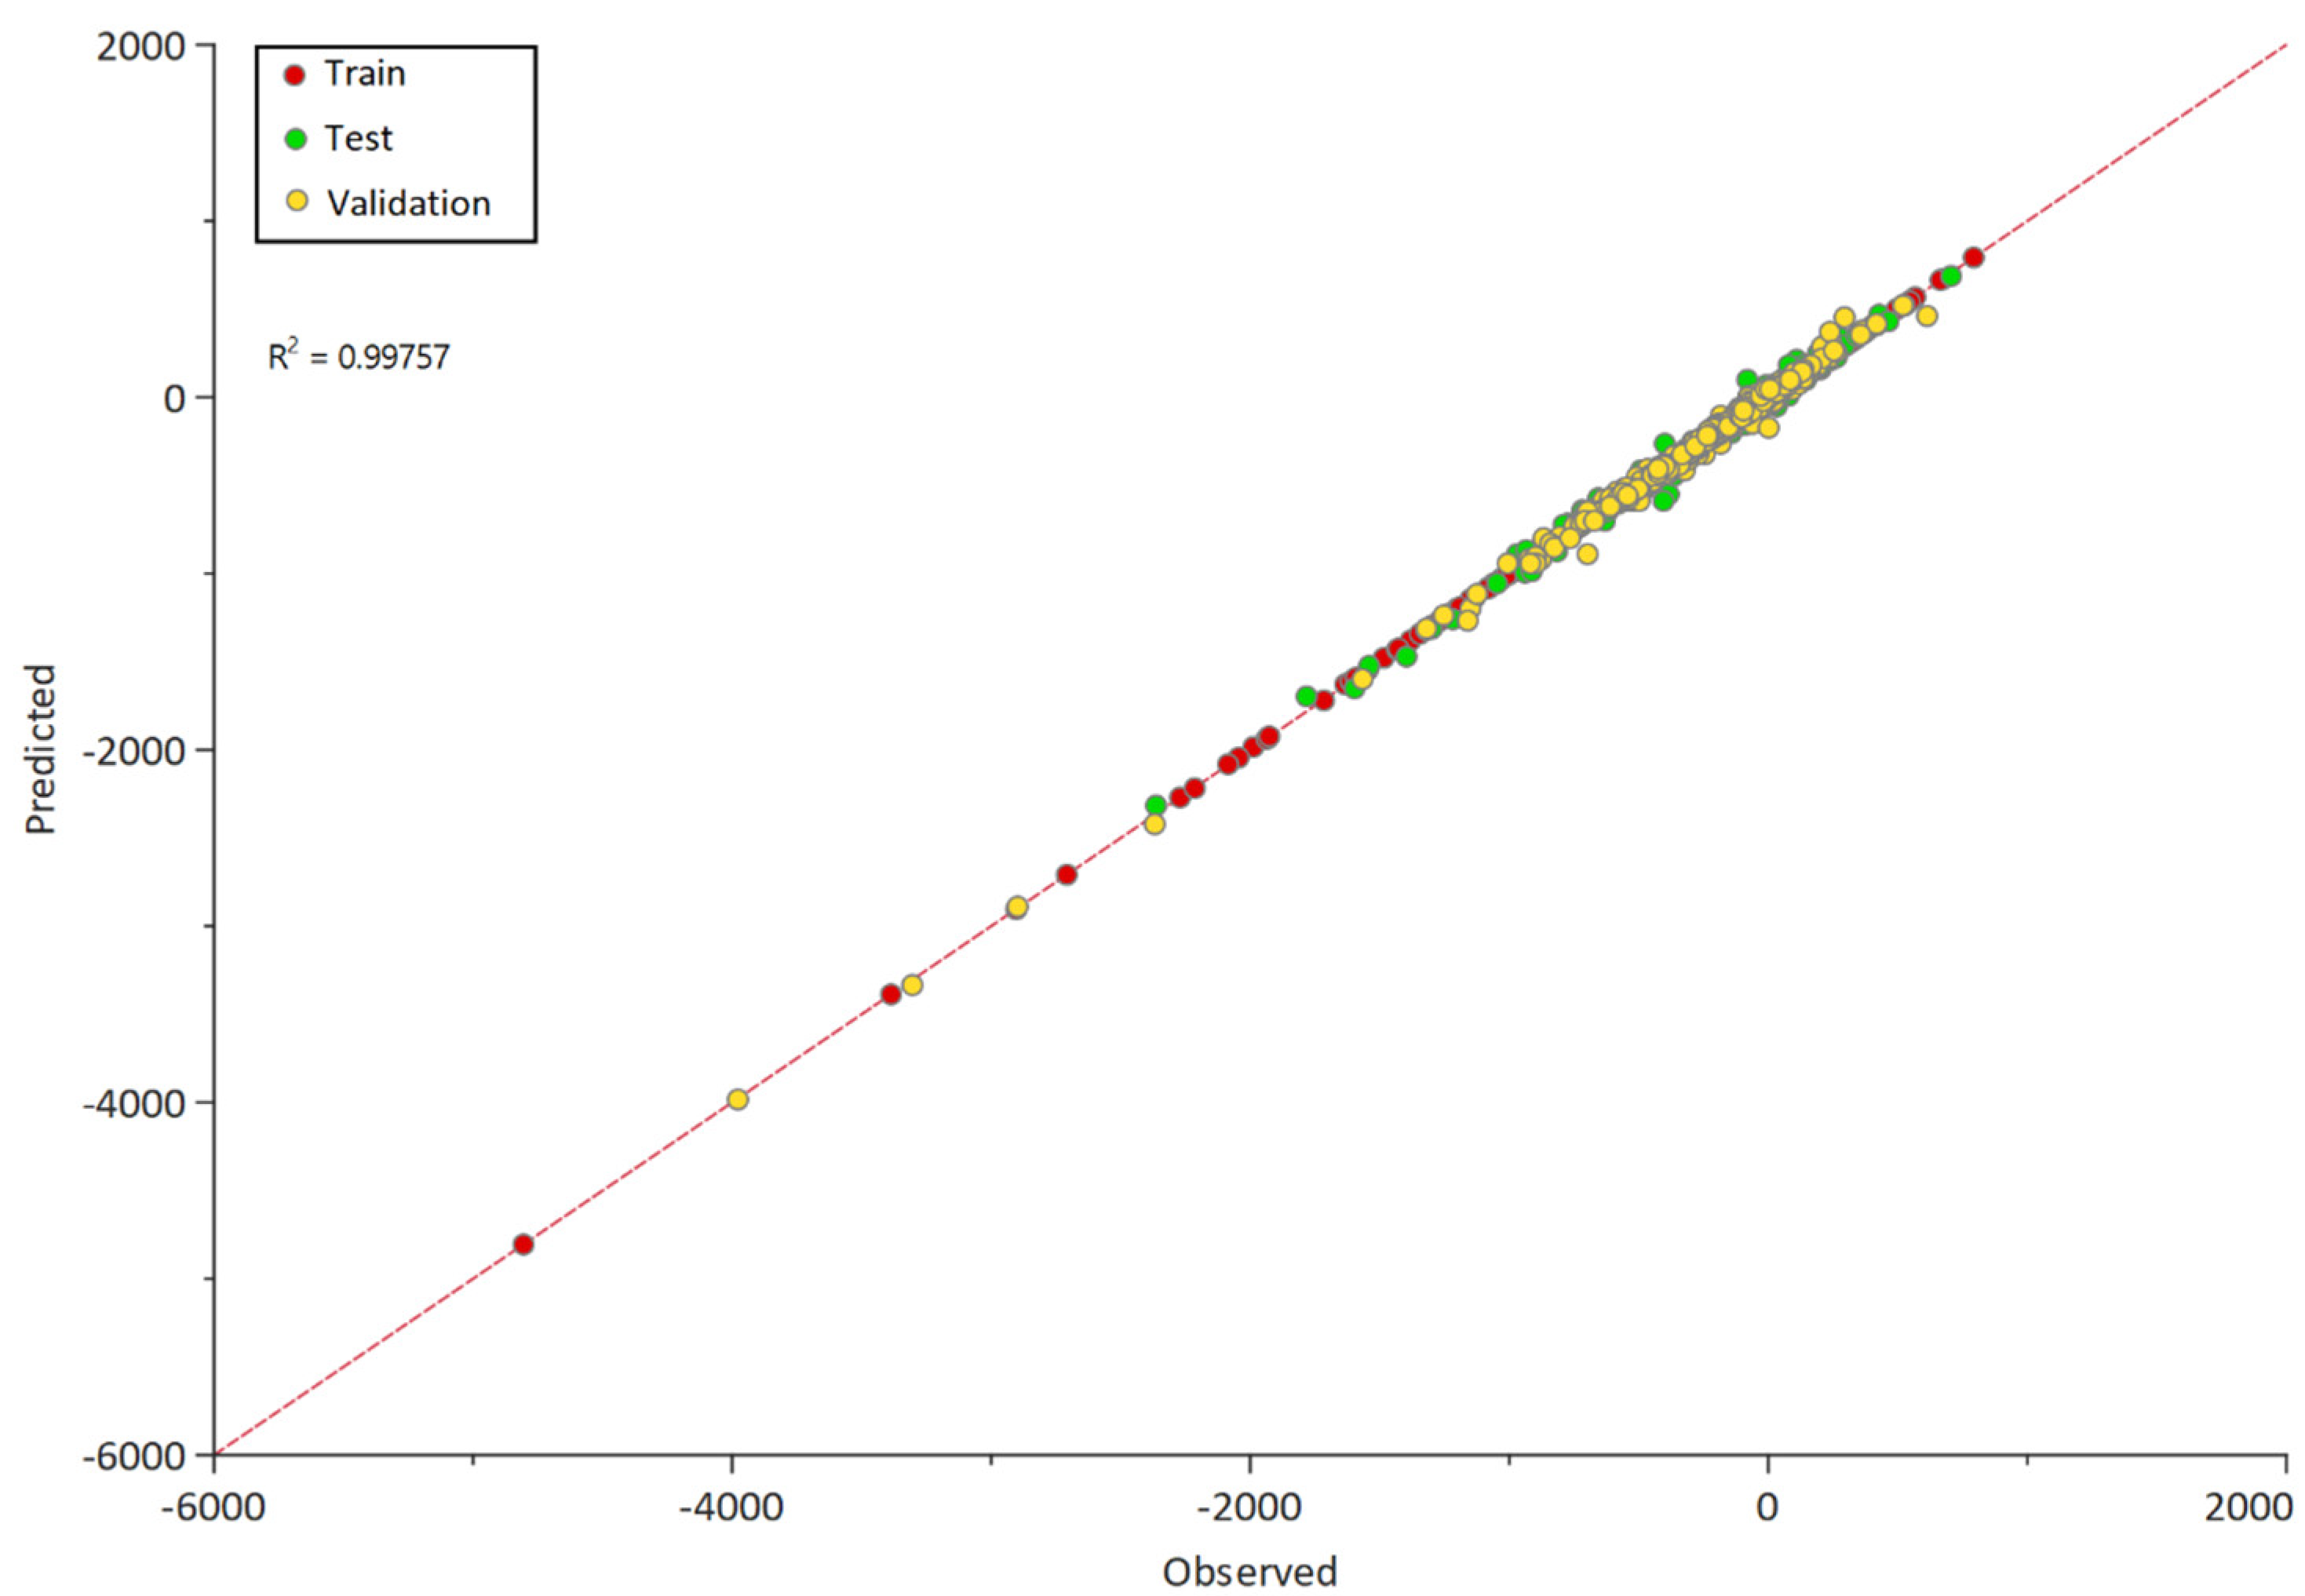
3.2.2. Modelling Enthalpy of Formation

The method above was used to model the enthalpy of formation based on the measured values in the dataset described in Section 2.2.1. Using atom counts and PM7 semi-empirical QM output as inputs, a radial basis function (RBF) model was found to give the best prediction, with r2 = 0.997 and RMS error of 24.33 kJ/mol on the test set. Including bond counts or ab initio QM calculations to atom counts did not significantly change the accuracy of the model. Model performance on the validation and test data subsets of data is shown in Figure 4 (because a fitted radial basis function is required to pass through all the training data points, the training data are always exactly matched).

3.2.3. Comparison with Other Methods

A wide range of methods have been used to calculate enthalpy, so it is useful to benchmark this method to them. Published data on model performance are rarely comparable, as they are tested on different sets of molecules. Those that are benchmarked against similar molecule sets usually select chemically limited molecules (e.g., alkanes), which do not represent the chemical diversity we are capturing with this work. We therefore used the same method as described above to develop models optimized for our dataset, but based on different input parameters, specifically, ab initio quantum mechanics, semiempirical quantum mechanics, and group contribution. Ab initio QM methods were implemented in GAMESS [58]. Because of the diversity of the compounds being considered in this work, the only group contribution method that can be applied is to consider the smallest possible ‘group’—two atoms joined by a bond. This is the same as calculating the enthalpy of a molecule as being the sum of the enthalpy of formation of its component bonds. We deployed this sum_of_bonds method here. The results are summarized in Table 9; more details on the methods used and the performance of specific methods are given in Appendix A. We emphasize that much better performance can be obtained with all the methods listed in Table 9 for more limited chemical spaces, and group contribution methods can be used for them. However, as our goal was to predict the thermodynamic properties of any covalent molecule containing any of 15 elements, our approach of semiempirical QM corrected by atom counts in an RBF model is the most accurate solution.

3.2.4. Entropy Modelling

A prediction accuracy of 29 J/mol/K in predicting entropy is also insufficient for our purposes, and so we also sought to improve the accuracy of entropy prediction. Entropy modelling was performed using the same procedure as enthalpy modelling. StarDrop modelling was then performed as described above to correct the GAMESS output based on element counts. The best model fit was found to be GP2DSearch, with r2 = 0.9248 and RMS error of 12.85 on the test set. A model performance on the three data subsets of data is shown in Figure 5.
We note that the semiempirical methods make a number of simplifications that could contribute to the inaccuracy of prediction of enthalpy and entropy. For example, entropy calculations do not include conformational terms, which could contribute significantly to some molecules. These will not be adequately corrected by any modelling that includes just atom or bond counts, such as the modelling described above. Thus there is room for further work to improve the predictions of thermodynamic parameters reported here.

3.2.5. Change in Enthalpy and Entropy with Temperature

In contrast with enthalpy of formation and entropy, the change in enthalpy and entropy with temperature was well predicted by the PM7 method, as shown in Figure 6.
We therefore used the PM7 predicted values for the change in enthalpy and entropy with temperature without further adjustment (except to convert from calories to joules). We note, however, that the MOPAC semiempirical methods do not predict change in enthalpy of formation. The PM7 output provides for
ΔH = ΔH° + (H-H°)
whereas a prediction of ΔH should calculate
ΔH = ΔH° + (ΔH-ΔH°)
where ΔH is the enthalpy of formation of a molecule from its component elements. The H−Ho values can be readily converted to ΔH–ΔH° values by correcting the H−Ho values of the elements according to Equation (4):
Δ H = Δ H ° + [ H H ° ]   n e × ( H H ° ) e
where ΔH° is the enthalpy of formation of the compound at 298 K (modelled in Section 3.2.2 above), [H−Ho] is the increase in absolute enthalpy between 298 K and the target temperature, ne is the number of atoms of element e in the molecule, and [H−Ho]e is the increase in absolute entropy of element e between 298 K and the target temperature.

3.3. Application of All Small Molecules (ASM) Database

The models described above were run on the All Small Molecules (ASM) dataset [1] to provide predicted Gibbs free energy of formation data for those molecules, which is applicable to calculating equilibria in the gas phase at constant temperature and pressure. Modelling was performed exactly as above, and ΔG calculated according to Equations (2)–(4). Both the inputs to the models and the outputs from the models are provided in the data file provided in this set so that others can develop improved models.
We note that the ASM molecule list is a list of small molecules with a wide range of volatility (with boiling point as a proxy of volatility; see [1] for details on the ASM molecule selection process and the creation of ASM database itself). Some molecules in the list, such as urea or glycine, are very unlikely to be stably present in the gas phase except at extremely low pressures. The calculations presented in this work are for the gas phase only. However, we included the results for less volatile molecules here as well for two reasons. First, this work could be extended with estimates of heats and entropy of vaporization to predict enthalpy and entropy of the solid state. The gas-phase data, therefore, act as a base on which further work could be built. Second, it is possible that such chemical species could be fleeting intermediates in gas-phase chemistry (as phosphorous acid has been proposed to be in the phosphorus chemistry of Venus’s lower atmosphere, despite its thermal instability below the clouds [50]). The thermodynamics of such less volatile molecules could therefore be of interest for modelling such processes. Future work will seek to build comparable models for solid-phase thermodynamics, and hence for heats of vaporization, so that such mixed-phase calculations can be performed.
The same calculation of ΔG, starting from PM6 and PM7 output and atom counts, was performed for the 172 molecules from the [19] dataset used above in Section 3.2.5. For these molecules, measured values of ΔH and ΔS are known, and so a ‘measured’ value of ΔG can be derived. The root mean square difference between ΔG calculated from semiempirical QM methods and atom counts as described and that tabulated in [19] is shown in Figure 7.
We note that the [19] set of compounds does not include any As, Se, or Ge compounds, and so this is only an estimate of the error in the wider dataset. The error we expect in the setoff compounds is
e(ΔG) = e(ΔH) + e(ΔS) × T
where e(ΔG) = RMS error in ΔG, e(ΔH) = RMS error in ΔH, e(ΔS) = RMS error in ΔS, and T = temperature. Surprisingly, the error in ΔG is substantially smaller than this estimate. This suggests that errors in estimating the various input parameters are not independent and partially cancel each other when values of ΔH and S estimated from semiempirical QM methods are used to calculate ΔG.

Author Contributions

Conceptualization, W.B., J.J.P. and S.S.; methodology, W.B.; software, W.B.; data curation, W.B. and Z.Z.; writing—original draft preparation, W.B.; writing—review and editing, W.B., J.J.P. and S.S.; funding acquisition, S.S. All authors have read and agreed to the published version of the manuscript.

Funding

The authors gratefully acknowledge funding from the Change Happens Foundation and from NASA, Grant 80NSSC19K0471.

Institutional Review Board Statement

Not applicable.

Informed Consent Statement

Not applicable.

Data Availability Statement

All the data referred to in Table 1, Table 2, Table 3, Table 4 and Table 5, as Excel spreadsheets, together with the StarDrop ‘.aim’ model files for running the models, can be downloaded from Zenodo (doi:10.5281/zenodo.4661783). The full Version 5 of the All Small Molecules (ASM) database with predictions of thermodynamic values can also be downloaded from www.allmols.org in several formats.

Acknowledgments

We are very grateful to Matt Segal and Optibrium Ltd. (Blenheim House, Cambridge Innovation Park, Denny End Road, Cambridge, CB25 9PB, UK) for access to the StarDrop software.

Conflicts of Interest

The authors declare no conflict of interest.

Appendix A

Detailed Model Results

Table A1 shows the results of developing models for predicting ΔH from a variety of inputs using the dataset described in the main paper. We emphasize that the accuracy of any model is domain specific, and much greater accuracy might have been achievable with a much larger dataset to use to train models, or more limited chemical space to predict.
Table A1. Results of models. Statistics are for the Test set for Stardrop models (i.e., the independent set not used in model generation or selection).
Method NumberMethodRMS Error in Predicting ΔHr2 Between Model Prediction and ΔH
1Ab Initio + atom weights126.320.4654
2Ab Initio + atom counts72.770.9374
3Ab Initio Plus + atom counts61.710.9524
4Bond energy based114.580.8358
5Semi-empirical PM342.720.9864
6Semi-empirical PM642.030.9855
7Semi-empirical PM737.170.9885
8Semi-empirical PM7 + atom counts RBF24.120.9947
9Semi-empirical PM7 + bond counts29.070.9906
AbAb initio QM calculations on the enthalpy Test set were done using GAMESS [58]. Calculations were done using DFT using B3LYP at 3–21 level of accuracy. Higher levels of accuracy frequently failed to converge for molecules containing atoms heavier than neon, and many are not parameterized for atoms heavier than argon. Data was extracted from the output file for the absolute energy (AE), and five other intermediate energy contributions; total potential energy, total kinetic energy, 1-electron energy, 2-electron energy, nuclear repulsion energy and nuclear-electron interaction energy. Models were built with just the total Ab Initio energy (“Ab Initio”) or using all six energy measures as input (“Ab Initio plus”).
In principle the enthalpy of formation of a compound can be determined from the absolute energy by subtracting the absolute energy of the elements from which the compound is composed. We attempted two approaches to this. The first was to optimize the values of Ee in Equation (A1)
Δ H = A   n e × E e  
where A is the absolute energy of the molecule as calculated by GAMESS, ne is the number of atoms of element e in the molecule and Ee is the notional energy of that element in the standard state. Values of Ee were adjusted using a simulated annealing approach [59] to minimize the RMS error in predicting ΔH. This approach resulted in some Ee values that were positive, which is unphysical, and in any case produced a poor match (Method 1 in Table A1). We therefore used the StarDrop model building software to build a model from either Ab Initio (Method 2) or Ab Initio Plus (Method 3) data and the count of the number of atoms, using the same protocol as described in the main paper. This results in output that can be a non-linear function of the inputs, and improved performance considerably, at the expense of not being readily physically interpretable.
An approximation to the total enthalpy of a molecule is the enthalpy of each of the bonds in the molecule. This is a substantial simplification of the energetics of a molecule; for example, it neglects aromatization energies, delocalization of electrons across several atoms, and partial bond structures (such as the overlap of bonds in the amide bond which prevents rotation around the C-N bond in peptides). Despite these limitations, ‘typical bond energies’ are often cited in chemistry textbooks as meaningful, so we used StarDrop to model ΔH based solely on the counts of bonds between atoms, each combination of two atoms and one bond type (Single, double or triple) being counted separately. The result (Model 4) was a poor match, and this approach was not explored further.
Semi-empirical methods PM3, PM6 and PM7 (Methods 4, 5, 6) are included here for comparison. All are better than any ab initio calculation in this modelling, but none are good enough for useful chemical prediction. We therefore sought to reduce the errors in the semi-empirical method by including data on the atom (model 8) or bond (model 9) counts in the StarDrop input. Including atom counts reduced errors by ~40%, and so this approach was adopted for the main paper. Unexpectedly, including bond data resulted in slightly poorer performance. This was unexpected as the atom count data is implicit in the bond count data. The poorer performance may simply be due to the noise in a sparsely populated, wide input dataset overwhelming the modelling—there are 15 elements but 151 bond types as input, many of which are only present in 1 or 2 molecules, and the noise in this data may overwhelm any realistic modelling.

References

  1. Seager, S.; Bains, W.; Petkowski, J. Toward a List of Molecules as Potential Biosignature Gases for the Search for Life on Exoplanets and Applications to Terrestrial Biochemistry. Astrobiology 2016, 16, 465–485. [Google Scholar] [CrossRef] [PubMed] [Green Version]
  2. Reymond, J.-L. The Chemical Space Project. Acc. Chem. Res. 2015, 48, 722–730. [Google Scholar] [CrossRef] [Green Version]
  3. Wiberg, K.B. Group equivalents for converting ab initio energies to enthalpies of formation. J. Comput. Chem. 1984, 5, 197–199. [Google Scholar] [CrossRef]
  4. Ibrahim, M.R.; Von Ragué Schleyer, P. Atom equivalents for relating ab initio energies to enthalpies of formation. J. Comput. Chem. 1985, 6, 157–167. [Google Scholar] [CrossRef]
  5. Saeys, M.; Reyniers, M.-F.; Marin, G.B.; Van Speybroeck, V.; Waroquier, M. Ab initio calculations for hydrocarbons: Enthalpy of formation, transition state geometry, and activation energy for radical reactions. J. Phys. Chem. A 2003, 107, 9147–9159. [Google Scholar] [CrossRef]
  6. Schulman, J.M.; Disch, R.L. Ab initio heats of formation of medium-sized hydrocarbons. The heat of formation of dodecahedrane. J. Am. Chem. Soc. 1984, 106, 1202–1204. [Google Scholar] [CrossRef]
  7. Stewart, J.J. Use of semiempirical methods for detecting anomalies in reported enthalpies of formation of organic compounds. J. Phys. Chem. Ref. Data 2004, 33, 713–724. [Google Scholar] [CrossRef]
  8. Stewart, J.J.P. Semiempirical Molecular Orbital Methods. In Reviews in Computational Chemistry; VCH Publishers: New York, NY, USA, 1990; pp. 45–81. [Google Scholar]
  9. Winget, P.; Clark, T. Enthalpies of formation from B3LYP calculations. J. Comput. Chem. 2004, 25, 725–733. [Google Scholar] [CrossRef]
  10. Engler, E.M.; Andose, J.D.; Schleyer, P.V.R. Critical evaluation of molecular mechanics. J. Am. Chem. Soc. 1973, 95, 8005–8025. [Google Scholar] [CrossRef]
  11. Cohen, N.; Benson, S.W. Estimation of heats of formation of organic compounds by additivity methods. Chem. Rev. 1993, 93, 2419–2438. [Google Scholar] [CrossRef]
  12. Benson, S.; Cohen, N. Current Status of Group Additivity; ACS Publications: Washington, DC, USA, 1998. [Google Scholar]
  13. Fishtik, I.; Datta, R. Group additivity vs. ab initio. J. Phys. Chem. A 2003, 107, 6698–6707. [Google Scholar] [CrossRef]
  14. Ruscic, B.; Pinzon, R.E.; Morton, M.L.; von Laszevski, G.; Bittner, S.J.; Nijsure, S.G.; Amin, K.A.; Minkoff, M.; Wagner, A.F. Introduction to active thermochemical tables: Several “key” enthalpies of formation revisited. J. Phys. Chem. A 2004, 108, 9979–9997. [Google Scholar] [CrossRef]
  15. Ruscic, B.; Pinzon, R.E.; Von Laszewski, G.; Kodeboyina, D.; Burcat, A.; Leahy, D.; Montoy, D.; Wagner, A.F. Active Thermochemical Tables: Thermochemistry for the 21st century. J. Phys. Conf. Ser. 2005, 16, 078. [Google Scholar] [CrossRef]
  16. Cioslowski, J.; Schimeczek, M.; Liu, G.; Stoyanov, V. A set of standard enthalpies of formation for benchmarking, calibration, and parametrization of electronic structure methods. J. Chem. Phys. 2000, 113, 9377–9389. [Google Scholar] [CrossRef] [Green Version]
  17. Cox, J.D.; Pilcher, G. Thermochemistry of Organic and Organometallic Compounds; Academic Press: Cambridge, MA, USA, 1970. [Google Scholar]
  18. Chase, M.W.J. NIST-JANAF Thermochemical Tables. J. Phys. Chem. Ref. Data Monogr. 1998, 9, 1–1961. [Google Scholar]
  19. NIST. NIST-JANAF Thermochemical Tables: Online Database. Available online: https://janaf.nist.gov/ (accessed on 29 December 2021).
  20. Jorgensen, K.R.; Wilson, A.K. Enthalpies of formation for organosulfur compounds: Atomization energy and hypohomodesmotic reaction schemes via ab initio composite methods. Comput. Theor. Chem. 2012, 991, 1–12. [Google Scholar] [CrossRef]
  21. NIST. NIST Chemistry WebBook, SRD 69. Available online: https://webbook.nist.gov/ (accessed on 9 September 2017).
  22. Pedley, J.B. Thermochemical Data of Organic Compounds; Springer Science & Business Media: Berlin/Heidelberg, Germany, 2012. [Google Scholar]
  23. Sander, S.; Golden, D.; Kurylo, M.; Moortgat, G.; Wine, P.; Ravishankara, A.; Kolb, C.; Molina, M.; Finlayson-Pitts, B.; Huie, R. Chemical Kinetics and Photochemical Data for Use in Atmospheric Studies Evaluation Number 15; Jet Propulsion Laboratory, National Aeronautics and Space: Pasadena, CA, USA, 2006. [Google Scholar]
  24. Stewart, J.J.P. Optimization of parameters for semiempirical methods II. Applications. J. Comput. Chem. 1989, 10, 221–264. [Google Scholar] [CrossRef]
  25. Yaws, C.L.; Gabbula, C. Yaws’ Handbook of Thermodynamic and Physical Properties of Chemical Compounds; Knovel: New York, NY, USA, 2003. [Google Scholar]
  26. Pankratov, A.N.; Uchaeva, I.M. A semiempirical quantum chemical testing of thermodynamic and molecular properties of arsenic compounds. J. Mol. Struct. 2000, 498, 247–254. [Google Scholar] [CrossRef]
  27. Tel’noy, V.I.; Sheiman, M.S. Thermodynamics of organoselenium and organotellurium compounds. Russ. Chem. Rev. 1995, 64, 309. [Google Scholar] [CrossRef]
  28. Gordon, M.S.; Boatz, J.A.; Walsh, R. Heats of formation of alkylsilanes. J. Phys. Chem. 1989, 93, 1584–1585. [Google Scholar] [CrossRef]
  29. Hartley, S.B.; Holmes, W.S.; Jacques, J.K.; Mole, M.F.; McCoubrey, J.C. Thermochemical properties of phosphorus compounds. Q. Rev. Chem. Soc. 1963, 17, 204–223. [Google Scholar] [CrossRef]
  30. O’Hare, P.A.G. Calorimetric measurements of the specific energies of reaction of arsenic and of selenium with fluorine. Standard molar enthalpies of formation ΔfHom at the temperature 298.15 K of AsF5, SeF6, As2Se3, As4S4, and As2S3. Thermodynamic properties of AsF5 and SeF6 in the ideal-gas state. Critical assessment of ΔfHom(AsF3, l), and the dissociation enthalpies of As-F bonds. J. Chem. Thermodyn. 1993, 25, 391–402. [Google Scholar] [CrossRef]
  31. Liebman, J.F.; Simões, J.A.M.; Slayden, S.W. Thermochemistry of Organoarsenic, Antimony and Bismuth Compounds. In Organic Arsenic, Antimony and Bismuth Compounds (1994); John Wiley & Sons, Ltd.: Hoboken, NJ, USA, 2004; pp. 153–168. [Google Scholar]
  32. Mortimer, C.T.; Waterhouse, J. Enthalpy of combustion of diphenyl diselenide. J. Chem. Thermodyn. 1980, 12, 961–965. [Google Scholar] [CrossRef]
  33. Mortimer, C.T.; Waterhouse, J. Enthalpies of formation of PhSeBr and PhSeBr3. Thermochim. Acta 1988, 131, 91–93. [Google Scholar] [CrossRef]
  34. Gurvich, L.V.; Veyts, I. Thermodynamic Properties of Individual Substances: Elements and Compounds, Part 2; CRC Press: Boca Raton, FL, USA, 1990; Volume 2. [Google Scholar]
  35. Mills, K.C. Thermodynamic Data for inorganic Sulphides, Selenides and Tellurides; Butterworths: London, UK, 1974. [Google Scholar]
  36. Binnewies, M.; Milke, E. Thermochemical Data of Elements and Compounds; Wiley-VCH: Weinheim, Germany, 1999. [Google Scholar]
  37. Weininger, D. SMILES, a chemical language and information system. 1. Introduction to methodology and encoding rules. J. Chem. Inf. Comput. Sci. 1988, 28, 31–36. [Google Scholar] [CrossRef]
  38. Mu, L.; He, H. Prediction of standard absolute entropies for gaseous organic compounds. Chemom. Intell. Lab. Syst. 2012, 112, 41–47. [Google Scholar] [CrossRef]
  39. Rihani, D.N.; Doraiswamy, L.K. Estimation of Ideal Gas Entropy of Organic Compounds. Ind. Eng. Chem. Fundam. 1968, 7, 375–380. [Google Scholar] [CrossRef]
  40. Sarangam, P.R. Development of Thermodynamic Properties Data for Sulfur Compounds and Thermodynamic Analysis of the Direct Sulfur Recovery Process; Lamar University: Beaumont, TX, USA, 1993. [Google Scholar]
  41. Walker, S.I.; Bains, W.; Cronin, L.; DasSarma, S.; Danielache, S.; Domagal-Goldman, S.; Kacar, B.; Kiang, N.Y.; Lenardic, A.; Reinhard, C.T. Exoplanet biosignatures: Future directions. Astrobiology 2018, 18, 779–824. [Google Scholar] [CrossRef]
  42. Seager, S.; Bains, W. The search for signs of life on exoplanets at the interface of chemistry and planetary science. Sci. Adv. 2015, 1, e1500047. [Google Scholar] [CrossRef] [Green Version]
  43. Catling, D.C.; Krissansen-Totton, J.; Kiang, N.Y.; Crisp, D.; Robinson, T.D.; DasSarma, S.; Rushby, A.J.; Del Genio, A.; Bains, W.; Domagal-Goldman, S. Exoplanet biosignatures: A framework for their assessment. Astrobiology 2018, 18, 709–738. [Google Scholar] [CrossRef]
  44. Seager, S.; Schrenk, M.; Bains, W. An astrophysical view of Earth-based metabolic biosignature gases. Astrobiology 2012, 12, 61–82. [Google Scholar] [CrossRef] [PubMed]
  45. Heller, S.R.; McNaught, A.; Pletnev, I.; Stein, S.; Tchekhovskoi, D. InChI, the IUPAC International Chemical Identifier. J. Cheminformatics 2015, 7, 23. [Google Scholar] [CrossRef] [PubMed] [Green Version]
  46. Gaur, U.; Shu, H.C.; Mehta, A.; Wunderlich, B. Heat capacity and other thermodynamic properties of linear macromolecules. I. Selenium. J. Phys. Chem. Ref. Data 1981, 10, 89–118. [Google Scholar] [CrossRef]
  47. Gokcen, N. The As (arsenic) system. Bull. Alloy Phase Diagr. 1989, 10, 11–22. [Google Scholar] [CrossRef]
  48. Card, M.L.; Gomez-Alvarez, V.; Lee, W.-H.; Lynch, D.G.; Orentas, N.S.; Lee, M.T.; Wong, E.M.; Boethling, R.S. History of EPI Suite™ and future perspectives on chemical property estimation in US Toxic Substances Control Act new chemical risk assessments. Environ. Sci. Processes Impacts 2017, 19, 203–212. [Google Scholar] [CrossRef]
  49. EPA, U. Estimation Programs Interface Suite™ for Microsoft® Windows, v 4.2.; United States Environmental Protection Agency: Washington, DC, USA, 1993. Available online: https://www.epa.gov/tsca-screening-tools/epi-suitetm-estimation-program-interface (accessed on 9 September 2017).
  50. Bains, W.; Petkowski, J.J.; Seager, S.; Ranjan, S.; Sousa-Silva, C.; Rimmer, P.B.; Zhan, Z.; Greaves, J.S.; Richards, A.M. Phosphine on Venus cannot be explained by conventional processes. Astrobiology 2021, 21, 1277–1304. [Google Scholar] [CrossRef] [PubMed]
  51. Mackle, H.; O’Hare, P.A.G. Thermodynamic properties of sulphur-containing molecules. isothiocyanic and deuteroisothiocyanic acids. Trans. Faraday Soc. 1964, 60, 666–668. [Google Scholar] [CrossRef]
  52. Barner, H.E.; Scheuerman, R.V. Handbook of Thermochemical Data for Compounds and Aqueous Species; University Microfilms Incorporated: Ann Arbor, MI, USA, 1977. [Google Scholar]
  53. Stewart, J.J.P. MOPAC: A semiempirical molecular orbital program. J. Comput.-Aided Mol. Des. 1990, 4, 1–103. [Google Scholar] [CrossRef]
  54. Stewart, J.J.P. Optimization of parameters for semiempirical methods I. Method. J. Comput. Chem. 1989, 10, 209–220. [Google Scholar] [CrossRef] [Green Version]
  55. Stewart, J.J.P. Optimization of parameters for semiempirical methods V: Modification of NDDO approximations and application to 70 elements. J. Mol. Modeling 2007, 13, 1173–1213. [Google Scholar] [CrossRef] [Green Version]
  56. Stewart, J.J.P. Optimization of parameters for semiempirical methods VI: More modifications to the NDDO approximations and re-optimization of parameters. J. Mol. Modeling 2013, 19, 1–32. [Google Scholar] [CrossRef] [PubMed] [Green Version]
  57. Obrezanova, O.; Gola, J.M.; Champness, E.J.; Segall, M.D. Automatic QSAR modeling of ADME properties: Blood–brain barrier penetration and aqueous solubility. J. Comput.-Aided Mol. Des. 2008, 22, 431–440. [Google Scholar] [CrossRef] [PubMed]
  58. Gordon, M.S.; Schmidt, M.W. Advances in electronic structure theory: GAMESS a decade later. In Theory and Applications of Computational Chemistry: The First Forty Years; Dykstra, C.E., Frenking, G., Kim, K.S., Scuseria, G.E., Eds.; Elsevier: Amsterdam, The Netherlands, 2005; pp. 1167–1189. [Google Scholar]
  59. Kirkpatrick, S.; Gelatt, C.D., Jr.; Vecchi, M.P. Optimization by Simulated Annealing. Science 1983, 220, 671–680. [Google Scholar] [CrossRef] [PubMed]
Figure 1. Summary of process used in this work. See text for details.
Data 07 00033 g001
Figure 2. Distribution of range (maximum value minus minimum value) for experimentally derived enthalpy of formation values in the literature, with values >100 kJ/mol excluded. Y-axis: number of collected entries in the dataset. X-axis: range of ΔH° values (kJ/mol).
Data 07 00033 g002
Figure 3. Distribution of range (maximum value minus minimum value) for experimentally derived entropy values in the literature. Y-axis: number of collected entries in the dataset. X-axis: range of S° values (J/mol/K).
Data 07 00033 g003
Figure 4. Output from StarDrop modelling of enthalpy. X axis: observed (literature reported) values for enthalpy of formation, in kJ/mol. Y axis: predicted values from the model. The RBF method inherently fits all the training data to the model, and so training set fit is 100%. This shows that the model correctly predicts the enthalpy of formation of the reference molecule set to an r2 of 0.99757.
Data 07 00033 g004
Figure 5. Outputs from StarDrop modelling of entropy. X-axis: observed (literature reported) values for entropy in J/mol/K. Y-axis: predicted values from the model. This shows that the model correctly predicts the entropy of the reference molecule set to an r2 of 0.992427.
Data 07 00033 g005
Figure 6. Errors in semiempirical prediction of the difference between enthalpy at 298 K and enthalpy at other temperatures (H−Ho) and the entropy at 298 K and at other temperatures (S–So). X-axis: temperature. Y-axis: root mean square difference between predicted S–So and actual S–So (left axis) and predicted H−Ho and actual H−Ho (right axis). Actual values are taken from [19]. This shows that the semiempirical methods correctly predict the change in enthalpy of formation and change in entropy of the reference molecule set with temperature with an error of less than the average range of measured values.
Data 07 00033 g006
Figure 7. Accuracy of ΔG estimates for the [19] set of compounds. Y-axis: RMS error (kJ/mol). X-axis: temperature (K). Blue line: RMS error in ΔG. Red line: sum of RMS errors in ΔH and T. ΔS, calculated from the same set of molecules according to Equation (5). This shows that the overall error in the prediction of ΔG for the reference dataset is of the same order as the range of experimental values for the enthalpy of formation.
Data 07 00033 g007
Table 1. Sources for enthalpy of formation data.
CodeReferenceNumber of ColumnsNumber of Compounds
AtCT[14,15]1248
Cioslowski[16]11429
Cox[17]71920
JANAF[18,19]1172
Jorgensen[20]153
NIST[21]51889
Pedley[22]12949
Sander[23]1137
Stewart[24]1709
Winget[9]11179
Yaws[25]11441
Add Lit[26,27,28,29,30,31,32,33,34,35,36]5270
Table 2. Data schema for dataset Measured_enthalpy.
ColumnHeaderDescription
1NameChemical name. These are not necessarily IUPAC names
2SMILESStructure of the compound in the SMILES [37] format
3–26Source code as in Table 1Values for enthalpy of formation, in kJ/mol
27FilterFlag for data that showed excessive range of values, and so was excluded from modelling (1 = excluded, blank = retained)
28PM3Predicted values for enthalpy of formation calculated by the QM semiempirical method, in kCal/mol
29PM6
30PM7
31–45C, H, As, B, Br, Cl, F, Ge, I, N, O, P, S, Se, SiAtom counts
Table 3. Sources for entropy of formation data.
CodeReferenceNumber of ColumnsNumber of Compounds
JANAF[19]1171
Mu and He[38]11098
NIST[21]2107
Rihani[39]154
Sander[23]1138
Sarangam[40]179
Yaws[25]1541
Table 4. Data schema for dataset Measured_entropy.
ColumnHeaderDescription
1NameChemical name. These are not necessarily IUPAC names
2SMILESStructure of the compound in the SMILES [37] format
3–10Source code as in Table 3Values for enthalpy of formation, in kJ/mol
11PM3Predicted values for entropy calculated by the QM semiempirical method, in kCal/mol
12PM6
13PM7
14–28C, H, As, B, Br, Cl, F, Ge, I, N, O, P, S, Se, SiAtom counts
Table 5. Data schema for dataset Change_in_DH_and_S_with_temperature.
ColumnHeaderDescription
1SMILESStructure of the compound in the SMILES [37] format
2FormulaEmpirical formula
3NameChemical name. Note these are not necessarily IUPAC names
4–16H−HoValues for ΔH−ΔH° (value of ΔH at the specified temperature minus the value at 298 K) in 100 K steps from 300 K
18–30S−SoValues for S−ΔS° (value of S at the specified temperature minus the value at 298 K)
32–44H−Ho (PM7)Value of H−Ho modelled by PM7 semiempirical QM method
46–58S−So (PM7)Value of S−So modelled by PM7 semiempirical QM method
Table 6. Data schema for dataset All_Small_Molecules (ASM).
ColumnHeaderDescription
1SMILESStructure of the compound in the SMILES [37] format
2DB.NumberUnique identified number for the original ASM database
3M.Wt.Molecular weight (daltons)
4FormulaEmpirical molecular formula
5NameName of substance (NB not necessarily IUPAC name)
6InChI CodeUnique InChI code [45] for this molecule
7Model_EnthalpyModelled values of enthalpy of formation ΔH
8Model + Measured_EnthalpyMeasured enthalpy from the dataset ‘Measured_enthalpy’ where that is available, modelled enthalpy where no measured value is available
9Model_EntropyModelled values of entropy S
10Model + Measured_entropy‘Measured_entropy’ where that is available, modelled entropy where no measured value is available
11–25 C, H, As, B, Br, Cl, F, Ge, I, N, O, P, S, Se, SiElement counts for the molecule
26PM6 EntropyEntropy of molecules as output by PM6, in Cal/mol/K
27PM7 EnthalpyEnthalpy of molecules as output by PM7, in kCal/mol
28–40PM7 H−Ho (nnn K)H−Ho values from PM7 output, for 13 temperatures between 300 K and 1500 K, derived directly from PM7 output, in kCal/mol
41–53PM7 S–So (nnn K)S–So values from PM7 output, for 13 temperatures between 300 K and 1500 K, derived directly from PM7 output, in Cal/mol/K
54–67ΔG (nnn K)Calculated free energy of formation for 13 temperatures between 300 K and 1500 K, derived from modelled enthalpy, entropy, and PM7 outputs, in kJ/mol
Table 7. Data schema for release version of ASM database.
ColumnHeaderDescription
1SMILESStructure of the compound in the SMILES [37] format
2Database numberUnique number for this entry, for future tracking
3M. Wt.Molecular weight (daltons)
4FormulaMolecular formula
5IUPAC chemical nameChemical name consistent with IUPAC convention
6Number of atomsTotal number of atoms
7Non-H atomsNumber of atoms other than hydrogen
8InChI CodeUnique code generated according to the InChI standard [45]
9InChI Key27-character hashed key generated from InChI Code. Note that in this implementation no stereochemistry data is coded
10BPEstimated boiling point at 1 bar
11BP basisBasis for the BP value: Exp = Experimentally derived value, Est = estimated by EPISUITE prediction software [48,49]
12MPMelting point
13MP basisBasis for the MP value: Exp = Experimentally derived value, Est = estimated by EPISUITE prediction software [48,49]
14Produced by lifeFlag for whether this is known to be made by terrestrial life. Y = made by life
15Ref for lifeReference for production by life (example reference for commonly made compounds)
16–30C, H, As, B, Br, Cl, F, Ge, I, N, O, P, S, Se, SiElement counts for the molecule
31–44ΔG (nnn K)Calculated free energy of formation for 13 temperatures between 298 K and 1500 K, derived from modelled enthalpy, entropy, and PM7 outputs, in kJ/mol
Table 8. Accuracy of semiempirical methods on this dataset.
MethodRMS Error in ΔH° (kJ/mol)RMS Error in S° (J/mol/K)
PM342.7229.31
PM642.3021.41
PM737.1727.51
Table 9. Accuracy of different methods on predicting enthalpy in this dataset.
Method ClassMethodSummary DescriptionRMS Error in ΔH° (kJ/mol)r2 in ΔH
Semiempirical QMPM3, PM6, PM7Semiempirical QM methods, implemented in MOPAC37.17–42.720.9864–0.9885
Ab initio QMVarious (see Appendix A)Ab initio absolute energy corrected for energy of component atoms61.71–126.320.4654–0.9524
Bond energy sumsSee Appendix AEnergy of molecule is sum of bond energies114.580.8358
Semiempirical QM + bond countsSee Appendix APM7 corrected by weighted counts of atom–atom bonds29.070.9906
Semiempirical + atom countsModel implemented in this workPM7 corrected by weighted counts of atoms24.120.9947
Publisher’s Note: MDPI stays neutral with regard to jurisdictional claims in published maps and institutional affiliations.

