
Internationalization in the Baltic Regional Accounts: A NUTS 3 Region Dataset


Abstract
:1. Summary
2. Data Description
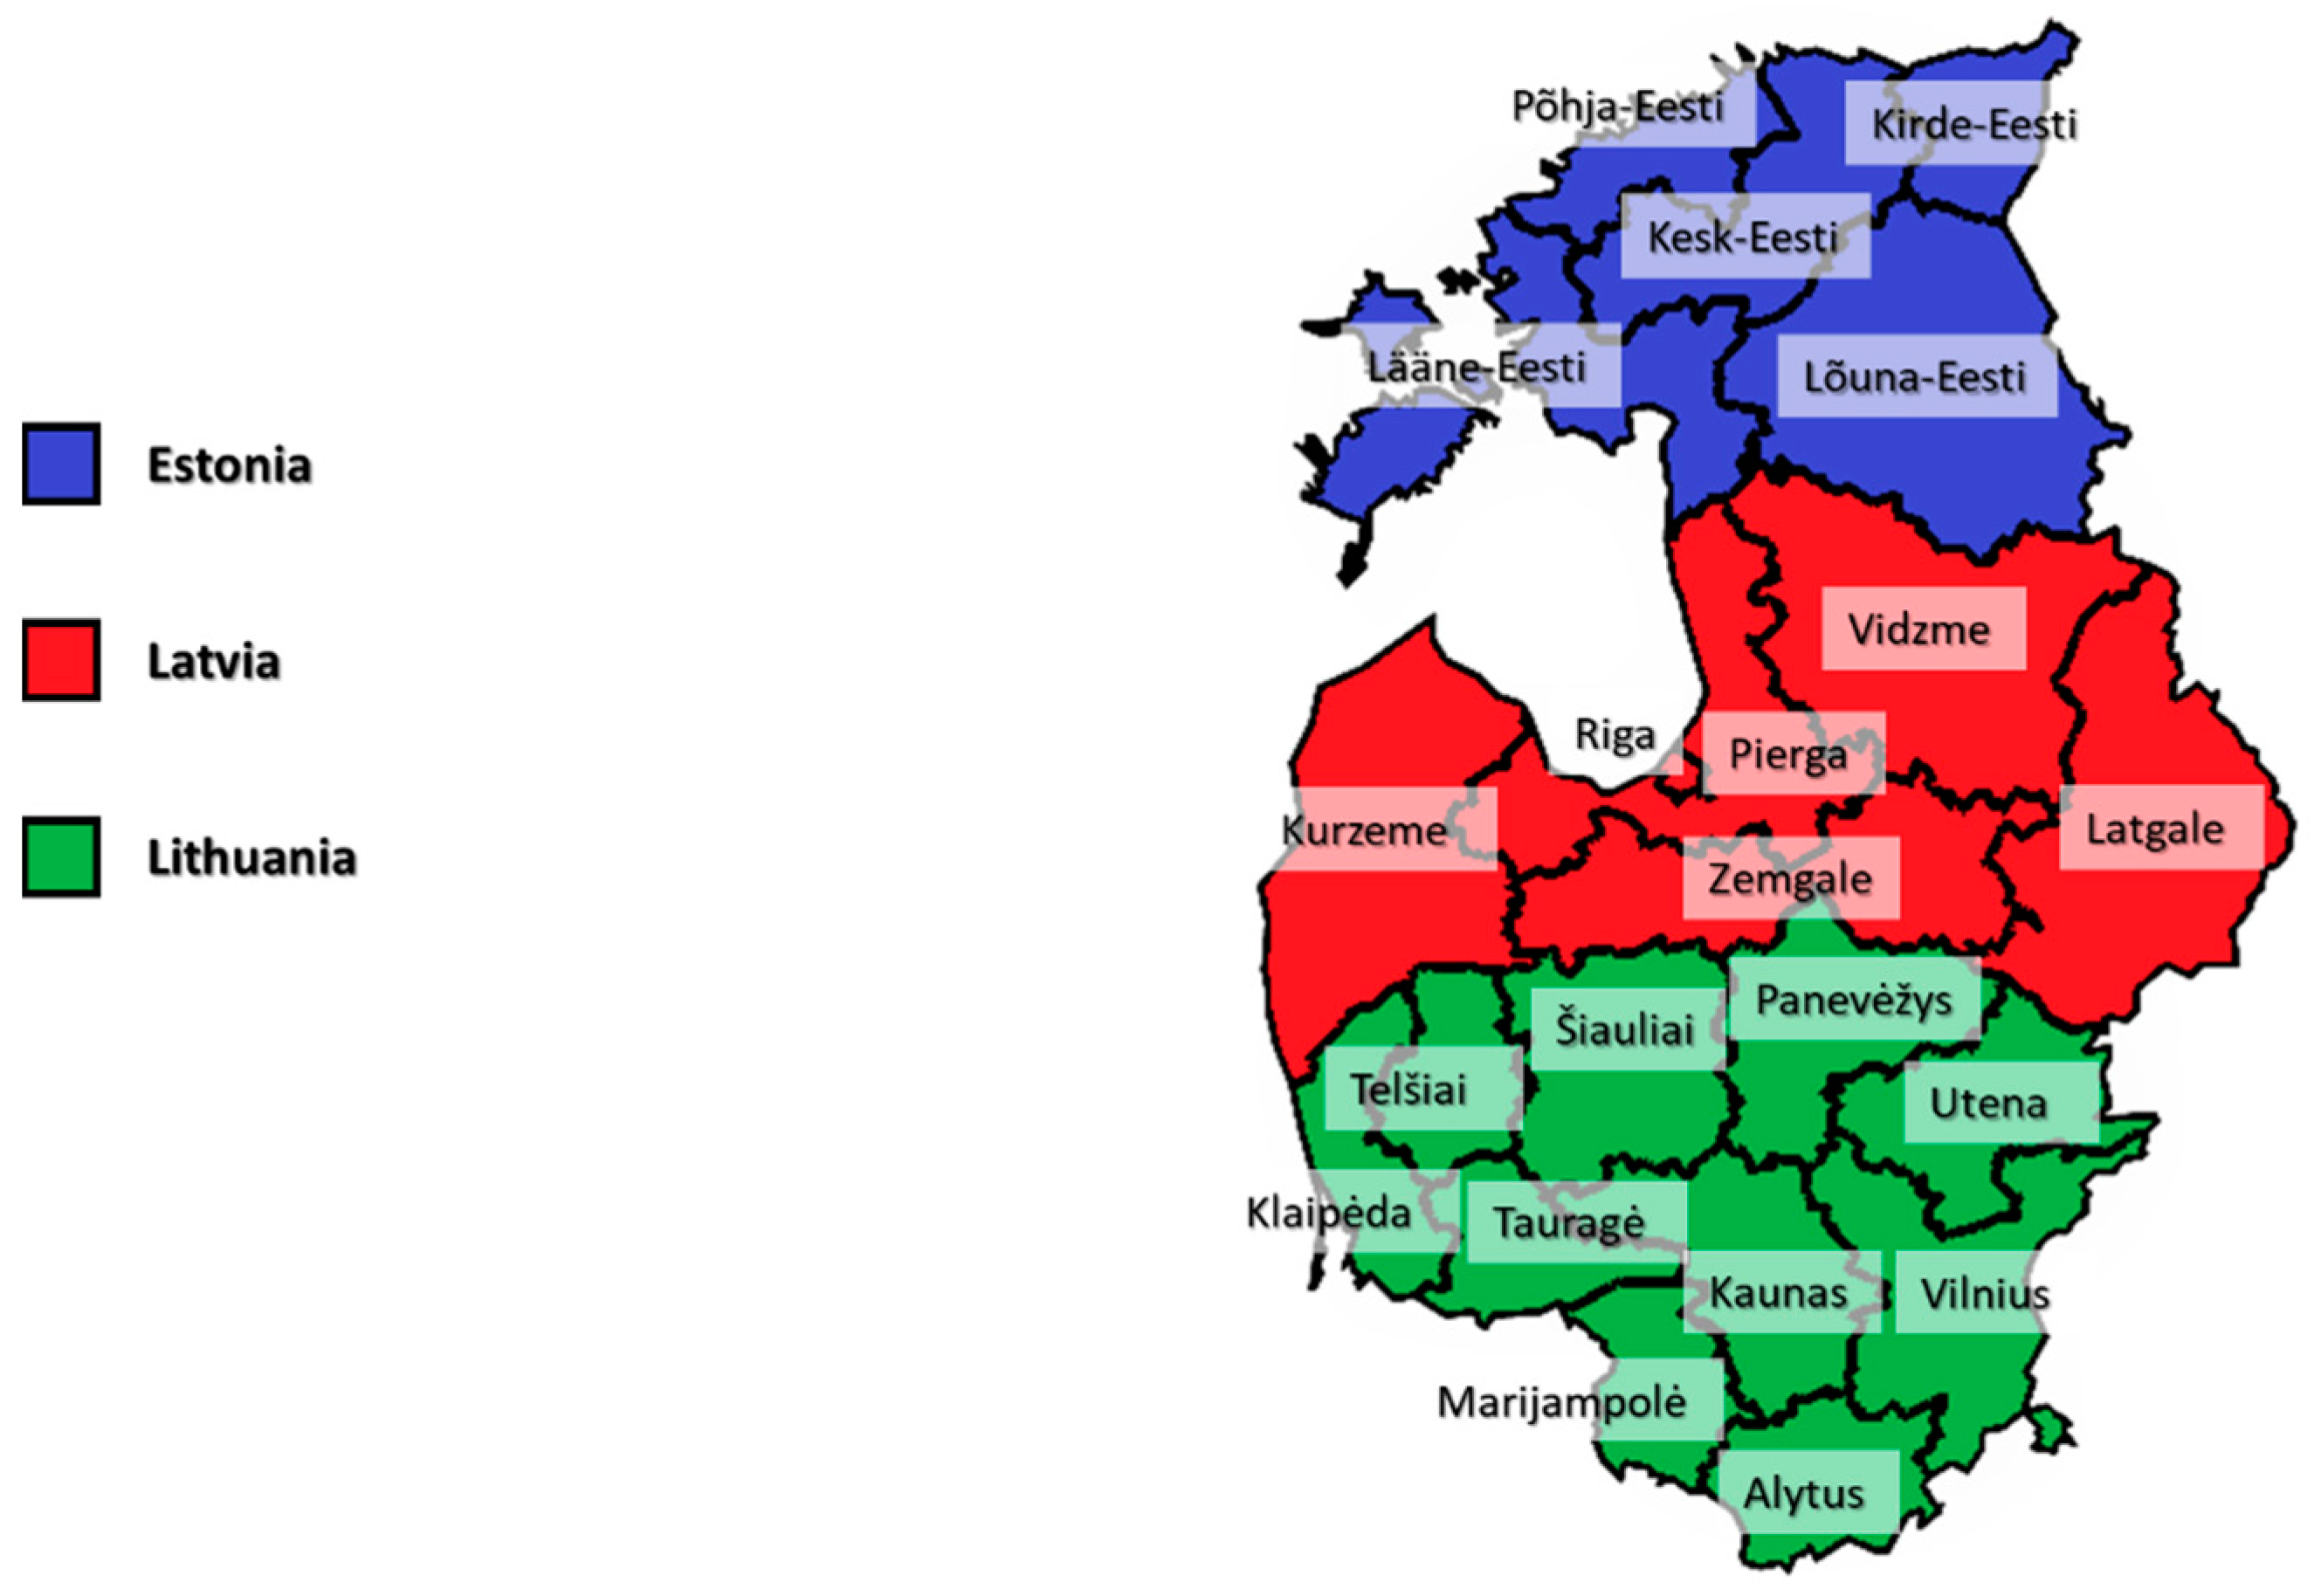
2.1. Classifications for Regions and Industries
2.2. Content of the Dataset
3. Methods
3.1. Collection and Processing of Internationalization Variables
3.2. Collection and Processing of Domestic Variables
4. User Notes
4.1. Relevance of the Dataset
4.2. Summary Statistics
4.3. Internationalization
4.4. Production Economy
4.5. Settlement
4.6. Knowledge Generation
Supplementary Materials
Author Contributions
Funding
Institutional Review Board Statement
Informed Consent Statement
Data Availability Statement
Acknowledgments
Conflicts of Interest
Appendix A. Technical Notes
Appendix A.1. Estimation of Missing Variables
Appendix A.2. Data Cleaning
Appendix B. Handling of Data Gaps Concerning the Domestic Variables

| Variable | Region | Period | Data Collection and Processing |
|---|---|---|---|
| Economic, education, and technology | |||
| Gross value added, trade, transportation and tourism, and information and communication | Latvia | 2000–2004 | For these industries, Eurostat report combined gross value added per either industry or region. As we have regional variables per industry in 2005, we stipulate the figures backward by assuming proportional regional and industry-specific growth rates. |
| Gross value added, finance, real estate, and business services | |||
| Gross value added, public sector and personal services | 2000–2004 | ||
| Gross value added, public sector | 2005–2019 | A minor share of the gross value added in Latvian public services is not distributed across regions. We distribute this gross value added according to the already reported regional shares for value added. | |
| Broadband | Estonia | 2004 | The same regional distribution as in 2005 is assumed, adjusted for regional population growth. |
| 2018–2019 | The same regional distribution as in 2017 is assumed, adjusted for regional population growth. | ||
| Disposable household income | Central and Western Lithuania | 2004–2013 | The same regional distribution as in 2014 is assumed, adjusted for regional population growth. |
| Rate of young people not in employment, education or training | Central and Western Lithuania | 2016 | The same regional distribution as in 2015 is assumed, adjusted for regional population growth in the age group from 18 to 24 years old. |
| Rate of early leavers from education or training | Latvia | 2002–2005 | The same regional distribution as in 2006 is assumed, adjusted for regional population growth in the age group from 18 to 24 years old. |
| Latgale and Vidzeme | 2014 | Only the joint rate is available for these regions in 2014. We interpolate the ratio between the rates linearly based on the observations in 2013 and 2015, adjusted for regional population growth in the age group from 18 to 24 years old. | |
| Demographics | |||
| Population, all age groups | Latvia | 1995 | No age profile is provided for this year, so we have proportionally extrapolated them based on the regional distribution in 1996 and national development from 1995 to 1996. |
| 1996–2000 | Populations per age group within the age groups from 70 and above are only reported at the national level, so we assume that the regional population growth in relative terms for this aggregate age group was the same as at the national level. | ||
| Population, educational profile | Estonia | 2000–2010 | Assumes the same regional distribution in education shares for all regions, adjusted for development at the national level. |
| Latvia | 2000–2001 | Assumes the same regional distribution in education shares for all regions, adjusted for development at the national level. | |
| Domestic migration | Latvia | 2000 to 2010 | The regional ratios between domestic emigration and domestic immigration for these years are assumed to be the same as in 2011. |
| Infant mortality | Estonia | 2002–2007, 2018–2019 | When infant mortality is only reported at the national level, we assume that the regional change is the same at the national level. |
| Latvia | 2002 to 2011 | ||
| Transportation mortality | Estonia | 2005–2007, 2018 | When transportation mortality is only reported at the national level, we assume that the regional change is the same at the national level. |
| Intentional homicide | Estonia | 2005 | The same regional distribution as in 2006 is assumed. |
| Latvia | 2011 | The regional distribution is interpolated based on 2010 and 2012. | |
| Panevėžys | 2005–2017 | Assumed to be of the same magnitude per inhabitant as in the rest of the country. | |
| Active physicians | Panevėžys | 2017 | Assumed to have the same growth in active physicians per inhabitant as the rest of the country. |
| Hospital beds | Central and Western Lithuania | 2005–2006 | All subregions are assumed to have the same growth in hospital beds as Central and Western Lithuania. |
| Employment | |||
| Employment, employed and self-employed, trade, transportation and tourism, and information and communication | Lääne-Eesti, Kesk-Eesti and Kirde-Eesti | 2000–2018 | For these regions and industries, Eurostat reports combined employment per either industry or region. To obtain regional industry figures, we assume proportional splits. |
| Latvia | 2000–2006 | For these industries, Eurostat reports combined gross value added per either industry or region. As we have regional variables per industry in 2005, we stipulate the figures backward by assuming proportional regional and industry-specific growth rates. | |
| Employment, employed and self-employed, finance, real estate, and business services | |||
| Employment, employed and self-employed, public sector and personal services | 2000–2006 | ||
| Employment, employed and self-employed, public sector | 2007–2019 | A minor share of the employment in Latvian public services is not distributed across regions. We distribute this employment added according to the already reported regional employment shares. | |
| Employment, 15 to 24 and 25 to 64 years old | Panevežys | 1998–1999 | The same labor force development as in the rest of the country is assumed, adjusted for regional population growth in the respective age group. |
| Male and female employment and unemployment, 15 to 64 years old | Estonia | 2018–2019 | Extrapolated proportionally to match the regional distribution of total employment and aggregate gender employment in the whole country. |
| Employment, more than 65 years old | Lithuania except Panevėžys | 1999–2009 | We assume the same regional employment distribution of employment as for the distribution for the total workforce in the respective age group. |
| Panevėžys | As labor market participation figures are unavailable for Panevėžys in exercise, we assume that the employment over 65 years old per population between 65 and 69 years old for this region, as for the rest of the country. | ||
| Lithuania | 2010–2012 | We assume the same regional distribution as in 2009, adjusted for regional population growth in the age group from 65 to 69 years old. | |
| Central and Western Lithuania | 2013–2019 | We assume the same regional distribution as in 2012, adjusted for regional population growth in the age group from 65 to 69 years old. | |
| Employment, 15–24 and 25–66 years old | Estonia | 2018 and 2019 | The age distribution in each country is extrapolated proportionally to match the regional distribution of total employment and aggregate age group distribution in the whole country |
| Unemployment | |||
| Unemployment, female and male | Kurzeme, Latgale, Pieriga, Vidzeme, Zemgale | 2001 | The same regional distribution key for both genders is assumed before adjusting for the joint differences in male and female unemployment. |
| Short-term and long-term unemployment | Panevežys | 1998–1999 | We assume the same development in the relationship between short-term and long-term unemployment as in the rest of the country. |
| Pieriga, Vidzeme and Zemgale | 2001 | The regional split is interpolated based on 2000 and 2002 figures, adjusted for the development in overall regional unemployment. | |
| Vidzeme and Zemgale | 2006 | The regional split is interpolated based on 2005 and 2007 figures, adjusted for the development in overall regional unemployment. | |
| Estonia | 2018, 2019 | We assume the same development in the relationship between short-term and long-term unemployment as at the national level. | |
| Unemployment, 15–24 and 25–66 | Estonia | 2018 and 2019 | The age distribution in each country is extrapolated proportionally to match the regional distribution of total employment and aggregate age group distribution in the whole country. |
| Unemployment, 15 to 24 and 25 to 66 years old | Panevežys | 1998–1999 | The same labor force development as in the rest of the country is assumed, adjusted for regional population growth in the respective age group. |
| Latvia | 2001 | Regional development is interpolated proportionally based on 2000 and 2002. | |
| Kurzeme, Vidzeme, Pieriga and Zemgale | 2003 | Regional development is interpolated proportionally based on 2002 and 2004. | |
| 2019 | Regional development is extrapolated proportionally based on 2018. | ||
| Vidzeme and Zemgale | 2005 | Regional development is interpolated proportionally based on 2005 and 2006. | |
| Kurzeme, Vidzeme and Zemgale | 2018 | The age group distributions are extrapolated proportionally to match the regional distribution of total employment and aggregate age group distribution in all regions. | |
| Unemployment, female and male | Kurzeme, Latgale, Pieriga, Vidzeme, Zemgale | 2001 | The same regional distribution key for both genders is assumed before adjusting for the joint differences in male and female unemployment. |
| Short-term and long-term unemployment | Panevežys | 1998–1999 | We assume the same development in the relationship between short-term and long-term unemployment as in the rest of the country. |
| Pieriga, Vidzeme and Zemgale | 2001 | The regional split is interpolated based on 2000 and 2002 figures, adjusted for the development in overall regional unemployment. | |
| Vidzeme and Zemgale | 2006 | The regional split is interpolated based on 2005 and 2007 figures, adjusted for the development in overall regional unemployment. | |
References
- Umiński, S.; Nazarczuk, J.M. Regions in International Trade; De Gruyter: Berlin, Germany, 2021; p. 250. Available online: https://library.oapen.org/handle/20.500.12657/48432 (accessed on 12 November 2023).
- Aghion, P.; Howitt, P.W. The Economics of Growth; MIT Press: Cambridge, MA, USA, 2008; Available online: https://discovery.ucl.ac.uk/id/eprint/17829/1/17829.pdf (accessed on 12 November 2023).
- Romer, D. Advanced Macroeconomics, 4th ed.; McGraw-Hill: New York, NY, USA, 2012. [Google Scholar]
- Azman-Saini, W.N.W.; Baharumshah, A.Z.; Law, S.H. Foreign direct investment, economic freedom and economic growth: International evidence. Econ. Model. 2010, 27, 1079–1089. [Google Scholar] [CrossRef]
- Juliussen, S.S.; Fløysand, A. Foreign direct investment, local conditions and development: Crossing from dependency to progress in peripheral Kuressaare, Estonia. Nor. Geogr. Tidsskr.—Nor. J. Geogr. 2010, 64, 142–151. [Google Scholar] [CrossRef]
- Iamsiraroj, S. The foreign direct investment–economic growth nexus. Int. Rev. Econ. Financ. 2016, 42, 116–133. [Google Scholar] [CrossRef]
- Singh, T. Does international trade cause economic growth? A survey. World Econ. 2010, 33, 1517–1564. [Google Scholar] [CrossRef]
- Wagner, J. International trade and firm performance: A survey of empirical studies since 2006. Rev. World Econ. 2012, 148, 235–267. [Google Scholar] [CrossRef]
- Brunow, S.; Nijkamp, P.; Poot, J. The impact of international migration on economic growth in the global economy. In Handbook of the Economics of International Migration; North-Holland: Amsterdam, The Netherlands, 2015; Volume 1, pp. 1027–1075. [Google Scholar] [CrossRef]
- Bove, V.; Elia, L. Migration, diversity, and economic growth. World Dev. 2017, 89, 227–239. [Google Scholar] [CrossRef]
- Le Gallo, J.; Dall’Erba, S. Evaluating the temporal and spatial heterogeneity of the European convergence process, 1980–1999. J. Reg. Sci. 2006, 46, 269–288. [Google Scholar] [CrossRef]
- Cuaresma, J.C.; Doppelhofer, G.; Feldkircher, M. The determinants of economic growth in European regions. Reg. Stud. 2014, 48, 44–67. [Google Scholar] [CrossRef]
- Burinskas, A.; Holmen, R.; Tvaronavičienė, M.; Šimelytė, A.; Razminienė, K. FDI, technology & knowledge transfer from Nordic to Baltic countries. Insights Reg. Dev. 2021, 3, 31–55. [Google Scholar] [CrossRef]
- Eurostat. Manual on regional accounts methods. In Eurostat Manuals and Guidelines, 2013th ed.; European Commission: Brussels, Belgium, 2013. [Google Scholar] [CrossRef]
- Lequiller, F.; Blades, D. Understanding National Accounts, 2nd ed.; OECD Publishing: Paris, France, 2014. [Google Scholar] [CrossRef]
- Fadejeva, L.; Melihovs, A. The Baltic states and Europe: Common factors of economic activity. Balt. J. Econ. 2008, 8, 75–96. [Google Scholar] [CrossRef]
- Staehr, K. Economic Growth and Convergence in the Baltic States: Caught in a Middle-Income Trap? Intereconomics 2015, 50, 274–280. [Google Scholar] [CrossRef]
- Hazans, M.; Philips, K. The post-enlargement migration experience in the Baltic labor markets. In EU Labor Markets after Post-Enlargement Migration; Springer: Berlin/Heidelberg, Germany, 2009; pp. 255–304. [Google Scholar] [CrossRef]
- Hazans, M. Selectivity of migrants from Baltic countries before and after enlargement and responses to the crisis. In EU Labour Migration in Troubled Times: Skills Mismatch, Return and Policy Responses; Ashgate: Aldershot, UK, 2012; pp. 169–207. Available online: https://www.taylorfrancis.com/chapters/edit/10.4324/9781315580708-12/selectivity-migrants-baltic-countries-enlargement-responses-crisis (accessed on 12 November 2023).
- Masso, J.; Roosaar, L.; Karma, K. Migration and Industrial Relations in Estonia—Country Report for the BARMIG Project, Tartu. 2021. Available online: https://phavi.umcs.pl/at/attachments/2022/0119/140607-barmig-estonia-national-report-31122021.pdf (accessed on 12 November 2023).
- Varblane, U.; Reino, A.; Reiljan, E.; Juriado, R. Foreign Direct Investments in the Estonian Economy; Tartu University Press: Tartu, Estonia, 2001; Available online: https://ideas.repec.org/b/mtk/febook/09.html (accessed on 12 November 2023).
- Hunya, G. FDI in small accession countries: The Baltic states. EIB Pap. 2004, 9, 92–115. Available online: https://www.econstor.eu/handle/10419/44840 (accessed on 12 November 2023).
- Masso, J.; Roolaht, T.; Varblane, U. Foreign direct investment and innovation in Estonia. Balt. J. Manag. 2013, 8, 231–248. [Google Scholar] [CrossRef]
- Tvaronavičienė, M.; Burinskas, A. Review of studies on FDI: The case of Baltic States. J. Int. Stud. 2022, 15, 210–225. [Google Scholar] [CrossRef]
- Varblane, U.; Reino, A.; Reiljan, E.; Juriado, R. Estonian Outward Foreign Direct Investments; University of Tartu Economics & Business Administration Working Paper No. 9; Tartu University Press: Tartu, Estonia, 2001. [Google Scholar] [CrossRef]
- Masso, J.; Varblane, U.; Vahter, P. The Impact of Outward FDI on Home-Country Employment in a Low-Cost Transition Economy; The William Davidson Institute Working Paper Number 873; The William Davidson Institute: Ann Arbor, MI, USA, 2007; Available online: https://deepblue.lib.umich.edu/bitstream/handle/2027.42/57253/wp873%20.pdf?sequence (accessed on 12 November 2023).
- Falkowski, K. Competitiveness of the Baltic States in international high-technology goods trade. Comp. Econ. Res. Cent. East. Eur. 2018, 21, 25–43. [Google Scholar] [CrossRef]
- Benkovskis, K.; Masso, J.; Tkacevs, O.; Vahter, P.; Yashiro, N. Export and productivity in global value chains: Comparative evidence from Latvia and Estonia. Rev. World Econ. 2020, 156, 557–577. [Google Scholar] [CrossRef]
- Sawers, L. Inequality and the transition: Regional development in Lithuania. Balt. J. Econ. 2006, 6, 37–51. [Google Scholar] [CrossRef]
- Harter, M.; Jaakson, R. Economic success in Estonia: The centre versus periphery pattern of regional inequality. Communist Econ. Econ. Transform. 1997, 9, 469–490. [Google Scholar] [CrossRef]
- Lang, T.; Burneika, D.; Noorkõiv, R.; Plüschke-Altof, B.; Pociūtė-Sereikienė, G.; Sechi, G. Socio-spatial polarisation and policy response: Perspectives for regional development in the Baltic States. Eur. Urban Reg. Stud. 2022, 29, 21–44. [Google Scholar] [CrossRef]
- Moran, P.A. Notes on continuous stochastic phenomena. Biometrika 1950, 37, 17–23. [Google Scholar] [CrossRef]
- Guimaraes, P.; Figueiredo, O.; Woodward, D. Agglomeration and the location of foreign direct investment in Portugal. J. Urban Econ. 2000, 47, 115–135. [Google Scholar] [CrossRef]
- Ottaviano, G.I.; Tabuchi, T.; Thisse, J.F. Agglomeration and trade revisited. Int. Econ. Rev. 2002, 43, 409–435. Available online: https://www.jstor.org/stable/826994 (accessed on 12 November 2023). [CrossRef]
- Ottaviano, G.I. Agglomeration, trade and selection. Reg. Sci. Urban Econ. 2012, 42, 987–997. [Google Scholar] [CrossRef]
- Skeldon, R. International Migration, Internal Migration, Mobility and Urbanization: Towards More Integrated Approaches; United Nations: New York, NY, USA, 2018. [Google Scholar] [CrossRef]
- Hazans, M. Migration experience of the Baltic countries in the context of economic crisis. In Labor Migration, EU Enlargement, and the Great Recession; Springer: Berlin/Heidelberg, Germany, 2016; pp. 297–344. [Google Scholar] [CrossRef]
- Mulliqi, A.; Adnett, N.; Hisarciklilar, M. Human capital and exports: A micro-level analysis of transition countries. J. Int. Trade Econ. Dev. 2019, 28, 775–800. [Google Scholar] [CrossRef]


| Industry Name | Industry Codes |
|---|---|
| Primary industries | NACE 1 to 3 |
| Manufacturing | NACE 10 to 33 |
| Other resource industries | NACE 5 to 9 and NACE 35 to 39 |
| Construction | NACE 41 to 43 |
| Trade, transportation and tourism | NACE 45 to 56 |
| Information and communication | NACE 58 to 63 |
| Finance | NACE 64 to 66 |
| Real estate | NACE 68 |
| Knowledge-intensive business services and business support | NACE 69 to 74 |
| Public services | NACE 84 to 89 |
| Household and non-profit services | NACE 90 to 99 |
| Variable | Measurement |
|---|---|
| International emigration and immigration in terms of people migrating | Measured in number of people from 2006 to 2019 |
| Exports and imports in current and fixed 2010 prices, deflated with national price indexes for exports and imports, respectively | Measured in Million euros from 2007 to 2019 |
| Outgoing foreign direct investments in equity stocks, including reinvestments of earnings, measured in current prices and fixed 2010 prices, deflated with price indexes for the domestic product or total end use at the national or European Union level | Measured in Million euros from 2006 to 2019 |
| Incoming foreign direct investments in equity stocks, including reinvestments of earnings in current prices and fixed 2010 prices, deflated with price indexes for either the domestic product or total end use at the national or European Union level | Measured in Million euros from 2007 to 2019 |
| Gross value added in basic prices deflators with 2010 as the base year, measured for 11 industries and at the national level | Measured in the percentage of 2010 prices from 2000 to 2018 at regional and industry levels, and from 2000 to 2019 at the national level |
| Gross value added in market prices deflator at the national level with 2010 as the base year | Measured in the percentage of 2010 prices from 2000 to 2019 |
| Fixed capital deflator with 2010 as the base year | |
| End-use deflators with 2010 as the base year, including deflators for total end use (sum of consumption, exports, and gross investments in inventories and fixed capital), and total and household consumption | |
| Trade deflators for exports and imports with 2010 as the base year, measured at national and EU-27 levels | |
| Total income deflator with 2010 as the base year | Measured in the percentage of average EU-27-2020 prices from 1995 to 2020 |
| Purchasing power parity for production and consumption with EU-27 of 2020 as a basis | Measured in purchasing power parity of EU-27 in 2020 |
| Exchange rate between Euro and US Dollar | Measured in Euros per US Dollars from 2000 to 2020. |
| Gross value added measured at basic prices, reported for 11 industries in current prices and fixed 2010 prices | Measured in Million euros from 2000 to 2019 |
| Gross value added measured at market prices, reported in current prices | |
| Net product taxes, reported in current prices | |
| Employment mid-year reported for all ages with further split into employment relationship (i.e., employees and self-employed) and 11 industries, 15 to 64 years old divided into genders, 15 to 24 years old, 25 to 64 years old, and more than 65 years old | Measured in the number of people from 1999 to 2019 in general and 2000 to 2019 for figures concerning industry affiliation or employment relationship |
| Unemployment mid-year, reported for either gender or the age groups 15 to 24 years old and 25 to 64 years old, with further disaggregation into short-term and long-term unemployed people (i.e., unemployed for less and more than a year, respectively) | Measured in the number of people from 1999 to 2019 |
| Rate of young people not in employment, education or training, age 18 to 24 years old | Measured from 2005 to 2017 |
| Rate of early leavers from education and training, age 18 to 24 years old | Measured in population share from 2002 to 2017 |
| Gross fixed capital stock at the end of each year, reported in current prices and fixed 2010 prices | Measured in Million euros from 2000 to 2019 |
| Patent Cooperation Treaty patent applications are fractional counted by residence, total co-count by workplace and fractional count by workplace, where the latter count is further disaggregated into biotechnical, ICT-related, medical, nano-scientific, and pharmaceutical patent applications. | Measured in the number of property rights from 1991 to 2015 |
| Community designs, applications, activated and registered unitary industrial design rights | Measured in the number of property rights from 2003 to 2016 |
| European Union trademarks, applications and registered trademarks | Measured in the number of property rights from 1996 to 2016 |
| Latent broadband access coverage for households, defined as the portion that subscribes to an internet connection of at least one Megabit per second | Measured in the share of households from 2004 to 2019 |
| Population at the beginning of the year, divided into gender and five-year age groups from 0 to 4 years to 80 years and above, as well as population between 25 and 64 years with primary and lower secondary education, higher secondary and vocational education, and tertiary education | Measured in the number of people from 1995 to 2020 in general with a shorter time span of 2000 to 2018, when the population is distributed across education types |
| Natural population growth, divided into births and deaths | Measured in the number of people from 1995 to 2020 |
| Domestic migration, disaggregated into domestic immigration and domestic emigration | Measured in the number of people from 2006 to 2019 |
| Life expectancy at birth | Measured in the number of years from 1995 to 2019 |
| Infant mortality, measured as deaths in the first year of life | Measured in the number of fatalities from 2002 to 2019 |
| Transportation-related mortality, measured as deaths in traffic | Measured in the number of fatalities from 2005 to 2018 |
| Intentional homicides at year of death | Measured in the number of units from 2005 to 2017 |
| Human development index, divided into subindexes for education, health, and income | Measured in the percentage of hypothetical optimal score from 1995 to 2019 |
| Years of schooling in mean for completed education and in expectation upon entering education. | Measured in the number of years score from 1995 to 2019 |
| Disposable household income measured in current prices, fixed 2010 prices, and purchasing power parities with European Union-27-2020 as a basis | Measured in Million euros from 2004 to 2018. |
| Gross national income in current prices, fixed 2010 prices and purchasing power parities with European Union-27-2020 as a basis | Measured in Million euros from 2000 to 2019 |
| Active physicians, including practicing physicians and other physicians for whom the execution of their job requires medical education | Measured in the number of units from 2005 to 2017 |
| Hospital beds, including acute care beds, rehabilitative care beds, long-term care beds, and other beds in hospitals | |
| Area measured in square kilometers, divided by land area and freshwater area | Measured in square kilometers from 1991 to 2020 |
| Main rooms in dwellings, including bedrooms and living rooms | Measured in the number of rooms from 2005 to 2017 |
| Degree days in terms of cooling degree days and heating degree days | Measured in index points from 1995 to 2020 |
| Country | Data Collection and Processing |
|---|---|
| International emigration and immigration | |
| Measured in number of people from 2006 to 2019 | |
| Estonia | International emigration and immigration figures at the regional level are obtained from Statistics Estonia. Unexplained population growth is ascribed to international immigration and emigration, when it is positive and negative, respectively. We make an exception for a data break between 2014 and 2015, where many people are moved in the registers from one region to another. We approximate this error by the national average of the positive and negative residuals in absolute value multiplied by the regional share of the residual with the same sign. |
| Latvia | International emigration and immigration figures at the regional level are obtained from the Official Statistics of Latvia for 2010 to 2018. For 2007 and 2010 only, we assume that the regional shares of both emigration and immigration correspond to the absolute regional value of population change divided by the total value of population change. Unexplained population growth is ascribed to international immigration when it is positive and international emigration when it is negative. |
| Lithuania | International emigration and immigration figures at the regional level are obtained from Statistics Lithuania. We ascribe unexplained population growth to international immigration or emigration, depending on whether the sign is positive or negative, respectively. |
| Exports and imports | |
| Current and fixed 2010 prices, deflated with national price indexes for exports and imports, respectively. Measured in Million euros from 2007 to 2019 | |
| Estonia | We approximate the regional distribution of exports and imports with trade figures from the Statistic Estonia firm-market-product level commodity trade data based on customs statistics and firm-level services trade data from the Bank of Estonia. Regional trade is scaled annually to ensure that the aggregate trade figures match the national figures reported by the WTO for each year. |
| Latvia | We approximate the regional distribution of commodity trade with trade figures in firm data from the Central Statistical Bureau of Latvia’s ‘Complete report on activities’. For service trade, we assume that the distribution of regional trade is the same on an annual basis per gross value added within the relevant industries, recognized as construction and service industries, excluding wholesale and retail trade. Service trade figures are not available at the micro level. We obtain each industry’s service trade at the national level from OECD’s annual input–output matrixes for transactions between Latvian industries and sectors, enabling us to estimate regional figures. Commodity trade and service trade are scaled separately on an annual basis to match the aggregate trade figures of the WTO, before being aggregated. |
| Lithuania | Regional direct export and national re-export are collected from Statistics Lithuania. To obtain total export figures for each region, we assume that the re-export follows the same regional distribution as the direct export. However, Statistics Lithuania only reports national import figures. To overcome this challenge, we assume that the distribution of regional imports is the same per gross value added within each industry and year. We obtain each industry’s import at the national level from OECD’s annual input–output matrixes for transactions between Lithuanian industries and sectors, enabling us to estimate regional imports. Regional trade is scaled to match the aggregate trade figures reported by the WTO annually. |
| Incoming foreign direct investments | |
| Equity stocks, including reinvestments of earnings in current prices and fixed 2010 prices, deflated with price indexes for either the domestic product or total end use at the national or European Union level. Measured in Million euros from 2007 to 2019 | |
| Estonia | We approximate the regional distribution of incoming FDI with FDI figures in the enterprise register data. The regional incoming FDIs are scaled annually such that the aggregate incoming foreign direct investments are equal to the national figures reported by the IMF from 2009. The IMF series are extrapolated backwards to 2007 based on the developments in similar series from OECD. |
| Latvia | We approximate the regional distribution of incoming FDI with the help of the Central Statistical Bureau of Latvia’s ‘complete report on activities’ and firm financial data provided by the State Revenue Service of the Republic of Latvia, proxying the weights by the product between equity and a dummy indicating incoming FDI. The regional incoming FDIs are scaled annually such that aggregate exports are equal to the national figures reported by IMF from 2009. The IMF series are extrapolated backwards to 2007 based on the developments in similar series from OECD. |
| Lithuania | Regional figures for incoming FDI are obtained from Statistics Lithuania. The FDI figures are scaled, such that the aggregate figures match the figures reported by IMF from 2009. The IMF series are extrapolated backwards to 2007 based on the developments in similar series from OECD. |
| Outgoing foreign direct investments | |
| Equity stocks, including reinvestments of earnings in current prices and fixed 2010 prices, deflated with price indexes for the domestic product or total end use at the national or European Union level. Measured in Million euros from 2006 to 2019 | |
| Estonia | We approximate the regional distribution of outgoing FDI with the help of enterprise register data and the Bank of Estonia’s firm-level outward FDI data, proxying the weights by the product between total assets and a dummy indicating outgoing FDI. The outgoing regional FDIs are scaled annually such that aggregate outgoing FDI is equal to the national figures reported by IMF from 2009. The IMF series are extrapolated backwards to 2007 based on the developments in similar series from OECD. |
| Latvia | We approximate the regional distribution of outgoing FDI with the help of the Central Statistical Bureau of Latvia’s ‘complete report on activities and firm financial data provided by the State Revenue Service of the Republic of Latvia, applying two equally weighted proxies for the magnitude of each investment. These are total assets in subsidiaries and the product between total assets in subsidiaries and a dummy indicating outgoing FDI. The regional outgoing FDIs are scaled annually such that aggregate figures are equal to the national figures reported by the IMF from 2009. The IMF series are extrapolated backwards to 2007 based on the developments in similar series from OECD. |
| Lithuania | Statistics Lithuania only report national outgoing FDI figures. To overcome this challenge, we assume that the distribution of regional outgoing FDI is the same per gross value added within each industry and year. We obtain each industry’s outgoing FDI at the national level from OECD’s FDI statistics, enabling us to estimate regional imports. At last, the FDI figures are scaled, such that the aggregate figures match the figures reported by IMF in 2009. The IMF series are extrapolated backwards to 2007 based on the developments in similar series from OECD. |
| Fixed Capital Stock | |
|---|---|
| Gross stocks at the end of each year, reported in current prices and fixed 2010 prices. Measured in Million euros from 2000 to 2019. | |
| Estonia | The gross fixed capital stocks in the current price are estimated from 2007 to 2019 as the sum of tangible and intangible fixed capital stock based on enterprise register data. We extend the time series further backwards to 2000 based on data from Eurostat, assuming that the development in fixed capital stock corresponds to the development in the quasi-stocks of fixed capital. These quasi-stocks are estimated assuming that the fixed capital per gross value added in current prices is the same by industry across the country for each of the 11 industries in our study. Figures are harmonized with the aggregate fixed capital stock figures at Eurostat. We calculate the gross fixed capital stock in fixed prices as the ratio between the fixed capital in current prices and the aggregate fixed capital deflator. |
| Latvia | The gross fixed capital stocks in the current price are estimated from 2007 to 2019 as the sum of tangible and intangible fixed capital stock based on data from the State Revenue Service of the Republic of Latvia. We extend the time series further backwards to 2000 based on data from Eurostat, assuming that the development in fixed capital stock corresponds to the development in quasi-stocks of fixed capital. These quasi-stocks are estimated assuming that the fixed capital per gross value added in current prices is the same by industry across the country for each of the 11 industries in our study. Figures are harmonized with the aggregate fixed capital stock figures at Eurostat. We calculate the gross fixed capital stock in fixed prices as the ratio between the fixed capital in current prices and the aggregate fixed capital deflator. |
| Lithuania | We estimate the regional distribution of fixed capital stock in Lithuania by applying and then taking the average of two alternative approaches from 2007 to 2019. First, we collect figures for gross investments in fixed capital at the regional level from Statistics Lithuania with data for three years before the initial year of our time series. We convert the gross investment figures to fixed price figures with the help of the fixed capital deflator. Next, we calculate quasi-stocks for fixed capital by summing the depreciated gross investments and applying linear depreciation with a rate of 25 percent. We let the fixed capital stocks reported at Eurostat correspond to the national aggregates and exploit the quasi stocks to proxy the regional distribution of fixed capital. Second, we collect the fixed capital stocks in current prices for the 11 industries in our study from Eurostat and distribute them across regions, assuming that the fixed capital per gross value added in current prices is the same by industry across the country. In the period from 2000 to 2006, we only apply the latter-mentioned approach, as regional investment series are unavailable. Figures are harmonized with the aggregate fixed capital stock figures at Eurostat. Volume figures are obtained by dividing the fixed capital stock in current prices by the fixed capital deflator. |
| Variable | Data Collection and Processing |
|---|---|
| Labor participation | |
| Employment mid-year reported for all ages with further split into employment relationship (i.e., employees and self-employed people) and 11 industries, 15 to 64 years old divided into genders, 15 to 24 years old, 25 to 64 years old, and more than 65 years old | Overall figures, as well as figures for industry affiliation and employment relationship, are obtained from Eurostat’s regional statistics. In addition, the age distribution is obtained from OECD’s regional statistics |
| Unemployment mid-year, reported for either gender or the age groups 15 to 24 years old and 25 to 64 years old, with further disaggregation into short-term and long-term unemployed people (i.e., unemployed for less and more than a year, respectively) | Obtained from OECD’s regional statistics |
| Rate of young people not in employment, education or training, age 18 to 24 years old | |
| Rate of early leavers from education and training, age 18 to 24 years old | |
| Price indexes | |
| Gross value added in basic prices deflators with 2010 as the base year, measured for 11 industries and at the national level | Industry-specific gross value added deflators are collected from the national accounts at Eurostat. Regional gross value added deflators are estimated as the ratios between current and fixed price figures at the regional level. In addition, deflated figures based on national deflators are included. |
| Gross value added in market prices deflator at the national level with 2010 as the base year | Derived at the aggregate level from the national accounts at Eurostat |
| Fixed capital deflator with 2010 as the base year, reflecting the price development in gross investments | |
| End use deflators with 2010 as the base year, including deflators for total end use (sum of consumption, exports, and gross investments in inventories and fixed capital), and total and household consumption. | |
| Trade deflators for exports and imports with 2010 as the base year, measured at national and EU-27 levels | |
| Total income deflator with 2010 as the base year | Derived at the aggregate level from the national accounts at OECD |
| Purchasing power parity for production and consumption with EU-27 of 2020 as a basis | Derived at the aggregate level from the national accounts at Eurostat. |
| Exchange rate between Euro and US Dollar | Obtained from Norges Bank |
| Value added | |
| Gross value added measured at basic prices, reported for 11 industries in current prices and fixed 2010 prices | Obtained from Eurostat’s regional statistics. The fixed price figures are derived with the help of industry-specific gross value added deflators |
| Gross value added measured at market prices, reported in current prices | Obtained from Eurostat’s regional statistics |
| Net product taxes, reported in current prices | Calculated as the difference between gross value added in the market and basic prices. Measured in Million euros from 2000 to 2019 |
| Information generation and sharing | |
| Patent Cooperation Treaty patents applications are fractional counted by residence, total co-count by workplace, and fractional count by workplace, where the latter count is further disaggregated into biotechnical, ICT-related, medical, nano-scientific, and pharmaceutical patent applications | Obtained from OECD’s Regional Database |
| Community designs, applications, activated and registered unitary industrial design rights | Obtained from Eurostat’s regional statistics. Community design figures reported for national ‘extra regions’ in the regional statistics are regions that are distributed over each country’s regions according to their annual share of the respective national patent variable |
| European Union trademarks, applications and registered trademarks | Obtained from Eurostat’s regional statistics. Trademark figures reported for national extra regions are distributed over each country’s regions according to their annual share of the respective national trademark variable |
| Latent broadband access coverage for households, defined as the possibility to subscribe to an internet connection of at least one Megabit per second | Obtained from OECD’s Regional Database. The broadband coverage data builds on surveys, such that the coverage seemingly, but erroneously, in some instances, could decline in the raw survey data. In case of an extreme drop in coverage for a region below the coverage in two or more preceding years, we interpolate the concerned extreme observations linearly. In case of a modest drop in coverage for a region that concerns a sequence of years, we assume that the broadband coverage corresponds to the average of the concerned observations |
| Demographics | |
| Population at the beginning of year, divided into gender and five-year age groups from 0 to 4 years to 80 years and above, as well as the population between 25 and 64 years with primary and lower secondary education, higher secondary and vocational education, and tertiary education | Obtained from OECD’s Regional Database. In the case of Estonia, a data break occurred between 2014 and 2015, where many people were moved in the registers from one region to another. Hence, we removed this error term from the total population figures for the Estonian region in all earlier years and adjusted the underlying population figures proportionally. Note that this error is approximated in relation to the calculation of international migration figures. |
| Natural population growth, divided into births and deaths | Obtained from Eurostat’s regional statistics |
| Domestic migration, disaggregated into domestic immigration and domestic emigration | Obtained from OECD’s Regional Database |
| Life expectancy at birth for new-born | Obtained from Global Data Hub’s Human Development Database |
| Infant mortality, measured as deaths in the first year of life | Obtained from OECD’s Regional Database |
| Transportation-related mortality, measured as deaths in traffic | |
| Intentional homicides in terms of unlawful homicides purposely inflicted | |
| The population’s well-being | |
| Human development index, divided into subindexes for education, health, and income | Global Data Hub’s Human Development Database |
| Years of schooling in mean for completed education and in expectation upon entering education. | |
| Disposable household income measured in current prices, fixed 2010 prices, and purchasing power parities with European Union-27-2020 as a basis | Obtained from OECD’s Regional Database. Fixed price and purchasing power-adjusted figures are derived with the help of household consumption deflators and the EU-27 consumer purchasing power parity, respectively |
| Gross national income in current prices and purchasing power parities with European Union-27-2020 as a basis | National figures are obtained from Eurostat, while regional distributions are obtained from Global Data Hub’s Human Development statistics. Fixed price and purchasing power-adjusted figures are derived with the help of income deflators and the EU-27 consumer purchasing power parity, respectively. |
| Active physicians, including practicing physicians and other physicians for whom the execution of their job requires a medical education. | Obtained from OECD’s Regional Database |
| Hospital beds, including acute care beds, rehabilitative care beds, long-term care beds, and other beds in hospitals | |
| Physical settlement features | |
| Area measured in square kilometers, divided by land area and freshwater area | Obtained from Eurostat’s regional statistics. The freshwater area is calculated as the difference between the total area and the land area |
| Main rooms in dwellings, including bedrooms and living rooms | Obtained from OECD’s Regional Database |
| Degree days in terms of cooling degree days and heating degree days | Obtained from Eurostat’s regional statistics |
| Variable | Obs. | Mean | Std. Dev. | Median | Min | Max |
|---|---|---|---|---|---|---|
| (1) Exports per employment | 273 | 18.89 | 17.34 | 14.70 | 3.23 | 114.84 |
| (2) Imports per employment | 273 | 15.59 | 9.43 | 14.06 | 2.49 | 46.35 |
| (3) Outward FDI per employment. | 252 | 1.26 | 3.02 | 0.29 | 0.01 | 16.29 |
| (4) Inward FDI per employment | 252 | 6.20 | 8.92 | 3.81 | 0.08 | 46.56 |
| (5) International emigration per capita | 294 | 11.68 | 5.50 | 11.07 | 2.52 | 36.30 |
| (6) International immigration per capita | 294 | 5.32 | 3.76 | 4.35 | 0.74 | 22.38 |
| (7) GDP in basic prices per employment | 420 | 17.18 | 5.55 | 16.57 | 6.45 | 33.94 |
| (8) Fixed capital stock per employment | 399 | 103.85 | 60.71 | 93.03 | 29.08 | 385.45 |
| (9) Employment | 441 | 138,314 | 104,759 | 104,800 | 39,480 | 539,070 |
| (10) Unemployment rate | 441 | 0.116 | 0.048 | 0.115 | 0.017 | 0.272 |
| (11) Population | 525 | 321,836 | 197,544 | 268,788 | 92,759 | 881,184 |
| (12) Population per land area | 525 | 0.171 | 0.579 | 0.034 | 0.012 | 3.194 |
| (13) Gross national income per capita | 420 | 8.37 | 3.84 | 7.39 | 2.92 | 22.92 |
| (14) Human development index | 525 | 0.806 | 0.052 | 0.808 | 0.673 | 0.933 |
| (15) PCT patent per capita (fractions, workplace) | 441 | 0.003 | 0.008 | 0.000 | 0.000 | 0.053 |
| (16) Share with higher education, adults | 378 | 0.263 | 0.091 | 0.247 | 0.116 | 0.540 |
| Variable | (1) | (2) | (3) | (4) | (5) | (6) | (7) | (8) |
|---|---|---|---|---|---|---|---|---|
| (1) Exports per employment | 1.000 | |||||||
| (2) Imports per employment | 0.434 | 1.000 | ||||||
| (3) Outward FDI per employment | 0.188 | 0.677 | 1.000 | |||||
| (4) Inward FDI per employment | 0.238 | 0.692 | 0.922 | 1.000 | ||||
| (5) International emigration per capita | 0.078 | 0.084 | −0.197 | −0.221 | 1.000 | |||
| (6) International immigration per capita | 0.262 | 0.470 | 0.298 | 0.281 | 0.051 | 1.000 | ||
| (7) GDP in basic prices per employment | 0.336 | 0.843 | 0.641 | 0.751 | −0.058 | 0.423 | 1.000 | |
| (8) Fixed capital stock per employment | 0.146 | 0.550 | 0.362 | 0.625 | 0.077 | 0.232 | 0.729 | 1.000 |
| (9) Employment | −0.018 | 0.517 | 0.526 | 0.627 | −0.037 | 0.194 | 0.622 | 0.560 |
| (10) Unemployment rate | −0.054 | −0.256 | −0.302 | −0.333 | 0.382 | −0.227 | −0.302 | −0.071 |
| (11) Population | −0.049 | 0.483 | 0.461 | 0.565 | 0.000 | 0.129 | 0.562 | 0.523 |
| (12) Population per land area | 0.026 | 0.315 | 0.132 | 0.390 | 0.013 | 0.045 | 0.380 | 0.761 |
| (13) Gross national income per capita | 0.238 | 0.779 | 0.722 | 0.823 | −0.103 | 0.453 | 0.920 | 0.734 |
| (14) Human development index | 0.233 | 0.725 | 0.624 | 0.766 | −0.111 | 0.482 | 0.895 | 0.769 |
| (15) PCT patent per capita (frac. work) | 0.079 | 0.442 | 0.736 | 0.741 | −0.307 | −0.030 | 0.467 | 0.293 |
| (16) Share with higher education, adults | 0.166 | 0.721 | 0.572 | 0.650 | −0.091 | 0.396 | 0.885 | 0.554 |
| (17) Estonia (dummy) | 0.055 | 0.028 | 0.383 | 0.342 | −0.515 | 0.065 | 0.204 | −0.154 |
| (18) Latvia (dummy) | −0.259 | −0.335 | −0.139 | 0.059 | −0.038 | −0.203 | −0.138 | 0.358 |
| (19) Lithuania (dummy) | 0.187 | 0.279 | −0.200 | −0.346 | 0.474 | 0.128 | −0.049 | −0.192 |
| (20) Year | 0.223 | 0.292 | 0.107 | 0.156 | 0.082 | 0.684 | 0.509 | 0.388 |
| Variable | (9) | (10) | (11) | (12) | (13) | (14) | (15) | (16) |
| (9) Employment | 1.000 | |||||||
| (10) Unemployment rate | −0.242 | 1.000 | ||||||
| (11) Population | 0.970 | −0.148 | 1.000 | |||||
| (12) Land area per capita | 0.488 | −0.057 | 0.468 | 1.000 | ||||
| (13) Gross national income per capita | 0.748 | −0.397 | 0.638 | 0.466 | 1.000 | |||
| (14) Human development index | 0.595 | −0.378 | 0.395 | 0.343 | 0.888 | 1.000 | ||
| (15) PCT patent per capita (frac. work) | 0.357 | −0.181 | 0.261 | 0.185 | 0.518 | 0.394 | 1.000 | |
| (16) Share with higher education, adults | 0.637 | −0.177 | 0.571 | 0.257 | 0.851 | 0.845 | 0.465 | 1.000 |
| (17) Estonia (dummy) | −0.089 | −0.124 | −0.144 | −0.121 | 0.163 | 0.043 | 0.394 | 0.324 |
| (18) Latvia (dummy) | 0.099 | 0.076 | 0.136 | 0.336 | −0.068 | 0.166 | −0.015 | −0.264 |
| (19) Lithuania (dummy) | −0.014 | 0.037 | 0.000 | −0.201 | −0.078 | −0.187 | −0.323 | −0.038 |
| (20) Year | −0.020 | −0.225 | −0.118 | −0.023 | 0.442 | 0.758 | 0.150 | 0.510 |
Disclaimer/Publisher’s Note: The statements, opinions and data contained in all publications are solely those of the individual author(s) and contributor(s) and not of MDPI and/or the editor(s). MDPI and/or the editor(s) disclaim responsibility for any injury to people or property resulting from any ideas, methods, instructions or products referred to in the content. |
© 2023 by the authors. Licensee MDPI, Basel, Switzerland. This article is an open access article distributed under the terms and conditions of the Creative Commons Attribution (CC BY) license (https://creativecommons.org/licenses/by/4.0/).
Share and Cite
Holmen, R.B.; Gavoille, N.; Masso, J.; Burinskas, A. Internationalization in the Baltic Regional Accounts: A NUTS 3 Region Dataset. Data 2023, 8, 181. https://doi.org/10.3390/data8120181
Holmen RB, Gavoille N, Masso J, Burinskas A. Internationalization in the Baltic Regional Accounts: A NUTS 3 Region Dataset. Data. 2023; 8(12):181. https://doi.org/10.3390/data8120181
Chicago/Turabian StyleHolmen, Rasmus Bøgh, Nicolas Gavoille, Jaan Masso, and Arūnas Burinskas. 2023. "Internationalization in the Baltic Regional Accounts: A NUTS 3 Region Dataset" Data 8, no. 12: 181. https://doi.org/10.3390/data8120181
APA StyleHolmen, R. B., Gavoille, N., Masso, J., & Burinskas, A. (2023). Internationalization in the Baltic Regional Accounts: A NUTS 3 Region Dataset. Data, 8(12), 181. https://doi.org/10.3390/data8120181