
VR Traffic Dataset on Broad Range of End-User Activities


Bell Labs Consulting, Murray Hill, NJ 07974, USA
Data 2023, 8(8), 132; https://doi.org/10.3390/data8080132
Submission received: 5 July 2023
/
Revised: 8 August 2023
/
Accepted: 15 August 2023
/
Published: 17 August 2023
(This article belongs to the Section Information Systems and Data Management)
Abstract
:With the emergence of new internet traffic types in modern transport networks, it has become critical for service providers to understand the structure of that traffic and predict peaks of that load for planning infrastructure expansion. Several studies have investigated traffic parameters for Virtual Reality (VR) applications. Still, most of them test only a partial range of user activities during a limited time interval. This work creates a dataset of captures from a broader spectrum of VR activities performed with a Meta Quest 2 headset, with the duration of each real residential user session recorded for at least half an hour. Newly collected data helped show that some gaming VR traffic activities have a high share of uplink traffic and require symmetric user links. Also, we have figured out that the gaming phase of the overall gameplay is more sensitive to the channel resources reduction than the higher bitrate game launch phase. Hence, we recommend it as a source of traffic distribution for channel sizing model creation. From the gaming phase, capture intervals of more than 100 s contain the most representative information for modeling activity.
1. Introduction
While Virtual Reality (VR) has been gaining increasing attention from consumers over the past few years, its adoption is expected to accelerate considerably with the introduction of the Metaverse [1]. A 2022 survey [2] revealed that 13% of US households own a VR headset. While 70% of VR adopters used it for gaming, many users expressed their interest in engaging in other types of VR activities; this indicates that future VR traffic will likely not only increase in volume but will also be generated by a more diverse set of applications with varying traffic characteristics and performance requirements.
Some of the most important examples of the applications for future consumer or small enterprise use are in education [3,4,5,6], healthcare [7], and shopping [8] domains. Most such applications are now developed for use at schools or offices. They are often in the stage of a proof of concept, but more and more of them will be moving towards the residential area in the future, like providing education opportunities for remote users or healthcare support in emergencies at patients’ houses. Even if those applications are not made for entertainment, they can still demonstrate traffic features close to gaming ones, as they are built on similar platforms to regular games (for example, the bicycle application in [6] and the laboratory risk assessment simulator presented in [3] are based on the Unity gaming engine). So, studying gaming traffic can still be helpful for provisioning network resources for them.
Service providers use specific models like [9,10], predicting the load growth at any point of the network infrastructure and allowing knowledge of the time to add new links or enhance the quality of service (QoS) of existing ones. However, as soon as the new services requiring potentially new QoS levels are introduced in the networks, the modeling approaches are revised based on the planned share of further services in the overall traffic flow and on its network requirements, usually obtained from laboratory or field measurements. The example can be an introduction to streaming and cloud gaming traffic in the past [11,12].
To support growing VR traffic, service providers need to better understand the likely variations in residential consumer traffic profiles due to its presence. As stated by Sandvine [13], gaming and social networking applications tend to increase network traffic symmetry. As many VR residential applications are games or social networking, checking traffic symmetry can be the primary research object. However, it is also important to verify how user behavior and game type could impact traffic volume and how user experience will change if the required network resources are not provided during the game.
Several researchers are actively investigating this area. For example, Zhao et al. [14] collected a dataset to compare a user’s gaming experience wearing a Meta Quest 2 headset in two cases: when it is connected to a cloud gaming server and when tethered to a local Personal Computer (PC). They also compare network parameters, such as latency and frame size. The final dataset contains traces for games like Beat Saber and Steam VR Home.
M. Lecci et al. [15,16] used a different setup involving a VR headset created from the iPhone inside a VR cardboard that was connected to a PC over Wi-Fi. Unlike a head-mounted device (HMD), such as Meta Quest 2, this setup cannot track hand movements and audio transmission during a game and only uses keyboard, mouse control, and head movements. Games measured by this team include Minecraft, Virus Popper, and Google Earth VR.
Seyedmohammad Salehi et al. [17] derived throughput requirements for VR traffic analytically and further collected a traffic dataset for Rec Room, The Lab, and War Robots games played on the Oculus Quest headset. The game rendering was performed at an edge server. Salehi et al. captured traffic traces at both the application and data link layers, which made it possible to see not only the traffic generated by the VR application itself but also how it was split across packets of the size of a Maximum Transmission Unit (MTU) during the Large Send Offload (LSO) algorithm. In addition, monitoring packets at these two levels allowed them to capture actual packet sizes and the inter-packet transmission intervals resulting from different buffering algorithms.
Ruizhi Cheng et al. [18] analyzed the traffic predominantly from social platforms like AltspaceVR, Horizon Worlds, Mozilla Hubs, Rec Room, and VR Chat, and the major target of this work was to study the readiness of existing VR social platforms to scale and to see how VR applications react to different network disruptions like introducing latency and reducing bandwidth. The paper, for the first time, had captured the traffic separately for the uplink and the downlink.
This study extends previous research along key dimensions. First, we study the impact of the duration of traffic traces on the final measurement and determine the minimum duration required to adequately capture user behavior corresponding to different VR software. The length of traffic capture in previous studies varied from 30 s to 10 min, and it is still being determined to what extent this variation impacted the final results.
Second, we are capturing not the short-term laboratory experiments traffic but the complete life gaming sessions. This can not only help to generate a snapshot of the active gaming phase network requirements or peak traffic demand but also see how often packet volume distribution changes during the normal user session and for what reason. Based on this paper’s data, it is possible to construct a more precise probabilistic model of VR demand share in residential traffic at busy hours than before.
Finally, we propose to capture downlink and uplink transmission separately to enable service providers to individually estimate their link compliance for demand in both directions and assess the level of asymmetry between the uplink and downlink traffic. So far, only one of the reviewed papers presents traces for both directions, and it covers only social applications. This paper will extend it to other application types.
We investigate several popular VR activities and create a dataset of data link layer captures for them in a real household. The biggest part of it contains real gaming sessions of the most popular VR games, and the minor part traces of social networking activities and a simulator. Apart from the positive user experience scenario, for one of the games we also describe the consequences of intermittent link overload and latency-related constraints during a gaming session.
This paper is organized as follows. Section 2.1 and Section 2.2 describe the platform and the software used in the experiments. Section 2.3 lists the steps taken to process the raw data. Section 3.1 and Section 3.2 analyze the traffic profiles generated in the experiments. In Section 3.3, we present the sensitivity of observed traffic to bandwidth and latency constraints. We conclude in Section 4 and Section 5 with a summary of insights derived from this study and identify areas for future investigations.
2. Materials and Methods
2.1. Setup Description
The measurement setup is reflected in Figure 1. As a user device, we used Meta Quest 2, the most popular consumer headset in 2022 as per [19]. Furthermore, the headset has gained the attention of 41.12% users of Steam, which is confirmed by the Steam Hardware and Software Survey [20]. Therefore, due to that level of popularity, it is possible to approximate the majority of consumer VR traffic with this headset traffic profile.
The headset has a resolution of 3664 × 1920, a refresh rate of up to 120 Hz (72 Hz used as a default in all measurement activity), and a 100 degrees view. It uses two Oculus Touch controllers for playing and a USB Type-C cable to connect to the PC if certain games cannot be rendered on the headset itself (for instance, “Half-Life: Alyx”). For them, the following PC configuration was used: a 15.6” Gaming Laptop with Intel Core i5 CPU, 8 GB of RAM, NVIDIA GeForce GTX 1650 Video Card, and Windows 10.
Both PC and VR headset were connected to the internet through a Wi-Fi access point at 5 GHz with 40 MHz bandwidth. The residential internet connection had the limits of 600 Mbps for downlink and 20 Mbps for uplink. We used a residential end-user circuit with potential natural traffic limiting issues instead of a stable lab link to emulate the regular fixed consumer user experience during measurements.
The setup used Wi-Fi AP (Access Point) in bridge mode and the Ethernet switch, connecting the AP to the home router given by the internet service provider (ISP). At the Ethernet switch, a SPAN port was configured for traffic monitoring, as we had to capture the traffic from several devices over the house at the same time. This configuration approach is widely used and an example of the traffic mirroring application for conducting a traffic study can be found in [21]. We captured traffic with TShark 2.6.20, a command-line network protocol analyzer, installed on the mini-PC running Ubuntu Linux, which we connected to the SPAN port of the Ethernet switch. We have not configured any filters for TShark, so it had captured all packets with all protocols information as it is shown in the command line prompt used for all scenarios:
tshark -i eth1 -b duration:1200 -b files:100 -w tshark.pcap ‘host <ip if the PC> or host <ip of the headset>’
When we needed to introduce the shaping of traffic and latency/jitter, we replaced the access point with the Raspberry PI 4B board configured as a Wi-Fi hotspot. The software (SW) image used on Raspberry PI was 2022-09-22-raspios-bullseye-armhf.img, and the AP SW for traffic monitoring and limiting traffic was RaspAP [22]. With the built-in Raspberry PI antenna, it was possible to have a Wi-Fi bandwidth of 20MHz, which was enough to perform tests at the observed and limited data rates during bandwidth limitation tests with a maximum data rate registered at 1 Mbit/s. The Raspberry PI setup was not used entirely over all experiments but only while shaping.
It is stated in [23] that it is possible to play any games offline, except for social, if certain settings are implemented and the game is pre-downloaded. And [24] describes the reason the headset without those settings needs to consume internet traffic: it constantly verifies the user account with Facebook servers during the game. In cases where the verification has failed, also due to the absence of Wi-Fi, it is impossible to play. In this work, we will monitor the traffic results for a regular residential user who will not activate offline settings after downloading each game, as he has stable internet, and keep both PC and headset connected to Wi-Fi at all times.
2.2. Games
For the measurements, we have taken the most popular, yet different, genres of games and activities. It helped to define whether VR traffic is homogeneous over the range of applications.
- 1.
- Beat Saber [25]. The game is only played on a VR headset (no PC connection). It can be single or multiplayer and requires cutting the cubes moving towards you with a saber in a specific direction by a particular hand. This game can be downloaded at Oculus and Steam and is rated as one of the most popular at both (for instance, it is number 2 in Steam Charts [26]). The game has simple graphics, so we expected low traffic volume.
- 2.
- Half-Life: Alyx [27]. The game is in third place in popularity on the Steam Charts [26]. It is a single-player game developed by Valve, whose target is to save humanity by fighting the alien race. The game is rendered on a user’s PC, and a USB Type-C cable connects the VR headset to this PC [28] (this game appears to be too heavy for Oculus Airlink wireless connection and has exceptional graphics quality). Heavy video flow, created by the game, can be guessed from a natural and realistic representation of the world inside it.
- 3.
- Rec room [29]. An arcade social multiplayer game that allows players to create and play games alone and in groups. It is played only on a VR headset, without a PC, and has simplified graphics.
- 4.
- VR chat [29]. The social environment is where the users can talk and play various games together. It is a VR headset rendered alternative to individual and group video calls.
- 5.
- Google Earth VR [30,31]. The simulator VR environment lets you explore different places on Earth from different angles and points of view. As the volumetric video the user sees is very detailed and allows him to see not only the maps but any street place in panoramic view, it can be rendered only on a PC and filmed at the headset with a reliable USB connection.
2.3. Post-Processing
Initial captures were carried out by TShark command line application as the corresponding Ubuntu machine did not have a graphical interface, and were saved in “.pcapng” format. They included full information about the traffic flow at all levels, but for the purpose of internet channel sizing research we performed filtering using open source network packet analyzer Wireshark 3.2.3 [32]. Wireshark has an advantage for post-processing tasks compared to TShark in that all the filtering operations can be performed in a graphical interface.
Changes included:
- 1.
- Removing the messages not related to the VR traffic itself or happening only at the beginning of each long gaming session, with the filter: “!dns&&!arp&&!ntp&&!dhcp”
- 2.
- Removing all columns except “Time”, “Source”, “Destination”, “Protocol”. Adding the column “TCP Segment Len” by selecting one of the TCP packets in the capture and selecting the option of its parameter “TCP Segment Len” to be applied as a column. Adding the column “UDP length” with “udp.length” filter
- 3.
- Saving the resulting captures to the csv file using the menu item: “Export Packet Dissections -> As CSV”
An additional post-processing step was performed by translating the columns of the csv file “Source” and “Destination” to the column “Link” using Pandas 1.5.3 library functions [33] in a Python script. The script assigned for each capture the value of the new “Link” column to “downlink_PC” and “downlink_headset” when the “Destination” column contained the IP address of PC or headset correspondingly, and “uplink_headset” or “uplink_PC” when the “Source” column contained those IP addresses. Columns “Source” and “Destination” were further removed.
All the slicing of data for plotting graphs of separate traffic features and creating tables in Section 3 was performed using Pandas library functions.
2.4. Dataset Structure
After all the above described steps, we saved the 9 csv files listed in the Table 1 representing 5 VR activities. Each csv file contains packet features described in Table 2 for each packet in a single capture. The dataset is shared on the repository [34]. In Section 3.1, we will describe each of those file analysis results in more detail.
3. Results
3.1. Time Scale Dataset Features
In this section, we will review the context and the significant features of the captures we have taken. All the time plots, reflected in this section, were created by accumulating the packets of respective trace per 1-second intervals.
For “Half-Life: Alyx” and Google Earth, apart from checking the data consumption over real gameplay time, we intended to figure out whether connecting the headset to the PC with the cable eliminates the traffic from the headset itself (Wi-Fi on the headset was activated during all the measurements) so that any interaction with the game server will happen only via PC. We have recorded separate traffic for both respective IP addresses and, in the results, we see that headset traffic has been present; however, it had a lower volume and a different set of protocols than the one observed on the PC (protocol details will be reviewed further in this section).
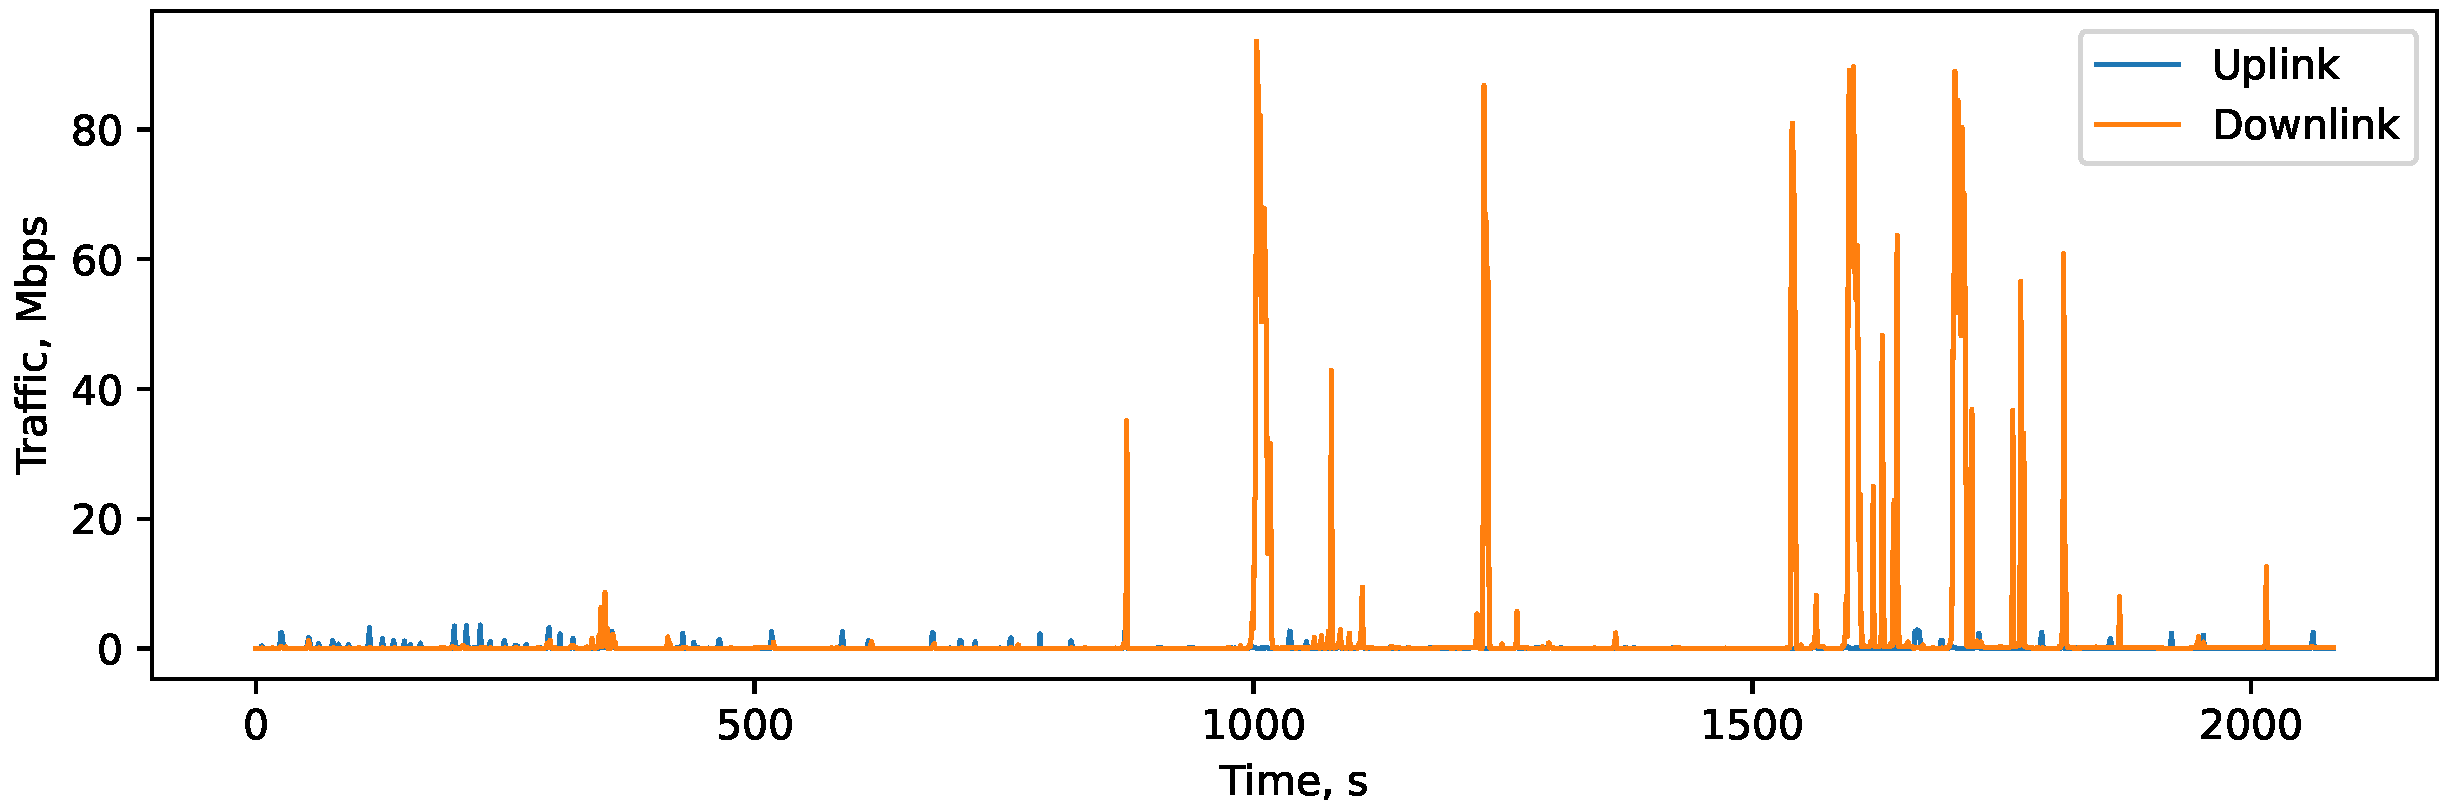
The following three traces of time-plots are reflected in Figure 2:
- 1.
- Trace 1. A complete gameplay of “Half-Life: Alyx” with launch, going through the game scenario and saving the progress. This is not the first time this game is played on this PC (which means the peak of traffic related to the first launch on this PC is omitted), and no user experience issues are noticed during the session.
- 2.
- Trace 2. The same as above but, during the game, from the beginning and up to 5000 s, there was a file upload in the same network with a rate close to the uplink channel bandwidth (20 Mbit/s). The level of user experience disruption: the user was able to continue playing the game but he experienced delays in actions or scene changes from time to time. No game interruptions happened.
- 3.
- Trace 3. The same as above but, around the 500th second of the record, we introduced a 100 ms downlink delay, causing user experience degradation (delays in viewing the next scene or doing some user action). As per the user, issues were worse than with the Trace 2 case.
We can see from the traces that “Half-Life: Alyx”, a single-player game with potentially no need to download anything about other players’ status, still generates a fair amount of traffic both in uplink and downlink directions.
Each of the captures contains a short traffic peak related to the game launch and loading of the previous game status and the more stable piece related to the game process itself. Only part of the downlink traffic has equally distributed bursts. The uplink has no regular sequence at the time plot and only depends on the gaming scene and user activity.
One trace was collected for Google Earth traffic, and the time-plot is reflected in Figure 3. During the session’s first 300 s, the user passed the tutorial on how to use the environment. Then he explored the globe, zooming in on several continents and, within those, several streets in street walking mode.
As with Half-Life traffic, we can see both headset and the PC portion. But, again, there are no regular patterns in the time plot, and traffic volume depends only on the user activity in both uplink and downlink.
Rec Room has two traces available for the analysis, and their time plot is reflected in Figure 4. Due to the fact that in some reviewed papers [17] the traffic captures have been presented from the moment when the user logs into Steam Hall, including choosing the game and lasting to some middle point in the gameplay, we decided to capture all possible phases of user activity, including first and second launch of the game, and see how they can be different and whether mentioned data volumes persist over all user experience steps.
- 1.
- Trace 1 contains the first launch of the game. The first 800 s of the trace include launching the game and passing the tutorial, and the rest of the capture consists of user multiplayer activity. The period of watching the tutorial is eliminated from the first graph as it did not generate significant traffic; however, the corresponding data points are presented in the data files.
- 2.
- Trace 2 contains the second launch of the game. The first 220 s of the trace include game launch and browsing game options, then 250 s of the multiplayer gaming activity follow, and then the user again returns to browsing game options.
Figure 2.
“Half Life: Alyx” traces for three measurement conditions. (a) Headset traffic, Trace 1, (b) PC traffic, Trace 1, (c) Headset traffic, Trace 2, (d) PC traffic, Trace 2, (e) Headset traffic, Trace 3, (f) PC traffic, Trace 3.
Figure 2.
“Half Life: Alyx” traces for three measurement conditions. (a) Headset traffic, Trace 1, (b) PC traffic, Trace 1, (c) Headset traffic, Trace 2, (d) PC traffic, Trace 2, (e) Headset traffic, Trace 3, (f) PC traffic, Trace 3.

Figure 3.
Google Earth traffic. (a) Headset traffic, (b) PC traffic.

Figure 4.
Rec Room traffic. (a) Trace 1, first launch period of the game, (b) Playing period of Trace 1, (c) Playing period of Trace 2.
Figure 4.
Rec Room traffic. (a) Trace 1, first launch period of the game, (b) Playing period of Trace 1, (c) Playing period of Trace 2.

For Beat Saber, two traces are included in the dataset:
- 1.
- Trace 1. A complete gameplay of not the first launch of the game. The first 300 s include the launch of the game and all other time includes regular multiplayer activity. The plot of this trace is reflected in Figure 5;
- 2.
- Trace 2 contains a multiplayer game where we limited the bandwidth for uplink and downlink in steps. The plot for this trace will be presented later in the bandwidth limitation section.
Figure 5.
Beat Saber traffic, Trace 1.

One trace was collected for VR chat traffic. During the captured time, the first 800 s of the trace correspond to two people chatting, and further observed peaks of the load displayed in Figure 6 represent several multi-user room talks.
3.2. Traffic Distribution and Protocols
All the measured activities are very different, not only in time scale. In order to assess the possibility to create one traffic model, describing all the mentioned activities at once, we plotted the Cumulative Distribution Function (CDF) of all five types of applications, shown in Figure 7. Those CDFs had been built using the central parts of the captures. It lets us revise only target user activity and not consider startup traffic peaks or time of browsing options inside the game. Pieces of traces, mentioned in Table 3, had been taken for every activity to plot CDFs. Packets within each piece were accumulated per 1 s interval to calculate CDF. In a further analysis, we only account for smoothed traffic peaks, not considering the local maximums within each second interval.
We can conclude that it is not possible to make even one model type fitting all games, as only two games, Beat Saber and Rec Room, have a similar form of traffic distribution, varying only in their Probability Density Function (PDF) maximum in the downlink. “Half-Life: Alyx” has the same range of traffic values as those two games, but the distribution is much more skewed to the smaller values.
The range of traffic per second values for Google Earth and VR Chat in the downlink is almost 50 times bigger than for the Beat Saber, Rec Room, and “Half-Life: Alyx”. But VR Chat CDF has a thicker right tail than Google Earth, primarily because of the difference between various user activity traffic rates within one application. For example, if browsing different Earth regions and zooming over those regions in Google Earth does not give a 2–3 times traffic increase per second, in VR Chat, the talk of two people and several people in the room can differ ten times in traffic value. So the distribution of the particular user session in VR Chat will heavily depend on what the user will do during that session.
If we review the protocol stack of all the applications, we can see that PC-rendered games have a far more significant number of protocols involved in the transmission. The major protocols, which are used to handle the user traffic for “Half-Life: Alyx” and Google Earth are TCP, SSL, TLSv1.2 (Transport Layer Security), TLSv1.3, and UDP (User Datagram Protocol). Some notifications from the game server have been transferred with HTTP (Hypertext Transfer Protocol). QUIC protocol had been used at the moments of the biggest UDP bursts to speed up the transmission (only several big bursts of QUIC over each record), SSDP (Simple Service Discovery Protocol) for the discovery and advertisement of services within the network, and MDNS (Multicast Domain Name System) for locating devices in a local network without using a standard DNS (SSDP and MDNS have regular bursts coming in a fixed interval of time).
As we have mentioned in Section 3.1, the set of protocols for the headset (TCP, TLSv1.2, TLSv1.3) is different from the one on the PC (TLSv1.2, TCP, MDNS, TLSv1.3, UDP, SSDP, QUIC, HTTP, SSLv2, TLSv1) for the tethered setup. We did not find a reason for this split in the references, but having in mind that Client Key Exchange, Change Cipher Spec, and Encrypted Handshake messages can be seen multiple times in both monitored IP traces, and UDP/QUIC only in the PC one, we can suppose that user authentication in Oculus is verified continuously over the gaming session from both tethered devices and gaming progress was saved only from the PC.
For the VR headset-rendered games, the list of protocols shrinks and does not contain SSDP, MDNS, HTTP, or QUIC, as there is no need anymore to interact between several devices or services within the same network and also to visualize the game video on the regular monitor in parallel with the visualization on the headset as is done for PC-rendered games.
Table 4 and Table 5 list protocols for each game, their average packet size, and their share of overall traffic in the uplink or downlink directions for the respective game.
For further modeling activity, it will be interesting to check which protocol dominates in the transmission as traffic behavior changes with it. For the PC-rendered games, the TCP and TLS traffic take the lead position in both uplink and downlink, leaving a very insignificant share for UDP, while for VR headset-rendered activities, the picture changes. For the games like Rec Room and Beat Saber, UDP traffic share is more than 95% in the downlink, while in the uplink, it drops to 56–65%, leaving all the other parts to TCP and TLS. Finally, VR chat based on the protocol split pattern belongs to the third major group of activities. Its traffic pattern includes mostly TCP/TLS traffic, only 1/3 uplink traffic and 2.5% of downlink goes over UDP.
Another check made with the captured data was the proportion between uplink and downlink traffic at the stable usage period, reflected in Table 2. Table 6 demonstrates the result of this check. Surprisingly, the uplink traffic share leader is a single-player game, Half-Life: Alyx, rendered on a user’s PC. It does not download almost anything from the gaming server but uploads a lot. Among the upload content there are backups of the user status and artifacts which he had gathered during the game on the Steam server and, if for any reason the internet speed was limited during the game, the game synchronizes its data with the server at the end of the user session, as is seen in the graph Figure 2d.
For prediction of the share of the uplink traffic, it may not be enough to know whether the game is multiplayer or single-player and whether it has simple graphics or advanced, as can be seen in Table 6. For example, Multiplayer Rec Room and Beat Saber have a lower uplink load than single-player Half-Life. Google Earth has almost the same share value as VR Chat, while it has much more advanced video flow. Both of those activities are not symmetric and have the highest downlink share among others. The interesting fact is that the uplink portion is the biggest for the two most popular VR activities: Half-Life: Alyx and Beat Saber. Investigation into the reasons for this can be the topic of further research.
3.3. Bandwidth and Latency Modification
We performed a short test to check what happens with the different types of traffic while we are limiting its bandwidth or introducing some latency.
Figure 8 shows changes in the CDF of the traffic of Half-Life: Alyx, which has TCP-dominating traffic when we introduce the uplink bandwidth decrease (Trace 2) or introduce downlink latency (Trace 3).
In the first experiment, we introduced a big file upload from another user in parallel to the game for 5000 s; it appeared to be a slightly more significant number of small packets than in a typical situation in the uplink. The tail of the distribution became longer, which is more considerable for downlink than for uplink, but the form of the traffic distribution was the same. The average bitrate for the uplink in Trace 2 decreased from 80.9 kbps in Trace 1 to 58.5 kbps and, in the downlink, the bitrate increased from 10.5 kbps to 24.5 kbps, most probably to enable TCP retransmits to happen.
In the second experiment, we injected a 100 ms delay to the downlink using Raspberry PI, which we inserted instead of the Wi-Fi AP depicted in Figure 1. This time, it appeared to be a slightly lower number of small packets than typically in the uplink, and the tail of the distribution became a little longer for both uplink and downlink. As a result, the average bitrate for the uplink in Trace 3 increased to 138.7 kbps compared to Trace 1 and, in the downlink, the bitrate increased to 13.3 kbps.
As mentioned in the description of Trace 3, the user experience became incompatible with the user expectations exactly in the latency-related experiment, and we can also see from the data above that introducing latency in the TCP-dominated traffic generates, in fact, an increase of the bitrate, which can be measured and controlled. If the decrease of the bitrate in the uplink was correlated with the user inconvenience, the growth of the uplink bitrate was coupled with the substantial user issues during the game.
Another experiment was carried out with the UDP-dominated traffic for Beat Saber. Using the Rasp AP application, the bandwidth was gradually changed step by step, either in uplink or downlink, to allow us to check which part of the channel makes a more considerable difference. We reflected bandwidth changes steps in Figure 9.
During the experiment, the user had not experienced any issues or delays (even when the load peaks were limited) until the downlink speed reached 150 kbps, the average rate of downlink UDP packets for multiplayer Beat Saber traffic. As soon as we set this limit, the user started to see the delays of other players’ actions for about 2 s. For example, he observed the changing of positions of other players in “jumps”.
The average bitrate in the interval of highest limitation (150 kbps in downlink and same in uplink) had increased in the downlink to 146.6 kbps from 111 kbps in Trace 1 and dropped in the uplink to 60 kbps from 83.8 kbps in Trace 1. The effect of Beat Saber uplink- and downlink-combined limitation was similar to the restriction of uplink bandwidth in Half-Life: Alyx: an increase of transmission in the downlink and a decrease in the uplink. The effect volume was twice as small, probably due to the prevalence of UDP traffic in Beat Saber and the different packet loss handling processes.
4. Discussion
As was stated in the Introduction, the target of this work was to create a dataset of real full-size gameplays with all the phases of user experience for a set of VR activities and discover the minimum duration of the trace that can represent particular game traffic distribution for modeling purposes, and the phase of the game where this trace needs to be taken. This will allow us to verify if the previous research fully covers the residential user gaming scenarios and define the best strategy for conducting measurements for future VR applications as soon as they are released.
Experiments carried out in this paper showed that the traffic generated by VR games is not homogeneous between different activities and between the different phases of the same game, meaning the final traffic profile of a particular household will heavily depend on which kind of VR activities its members prefer and how frequently they switch from one activity to another. Even if the current work does not provide exact suggestions on the traffic mix apart from prioritizing the most popular activities, the new dataset can be a good source of essential mix components. Based on it, Internet Service Providers (ISP) or other researchers can create a probability model that will help to correctly dimension the last mile of internet connection and schedule an upgrade of the provider’s links to satisfy users’ expectations.
To check which of the presented traces interval is better to use for modeling, we will examine Figure 2, Figure 4 and Figure 5 and see that the phase of launching the game has much more significant and longer peaks of traffic than the typical gaming phase. Its duration is relatively short compared to the overall size of the gameplay (for example, in Half-Life: Alyx Trace 1 ratio of game launch duration to overall gameplay was 1:23). Also, the very first launch of the game gives a different bitrate compared to the second and following launches. An example can be seen in Figure 4 for the Rec Room, where the downlink bitrate for the first 50 s is 20–40 Mbps, while in the second launch, it never goes above 5 Mbps, and in the active playing phase it is around 300–500 kbps all the time on average.
Such differences in the bitrates between gameplay phases set up a question — which phase influences residential channel dimensioning the most so that we can plan to record it and measure its parameters during any following experiments. As shown in Figure 2b, the launch phase of the game has much smaller peaks during bandwidth restriction than in the normal scenario, especially for the PC part of the traffic. Still, the user started noticing disruption only during the gaming phase and not in the launch phase. The same happened with the latency introduction during Half-Life: Alyx Trace 3—the user started to notice the delays and be annoyed only during the gaming phase, even if the average bitrate was more significant at the beginning of the trace. So, we can suppose that the gaming phase is more sensitive to the resources shortage than others, and we can limit the data interval used as a source for model creation to the active gaming time interval.
After defining the phase of the measured activity which can be taken, we need to better understand which trace duration of this phase will be enough to represent the game traffic for the most accurate model. We have captured every activity reviewed in this paper over a relatively long period (30–90 min), and we have a chance to see how the traffic distribution varies for the different sizes of the same trace slices.
Many authors, for example, [14,15], capture distribution for packet size and the inter-packet time separately and do it for a limited time interval in the middle of the gaming session. However, as VR traffic does not have a periodic structure and may have deviations from a small piece pattern, we have plotted CDFs in Figure 10 for the different sample sizes of Beat Saber Trace 1 and Half-Life: Alyx Trace 1 for downlink packet size and inter-packet time to check what minimum sample size is needed to include all distribution features.
The samples were taken in the trace’s random parts for both games. For the pieces smaller than 100 s, we tried to choose the most stable game period without significant traffic peaks. However, avoiding traffic level changes for longer periods was impossible. Beat Saber distributions show a substantial deviation of a 30 s sample from the rest of the sample sizes and a smaller variation of the 50 s piece distribution. For the games like this, it should be possible to approximate the overall traffic with a capture interval closer to 100 s.
For Half-Life: Alyx, the packet size distribution does not answer which sample size is more appropriate as all are different. But the plot of inter-packet intervals has a clear grouping of CDFs with a sample size that is larger than or equal to 100 s. The reason is that, for the downlink traffic of this game, there is a periodic peak of transmission with around 300 s interval, so to create a traffic model representing the generic Half-Life: Alyx traffic, it will be required to use samples of a bigger size. Also, based on the results of comparing the slices traffic distributions for two games, we conclude that the interval of the traffic capture always needs to be bigger than 100 s or even be longer based on a preliminary analysis of the bigger interval.
We can relate our measurement results to the results of the other researchers using capturing intervals of 90 s or more. For instance, the gaming phase of Trace 2 of Rec Room (the section between 250–450 s) correlates in overall bitrate with [17], where the MAC layer instantaneous rate is around 500–550 kbps. Still, the current paper’s dataset gives the split of that overall traffic on uplink and downlink and presents different gaming phases. In [16], consumption of the Google Earth application is measured at around 50 Mbps while, in our measurements, we are reaching the peak rate of 60 Mbps. This variation can be explained by the different set of equipment utilized in that paper, so our dataset can bring additional data points for researchers who study that application. However, as we have reviewed in Section 3.2, the share of the uplink traffic for certain activities makes a big difference, and the activities with its most significant share (Half-Life: Alyx and Beat Saber) are the most popular ones as per charts but are not covered by the previously conducted measurements or were recorded for a shorter time than mentioned in the discussion. The current dataset can close this gap and help other researchers create a balanced traffic mix for residential user link dimensioning.
5. Conclusions
Gaming traffic, especially VR, is more and more playing a shaping role in the overall fixed consumer traffic profile. To show its role in more detail, we have gathered an entire dataset of internet traffic captures of various popular VR activities with an overall duration of around 7 h. With that data, fixed residential service providers can include the most popular VR activities in their models, approximating consumer traffic and defining the need for last mile equipment upgrades with the future VR traffic demand growth.
Such an upgrade can be driven by the new insights revealed by the currently collected dataset: the traffic of popular parts of measured VR activities is more symmetric than for the others, and one of the games (Half-Life: Alyx) has even dominated uplink traffic. In addition, the current study shows that user experience can significantly degrade with increasing latency in the transmission channel, sometimes even more than bandwidth reduction. Disruptions during the gaming phase will be perceived as more critical than those during the higher traffic peaks’ activity launch phase. All these factors indicate the need for ISPs to monitor the uplink traffic growth in their network tightly and control latency in both directions, as it can impact customer satisfaction and churn rate.
The current dataset also helped demonstrate that the length of the taken traces matters for estimating traffic distribution, and the minimum capture length should be not shorter than 100 s.
Funding
This research received no external funding.
Institutional Review Board Statement
Not applicable.
Informed Consent Statement
Not applicable.
Data Availability Statement
Data available at https://doi.org/10.6084/m9.figshare.22191160.v1, accessed on 16 August 2023.
Acknowledgments
We want to thank Narayan Raman and Faris B. Mismar for their feedback, which helped to improve this paper.
Conflicts of Interest
The author declares no conflict of interest.
References
- Lee, J.; Yeo, I.; Lee, H. Metaverse Current Status and Prospects: Focusing on Metaverse Field Cases. In Proceedings of the IEEE International Conference on Big Data, Cloud Computing, and Data Science, Danang, Vietnam, 4–6 August 2022; pp. 332–336. [Google Scholar] [CrossRef]
- Group, N.R. Beyond Reality, 2022. Available online: https://www.nrgmr.com/our-thinking/the-vr-revolution-might-finally-be-on-the-horizon/ (accessed on 10 February 2023).
- Mariscal, G.; Jiménez, E.; Vivas-Urias, M.D.; Redondo-Duarte, S.; Moreno-Pérez, S. Virtual Reality Simulation-Based Learning. Educ. Knowl. Soc. (EKS) 2020, 21, 15. [Google Scholar] [CrossRef]
- Fouad, R.; Elsaid, H. Promoting Children Tourism through Applying Virtual Reality to the Egyptian Child Museum. Int. J. Heritage, Tour. Hosp. 2022, 15, 1–19. [Google Scholar] [CrossRef]
- Khan, N.; Muhammad, K.; Hussain, T.; Nasir, M.; Munsif, M.; Imran, A.S.; Sajjad, M. An adaptive game-based learning strategy for children road safety education and practice in virtual space. Sensors 2021, 21, 3661. [Google Scholar] [CrossRef] [PubMed]
- Zeuwts, L.H.R.H.; Vanhuele, R.; Vansteenkiste, P.; Deconinck, F.J.A.; Lenoir, M. Using an immersive virtual reality bicycle simulator to evaluate hazard detection and anticipation of overt and covert traffic situations in young bicyclists. Virtual Real. 2023, 27, 1507–1527. [Google Scholar] [CrossRef]
- Owais, W.B.; Yaacoub, E. On Accommodating VR Traffic for mHealth Applications in Rural Areas with Limited Impact on IoT Traffic. In Proceedings of the 2020 IEEE International Conference on Informatics, IoT, and Enabling Technologies (ICIoT), Doha, Qatar, 2–5 February 2020; pp. 389–393. [Google Scholar] [CrossRef]
- Farah, M.F.; Ramadan, Z.B.; Harb, D.H. The examination of virtual reality at the intersection of consumer experience, shopping journey and physical retailing. J. Retail. Consum. Serv. 2019, 48, 136–143. [Google Scholar] [CrossRef]
- Karagiannis, T.; Molle, M.; Faloutsos, M.; Broido, A. A nonstationary poisson view of internet traffic. In Proceedings of the IEEE INFOCOM 2004, Hong Kong, China, 7–11 March 2004; Volume 3. [Google Scholar] [CrossRef]
- Yang, X. Designing traffic profiles for bursty internet traffic. In Proceedings of the Global Telecommunications Conference, Taipei, Taiwan, 17–21 November 2002; Volume 3. [Google Scholar] [CrossRef]
- Carrascosa, M.; Bellalta, B. Cloud-gaming: Analysis of Google Stadia traffic. Comput. Commun. 2022, 188, 99–116. [Google Scholar] [CrossRef]
- Ameigeiras, P.; Ramos-Munoz, J.J.; Navarro-Ortiz, J.; Lopez-Soler, J.M. Analysis and modelling of YouTube traffic. Trans. Emerg. Telecommun. Technol. 2012, 23, 360–377. [Google Scholar] [CrossRef]
- Sandvine. Sandvine’s 2023 Global Internet Phenomena Report, 2023. Available online: https://www.sandvine.com/global-internet-phenomena-report-2023 (accessed on 10 February 2023).
- Zhao, S.; Abou-zeid, H.; Atawia, R.; Manjunath, Y.S.K.; Sediq, A.B.; Zhang, X.P. Virtual Reality Gaming on the Cloud: A Reality Check. In Proceedings of the 2021 IEEE Global Communications Conference, Madrid, Spain, 7–11 December 2021; pp. 1–6. [Google Scholar] [CrossRef]
- Lecci, M.; Zanella, A.; Zorzi, M. An ns-3 implementation of a bursty traffic framework for virtual reality sources. In Proceedings of the 2021 Workshop on ns-3, Virtual, 21–25 June 2021. [Google Scholar] [CrossRef]
- Lecci, M.; Drago, M.; Zanella, A.; Zorzi, M. An Open Framework for Analyzing and Modeling XR Network Traffic. IEEE Access 2021, 9, 129782–129795. [Google Scholar] [CrossRef]
- Salehi, S.; Alnajim, A.; Zhu, X.; Smith, M.; Shen, C.C.; Cimini, L. Traffic Characteristics of Virtual Reality over Edge-enabled Wi-Fi Networks. 18 November 2020. Available online: https://arxiv.org/pdf/2011.09035.pdf (accessed on 23 December 2022).
- Cheng, R.; Wu, N.; Varvello, M.; Chen, S.; Han, B. Are We Ready for Metaverse? ACM: New York, NY, USA, 2022; pp. 504–518. [Google Scholar] [CrossRef]
- Cheng, N.R.; Wu, S.C.; Han, B. Will Metaverse Be NextG Internet? Vision, Hype, and Reality. IEEE Netw. 2022, 36, 197–204. [Google Scholar] [CrossRef]
- Steam Hardware and Software Survey, November 2022. Available online: https://store.steampowered.com/hwsurvey/Steam-Hardware-Software-Survey-Welcome-to-Steam (accessed on 23 December 2022).
- Kassim, M.; Mahmud, A.R.; Ramli, M.A.; Rahman, R.A. Network Analysis of Students’ Online Activities via Port mirroring Switch Port Analyzer. In Proceedings of the 2022 IEEE 12th Symposium on Computer Applications & Industrial Electronics (ISCAIE), Penang, Malaysia, 21–22 May 2022. [Google Scholar] [CrossRef]
- RaspAP Wi-Fi Configuration Portal. Available online: https://docs.raspap.com/ (accessed on 28 July 2023).
- Espen. Can I Play Oculus Quest 2 Offline Without Wi-Fi? (Solved!), 2022. Available online: https://pursuitmeta.com/can-i-play-oculus-quest-2-offline-without-wi-fi/ (accessed on 28 July 2023).
- Sutrich, N. The Oculus Quest Needs a True Offline Mode, 2022. Available online: https://www.androidcentral.com/oculus-quest-true-offline-mode (accessed on 28 July 2023).
- Szpak, A.; Michalski, S.C.; Loetscher, T. Exergaming with Beat Saber: An Investigation of Virtual Reality Aftereffects. J. Med Internet Res. 2020, 22, e19840. [Google Scholar] [CrossRef] [PubMed]
- Charts, S.S. Most played VR Only Games. Available online: https://steamdb.info/graph/?category=401 (accessed on 23 December 2022).
- Half-Life: Alyx. Available online: https://store.steampowered.com/app/546560/HalfLife_Alyx/ (accessed on 28 July 2023).
- Gajsek, D. Oculus Link. Available online: https://circuitstream.com/blog/oculus-link (accessed on 28 July 2023).
- McVeigh-Schultz, J.; Kolesnichenko, A.; Isbister, K. Shaping pro-social interaction in VR an emerging design framework. In Proceedings of the 2019 CHI Conference on Human Factors in Computing Systems, Glasgow, UK, 4–9 May 2019. [Google Scholar] [CrossRef]
- Käser, D.P.; Parker, E.; Glazier, A.; Podwal, M.; Seegmiller, M.; Wang, C.P.; Karlsson, P.; Ashkenazi, N.; Kim, J.; Le, A.; et al. The making of Google Earth VR. In Proceedings of the ACM SIGGRAPH 2017 Talks, New York, NY, USA, 30 July–3 August 2017. [Google Scholar] [CrossRef]
- Belisle, B. Whole world within reach: Google Earth VR. J. Vis. Cult. 2020, 19, 112–136. [Google Scholar] [CrossRef]
- Sharpe, R.; Warnicke, E.; Lamping, U.L. Wireshark User’s Guide. Available online: https://www.wireshark.org/docs/wsug_html/ (accessed on 28 July 2023).
- The Pandas Development Team. Pandas-dev/pandas: Pandas. Zenodo 2020, 21, 1–9. [Google Scholar] [CrossRef]
- Polupanova, M. Dataset of VR Traffic Measurements, 2023. Figshare. Dataset. Available online: https://figshare.com/articles/dataset/Dataset_of_VR_traffic_measurements/22191160 (accessed on 16 August 2023).
Figure 1.
Lab setup.
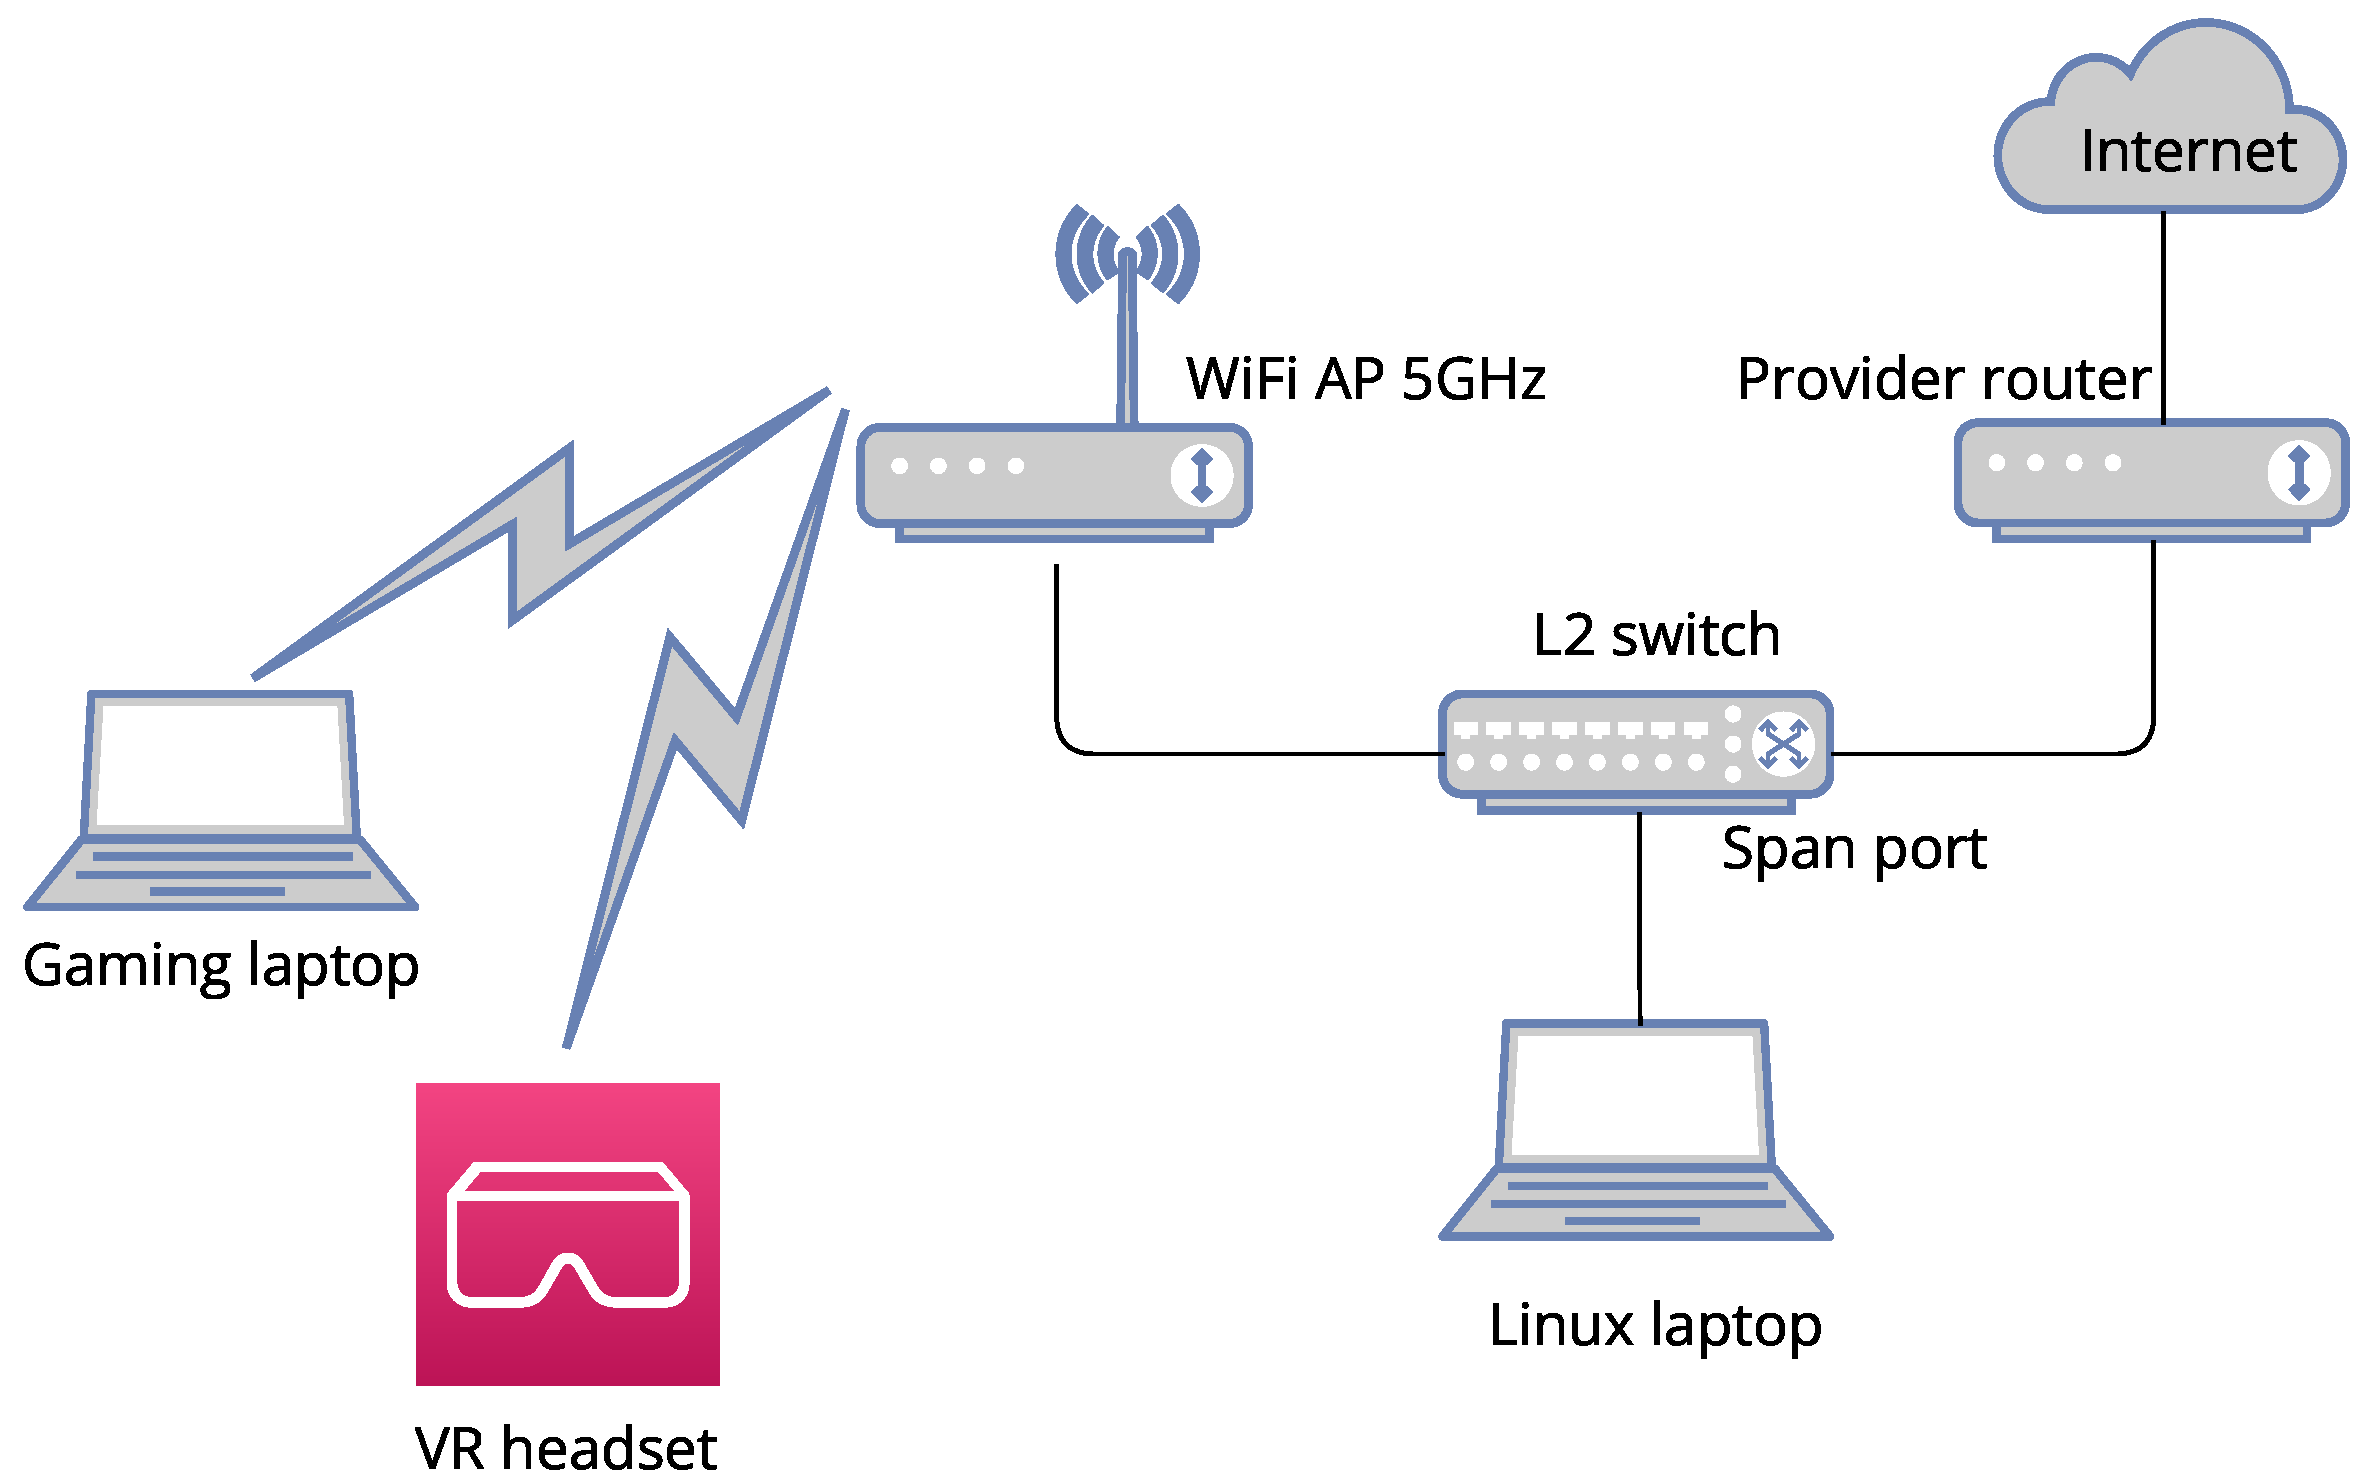
Figure 6.
VR Chat traffic.

Figure 7.
CDF for downlink and uplink of 5 measured activities. (a) CDF for downlink traffic Half-Life: Alyx, Rec Room, Beat Saber, (b) CDF for downlink traffic for Google Earth and VR Chat, (c) CDF for uplink for all presented activities.
Figure 7.
CDF for downlink and uplink of 5 measured activities. (a) CDF for downlink traffic Half-Life: Alyx, Rec Room, Beat Saber, (b) CDF for downlink traffic for Google Earth and VR Chat, (c) CDF for uplink for all presented activities.

Figure 8.
CDF for 3 gameplays of Half-Life: Alyx. (a) Downlink CDF, (b) Uplink CDF.
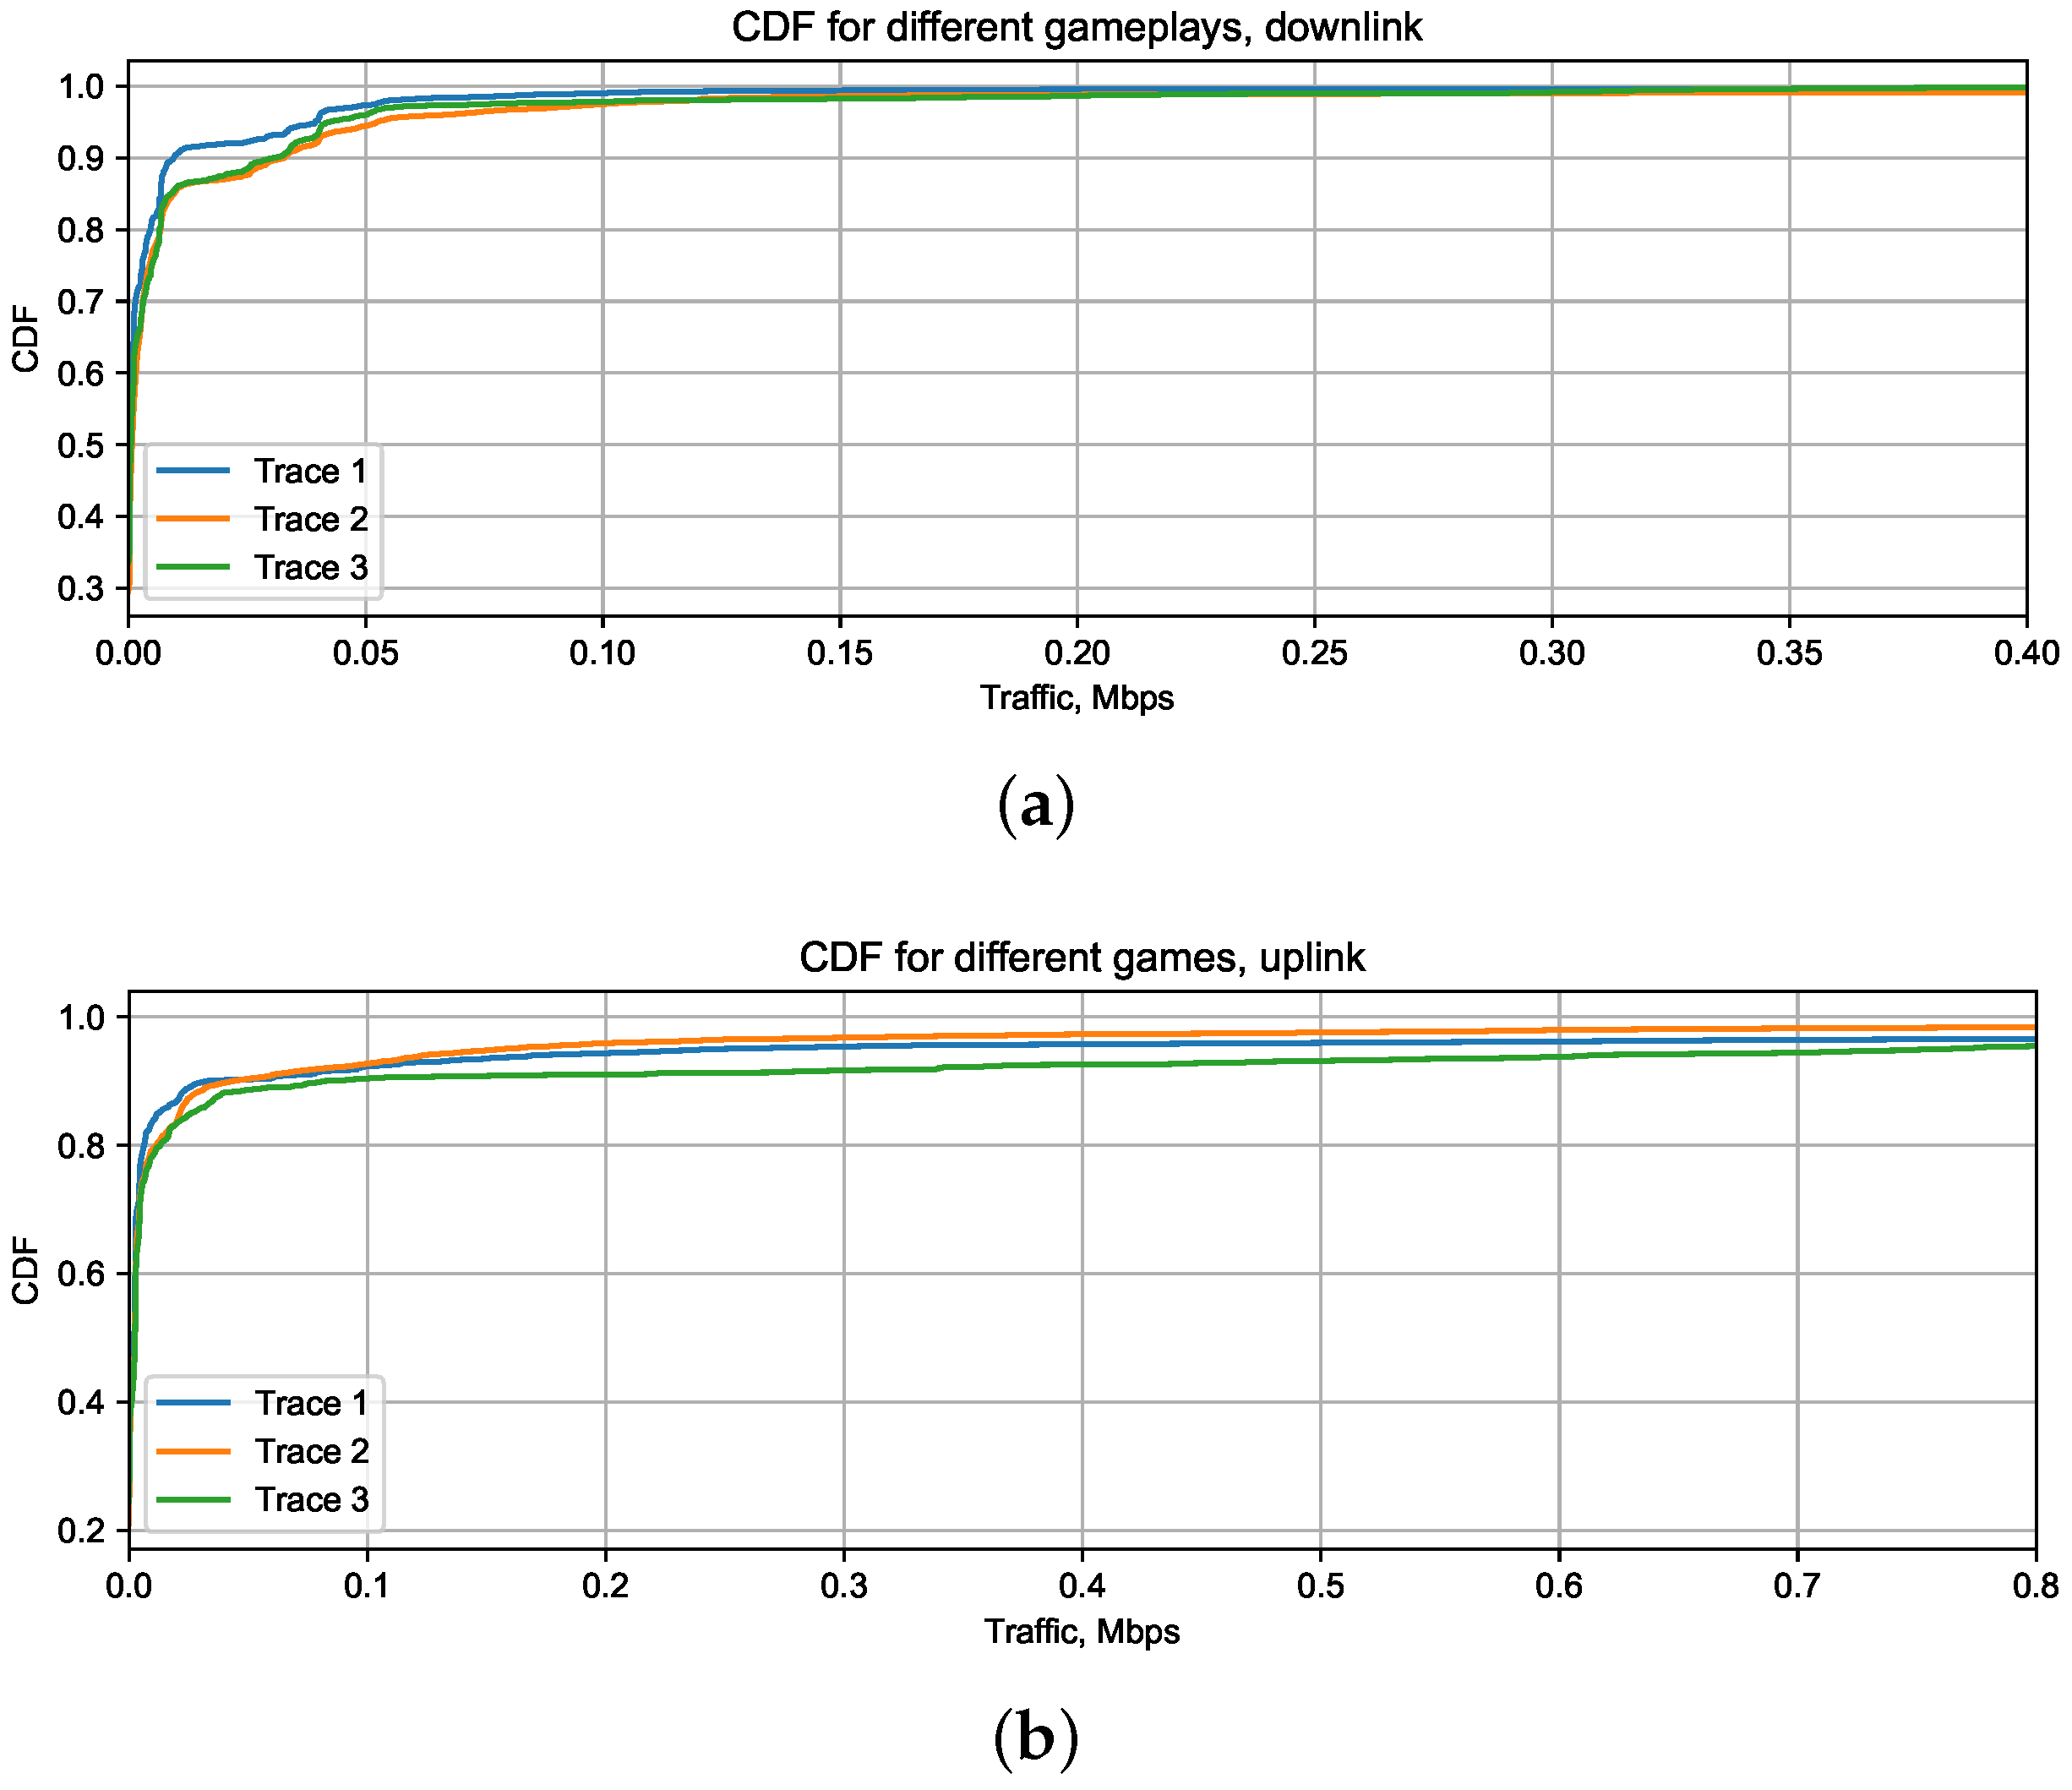
Figure 9.
Effect of changing the bandwidth for Beat Saber.

Figure 10.
CDF comparison for different trace lengths. (a) Beat Saber, packet size, (b) Beat Saber, inter-packet time, (c) Half-Life: Alyx, packet size, (d) Half-Life: Alyx, inter-packet time.
Figure 10.
CDF comparison for different trace lengths. (a) Beat Saber, packet size, (b) Beat Saber, inter-packet time, (c) Half-Life: Alyx, packet size, (d) Half-Life: Alyx, inter-packet time.


Table 1.
Dataset content.
| Activity Name | Name of File | Duration (s) | Scenario |
|---|---|---|---|
| Half-Life: Alyx | half-life_Trace1.csv | 4570 | Normal scenario |
| Half-Life: Alyx | half-life_Trace2.csv | 5820 | Bandwidth limiting scenario |
| Half-Life: Alyx | half-life_Trace3.csv | 1651 | Latency introduction scenario |
| Beat Saber | beat_saber_Trace1.csv | 2820 | Normal scenario |
| Beat Saber | beat_saber_speed_limit.csv | 1310 | Bandwidth limiting scenario |
| Google Earth | google_earth.csv | 1922 | Normal scenario |
| Rec Room | rec_room_Trace1.csv | 2563 | First launch of the game |
| Rec Room | rec_room_Trace2.csv | 1000 | Second launch of the game |
| VR Chat | vr_chat.csv | 2083 | Normal scenario |
Table 2.
Columns of the resulting dataset files.
| Name of the Field | Data Type | Content of the Field |
|---|---|---|
| Time | Numeric, Float | Relative arrival time of a certain packet from start of the TShark capture. |
| Protocol | Text field | Protocol name for a certain packet. |
| TCP Segment Len | Numeric, Integer | TCP segment length in case if the transport layer protocol for the packet is TCP. For UDP packets this value equals 0. |
| UDP length | Numeric, Integer | UDP segment length in case if the transport layer protocol for the packet is UDP. For TCP packets this value equals 0. |
| Link | Text field | Derived indicator field, showing whether the traffic is uplink or downlink and if it comes from headset or PC. |
Table 3.
Checkpoints of traces used for CDF plotting.
| Trace | Start Time, s | End Time, s |
|---|---|---|
| Half-Life: Alyx, Trace 1 | 500 | 4570 |
| Google Earth | 400 | 1850 |
| VR Chat | 850 | 2083 |
| Beat Saber, Trace 1 | 400 | 2820 |
| Rec Room | 1200 | 2400 |
Table 4.
Traffic share and size of packet for different protocols, downlink.
| Protocol | Traffic Share, % | Average Packet Size, Byte | ||||||||
|---|---|---|---|---|---|---|---|---|---|---|
| Half Life: Alyx | Google Earth | Rec Room | Beat Saber | VR Chat | Half Life: Alyx | Google Earth | Rec Room | Beat Saber | VR Chat | |
| HTTP | 0.12% | <0.01% | 262.25 | 206.13 | ||||||
| QUIC | 0.18% | <0.01% | 305.74 | 340.70 | ||||||
| SSLv2 | 0.1% | <0.01% | <0.01% | 935.50 | 1412.00 | 1428.00 | ||||
| TCP | 42.03% | 18.52% | 0.46% | 0.68% | 37.18% | 120.11 | 1065.46 | 71.65 | 50.75 | 1337.03 |
| TLSv1 | 0.07% | 0.01% | 933.00 | 386.61 | ||||||
| TLSv1.2 | 40.13% | 81.42% | 1.23% | 1.02% | 60.27% | 351.81 | 1354.7 | 357.02 | 182.38 | 1399.20 |
| TLSv1.3 | 10.13% | 0.02% | 0.28% | 1.57% | 0.05% | 253.56 | 539.69 | 639.16 | 436.32 | 534.63 |
| UDP | 7.24% | 0.04% | 98.03% | 96.73% | 2.50% | 450.58 | 422.22 | 482.03 | 209.11 | 493.45 |
| SSL | <0.01% | 95.00 | ||||||||
Table 5.
Traffic share and size of packet for different protocols, uplink.
| Protocol | Traffic Share, % | Average Packet Size, Byte | ||||||||
|---|---|---|---|---|---|---|---|---|---|---|
| Half Life: Alyx | Google Earth | Rec Room | Beat Saber | VR Chat | Half Life: Alyx | Google Earth | Rec Room | Beat Saber | VR Chat | |
| HTTP | 0.02% | 0.01% | 299.04 | 293.30 | ||||||
| MDNS | 0.84% | 0.62% | 158.89 | 159.00 | ||||||
| QUIC | 0.04% | 0.03% | 458.94 | 461.09 | ||||||
| SDDP | 0.06% | 0.05% | 183.00 | 180.76 | ||||||
| TCP | 88.56% | 35.85% | 36.82% | 30.50% | 48.91% | 1059.09 | 18.94 | 777.16 | 843.89 | 57.36 |
| TLSv1 | <0.01% | 0.03% | 222.67 | 74.00 | ||||||
| TLSv1.2 | 7.06% | 58.78% | 3.27% | 1.04% | 12.82% | 489.68 | 222.13 | 274.61 | 209.69 | 236.97 |
| TLSv1.3 | 2.87% | 3.56% | 3.48% | 3.47% | 5.18% | 529.71 | 916.29 | 961.04 | 740.45 | 852.91 |
| UDP | 0.56% | 1.07% | 56.43% | 65.00% | 33.07% | 262.64 | 198.20 | 222.84 | 109.48 | 288.25 |
| SSL | 0.05% | 221.88 | ||||||||
Table 6.
Uplink share of overall trace traffic.
| Trace | Uplink Share of Overall Trace Traffic |
|---|---|
| Half-Life: Alyx, Trace 1 | 88.5% |
| Google Earth | 1.5% |
| VR Chat | 1.9% |
| Beat Saber, Trace 1 | 45.1% |
| Rec Room | 21.7% |
Disclaimer/Publisher’s Note: The statements, opinions and data contained in all publications are solely those of the individual author(s) and contributor(s) and not of MDPI and/or the editor(s). MDPI and/or the editor(s) disclaim responsibility for any injury to people or property resulting from any ideas, methods, instructions or products referred to in the content. |
© 2023 by the author. Licensee MDPI, Basel, Switzerland. This article is an open access article distributed under the terms and conditions of the Creative Commons Attribution (CC BY) license (https://creativecommons.org/licenses/by/4.0/).
Share and Cite
MDPI and ACS Style
Polupanova, M. VR Traffic Dataset on Broad Range of End-User Activities. Data 2023, 8, 132. https://doi.org/10.3390/data8080132
AMA Style
Polupanova M. VR Traffic Dataset on Broad Range of End-User Activities. Data. 2023; 8(8):132. https://doi.org/10.3390/data8080132
Chicago/Turabian StylePolupanova, Marina. 2023. "VR Traffic Dataset on Broad Range of End-User Activities" Data 8, no. 8: 132. https://doi.org/10.3390/data8080132