Data Descriptor

A Dataset for Studying the Relationship between Human and Smart Devices

1
Department of Information Systems and Operations Management, Tilburg School of Economics and Management, Tilburg University, Warandelaan 2, 5037 AB Tilburg, The Netherlands
2
Section of Psychology, Health, and Technology, Department of Technology, Human and Institutional Behavior, Faculty of Behavioral, Management and Social Sciences, University of Twente, Drienerlolaan 5, 7522 NB Enschede, The Netherlands
*
Author to whom correspondence should be addressed.
Submission received: 15 February 2024 / Revised: 2 April 2024 / Accepted: 9 April 2024 / Published: 11 April 2024

Abstract

:
This dataset reports the responses to a survey designed for investigating the relationship that humans have with their smart devices. The dataset was collected between May and July 2020 and is a sample of over 500 respondents of various ethnicities and backgrounds. These data were used for modeling the ways that people relate to their devices using the notion of agency. However, the data can be used for complementing any study that intends to investigate a tool-mediated communication from the perspective of users, applying a variety of beliefs, attitudes, and expectations that users have in relation to their devices and themselves. This article presents the survey items as well as some preliminary data insights. The collected data were in English and the responses were anonymized to ensure GDPR compliance. The data were stored in a .csv file containing the respondents’ answers to the questions.

1. Introduction

Smart devices have become integral to modern life, shaping the way individuals communicate, work, and navigate daily tasks.
This study explores users’ notions of their interactions with smart devices, with a particular emphasis on the socio-technical aspects inherent in these interactions. By leveraging data collected through surveys distributed between May and July 2020, amidst the COVID-19 outbreak, we delve into users’ perceptions and experiences regarding their engagement with smart devices. The survey, distributed through the authors’ personal and professional networks, attracted responses from a diverse group of individuals worldwide, predominantly comprising highly educated professionals.
In this context, understanding users’ perspectives on their interactions with smart devices becomes paramount for designing effective and user-centric technologies.
The dataset, stored in compliance with GDPR regulations at the University of Tilburg, consists of responses from 587 participants, after filtering out incomplete responses. While acknowledging the limitations of our sample, which predominantly comprises approximately of 50% tech-savvy and 50% non-technical individuals, we can provide unique insights into the perceptions of users deeply embedded in technology-rich environments.
Participants were prompted to select a single smart device, such as a smartphone, smartwatch, etc. to reflect upon in their responses, enabling a focused examination of interactions with specific devices. Moreover, participants were given the opportunity to express interest in follow-up interviews, offering richer qualitative insights into their experiences with smart devices.
In this paper, we provide an overview of the dataset and its collection process, emphasizing its potential for fostering future research and collaborations in the field of HCI and socio-technical systems. By sharing this dataset with the scientific community, we aim to promote transparency, reproducibility, and the further exploration of users’ interactions with smart devices in diverse contexts.
The rest of the paper is organized as follows: Section 2 summarizes the core information about the dataset. Section 3 discusses possible additional uses of the data. Section 4 provides a description of each field contained in the dataset. Section 5 gives a detailed description of the data collection procedure. Finally, Section 6 summarizes this study.

2. Specification Table of the Dataset

This sections summarize all the information related to the dataset in a tabular manner in order to offer an easy access to all the relevant characteristic of the dataset in Table 1.

3. Value of the Data

The datasets records the responses of a widespread group of respondents on a variety of items reflecting both more established and newer constructs relevant to human–technology interactions.
The following examples delineate potential applications and insights that could be derived from the dataset, serving as avenues for research and exploration within the realm of human–technology interactions:
Understanding User Preferences: Researchers can analyze the dataset to gain insights into users’ preferences regarding smart devices. By examining responses to questions related to device features, design elements, and user experiences, researchers can identify patterns and trends in user preferences. This information can inform the design and development of future smart devices, ensuring that they align with user expectations and needs.
Exploring Anthropomorphism: The dataset includes responses on anthropomorphism, or the tendency to attribute human-like qualities to smart devices. Researchers can explore how users perceive their devices in terms of personality traits, emotions, and social interactions. This analysis can shed light on the psychological factors influencing user–device relationships and guide efforts to design more emotionally intelligent and socially aware technologies.
Investigating User Agency: Given the emphasis on the notion of agency in the survey, researchers can delve deeper into how users perceive their level of control and autonomy when interacting with smart devices. By examining responses related to decision-making, empowerment, and autonomy, researchers can gain insights into users’ sense of agency in their interactions with technology. This understanding can inform the design of interfaces and interaction paradigms that support user agency and empowerment.
Examining Socio-Technical Dynamics: The dataset offers an opportunity to explore the socio-technical dynamics of human–device interactions. Researchers can analyze how social and environmental factors influence users’ perceptions and behaviors regarding smart devices. By examining responses related to social contexts, cultural influences, and environmental factors, researchers can uncover the complex interplay between technology and society, informing strategies for designing technology that aligns with societal values and norms.
Segmentation Analysis: The dataset includes background qualifier questions that enable segmentation analysis based on factors such as education level, ethnic background, and professional expertise. Researchers can segment the data to examine how different demographic groups perceive and interact with smart devices. This analysis can provide valuable insights into the diversity of user experiences and preferences, guiding efforts to design inclusive and accessible technologies.
Comparative Studies: Researchers can use the dataset to conduct comparative studies with other datasets or research findings in the field of human–computer interaction (HCI) and related disciplines. By comparing responses across different datasets or studies, researchers can identify commonalities, discrepancies, and emerging trends in users’ perceptions and interactions with smart devices. This comparative analysis can contribute to a deeper understanding of user–device relationships and inform future research directions in the field.
Overall, the dataset presents a rich source of information for researchers interested in exploring various aspects of human–technology interaction, ranging from user preferences and anthropomorphism to user agency and socio-technical dynamics. By leveraging this dataset, researchers can advance our understanding of how humans relate to and interact with smart devices, ultimately contributing to the development of more user-centric and socially responsible technologies.

4. Data Description

Smart technologies are increasing becoming an integral part of our professional and private lives [4]. We collected a dataset with the aim of investigating the relationship and interactions people have with their devices. The survey leverages a number of key concepts in the literature describing human–technology interactions, especially the notion of agency [5].
Data were originally obtained from 809 participants. After removing all the incomplete surveys (i.e., respondents that did not answer all questions), the final dataset included 587 cases.
The data were collected in an anonymous form and in compliance with GDPR. Therefore, we cannot assume that an incomplete survey implies that the respondent dropped out. The same individual could have completed the survey using multiple devices or on a different day or in different browser sessions. Consequently, we can conclude that the dropout rate is somewhere between 0% and 27% (809 initial participants vs. 587 completed surveys).
The dataset contains both complete and incomplete surveys, as they may both be useful for further analysis. We did not observe any particular pattern in the background variables of the people who dropped out. Consequently, we can assume that the dropout rate in normal ranges, is also uniform among the population and is not injecting any bias into the sample. Finally, because the survey was distributed via the authors’ personal and professional networks, the sample constitutes highly educated professionals, many of which are very familiar with technology. This may affect the generalizability of our results but, at the same time, provides a unique look into the attitudes and beliefs of a very specific group of users toward smart devices. For example, 38.3% of the respondents are professors. In addition, 53.7% work in informatics, computer science, or computer engineering, and 83% of the respondents say they have professional knowledge of one or more of the following disciplines:
  • Internet of Things;
  • Human–computer interaction;
  • Artificial intelligence;
  • Big data;
  • Requirement engineering.
Finally, 68.9% of the respondents were male and 29.9% were female.
The dataset was provided in a convenient .csv format, facilitating easy importation into Excel, as well as popular data analysis software such as SPSS 26 to 29 and R.4.3.3.
Structured for clarity and accessibility. The file is organized as follows:
  • Each column corresponds to a specific survey question.
  • The first row of each column serves as a unique identifier for the question.
  • The second row presents the question as it was presented to participants during the survey.
  • Responses from participants are shown in the third row.
  • Responses are encoded using a Likert scale and stored as numerical values.
Additionally, the dataset is accompanied by two supplementary files for a comprehensive understanding and utilization:
  • Data_Publication_Package.pdf: This document contains meta-information detailing the original intent of the study, along with ethical approval obtained from Tilburg University.
  • Survey_UserRelationshipWithTheirSmartDevice.pdf: Presented as a PDF file, this document provides the complete survey questionnaire for reference purposes. It also includes a mapping between the questions and their corresponding answers, enhancing clarity and facilitating efficient data analysis.
Figure 1 presents a snapshot of the survey layout, offering insights into the questionnaire’s structure and design.
The dataset and its supplementary files will be stored in DataverseNL for a period of more than 10 years as prescribed by GDPR laws.

5. Experimental Design, Materials and Methods

Invitations to take the survey were collected by contacting participants via the authors’ professional and personal networks and by active use of social media. Below is an example of the email invitation used:
Hello,
I am Prof. Francesco Lelli (*) and together with Dr. Heidi Toivonen (**) we are running a multidisciplinary research on human-smart devices interaction.
We are inviting you to take part in a little survey regarding your relationship with smart devices. In doing this survey, you will be able to reflect on how you relate to technology, while contributing to a study that aims to foster a deeper understanding of human interaction with personal smart devices that are becoming a more and more pervasive element of our everyday life.
We sincerely appreciate your support and collaboration.
Completing the survey will take you no more than 5 min.
Follow this link to the Survey: <link to the survey>
Or copy and paste the URL below into your internet browser: <link to the survey>
You are also welcome to forward this invitation to anybody you think may be interested in participating in this research.
Obviously, you are very welcome to contact us if you have any questions by replying to this email. In addition, if you have done work that you believe is relevant for this research, please get in touch. We look forward to learning from you!
All the Best,
Francesco Lelli and Heidi Toivonen
(*) Doing research on Internet of Things and Information Management, more info at: https://francescolelli.info/
(**) Doing research on agency in the field of Psychology, more info at http://www.heiditoivonen.com
The message was sent only once, without reminders or additional requests to finish uncompleted surveys.
If the candidate decided to take part to the survey, he/she had to agree to the following informed consent:
Thanks for your interest in taking this research survey.
We are conducting this study with the aim of improving the relationship that we human beings have with our gadgets.
This survey is anonymous (unless you want to give us your email), but we will collect some information about you in order to segment our population.
For scientific integrity, we securely store this data for at least 10 years and might share the data with other scientific researchers or for other scientific research purposes.
We respect your trust and protect your privacy, and therefore will make sure that the data will not identify you.
Participation in this research study is completely voluntary. You have the right to withdraw at any time or refuse to participate entirely. If you desire to withdraw, please simply close your internet browser.
You also have the right, in principle, to request access to and rectification, erasure, restriction of or object to the processing of the personal data. More information can be found on the website of Tilburg University: www.tilburguniversity.edu/privacy
If you have any questions or change your mind, contact us at [email protected]
The survey started with a section on the dimensions of user agency and device agency, for which a total of 16 items were designed as follows.
High user agency was measured with the following questions:
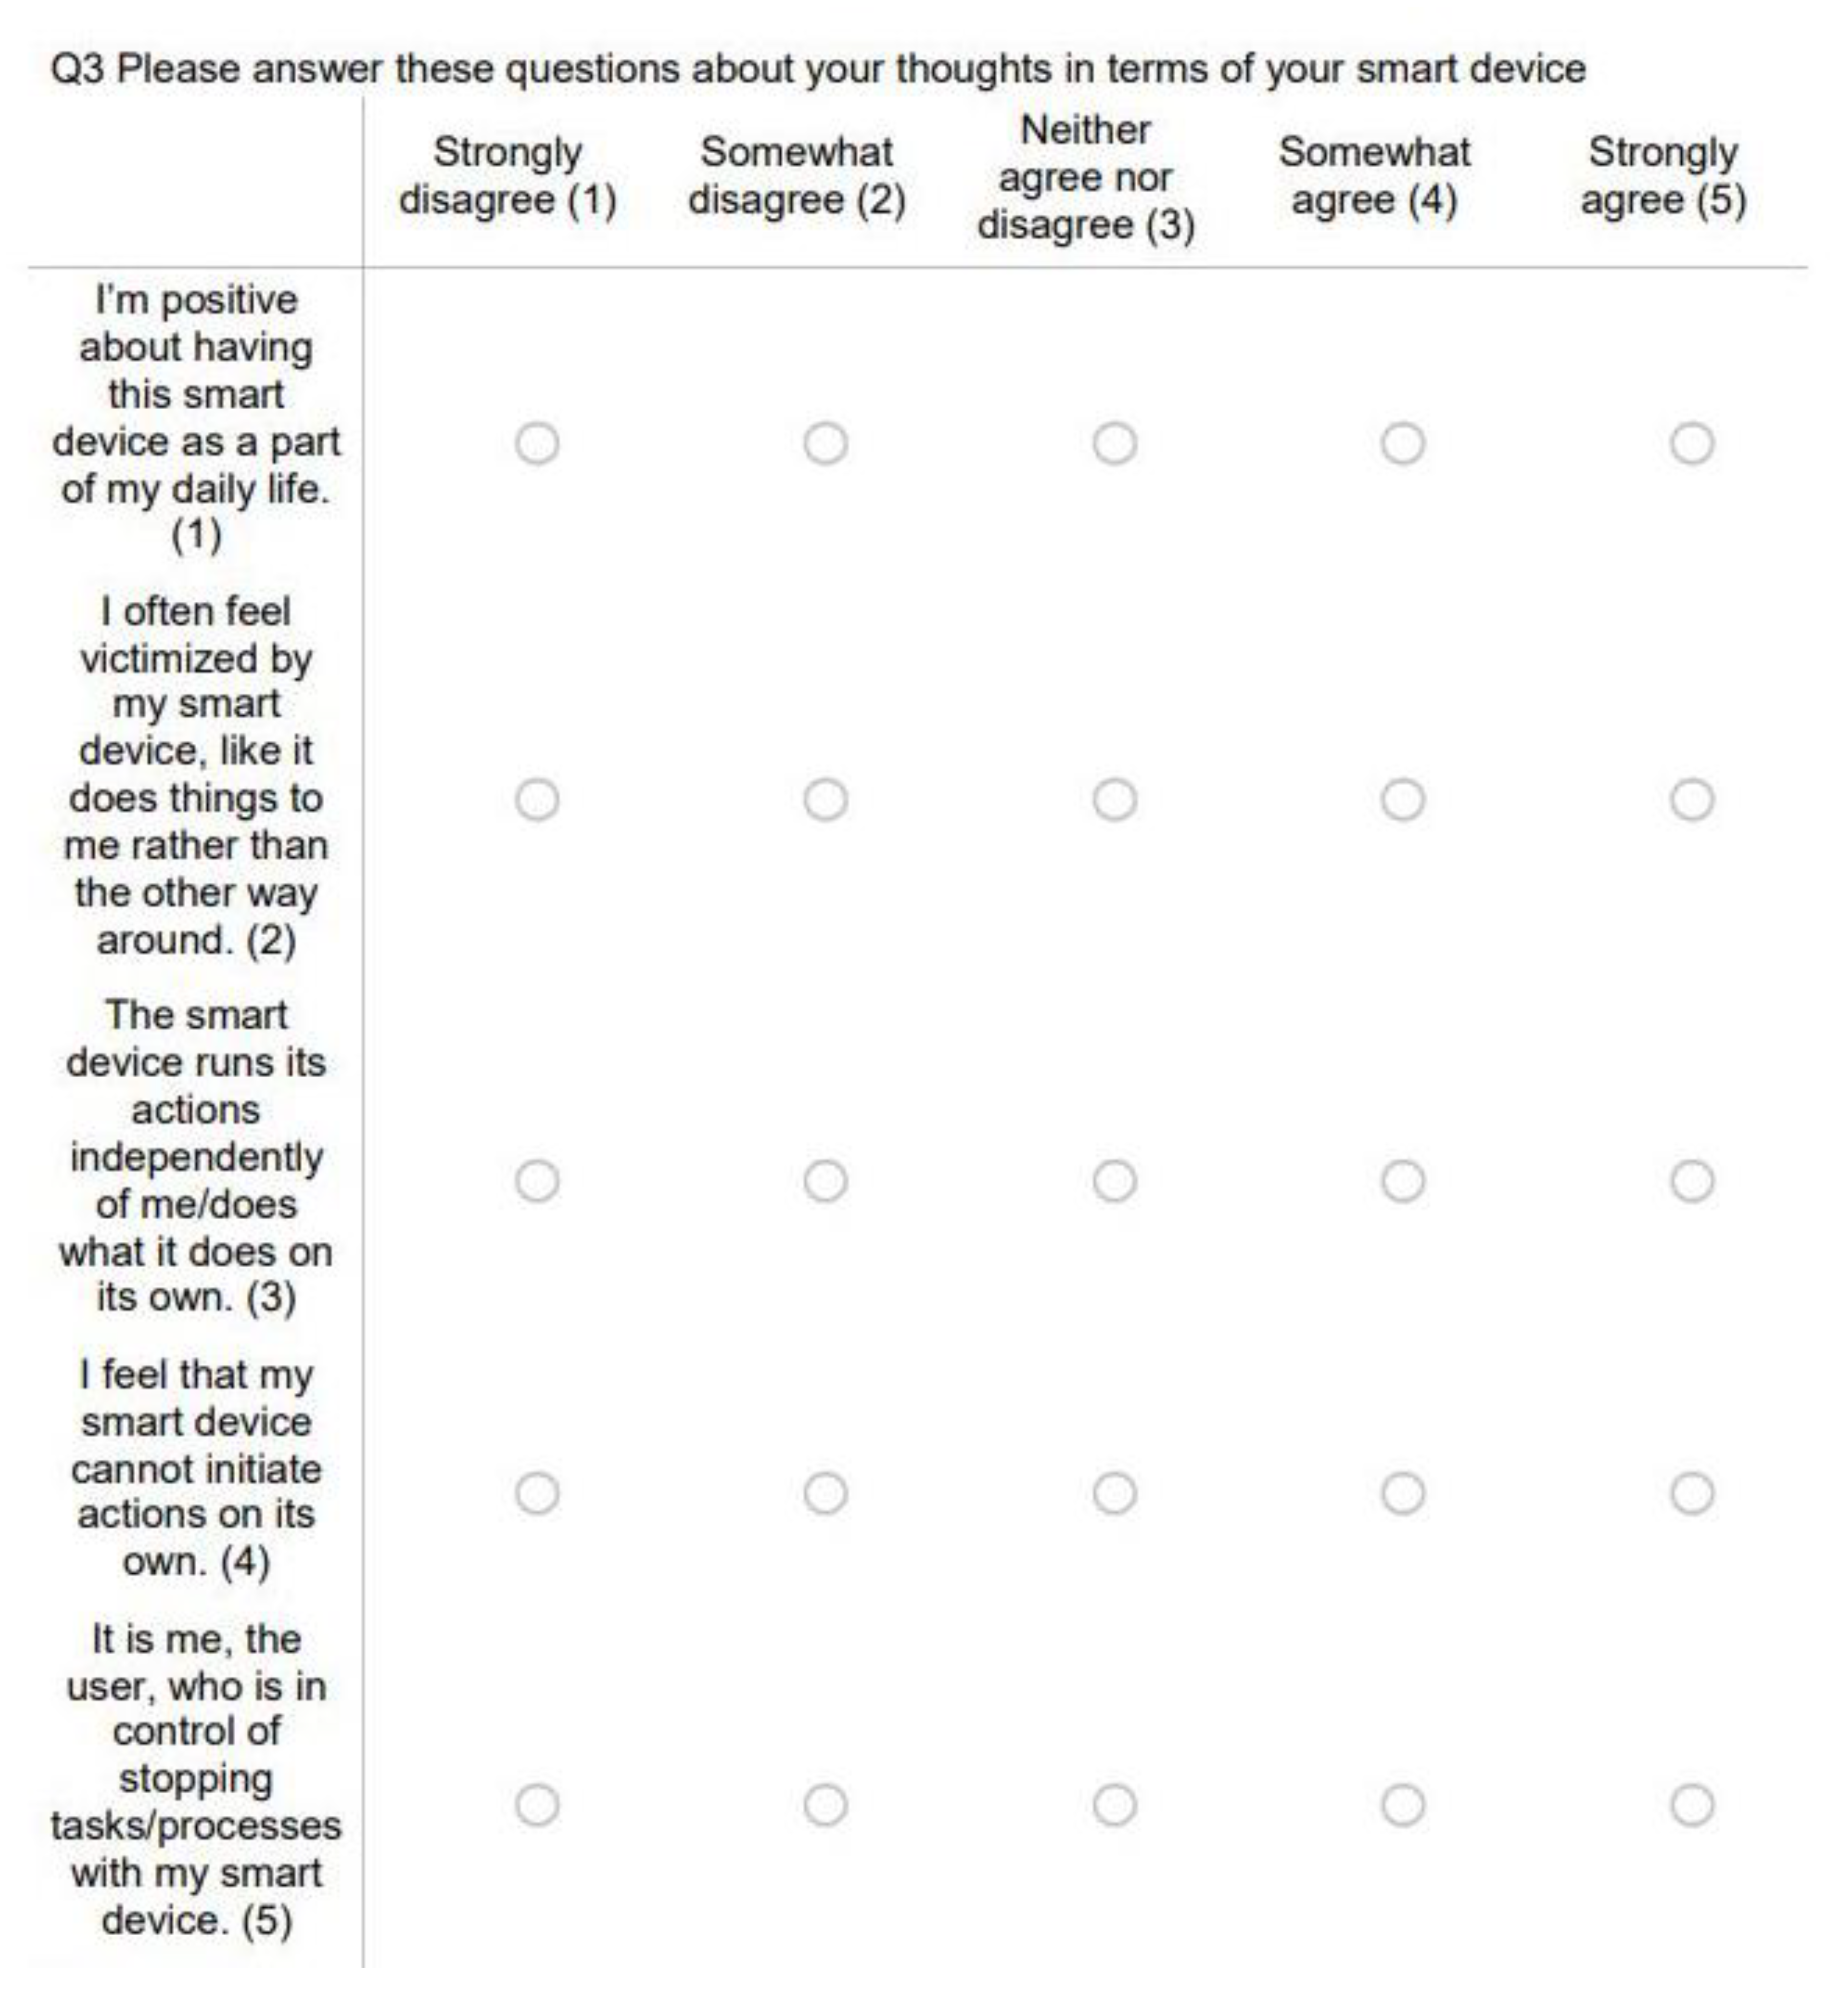
  • Q_1 I’m positive about having this smart device as a part of my daily life;
  • Q_5 It is me, the user, who is in control of stopping tasks/processes with my smart device;
  • Q_9 I understand how this smart device works;
  • Q_13 I am using this smart device to execute task(s) that I have freely chosen.
  • Low user agency was measured with:
  • Q_2 I often feel victimized by my smart device, like it does things to me rather than the other way around;
  • Q_6 I am not able to change the way I do things if my smart device is involved; it forces a certain process on me;
  • Q_10 I have often had a less than ideal way of using my smart device in the past;
  • Q_14 I often think that I cannot really use my smart device to achieve the things I want.
High device agency was measured with:
  • Q_3 The smart device runs its actions independently of me/does what it does on its own;
  • Q_8 My smart device has intelligence and understanding of its own, independent of me;
  • Q_11 My smart device is a true active participant in the interaction I have with it;
  • Q_15 Certain things are performed better by my smart device than by me.
  • Low device agency was measured with:
  • Q_4 I feel that my smart device cannot initiate actions on its own;
  • Q_7 This smart device cannot independently change the course in how a task is completed;
  • Q_12 My smart device is fundamentally dependent on me, the human user;
  • Q_16 My smart device is not really helpful in getting things done.
We also developed scales for other constructs and elements that HCI and other scholars have considered relevant in characterizing human interaction with (technological) objects. These scales include:
  • Usability, the pragmatic attributes, or functionality of the device [6,7,8];
  • Cost-effectiveness or price utility and the perceived efficient use of money [9];
  • Self-extension or identification with the device [7,10];
  • The social aspect of devices, such as social status or social self-image expression [7,8,9] and the device’s capacity to enhance the user’s social relationships [10];
  • The emotional aspects of using the device, such as joy or aesthetic pleasure [7,8];
  • Anthropomorphism: attributing human-like qualities to the device [11,12].
All constructs were measured using multi-item scales designed for the purposes of this study. The survey also included a set of questions for prequalifying and segmenting the population, including items concerning the respondents’ gender, age, education, and professional background.
The dataset contains the entire collection of questions and all the answers in an anonymous form.
The dataset is suitable for statistical analysis and for exploratory research in particular, as the authors discussed in [1,2,3]. The full dataset is available under a Creative Commons License and shown in [13].

6. Conclusions

As smart devices continue to permeate various aspects of daily life, understanding users’ perceptions and experiences with these technologies is essential for designing effective and user-centric systems. This study provides valuable insights into users’ notions of their interactions with smart devices, with a particular emphasis on the socio-technical dimensions inherent in these interactions.
By leveraging a dataset comprising responses from 587 participants, collected between May and July 2020, researchers can gain a refined understanding of how individuals engage with smart devices in a range diverse contexts. While acknowledging the limitations of our sample, which predominantly consists of both tech-savvy and non-technical individuals, we have highlighted the unique insights it offers into the perceptions of users deeply involved in technology-rich environments.
Researchers can utilize this dataset to delve deeper into specific aspects of smart device usage, exploring additional dimensions and uncovering new insights. Moreover, the comprehensive description of the data collection procedure and dataset fields provided in this paper serves as a reference resource for researchers interested in leveraging this dataset for their own investigations.
In conclusion, this study contributes to the growing body of knowledge on users’ interactions with smart devices, underscoring the importance of considering socio-technical perspectives in the design and development of future technologies.

Author Contributions

F.L.: conceptualizations, survey design, survey distribution, writing, reviewing and editing. H.T.: literature review, conceptualizations, survey design, writing. All authors have read and agreed to the published version of the manuscript.

Funding

This research received no external funding.

Institutional Review Board Statement

This study was approved by the ethics committee of Tilburg University. In particular, this research has the approval of IRB of TiSEM (IRB EXE 2020-007) as indicated in the submission form version 1, which was submitted on 20 April 2020. Standard Research Protocol (IRB SRP-2).

Informed Consent Statement

We collected the informed consent at the beginning of the survey following the standard research protocol IRB SRP-2.

Data Availability Statement

Data and metadata are available in [13].

Conflicts of Interest

The authors declare that they have no known competing financial interests, personal relationships, or other affiliations that would have influenced the research reported in this article. No third-party financial support was received for the work in this article.

References

  1. Toivonen, H.; Lelli, F.; Agency in Human-Smart Device Relationships: An Exploratory Study. In PACIS 2021 Article 164 Association for Information Systems. 2021. Available online: https://aisel.aisnet.org/pacis2021/145 (accessed on 14 February 2024).
  2. Enughwure, A.A.; Lelli, F. On Developing Human Centric Digital Twins in Industry 4.0 and Beyond. In Proceedings of the Interoperability for Enterprise Systems and Applications Workshops, Valencia, Spain, 23–25 March 2022; CEUR Workshop Proceedings. Zelm, M., Boza, A., Leon, R.-D., Rodriguez-Rodriguez, R., Eds.; RWTH Aachen: Aachen, Germany, 2022; Volume 3214. [Google Scholar]
  3. Toivonen, H.; Lelli, F. The Varieties of Agency in Human–Smart Device Relationships: The Four Agency Profiles. Future Internet 2024, 16, 90. [Google Scholar] [CrossRef]
  4. Lelli, F. Interoperability of the Time of Industry 4.0 and the Internet of Things. Future Internet 2019, 11, 36. [Google Scholar] [CrossRef]
  5. Toivonen, H. Constructions of Agency and Nonagency in Psychotherapy: The 10 Discursive Tools Model. Ph.D. Thesis, Department of Psychology, University of Jyväskylä, Jyväskylä, Finland, 2019. Available online: https://jyx.jyu.fi/handle/123456789/65808 (accessed on 14 February 2024).
  6. Dillon, A. Beyond usability: Process, outcome and affect in human-computer interactions. Can. J. Libr. Inf. Sci. 2002, 26, 57–69. [Google Scholar]
  7. Hassenzahl, M. The Interplay of Beauty, Goodness, and Usability in Interactive Products. Hum. Comput. Interact. 2004, 19, 319–349. [Google Scholar] [CrossRef]
  8. Shin, D.-H. Cross-analysis of usability and aesthetic in smart devices: What influences users’ preferences? Cross Cult. Manag. 2012, 19, 563–587. [Google Scholar] [CrossRef]
  9. Kim, H.-W.; Gupta, S.; Koh, J. Investigating the intention to purchase digital items in social networking communities: A customer value perspective. Inf. Manag. 2011, 48, 228–234. [Google Scholar] [CrossRef]
  10. Belk, R.W. Possessions and the Extended Self. J. Consum. Res. 1988, 15, 139–168. [Google Scholar] [CrossRef]
  11. Waytz, A.; Heafner, J.; Epley, N. The mind in the machine: Anthropomorphism increases trust in an autonomous vehicle. J. Exp. Soc. Psychol. 2014, 52, 113–117. [Google Scholar] [CrossRef]
  12. Novak, T.P.; Hoffman, D.L. Relationship journeys in the internet of things: A new framework for understanding interactions between consumers and smart objects. J. Acad. Mark. Sci. 2019, 47, 216–237. [Google Scholar] [CrossRef]
  13. Lelli, F.; Toivonen, H. A Survey for Investigating Human and Smart Devices Relationships. DataverseNL, V1. 2021. Available online: https://doi.org/10.34894/TRAONY (accessed on 14 February 2024).
Figure 1. Snapshot of the survey. The circles refers to placeholders where the user could specify his/her preference from strongly disagree (1) to Strongly agree (5).
Data 09 00056 g001
Table 1. Tabular description of all the information related to the dataset.
SubjectHuman–computer Interaction/Agency/Socio-Technical systems
Specific subject areaUsers’ notions of their interactions with smart devices.
Type of dataMicrosoft Excel comma separated value document (.csv)
How data were acquiredSurvey
Data formatRaw
Parameters for data collectionBackground: the data were collected between May and July 2020 during the COVID-19 outbreak. The survey was distributed in the authors’ professional and personal networks and was open to all interested participants. Background information on the participants was collected (educational and professional background, age, gender, etc.) to enable categorizing the users’ responses.
Description of data collectionThe data were collected with Qualtrics in an anonymous format and stored at the University of Tilburg in compliance with GDPR laws. The data will be available for the scientific community over the next 10 years in order to ensure the reproducibility of results as well as promoting future collaborations.
As a part of the survey, the respondents were asked about their interest in taking part in an interview about their smart device use.
Data were originally obtained from 809 participants. After removing all respondents that did not answer all questions, the final dataset comprised 587 cases. Because the survey was distributed via the authors’ personal and professional networks, the sample is constituted of highly educated professionals, many of whom can be considered remarkably familiar with technology. This naturally affects the generalizability of our results but, on the other hand, provides a unique look into the way that such tech-savvy users perceive their devices and their interactions with them. In the survey, we asked the respondents to choose one smart device and keep it in mind while answering the questions. In the case that the respondent did not own any other smart device, they were encouraged to choose their computer or mobile phone.
Data source locationWorldwide
Data accessibilityRepository name: DataverseNL
Data identification number: doi 10.34894/TRAONY
Direct URL to data: https://doi.org/10.34894/TRAONY (accessed on 14 February 2024)
Instructions for accessing these data: the data are open access
The data are publicly available by accessing the URL. Additional clarifications, if needed, can be obtained by contacting the corresponding author of this article as well as the data protection officers assigned to the dataset.
Related research articleThe dataset has been already used for conducting research in the areas of Human Computer Interaction, User Behavior analysis and Agency. Some of the results have been published in [1,2,3].
Disclaimer/Publisher’s Note: The statements, opinions and data contained in all publications are solely those of the individual author(s) and contributor(s) and not of MDPI and/or the editor(s). MDPI and/or the editor(s) disclaim responsibility for any injury to people or property resulting from any ideas, methods, instructions or products referred to in the content.

