Article

Characterization of Global DNA Methylation in Different Gene Regions Reveals Candidate Biomarkers in Pigs with High and Low Levels of Boar Taint

Quantitative Genomics, Bioinformatics and Computational Biology Group, Department of Applied Mathematics and Computer Science, Technical University of Denmark, 2800 Kongens Lyngby, Denmark
*
Author to whom correspondence should be addressed.
Vet. Sci. 2020, 7(2), 77; https://doi.org/10.3390/vetsci7020077
Submission received: 12 May 2020 / Accepted: 9 June 2020 / Published: 13 June 2020

Abstract

:
DNA methylation of different gene components, including different exons and introns, or different lengths of exons and introns is associated with differences in gene expression. To investigate the methylation of porcine gene components associated with the boar taint (BT) trait, this study used reduced representation bisulfite sequencing (RRBS) data from nine porcine testis samples in three BT groups (low, medium and high BT). The results showed that the methylation levels of the first exons and first introns were lower than those of the other exons and introns. The first exons/introns of CpG island regions had even lower levels of methylation. A total of 123 differentially methylated promoters (DMPs), 194 differentially methylated exons (DMEs) and 402 differentially methylated introns (DMIs) were identified, of which 80 DMPs (DMP-CpGis), 112 DMEs (DME-CpGis) and 166 DMIs (DMI-CpGis) were discovered in CpG islands. Importantly, GPX1 contained one each of DMP, DME, DMI, DMP-CpGi, DME-CpGi and DMI-CpGi. Gene-GO term relationships and pathways analysis showed DMP-CpGi-related genes are mainly involved in methylation-related biological functions. In addition, gene–gene interaction networks consisted of nodes that were hypo-methylated GPX1, hypo-methylated APP, hypo-methylated ATOX1, hyper-methylated ADRB2, hyper-methylated RPS6KA1 and hyper-methylated PNMT. They could be used as candidate biomarkers for reducing boar taint in pigs, after further validation in large cohorts.

1. Introduction

In approximately 80% of non-castrated male pigs, the accumulation of skatole [1] and androstenone [2] in backfat causes offensive boar taint (BT) flavour. Approximately 75% of consumers in European countries were sensitive to BT in porcine meat [3,4,5].
DNA methylation is a major epigenetic mechanism that directly causes a chemical modification to DNA [6] conferred by the covalent transfer of a methyl group to the C-5 position of cytosine [7]. Since being discovered 40 years ago, methylation has been established as a major epigenetic factor influencing gene activities [8].
DNA methylation in the promoter regions is associated with transcriptional repression at the level of gene regulation [9,10], likely because DNA methylation tends to reinforce chromatin-based silencing [11]. However, to silence genes at transcription, DNA methylation at high cytosine and guanine dinucleotide (CpG)-density promoters is not necessary [12,13]. In fact, unmethylated CpG islands are found in more than one-half of the gene promoter regions, but they are not associated with the gene transcriptional activity [13].
Generally, splicing patterns are influenced by changes in intragenic DNA methylation; for example, the methylation pattern of alternatively spliced exons changes and subsequently alters the exon inclusion levels positively during the construction of splice variants [14,15]. Different methylation levels have been observed in different exons and in exons of different lengths [16]. The findings from a genome-scale intragenic methylation analysis revealed negative strong correlations between gene expression and DNA methylation in first exons but weak correlations in other exons and introns [17]. Therefore, first exon methylation was found to be closely associated with transcriptional silencing [18]. Additionally, Bieberstein et al. (2012) [19] found that the length of the first exon has a regulatory effect on transcription and that it is useful for the prediction of gene activity.
Endogenous introns are important for gene expression, as removing them dramatically reduces transcription and adding them markedly increases transcription [20,21,22,23,24]. Kim et al. (2018) [25] suggested that there is an inverse association of intron methylation and expression, so hypo-methylation of the first intron is correlated with high gene expression levels [26]. Nevertheless, when first introns with high levels of methylation are also located in CpG islands, the gene (e.g., EGR2) is expressed at a high level [27].
We have previously published descriptions of the epigenetic characteristics of the porcine genome and its relationship with boar taint level [28,29]. However, a detailed DNA-methylation characterization of different gene regions was not reported in this previous study, despite the important relation of different levels of differentially methylated regions (DMRs) in gene components (e.g., promoters, exons and introns) to BT level. Therefore, the objective of this study was to investigate the methylation of porcine reference gene components (i.e., promoters, different exons and different introns) for BT traits and to identify the related DMRs of gene components. Our previous study revealed 32 significant gene differentially methylated cytosines (DMCs) associated with the BT trait [28]; however, using the same materials used in the first study for this study, we focused on the DMRs of intragenic regions, especially the promoter, first exon and first intron regions, as a single entity. In addition, the interactions of methylated CpG island with promoters, exons and introns were investigated to determine the influences of CpG islands on intragenic methylation.

2. Materials and Methods

2.1. RRBS and Animal Data

This study was conducted using reduced representation bisulfite sequencing (RRBS) sequencing data from nine porcine testis tissue samples that are accessible through Gene Expression Omnibus (GEO) (https://www.ncbi.nlm.nih.gov/geo/query/acc.cgi?acc=GSE129385). Only cytosines in the cytosine and guanine dinucleotide (CpG) sites were used in our study. Quality control (i.e., removal of adapter and short reads) and alignment of RRBS reads were performed using Trimmomatic software [30] and Bismark software [31], respectively, based on the same parameters used in our previous study [28,29]. Furthermore, the unqualified read coverages of cytosines (i.e., ≤10 counts and ≥99.9th percentile) were also trimmed following previous studies [28,29,32,33]. Based on the publicly available information of experimental animals published in our previous study [28,34], nine testis tissue samples from three BT groups (i.e., low, medium and high BT groups) of pigs were used in this study, so each BT group had three pigs as replicates. Three BT groups for the nine pigs were formed based on the BT estimated breeding values (EBVs) (i.e., sum of the EBVs of skatole concentration and human nose score (HNS)), where pigs of extreme low or high EBVs belonged to low or high BT groups and pigs with EBVs closest to the mean belonged to the medium BT group, which has been presented and described in the previous study [28,34].

2.2. Porcine Reference Gene Components

Based on the reference sequence genes (RefSeqGenes) of Sus scrofa (http://genome.ucsc.edu/cgi-bin/hgTables), a total of 4473 RefSeqGenes with 4412 promoters, 36,286 exons and 31,912 introns were investigated through annotations using R package genomation [35]. Different from our previous study that calculated the differentially methylated cytosines (DMCs) associated with BT trait [28], this study focused on the DMRs of intragenic regions (i.e., promoter, exon and intron regions) as a single entity. In addition, the overlaps of methylated CpG island regions with intragenic regions were also investigated to determine the influences of CpG islands on intragenic methylation. Here, we calculated the methylation levels of the promoter-CpG island/exon-CpG islands/intron-CpG island when cytosines were located in both promoter/exon/intron and CpG island regions, for example, cytosines were located in the promoter-CpG island regions (Figure 1).
Then, we used R package GeneDMRs (https://github.com/xiaowangCN/GeneDMRs) [36] to obtain weighted methylation levels for each BT group, Q-values by the false discovery rate (FDR) method [37] and methylation differences (i.e., difference in weighted methylation levels between the low and high BT groups) for all promoters, exons, introns and their regions overlapped with CpG islands. Here, if the methylation difference was positive, the region was defined as hyper-methylated; thus, a negative methylation difference represents hypo-methylation.
The weighted methylation levels were calculated by the methylated reads number divided by the total reads number given the weights following the previous study [28]:
i = 1 n j = 1 m M R i j j = 1 m T R i j W i j   a n d   W i j = j = 1 m T R i j i = 1 n j = 1 m T R i j ,
where M R i j and T R i j are the methylated and total reads number of the involved cytosine site j at a given region of individual i , m is the total number of cytosine sites involved in this region, n is the total individual number of one BT group and W i j is the weight of reads of the involved cytosine site j of individual i .
The statistical analysis was following the previous study [33] in the logistic regression model:
ln ( π i 1 π i ) = u + β T i
where π i is the weighted methylation levels at the given region, u is the intercept, and T i is the BT group indicator.

2.3. Differentially Methylated Gene Components, Significant Enrichments and Interaction Networks

The differentially methylated promoters (DMPs), differentially methylated exons (DMEs), differentially methylated introns (DMIs), DMP-CpG islands (DMP-CpGis), DME-CpG islands (DME-CpGis) and DMI-CpG islands (DMI-CpGis) were defined when Q-values were less than 0.05.
The enrichment of GO terms for DMP-CpGi-related genes was determined with the DAVID website (https://david.ncifcrf.gov/) and visualized by the GOplot R package [38]. The pathway enrichments for hypo-methylated and hyper-methylated DMP-CpGi-related genes were performed in clusterprofiler R package [39]. Afterwards, The DMP-CpGi-related genes enriched in significant GO terms and pathways were used to create gene–gene networks by the GeneMANIA tool [40,41].

3. Results

3.1. Methylation Levels of Promoters, Different Exons and Different Introns

In this study, the cytosines in CpG sites were found in only 3029 genes with 2295 promoters, 2725 exons and 4349 introns, based on reduced representation bisulfite sequencing (RRBS) data. According to the distribution of all exon and intron positions, the frequency of positions decreased as the number of ordinal positions increased, so the first ordinal position had the most exons and introns. Additionally, exons and introns were in fewer than 20 ordinal positions; therefore, the number of exons and introns in most genes was less than 20 (Supplementary Figure S1). In fact, the proportions of both the first twenty exons and first twenty introns out of all exons (2590/2725) and introns (4109/4349) were larger than 90% (Figure 2A,C,E). Obviously, the methylation levels of the promoters were lower compared to the methylation levels of the first twenty exons and the first twenty introns (Figure 2). However, exons/introns at different ordinal positions were found to have different methylation levels, but such differences in the three BT groups were very small (Supplementary Figure S1). The average methylation levels of the first exon (21.64%) and first intron (31.05%) for the three BT groups were lower than the average methylation levels of the other exons and introns (Figure 2A,C,E). However, we investigated the specific genes such as GPX1 and found that methylation levels of intergenic regions of GPX1 were higher than intragenic regions, where low BT groups had higher methylations than other two BT groups (Figure 3).
When considering the CpG island overlapped with intragenic regions, cytosines were found to be involved in 2196 genes with 1942 promoters, 1635 exons and 1796 introns. The methylation of the promoters and the first twenty intragenic regions that were exclusively located in CpG islands was generally lower than the methylation of all promoters and the first twenty gene components, particularly the promoters; the 1st, 13th and 14th exons; and the 1st and 20th introns (Figure 2). Obviously, the methylation levels interacting with CpG islands of the 13th and 14th exons were significantly (p < 0.001) lower than the same-exon methylations without CpG island interactions (Supplementary Figure S2).
The methylation levels of the first exons were observed to increase as the lengths increased, but this trend was not as notable for the first introns (Supplementary Figure S3). In terms of their overlaps with CpG islands, methylated exons remained stable (Supplementary Figure S3C), but methylated introns tended to have greatly decreased variable lengths (Supplementary Figure S3D).
The methylation differences between the low and high BT groups ranged from −40% to +30% for promoters, first exons and first introns in the same genes, and the first exons had greater methylation differences than were found among the promoters and the first introns. Additionally, most methylation differences in the promoters, first exons and first introns were at the zero point, which indicated that the differential methylation levels of the gene components were generally analogous in the low and high BT groups. The highest Pearson correlation coefficient (PCC) for methylation differences was associated with the comparison of promoters and first exons (PCC = 0.69), while the correlation coefficients were lower for comparisons of promoters with first introns and first exons with first introns (Supplementary Figure S4).

3.2. Differentially Methylated Promoters, Exons, Introns and Their Overlaps with CpG Islands

According to the filtering criterion of Q-values < 0.05, among the identified 123 differentially methylated promoters (DMPs), 194 differentially methylated exons (DMEs) and 402 differentially methylated introns (DMIs), a total of 80 DMPs (DMP-CpGis), 112 DMEs (DME-CpGis) and 166 DMIs (DMI-CpGis) were discovered in CpG islands. The details of the DMPs, DMEs and DMIs are listed in Supplementary file 1, and the details of DMP-CpGis, DME-CpGis and DMI-CpGis are listed in Supplementary file 2. Manhattan plots of genome-wide DNA methylation in promoters, exons and introns for BT are shown in Figure 4.
The number of common genes related to DMPs, DMEs and DMIs was three and two of the three genes were related to DMP-CpGis, DME-CpGis and DMI-CpGis (Figure 5A,B). Among them, TSPAN9 and GPX1 contained one each of DMP, DME, DMI, DMP-CpGi, DME-CpGi and DMI-CpGi (Table 1). The percentage of DME, DMI, DME-CpGi and DMI-CpGi in the first and other ordinal positions varied. The first exons constituted a relatively small proportion (7.6%~7.8%) of the DMEs regardless of whether they were in CpG islands, while the first introns constituted a relatively larger proportion (14.7%) of the DMIs when they were excluded from CpG islands (Figure 5C,D). The methylation differences of DMP, DME, DMI, DMP-CpGi, DME-CpGi and DMI-CpGi were close to zero (Figure 5E,F).
Finally, 7 hypo-methylated and 13 hyper-methylated genes were presented as the top 20 DMP-CpGi-related genes. Additionally, 12 hypo-methylated and 8 hyper-methylated DME-CpGi-related genes, together with 13 hypo-methylated and 7 hyper-methylated DMI-CpGi-related genes are also listed in Table 2. The most significant DMP-CpGi-related gene (Q-value = 2.8 × 10⁻¹⁶), hypo-methylated POU2AF1, also had the larger methylation difference (18.4%) than other DMP-CpGi-related genes (Table 2). In the top 20 DME-CpGi-related genes, 5 first DME-CpGis were identified that were associated with GLI2, RTL1, ZNF205, SOX9 and HOXA5, whereas 6 first DMI-CpGis related to SCD5, GPX1, PDX1, PKD1, TBCD and HOXA10 were identified in the top 20 DMI-CpGi-related genes. Furthermore, the promoters of RTL1 and HOXA5 were tested as DMPs that were in the same methylated directions with their first DME-CpGis (Table 2, Supplementary files 1 and 2), thus, hypo-methylated/hyper-methylated promoter-first exon regions of RTL1/HOXA5 could be the entirety for functional methylations.

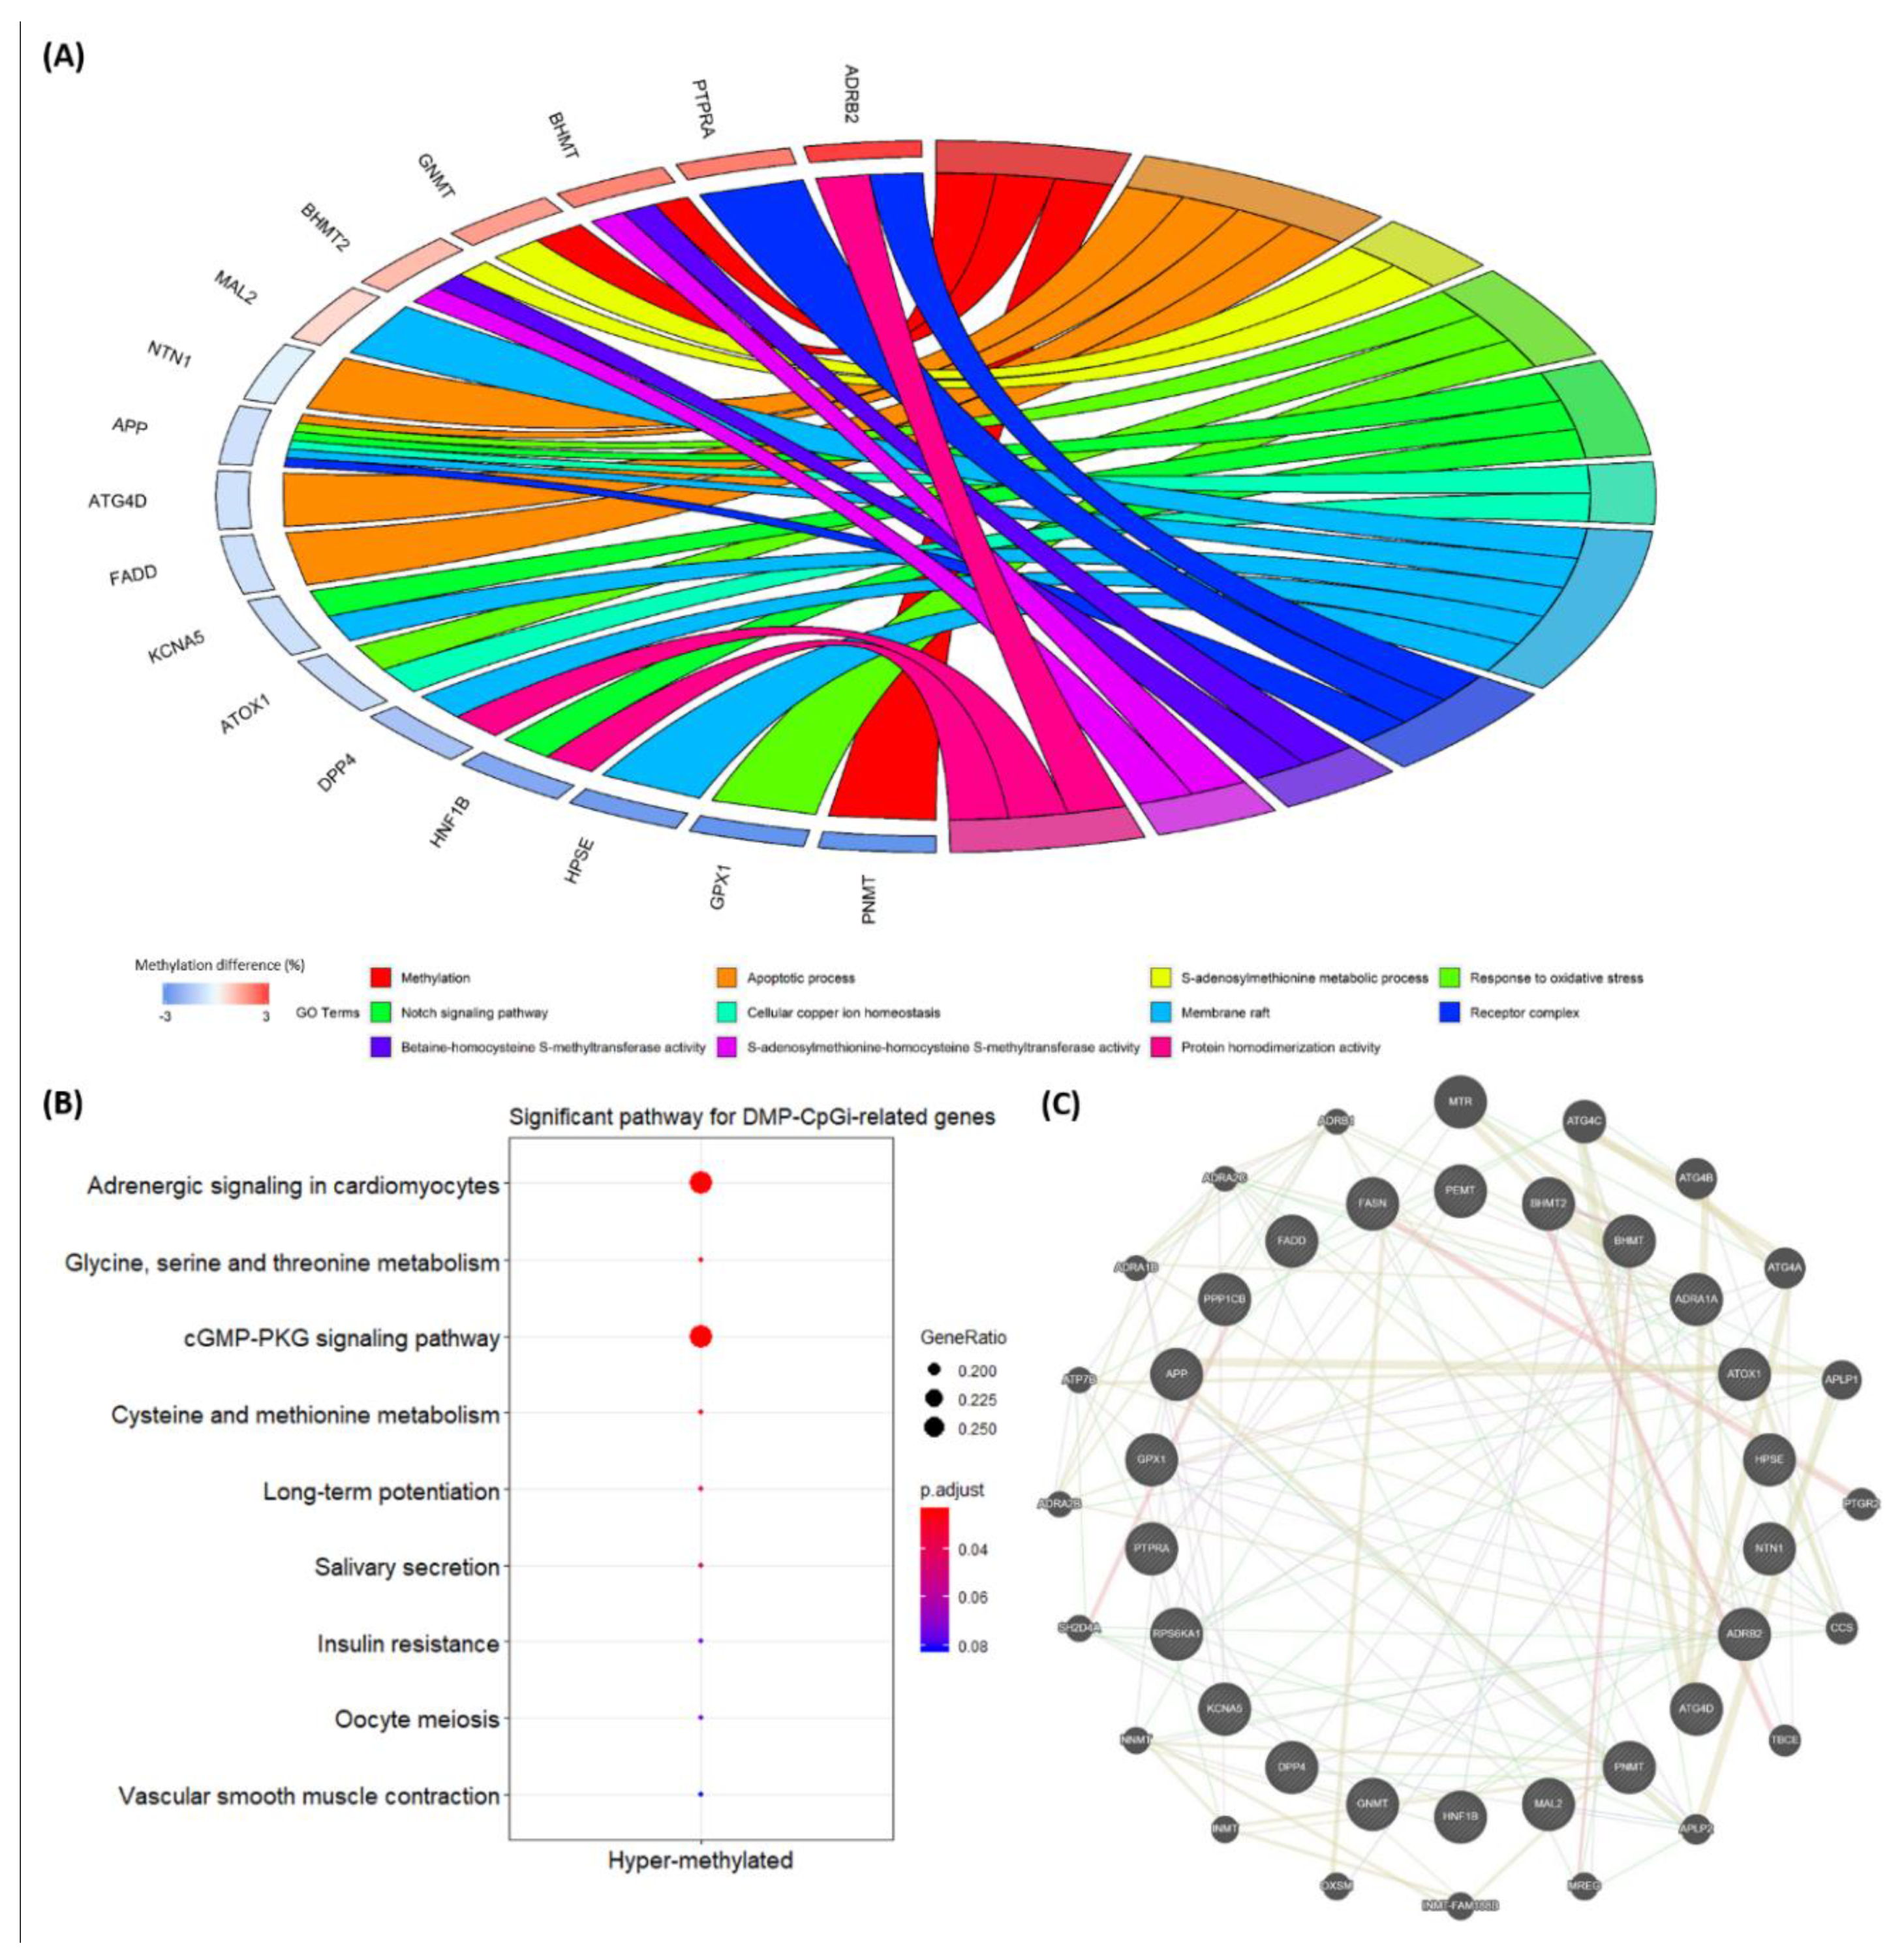
3.3. Biological Enrichment of DMP-CpGi-Related Genes and Interaction Networks

Among the 80 DMP-CpGi-related genes, four correlated with methylation-related biological functions, such as PNMT (Q-value = 5.9 × 10⁻⁸ with a methylation difference = −6.2%), BHMT (Q-value = 3.7 × 10⁻⁵ with a methylation difference = 2.1%), BHMT2 (Q-value = 5.3 × 10⁻³ with a methylation difference = 1.2%) and GNMT (Q-value = 2.8 × 10⁻² with a methylation difference = 1.7%) (Supplementary file 2). The gene–GO term relationship results for 80 DMP-CpGi-related genes also showed that four methylation-function genes were strongly linked to significant GO terms (P-value < 0.05), including methylation (GO:0032259) and the S-adenosylmethionine metabolic process (GO:0046500) in the biological process category and betaine-homocysteine S-methyltransferase activity (GO:0047150) and S-adenosylmethionine-homocysteine S-methyltransferase activity (GO:0008898) in the molecular function category. In addition, 13 other genes (ADRB2, APP, ATG4D, ATOX1, DPP4, FADD, GPX1, HNF1B, HPSE, KCNA5, MAL2, NTN1 and PTPRA) were involved in 11 of the 19 significant GO terms (Figure 6A). In the pathway enrichment analysis, seven genes (i.e., ADRA1A, ADRB2, BHMT, BHMT2, GNMT, PPP1CB and RPS6KA1) were enriched in six significant pathways (p.adjust < 0.05) including the adrenergic signaling in cardiomyocytes (ssc04261), the glycine, serine and threonine metabolism (ssc00260), the cGMP-PKG signaling pathway (ssc04022), the cysteine and methionine metabolism (ssc00270), the long-term potentiation (ssc04720) and the salivary secretion (ssc04970) (Figure 6B). In the previous study, 32 DMC-related candidate genes (e.g., FASN and PEMT) were associated with BT, and these DMCs were located only in the gene components [28]. Here, we summarize the DMIs in the 27th intron of FASN and in the 2nd and 3rd introns of PEMT (Supplementary file 1 and Supplementary file 2). Based on the 20 genes involved in the significant GO terms and pathways, gene–gene networks were created to connect candidate genes (i.e., FASN and PEMT) for the BT trait. FASN is connected to APLP2, PTGR2 and OXSM, while PEMT is linked to ADRA1A, PTPRA and NNMT. Moreover, GPX1 was in relationship with a group of genes that included APP, ATG4A, ATOX1, ADRB2, CCS, PNMT, RPS6KA1 and NNMT (Figure 6C).

4. Discussion

4.1. Methylation Status of Promoters, Different Exons and Different Introns for BT

Most studies have suggested that the DNA methylation levels of introns are lower than those of neighbouring exons in humans and honey bees [42,43]. However, methylation of exons with CpG islands was at a higher level than the methylation of flanking introns in embryonic stem cells and foetal fibroblasts of humans [44]. Our previous results implied that exons in CpG islands had lower methylation levels than the methylations of the intron and other CpG island regions in porcine testis tissue [29]. The findings of this study indicated higher methylation levels of introns at different ordinal positions (Figure 2 and Supplementary Figure S1). Additionally, both our previous study [29] and Chen’s study [45] suggested that promoters with lower methylation patterns were specific to adult porcine pig testis during spermatogenic cell development. Therefore, such promoter methylation patterns and inversely different methylation trends between exons and introns could be caused by tissue-specific and developmental-specific methylation patterns.
Song et al. (2017) [16] revealed different ordinal positions of exons with different methylation, showing that the first exons had the lowest methylation levels, a finding consistent with this study (Figure 2). Furthermore, another study demonstrated the correlations of different methylation levels in different gene positions with the biological features of exons [46]. Such exon-specific methylation levels were considered to be associated with alternative splicing events [14,15,43]; for example, the expression levels of the exons were negatively related to the DNA methylation levels of the first exons [46]. Decreasing methylation levels of the first exons (Figure 2A,C,E), especially the obvious methylation decrease in the first exons in the CpG islands (Figure 2B,D,F), might be correlated with both promoters and CpG islands. Our results revealed a good relationship (0.689) between promoters and first exons (Supplementary Figure S4A), so first exons can potentially be viewed as integral to the promoter regions [47,48].
It has been reported that the lengths of the exons are strongly linked to exon methylation level [16]; thus, longer genes with many long exons may have higher methylation levels [49]. Based on the length distribution results in this study, methylation levels increased as exon length increased, regardless of whether or not the exons were in CpG islands (Supplementary Figure S3A,C). However, the interaction with CpG islands resulted in the reduced methylation of introns compared to the initial levels (Supplementary Figure S3B,D). Since long introns and high intron variability could cause variable methylation levels in the first introns (Supplementary Figure S3B), CpG islands could play a role in reducing the methylation levels of the first introns, according to their different lengths [26].
Anastasiadi et al. (2018) [26] also indicated that the number of DMRs in the first introns was greater than the number of DMRs in the promoters or first exons. Our study found that 10.9%~14.7% of DMIs were in the first introns (Figure 5C,D), which means that the DMRs in the first introns constituted a large proportion of DMIs and all DMRs because the number of DMIs (n = 166~402) was higher than the number of DMPs (n = 80~123) or DMEs (n = 112~194) (Figure 5A,B).

4.2. Biological Functions of DMP-CpGis-Related Genes

As reducing methylation in the promoters causes the enhancement of gene expression, the expression levels are negatively correlated with promoter methylation [9]. Generally, promoters in CpG islands are unmethylated, while promoters outside CpG islands are predominantly methylated [13]. Our study showed similar results: reduced methylation levels were observed in the CpG islands of promoters (Figure 2). Therefore, Weber et al. (2007) [13] proposed that methylation is occasionally not necessary in CpG island promoters, as most of them are in hypo-methylated states, but the existing methylation is enough to inactivate promoter-CpG island regions. Among the 80 DMP-CpGi-related genes, 30 DMP-CpGis were in a hyper-methylated state (Supplementary file 2), and 13 of these were involved in the top 20 DMP-CpGis (Table 2).
The significant GO terms identified through this study mainly focused on biological functions of methylation (Figure 6A) and were connected with three hyper-methylated DMP-CpGi-related genes (i.e., BHMT, BHMT2 and GNMT) and one hypo-methylated DMP-CpGi-related gene (i.e., PNMT) (Table 2). The gene expression patterns of the BHMT and BHMT-2 genes are similar between pigs and humans [50], with BHMT being active in porcine pancreas, kidney and liver cortex [51]. GNMT, a key component that regulates S-adenosyl-methionine (SAM) catabolism, suppresses the increment of SAM to extend lifespan [52], whereas PNMT expression contributes to the mesodermal origin of adrenergic heart cells [53]. In fact, the hyper-methylated genes BHMT, BHMT2 and GNMT were also enriched in the significant pathways, where the other involved DMP-CpGi-related genes ADRA1A, ADRB2, PPP1CB and RPS6KA1 were also hyper-methylated (Figure 6B). Therefore, the findings of GO terms and pathways could provide a functional understanding of promoter methylation in CpG islands.
Based on gene–gene network results, hyper-methylated genes ADRA1A and PTPRA linking to PEMT were involved in three significant pathways (i.e., the adrenergic signaling in cardiomyocytes (ssc04261), the cGMP-PKG signaling pathway (ssc04022) and salivary secretion (ssc04970)) and one significant GO term (i.e., the protein phosphorylation (GO:0006468)). PTPRA was reported to promote the cell cycle progression and lead to poor prognosis in squamous cell lung cancer [54]. In addition, the hypo-methylated GPX1, one of the DMP, DME, DMI, DMP-CpGi, DME-CpGi and DMI-CpGi related genes, was connected to hypo-methylated APP, hypo-methylated ATOX1, hyper-methylated ADRB2, hyper-methylated RPS6KA1 and hyper-methylated PNMT that were all enriched in significant GO terms and pathways (Figure 6C). In the other studies, GPX1 was found to be positively correlated with porcine high androstenone and a high activity against lipid peroxidation based on the glutathione metabolism pathway, so they suggested that the interaction partners (e.g., GST families) with GPX1 could be candidate biomarkers in testicular steroid and androstenone biosynthesis of pigs [55].

4.3. Implications

To avoid BT odor in porcine meat, selecting low genetic merit of BT with considerable heritability can be effective and efficient [56,57], as surgical castration has implications for animal welfare and results in decreased meat production [58,59]. Currently, multi-omics data analysis was performed to understand complex traits based on systems genomics approaches [60,61,62], in which the epigenome interacted with the genome to affect the transcriptome and subsequent modules such as the proteome and metabolome to a different extent in the design of omics studies [63]. In addition to genomics studies finding significant genetic variants [64,65,66,67] and transcriptomics studies finding differentially expressed genes [68,69,70] associated with BT, an epigenomics study revealed DMCs to decipher the epigenetic regulatory mechanisms of BT [28]. However, this study identified differentially methylated gene components, for example, DMP, first DME and first DMI, that were key components for DNA methylations to regulate gene expressions [9,10,18,19,20,21,22,23,24]. Thus, the DMRs in gene components are valuably potential epigenetic biomarkers for BT, especially for promoter and first DME showing the similar methylation status [47,48]. Our study used relatively small sample sizes, so it is hard to achieve good quality biomarkers, but we will collect new testis tissue samples in another pig population of the same breed to validate our results in vitro studies by performing additional experiments with the methylated and unmethylated CpGs, and quantitative PCR analysis on target genes.

5. Conclusions

This study investigated the methylation of porcine gene components (i.e., promoters, different exons and different introns) in BT trait-related genes and identified the related DMRs of the gene components. The results show that the methylation levels of the first exons and first introns were lower than those of the other exons and introns. Moreover, the methylation levels of the first exon/intron CpG islands were even lower. Additionally, as the first exon lengths become longer, their methylation levels increased. According to the differentially methylated analysis, the DMPs/DMEs/DMIs and their overlaps with CpG islands were identified. Analysis of the gene–GO term relationships and pathways of 80 DMP-CpGi-related genes revealed that these genes enriched in significant GO terms and pathways were mainly involved in methylation-related biological functions. The finding that decreasing methylation levels of the first exons were in a strong relationship with promoters, particularly through interactions with CpG islands, caught our attention because they could be considered as a promoter-first exon entity that regulates biological events. Based on the gene–gene network results, hypo-methylated GPX1 linking APP, ATOX1, ADRB2, RPS6KA1 and PNMT could be used as potential candidate biomarkers for boar taint in pigs after further validation in large populations of the same breed.

Supplementary Materials

The following are available online at https://www.mdpi.com/2306-7381/7/2/77/s1, Supplementary Figure S1. Frequencies and methylation levels (%) for ordinal positions of (A) all exons, (B) all introns, (C) exons with CpG islands and (D) introns with CpG islands for low, medium and high BT groups. Note: Methylation level is zero when no cytosine is located in the ordinal position of the exon and intron. Supplementary Figure S2. Boxplots of methylation levels (%) of 13th and 14th exons with and without CpG island overlaps for low BT group. Supplementary Figure S3. Frequencies and methylation levels (%) for the (A) first exons, (B) first introns, (C) first exons of different lengths with CpG islands and (D) first introns with CpG islands in the low, medium and high BT groups. Note: The lengths of first exons and the first introns were categorized into 100 bp and 1000 bp windows, respectively. Supplementary Figure S4. Correlation plots of methylation differences (%) among promoters, first exons and first introns from the same genes. (A) Promoters and first exons. (B) Promoters and first introns. (C) First exons and first introns. Note: Methylation difference (%) refers to the difference in methylation levels between the low and high BT groups. Pearson refers to the Pearson correlation coefficient. The different colours of plots indicate the objects from different chromosomes. Supplementary file 1. Details of the related genes, chromosomes, ordinal positions, and methylation levels in the different groups; reads in different groups; P-values; Q-values; and methylation level differences for each promoter, exon and intron. Supplementary file 2. Details of the related genes, chromosomes, ordinal positions, methylation levels in the different groups; reads in different groups; P-values; Q-values; and methylation differences for each promoter, exon and intron in the CpG islands.

Author Contributions

H.N.K. conceived and designed these experiments and analysis plans. X.W. analyzed the data and performed GeneDMRs package. X.W. wrote the first draft of the manuscript and improved it. H.N.K. further improved the manuscript. All authors have read and agreed to the published version of the manuscript.

Funding

This study was funded by the AGES project of the Veterinary Department of the Ministry of Food, Agriculture and Fisheries, Denmark. Xiao Wang received Ph.D. stipends from the Technical University of Denmark (DTU Bioinformatics and DTU Compute), Denmark, and the China Scholarship Council, China.

Acknowledgments

The authors thank Dan Hao for her assistance in performing GeneDMRs package.

Conflicts of Interest

The authors declare no competing interests.

Abbreviations

BTBoar taint
CpGCytosine and guanine dinucleotide
DMCDifferentially methylated cytosine
DMEDifferentially methylated exon
DME-CpGiDifferentially methylated exon in CpG island
DMIDifferentially methylated intron
DMI-CpGiDifferentially methylated intron in CpG island
DMPDifferentially methylated promoter
DMP-CpGiDifferentially methylated promoter in CpG island
DMRDifferentially methylated regions
EBVEstimated breeding value
FDRFalse discovery rate
GEOGene Expression Omnibus
HNSHuman nose score
RefSeqGeneReference sequence gene
RRBSReduced representation bisulfite sequencing
SAMS-adenosyl-methionine

References

  1. Patterson, R.L.S. 5a-Androst-16-ene-3-one:-Compound responsible for boar taint in boar fat. J. Sci. Food Agric. 1968, 19, 31–38. [Google Scholar] [CrossRef]
  2. Gower, D.B. 16-Unsaturated C19steroids a review of their chemistry, biochemistry and possible physiological role. J. Steroid Biochem. 1972, 3, 45–103. [Google Scholar] [CrossRef]
  3. Bonneau, M.; Le Denmat, M.; Vaudelet, J.C.; Veloso Nunes, J.R.; Mortensen, A.B.; Mortensen, H.P. Contributions of fat androstenone and skatole to boar taint: I. Sensory attributes of fat and pork meat. Livest. Prod. Sci. 1992, 32, 63–80. [Google Scholar] [CrossRef]
  4. Malmfors, B.; Lundstrom, K. Consumer reactions to boar meat—A review. Livest. Prod. Sci. 1983, 10, 187–196. [Google Scholar] [CrossRef]
  5. Matthews, K.R.; Homer, D.B.; Punter, P.; Béague, M.P.; Gispert, M.; Kempster, A.J.; Agerhem, H.; Claudi-Magnussen, C.; Fischer, K.; Siret, F.; et al. An international study on the importance of androstenone and skatole for boar taint: III. Consumer survey in seven European countries. Meat Sci. 2000, 54, 271–283. [Google Scholar] [CrossRef]
  6. Moore, L.D.; Le, T.; Fan, G. DNA methylation and its basic function. Neuropsychopharmacology 2013, 38, 23–28. [Google Scholar] [CrossRef] [PubMed] [Green Version]
  7. Robertson, K.D. DNA methylation and human disease. Nat. Rev. Genet. 2005, 6, 597–610. [Google Scholar] [CrossRef] [PubMed]
  8. Holliday, R.; Pugh, J. DNA modification mechanisms and gene activity during development. Science 1975, 187, 226–232. [Google Scholar] [CrossRef]
  9. Zemach, A.; McDaniel, I.E.; Silva, P.; Zilberman, D. Genome-wide evolutionary analysis of eukaryotic DNA methylation. Science 2010, 328, 916–919. [Google Scholar] [CrossRef] [Green Version]
  10. Hackett, J.A.; Reddington, J.P.; Nestor, C.E.; Dunican, D.S.; Branco, M.R.; Reichmann, J.; Reik, W.; Surani, M.A.; Adams, I.R.; Meehan, R.R. Promoter DNA methylation couples genome-defence mechanisms to epigenetic reprogramming in the mouse germline. Development 2012, 139, 3623–3632. [Google Scholar] [CrossRef] [Green Version]
  11. Feldman, N.; Gerson, A.; Fang, J.; Li, E.; Zhang, Y.; Shinkai, Y.; Cedar, H.; Bergman, Y. G9a-mediated irreversible epigenetic inactivation of Oct-3/4 during early embryogenesis. Nat. Cell Biol. 2006, 8, 188–194. [Google Scholar] [CrossRef] [PubMed]
  12. Métivier, R.; Gallais, R.; Tiffoche, C.; Le Péron, C.; Jurkowska, R.Z.; Carmouche, R.P.; Ibberson, D.; Barath, P.; Demay, F.; Reid, G.; et al. Cyclical DNA methylation of a transcriptionally active promoter. Nature 2008, 451, 45–50. [Google Scholar] [CrossRef] [PubMed]
  13. Weber, M.; Hellmann, I.; Stadler, M.B.; Ramos, L.; Pääbo, S.; Rebhan, M.; Schübeler, D. Distribution, silencing potential and evolutionary impact of promoter DNA methylation in the human genome. Nat. Genet. 2007, 39, 457–466. [Google Scholar] [CrossRef]
  14. Flores, K.; Wolschin, F.; Corneveaux, J.J.; Allen, A.N.; Huentelman, M.J.; Amdam, G.V. Genome-wide association between DNA methylation and alternative splicing in an invertebrate. BMC Genom. 2012, 13, 480. [Google Scholar] [CrossRef]
  15. Shayevitch, R.; Askayo, D.; Keydar, I.; Ast, G. The importance of DNA methylation of exons on alternative splicing. RNA 2018, 24, 1351–1362. [Google Scholar] [CrossRef] [PubMed] [Green Version]
  16. Song, K.; Li, L.; Zhang, G. The association between DNA methylation and exon expression in the Pacific oyster Crassostrea gigas. PLoS ONE 2017, 12, e0185224. [Google Scholar] [CrossRef] [PubMed]
  17. Li, S.; Zhang, J.; Huang, S.; He, X. Genome-wide analysis reveals that exon methylation facilitates its selective usage in the human transcriptome. Brief. Bioinform. 2018, 19, 754–764. [Google Scholar] [CrossRef]
  18. Brenet, F.; Moh, M.; Funk, P.; Feierstein, E.; Viale, A.J.; Socci, N.D.; Scandura, J.M. DNA methylation of the first exon is tightly linked to transcriptional silencing. PLoS ONE 2011, 12, e14524. [Google Scholar] [CrossRef]
  19. Bieberstein, N.I.; Oesterreich, F.C.; Straube, K.; Neugebauer, K.M. First exon length controls active chromatin signatures and transcription. Cell Rep. 2012, 2, 62–68. [Google Scholar] [CrossRef] [Green Version]
  20. Brinster, R.L.; Allen, J.M.; Behringer, R.R.; Gelinas, R.E.; Palmiter, R.D. Introns increase transcriptional efficiency in transgenic mice. Proc. Natl. Acad. Sci. USA 1988, 85, 836–840. [Google Scholar] [CrossRef] [Green Version]
  21. Callis, J.; Fromm, M.; Walbot, V. Introns increase gene expression in cultured maize cells. Genes Dev. 1987, 1, 1183–1200. [Google Scholar] [CrossRef] [PubMed] [Green Version]
  22. Furger, A.; O’Sullivan, J.M.; Binnie, A.; Lee, B.A.; Proudfoot, N.J. Promoter proximal splice sites enhance transcription. Genes Dev. 2002, 16, 2792–2799. [Google Scholar] [CrossRef] [PubMed] [Green Version]
  23. Morello, L.; Gianí, S.; Troina, F.; Breviario, D. Testing the IMEter on rice introns and other aspects of intron-mediated enhancement of gene expression. J. Exp. Bot. 2011, 62, 533–544. [Google Scholar] [CrossRef] [PubMed]
  24. Kempe, K.; Rubtsova, M.; Riewe, D.; Gils, M. The production of male-sterile wheat plants through split barnase expression is promoted by the insertion of introns and flexible peptide linkers. Transgenic Res. 2013, 22, 1089–1105. [Google Scholar] [CrossRef] [PubMed]
  25. Kim, D.; Shivakumar, M.; Han, S.; Sinclair, M.S.; Lee, Y.J.; Zheng, Y.; Olopade, O.I.; Kim, D.; Lee, Y. Population-dependent intron retention and DNA methylation in breast cancer. Mol. Cancer Res. 2018, 16, 461–469. [Google Scholar] [CrossRef] [Green Version]
  26. Anastasiadi, D.; Esteve-Codina, A.; Piferrer, F. Consistent inverse correlation between DNA methylation of the first intron and gene expression across tissues and species. Epigenetics Chromatin 2018, 11, 37. [Google Scholar] [CrossRef]
  27. Unoki, M.; Nakamura, Y. Methylation at CpG islands in intron 1 of EGR2 confers enhancer-like activity. FEBS Lett. 2003, 554, 67–72. [Google Scholar] [CrossRef] [Green Version]
  28. Wang, X.; Kadarmideen, H.N. Genome-wide DNA methylation analysis using next-generation sequencing to reveal candidate genes responsible for boar taint in pigs. Anim. Genet. 2019, 50, 644–659. [Google Scholar] [CrossRef]
  29. Wang, X.; Kadarmideen, H.N. An epigenome-wide DNA methylation map of testis in pigs for study of complex traits. Front. Genet. 2019, 10, 405. [Google Scholar] [CrossRef]
  30. Bolger, A.M.; Lohse, M.; Usadel, B. Trimmomatic: A flexible trimmer for Illumina sequence data. Bioinformatics 2014, 30, 2114–2120. [Google Scholar] [CrossRef] [Green Version]
  31. Krueger, F.; Andrews, S.R. Bismark: A flexible aligner and methylation caller for Bisulfite-Seq applications. Bioinformatics 2011, 27, 1571–1572. [Google Scholar] [CrossRef] [PubMed]
  32. Choi, M.; Lee, J.; Le, M.T.; Nguyen, D.T.; Park, S.; Soundrarajan, N.; Schachtschneider, K.M.; Kim, J.; Park, J.K.; Kim, J.H.; et al. Genome-wide analysis of DNA methylation in pigs using reduced representation bisulfite sequencing. DNA Res. 2015, 22, 343–355. [Google Scholar] [CrossRef] [PubMed] [Green Version]
  33. Akalin, A.; Kormaksson, M.; Li, S.; Garrett-Bakelman, F.E.; Figueroa, M.E.; Melnick, A.; Mason, C.E. MethylKit: A comprehensive R package for the analysis of genome-wide DNA methylation profiles. Genome Biol. 2012, 13, R87. [Google Scholar] [CrossRef] [PubMed] [Green Version]
  34. Drag, M.; Skinkyté-Juskiené, R.; Do, D.N.; Kogelman, L.J.A.; Kadarmideen, H.N. Differential expression and co-expression gene networks reveal candidate biomarkers of boar taint in non-castrated pigs. Sci. Rep. 2017, 7, 12205. [Google Scholar] [CrossRef] [PubMed] [Green Version]
  35. Akalin, A.; Franke, V.; Vlahoviček, K.; Mason, C.E.; Schübeler, D. Genomation: A toolkit to summarize, annotate and visualize genomic intervals. Bioinformatics 2015, 31, 1127–1129. [Google Scholar] [CrossRef]
  36. Wang, X.; Hao, D.; Kadarmideen, H.N. GeneDMRs: An R package for Gene-based Differentially Methylated Regions analysis. bioRxiv 2020, 04, 037168. [Google Scholar]
  37. Hochberg, B. Controlling the False Discovery Rate: A Practical and Powerful Approach to Multiple Testing. J. R. Stat. Soc. 1995, 57, 289–300. [Google Scholar]
  38. Walter, W.; Sánchez-Cabo, F.; Ricote, M. GOplot: An R package for visually combining expression data with functional analysis. Bioinformatics 2015, 31, 2912–2914. [Google Scholar] [CrossRef]
  39. Yu, G.; Wang, L.-G.; Han, Y.; He, Q.-Y. clusterProfiler: An R package for comparing biological themes among gene clusters. Omics A J. Integr. Biol. 2012, 16, 284–287. [Google Scholar] [CrossRef]
  40. Mostafavi, S.; Ray, D.; Warde-Farley, D.; Grouios, C.; Morris, Q. GeneMANIA: A real-time multiple association network integration algorithm for predicting gene function. Genome Biol. 2008, 9, S4. [Google Scholar] [CrossRef] [Green Version]
  41. Warde-Farley, D.; Donaldson, S.L.; Comes, O.; Zuberi, K.; Badrawi, R.; Chao, P.; Franz, M.; Grouios, C.; Kazi, F.; Lopes, C.T.; et al. The GeneMANIA prediction server: Biological network integration for gene prioritization and predicting gene function. Nucleic Acids Res. 2010, 38, W214–W220. [Google Scholar] [CrossRef] [PubMed]
  42. Lev Maor, G.; Yearim, A.; Ast, G. The alternative role of DNA methylation in splicing regulation. Trends Genet. 2015, 31, 274–280. [Google Scholar] [CrossRef] [PubMed]
  43. Lyko, F.; Foret, S.; Kucharski, R.; Wolf, S.; Falckenhayn, C.; Maleszka, R. The honey bee epigenomes: Differential methylation of brain DNA in queens and workers. PLoS Biol. 2010, 8, e1000506. [Google Scholar] [CrossRef] [PubMed] [Green Version]
  44. Lister, R.; Pelizzola, M.; Dowen, R.H.; Hawkins, R.D.; Hon, G.; Tonti-Filippini, J.; Nery, J.R.; Lee, L.; Ye, Z.; Ngo, Q.M.; et al. Human DNA methylomes at base resolution show widespread epigenomic differences. Nature 2009, 462, 315–322. [Google Scholar] [CrossRef] [Green Version]
  45. Chen, X.; Shen, L.H.; Gui, L.X.; Yang, F.; Li, J.; Cao, S.Z.; Zuo, Z.C.; Ma, X.P.; Deng, J.L.; Ren, Z.H.; et al. Genome-wide DNA methylation profile of prepubertal porcine testis. Reprod. Fertil. Dev. 2018, 30, 349–358. [Google Scholar] [CrossRef]
  46. Chuang, T.J.; Chen, F.C.; Chen, Y.Z. Position-dependent correlations between DNA methylation and the evolutionary rates of mammalian coding exons. Proc. Natl. Acad. Sci. USA 2012, 109, 15841–15846. [Google Scholar] [CrossRef] [Green Version]
  47. Saxonov, S.; Berg, P.; Brutlag, D.L. A genome-wide analysis of CpG dinucleotides in the human genome distinguishes two distinct classes of promoters. Proc. Natl. Acad. Sci. USA 2006, 103, 1412–1417. [Google Scholar] [CrossRef] [Green Version]
  48. Larsen, F.; Gundersen, G.; Lopez, R.; Prydz, H. CpG islands as gene markers in the human genome. Genomics 1992, 13, 1095–1107. [Google Scholar] [CrossRef]
  49. Wang, X.; Li, Q.; Lian, J.; Li, L.; Jin, L.; Cai, H.; Xu, F.; Qi, H.; Zhang, L.; Wu, F.; et al. Genome-wide and single-base resolution DNA methylomes of the Pacific oyster Crassostrea gigas provide insight into the evolution of invertebrate CpG methylation. BMC Genom. 2014, 15, 1119. [Google Scholar] [CrossRef] [Green Version]
  50. Ganu, R.S.; Garrow, T.A.; Sodhi, M.; Rund, L.A.; Schook, L.B. Molecular characterization and analysis of the porcine betaine homocysteine methyltransferase and betaine homocysteine methyltransferase-2 genes. Gene 2011, 473, 133–138. [Google Scholar] [CrossRef] [Green Version]
  51. Delgado-Reyes, C.V.; Garrow, T.A. High sodium chloride intake decreases betaine-homocysteine S-methyltransferase expression in guinea pig liver and kidney. Am. J. Physiol. Regul. Integr. Comp. Physiol. 2005, 288, R182–R187. [Google Scholar] [CrossRef] [PubMed] [Green Version]
  52. Obata, F.; Miura, M. Enhancing S-adenosyl-methionine catabolism extends Drosophila lifespan. Nat. Commun. 2015, 6, 8332. [Google Scholar] [CrossRef] [PubMed]
  53. Ebert, S.N.; Baden, J.M.; Mathers, L.H.; Siddall, B.J.; Wong, D.L. Expression of phenylethanolamine N-methyltransferase in the embryonic rat heart. J. Mol. Cell. Cardiol. 1996, 28, 1653–1658. [Google Scholar] [CrossRef] [PubMed]
  54. Gu, Z.; Fang, X.; Li, C.; Chen, C.; Liang, G.; Zheng, X.; Fan, Q. Increased PTPRA expression leads to poor prognosis through c-Src activation and G1 phase progression in squamous cell lung cancer. Int. J. Oncol. 2017, 51, 489–497. [Google Scholar] [CrossRef] [PubMed]
  55. Sahadevan, S.; Gunawan, A.; Tholen, E.; Große-Brinkhaus, C.; Tesfaye, D.; Schellander, K.; Hofmann-Apitius, M.; Cinar, M.U.; Uddin, M.J. Pathway based analysis of genes and interactions influencing porcine testis samples from boars with divergent androstenone content in back fat. PLoS ONE 2014, 9, e91077. [Google Scholar] [CrossRef] [PubMed] [Green Version]
  56. Strathe, A.B.; Velander, I.H.; Mark, T.; Kadarmideen, H.N. Genetic parameters for androstenone and skatole as indicators of boar taint and their relationship to production and litter size traits in Danish Landrace. J. Anim. Sci. 2013, 91, 2587–2595. [Google Scholar] [CrossRef] [Green Version]
  57. Strathe, A.B.; Velander, I.H.; Mark, T.; Ostersen, T.; Hansen, C.; Kadarmideen, H.N. Genetic parameters for male fertility and its relationship to skatole and androstenone in Danish Landrace boars. J. Anim. Sci. 2013, 91, 4659–4668. [Google Scholar] [CrossRef] [Green Version]
  58. Claus, R.; Weiler, U.; Herzog, A. Physiological aspects of androstenone and skatole formation in the boar-A review with experimental data. Meat Sci. 1994, 38, 289–305. [Google Scholar] [CrossRef]
  59. Bonneau, M. Use of entire males for pig meat in the European Union. Meat Sci. 1998, 49, S257–S272. [Google Scholar] [CrossRef]
  60. Suravajhala, P.; Kogelman, L.J.A.; Kadarmideen, H.N. Multi-omic data integration and analysis using systems genomics approaches: Methods and applications In animal production, health and welfare. Genet. Sel. Evol. 2016, 48, 38. [Google Scholar] [CrossRef] [Green Version]
  61. Kadarmideen, H.N. Genomics to systems biology in animal and veterinary sciences: Progress, lessons and opportunities. Livest. Sci. 2014, 166, 232–248. [Google Scholar] [CrossRef] [Green Version]
  62. Civelek, M.; Lusis, A.J. Systems genetics approaches to understand complex traits. Nat. Rev. Genet. 2014, 15, 34–48. [Google Scholar] [CrossRef] [PubMed] [Green Version]
  63. Hasin, Y.; Seldin, M.; Lusis, A. Multi-omics approaches to disease. Genome Biol. 2017, 18, 83. [Google Scholar] [CrossRef] [PubMed]
  64. Rowe, S.J.; Karacaören, B.; de Koning, D.-J.; Lukic, B.; Hastings-Clark, N.; Velander, I.; Haley, C.S.; Archibald, A.L. Analysis of the genetics of boar taint reveals both single SNPs and regional effects. BMC Genom. 2014, 15, 424. [Google Scholar] [CrossRef] [PubMed] [Green Version]
  65. Moe, M.; Lien, S.; Aasmundstad, T.; Meuwissen, T.H.E.; Hansen, M.H.S.; Bendixen, C.; Grindflek, E. Association between SNPs within candidate genes and compounds related to boar taint and reproduction. BMC Genet. 2009, 10, 32. [Google Scholar] [CrossRef] [Green Version]
  66. Duijvesteijn, N.; Knol, E.F.; Merks, J.W.M.; Crooijmans, R.P.M.A.; Groenen, M.A.M.; Bovenhuis, H.; Harlizius, B. A genome-wide association study on androstenone levels in pigs reveals a cluster of candidate genes on chromosome 6. BMC Genet. 2010, 11, 42. [Google Scholar] [CrossRef] [Green Version]
  67. de Campos, C.F.; Lopes, M.S.; de Silva, F.F.; Veroneze, R.; Knol, E.F.; Sávio Lopes, P.; Guimarães, S.E.F. Genomic selection for boar taint compounds and carcass traits in a commercial pig population. Livest. Sci. 2015, 174, 10–17. [Google Scholar] [CrossRef] [Green Version]
  68. Gunawan, A.; Sahadevan, S.; Cinar, M.U.; Neuhoff, C.; Große-Brinkhaus, C.; Frieden, L.; Tesfaye, D.; Tholen, E.; Looft, C.; Wondim, D.S.; et al. Identification of the novel candidate genes and variants in boar liver tissues with divergent skatole levels using RNA deep sequencing. PLoS ONE 2013, 11, e72298. [Google Scholar] [CrossRef] [Green Version]
  69. Drag, M.; Hansen, M.B.; Kadarmideen, H.N. Systems genomics study reveals expression quantitative trait loci, regulator genes and pathways associated with boar taint in pigs. PLoS ONE 2018, 13, e0192673. [Google Scholar] [CrossRef]
  70. Drag, M.; Kogelman, L.J.A.; Maribo, H.; Meinert, L.; Thomsen, P.D.; Kadarmideen, H.N. Charaterization of eQTLs associated with androstenone by RNA seuqecing in porcine testis. Physiol. Genom. 2019, 51, 488–499. [Google Scholar] [CrossRef]
Figure 1. Cytosines (red dotted rectangle) in the promoter-CpG island regions.
Vetsci 07 00077 g001
Figure 2. Boxplots of methylation levels (%) of promoters, the first twenty ordinal positions of exons and introns for the (A and B) low, (C and D) medium and (E and F) high BT groups. Note: The widths of boxplots indicate the proportion to the square-root of the number of observations. The number within brackets indicate the number of promoters, exons and introns used in the figure visualization.
Vetsci 07 00077 g002
Figure 3. Methylation levels (%) of GPX1 in different gene components for low, medium and high BT groups.
Vetsci 07 00077 g003
Figure 4. Manhattan plots of genome-wide DNA methylation for BT. Note: Plots from outside track to inside track indicate the Q-values of (A) promoters, (B) exons and (C) introns and the Q-values of (A) promoters, (B) exons and (C) introns overlapped with CpG islands, respectively. Blue dotted and red solid lines indicate the Q-value threshold of 0.05 and 0.01, respectively.
Vetsci 07 00077 g004
Figure 5. (A) Venn diagrams and (B) Venn diagrams with CpG islands of all differentially methylated promoters (DMPs), all differentially methylated exons (DMEs) and differentially methylated introns (DMIs). (C) Pie charts and (D) pie charts with CpG islands of DMPs, and DMEs and DMIs in first and other ordinal positions. (E) Boxplots and (F) boxplots with CpG islands of methylation differences (%) for DMPs, and DMEs and DMIs in first and other ordinal positions. Note: Methylation difference (%) refers to the difference in methylation levels between the low and high BT groups. The widths of boxplots indicate the proportion to the square root of the number of observations.
Vetsci 07 00077 g005
Figure 6. (A) Circo plots of relationships between 80 DMP-CpGi-related genes and 19 significant GO terms (P-value < 0.05). Note: Methylation difference (%) refers to the difference in methylation levels of DMP-CpGis between the low and high BT groups. (B) Dot plots for significant pathways (p.adjust < 0.05). (C) Gene–gene networks.
Vetsci 07 00077 g006
Table 1. Common annotated genes of DMP, DME, DMI, DMP-CpGi, DME-CpGi and DMI-CpGi.
GeneChromosomeGene DescriptionRegion (Q-Value & Methylation Difference)
TSPAN95Tetraspanin 9DMP (1.4 × 10⁻² & 1.2%)1st DME (1.5 × 10⁻² & −8.0%)6th DMI (1.7 × 10⁻¹⁰ & −5.5%)DMP-CpGi (1.8 × 10⁻² & 1.2%)1st DME-CpGi (1.9 × 10⁻² & −8.0%)6th DMI-CpGi (2.5 × 10⁻⁵ & −12.8%)
MASP26Mannan binding lectin serine peptidase 2DMP (4.7 × 10⁻⁸ & −6.3%)10th DME (4.4 × 10⁻² & −5.1%)9th DMI (5.8 × 10⁻⁵ & −8.5%)NANANA
GPX113Glutathione peroxidase 1DMP (6.5 × 10⁻¹⁴ & −4.0%)2nd DME (2.5 × 10⁻² & −2.1%)1st DMI (2.0 × 10⁻¹¹ & −5.6%)DMP-CpGi (6.6 × 10⁻¹⁴ & −4.0%)2nd DME-CpGi (3.1 × 10⁻² & −2.1%)1st DMI-CpGi (2.1 × 10⁻¹¹ & −5.6%)
Note: NA indicates not available. Methylation difference (%) refers to the difference in methylation levels between the low and high BT groups.
Table 2. Top 20 DMP-CpGi-related, DME-CpGi-related and DMI-CpGi-related genes.
GeneChromosomeGene DescriptionOverlap RegionQ-ValueMethylation Difference (%)
POU2AF19POU class 2 homeobox- associating factor 1DMP-CpGi2.8 × 10−16−18.4
IGFBP118Insulin-like growth factor-binding protein 1DMP-CpGi5.7 × 10−169.1
GPX113Glutathione peroxidase 1DMP-CpGi6.6 × 10−14−4.0
AMZ13Archaelysin family metallopeptidase 1DMP-CpGi2.1 × 10−117.9
SLC7A1413Solute carrier family 7 member 14DMP-CpGi5.2 × 10−112.1
HOXA518Homeobox A5DMP-CpGi1.7 × 10−93.4
PTPRA17Protein tyrosine phosphatase receptor type ADMP-CpGi4.2 × 10−92.2
PNMT12Phenylethanolamine N-methyltransferaseDMP-CpGi5.9 × 10−8−6.2
PRM23Protamine 2DMP-CpGi1.1 × 10−714.0
SOD38Superoxide dismutase 3DMP-CpGi2.5 × 10−74.7
DCT11Dopachrome tautomeraseDMP-CpGi7.8 × 10−78.8
CLEC4G2C-type lectin domain family 4 member GDMP-CpGi3.9 × 10−611.9
MIR67118MicroRNA mir-671DMP-CpGi8.0 × 10−6−3.5
TDRD104Tudor domain containing 10DMP-CpGi1.1 × 10−50.9
LOC1005193115Uncharacterized LOC100519311DMP-CpGi1.6 × 10−54.9
CDH56Cadherin 5DMP-CpGi3.3 × 10−5−5.2
BHMT2Betaine--homocysteine S-MethyltransferaseDMP-CpGi3.7 × 10−52.1
TCTEX1D46Tctex1 domain containing 4DMP-CpGi7.4 × 10−5−6.1
OXT17Oxytocin/neurophysin I prepropeptideDMP-CpGi1.6 × 10−4−5.6
ADRB22Adrenoceptor beta 2DMP-CpGi1.9 × 10−43.3
ZNF21717Zinc finger protein 2173rd DME-CpGi8.0 × 10−32−8.2
AMZ13Archaelysin family Metallopeptidase 17th DME-CpGi2.7 × 10−30−7.6
YDJC14YdjC chitooligosaccharide Deacetylase homolog5th DME-CpGi6.9 × 10−2424.2
CHRM12Cholinergic receptor muscarinic 15th DME-CpGi8.8 × 10−22−8.2
GLI215GLI family zinc finger 21st DME-CpGi5.2 × 10−21−10.4
LRP86LDL receptor related protein 85th DME-CpGi1.6 × 10−20−13.9
TNXB7Tenascin XB48th DME-CpGi6.4 × 10−174.3
IGFBP118Insulin like growth factor binding protein 14th DME-CpGi5.7 × 10−169.1
APOE6Apolipoprotein E4th DME-CpGi7.2 × 10−15−12.7
CAPN210Calpain 26th DME-CpGi1.1 × 10−14−11.8
FOXO31Forkhead box O32nd DME-CpGi1.5 × 10−14−9.1
RTL17Retrotransposon Gag like 11st DME-CpGi2.3 × 10−14−4.2
ADRA1D17Adrenoceptor alpha 1D3rd DME-CpGi7.5 × 10−144.4
SIGIRR2Single Ig and TIR domain containing3rd DME-CpGi2.7 × 10−1311.7
ZNF2053Zinc finger protein 2051st DME-CpGi6.6 × 10−129.8
SOX912SRY-box transcription factor 91st DME-CpGi5.4 × 10−102.9
HOXA518Homeobox A51st DME-CpGi5.5 × 10−103.2
COX1012COX10 homolog, cytochrome c oxidase assembly protein, heme A: farnesyltransferase (yeast)7th DME-CpGi8.5 × 10−10−9.8
KLF38Kruppel like factor 33rd DME-CpGi1.2 × 10−9−9.4
MYO7A9Myosin VIIA16th DME-CpGi1.9 × 10−9−10.9
CRYL111Crystallin lambda 16th DMI-CpGi2.7 × 10−22−7.6
AUTS23Activator of transcription and developmental regulator AUTS25th DMI-CpGi5.2 × 10−213.9
SCD58stearoyl-CoA desaturase 51st DMI-CpGi2.7 × 10−17−9.8
SREBF112Sterol regulatory element binding transcription factor 118th DMI-CpGi1.5 × 10−14−5.1
ABO1ABO, alpha 1-3-N-acetylgalactosaminyltransferase and alpha 1-3-galactosyltransferase2nd DMI-CpGi6.6 × 10−14−4.7
BANP6BTG3 associated nuclear protein13th DMI-CpGi3.0 × 10−134.4
PEMT12Phosphatidylethanolamine N-methyltransferase2nd DMI-CpGi3.6 × 10−138.7
CTSD2Cathepsin D5th DMI-CpGi3.6 × 10−13−9.5
TBCD12Tubulin folding cofactor D25th DMI-CpGi2.0 × 10−12−10.0
GPX113Glutathione peroxidase 11st DMI-CpGi2.1 × 10−11−5.6
SLC7A1413Solute carrier family 7 member 147th DMI-CpGi5.2 × 10−112.1
PDX111Pancreatic and duodenal homeobox 11st DMI-CpGi2.9 × 10−10−10.5
PKD13Polycystin 1, transient receptor potential channel interacting1st DMI-CpGi3.3 × 10−10−8.0
WDR45B12WD repeat domain 45B3rd DMI-CpGi6.2 × 10−10−12.2
TBCD12Tubulin folding cofactor D24th DMI-CpGi1.8 × 10−9−20.9
NOS318Nitric oxide synthase 32nd DMI-CpGi2.0 × 10−99.4
TBCD12Tubulin folding cofactor D1st DMI-CpGi2.3 × 10−9−9.3
BCO16Beta-carotene oxygenase 15th DMI-CpGi9.0 × 10−9−6.4
HOXA1018Homeobox A101st DMI-CpGi1.1 × 10−82.4
TBCD12Tubulin folding cofactor D34th DMI-CpGi2.4 × 10−79.6
Note: Methylation difference (%) refers to the difference in methylation levels between the low and high BT groups.

