Skull Shape Diversity in Pet Rabbits and the Applicability of Anatomical Reference Lines for Objective Interpretation of Dental Disease


Abstract
:
1. Introduction
2. Materials and Methods
2.1. Data Set and Radiographic Screening
2.2. Linear Morphometrics
2.3. Geometric Morphometrics
2.4. Statistical Analyses
3. Results
3.1. Linear Morphometrics
3.2. Skull Length and Height
3.3. Nasal Height
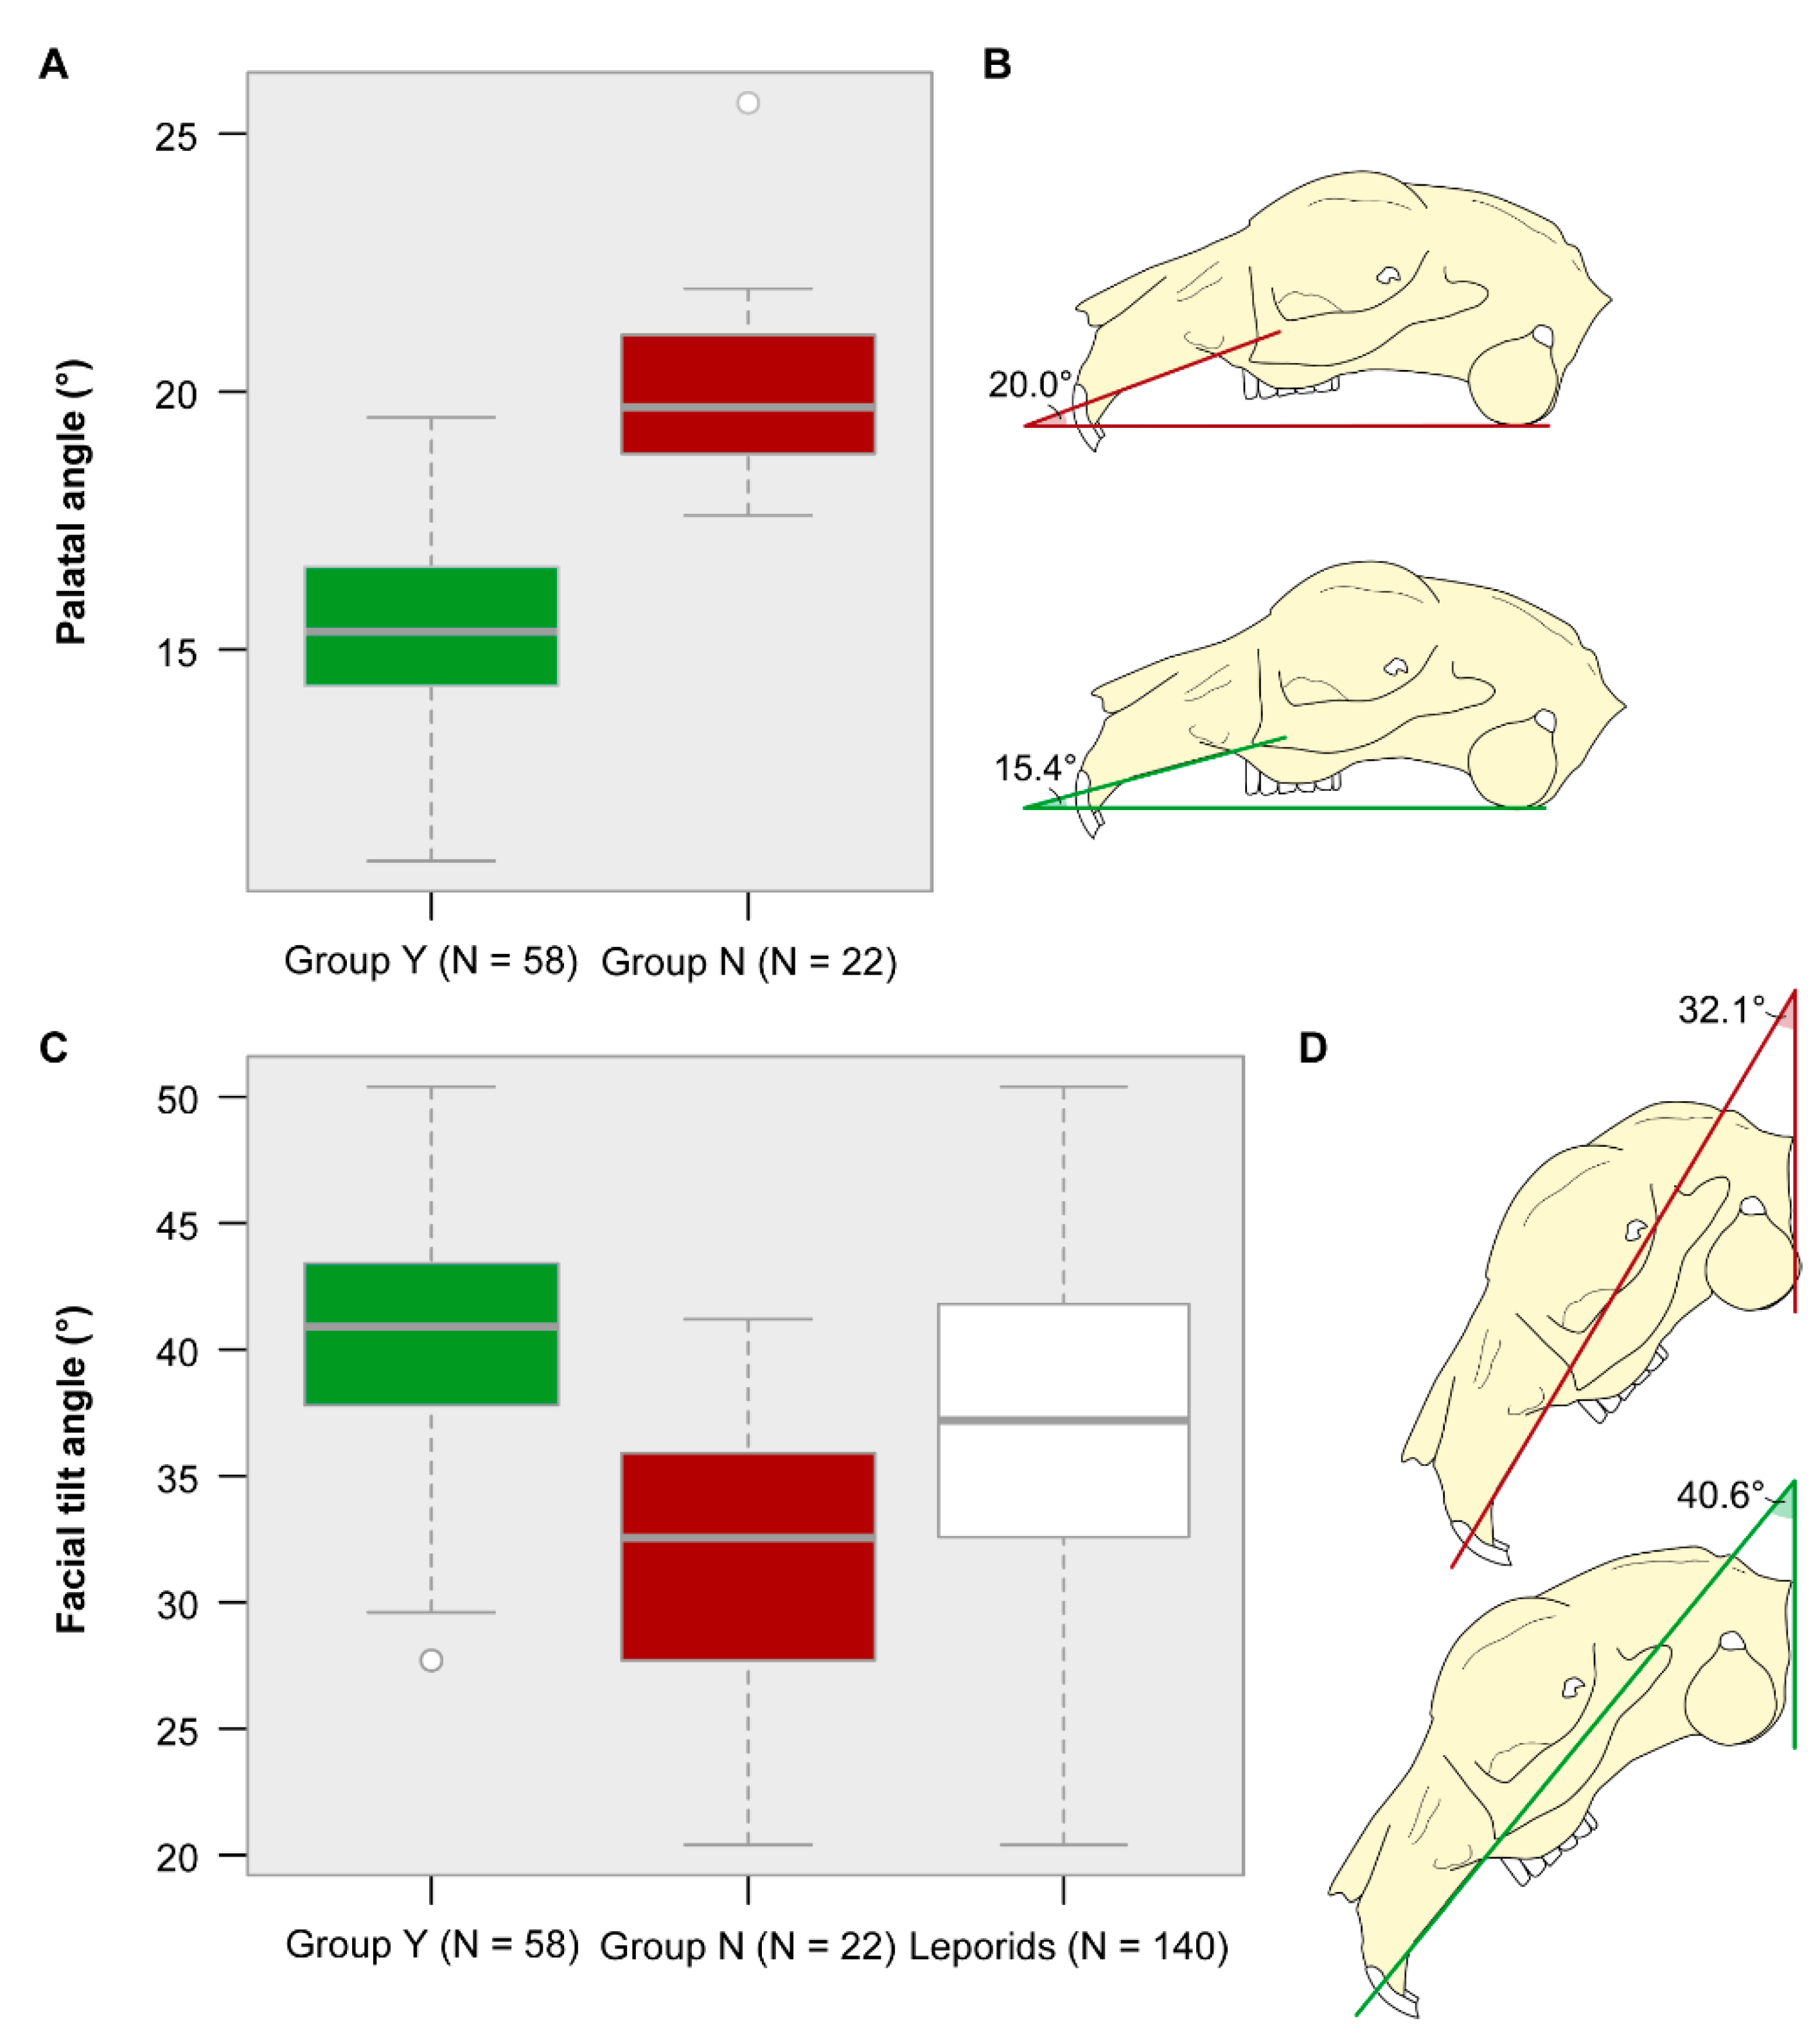
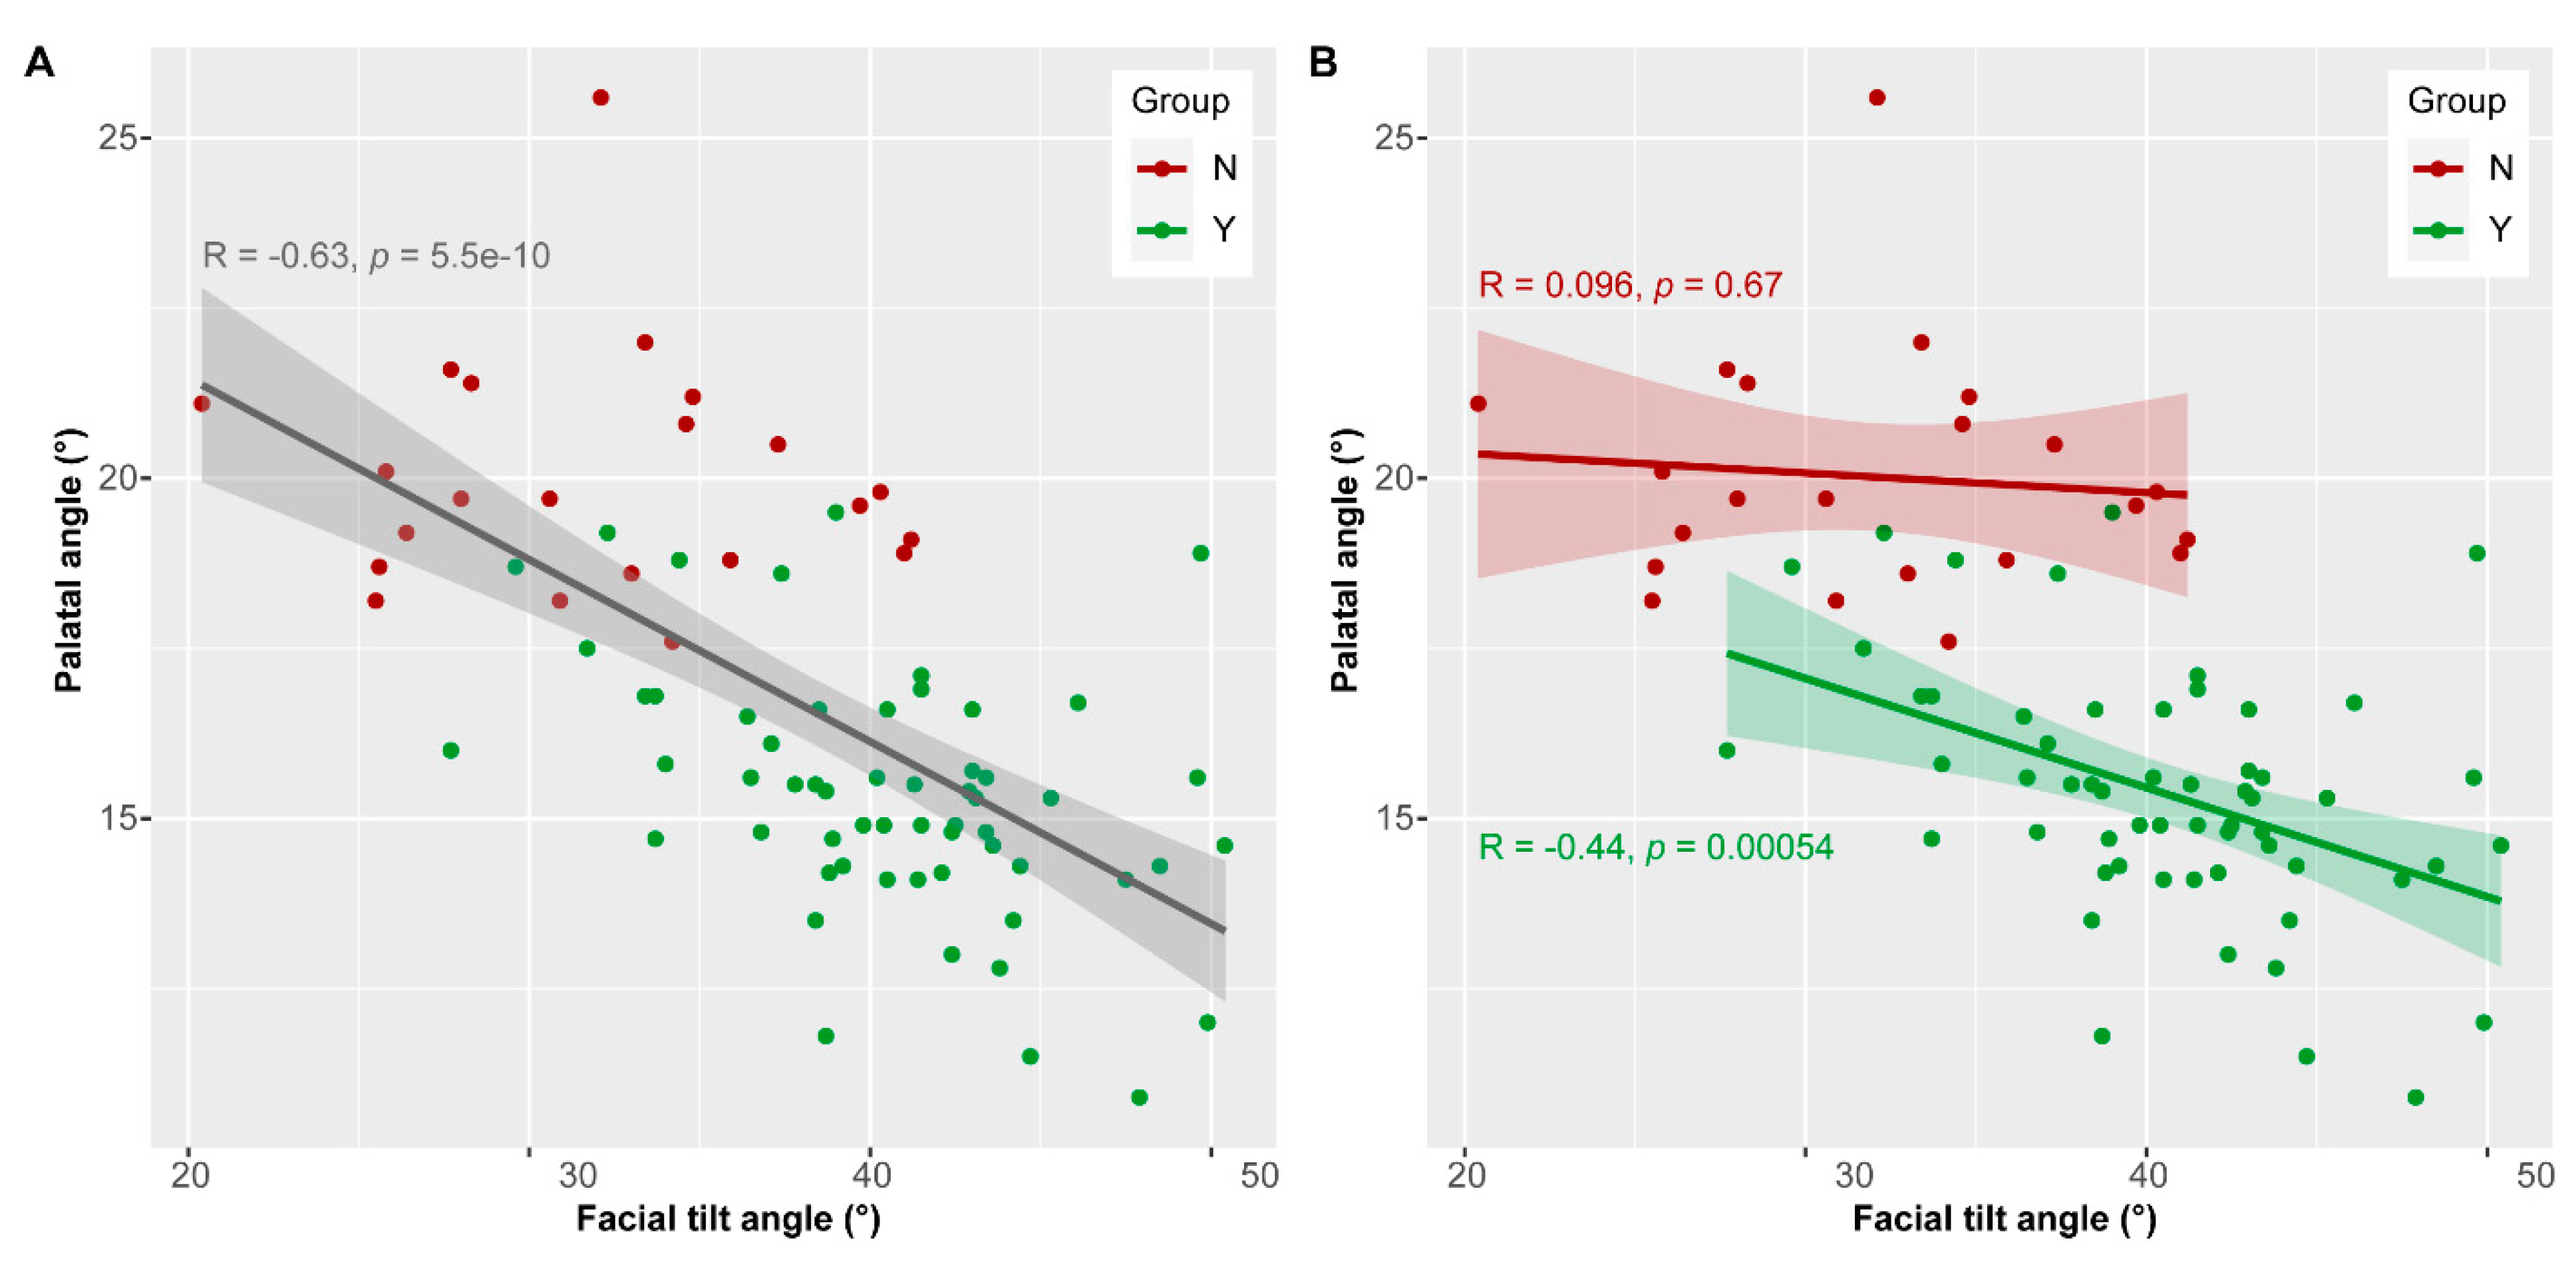
3.4. Palatal and Facial Tilt Angle
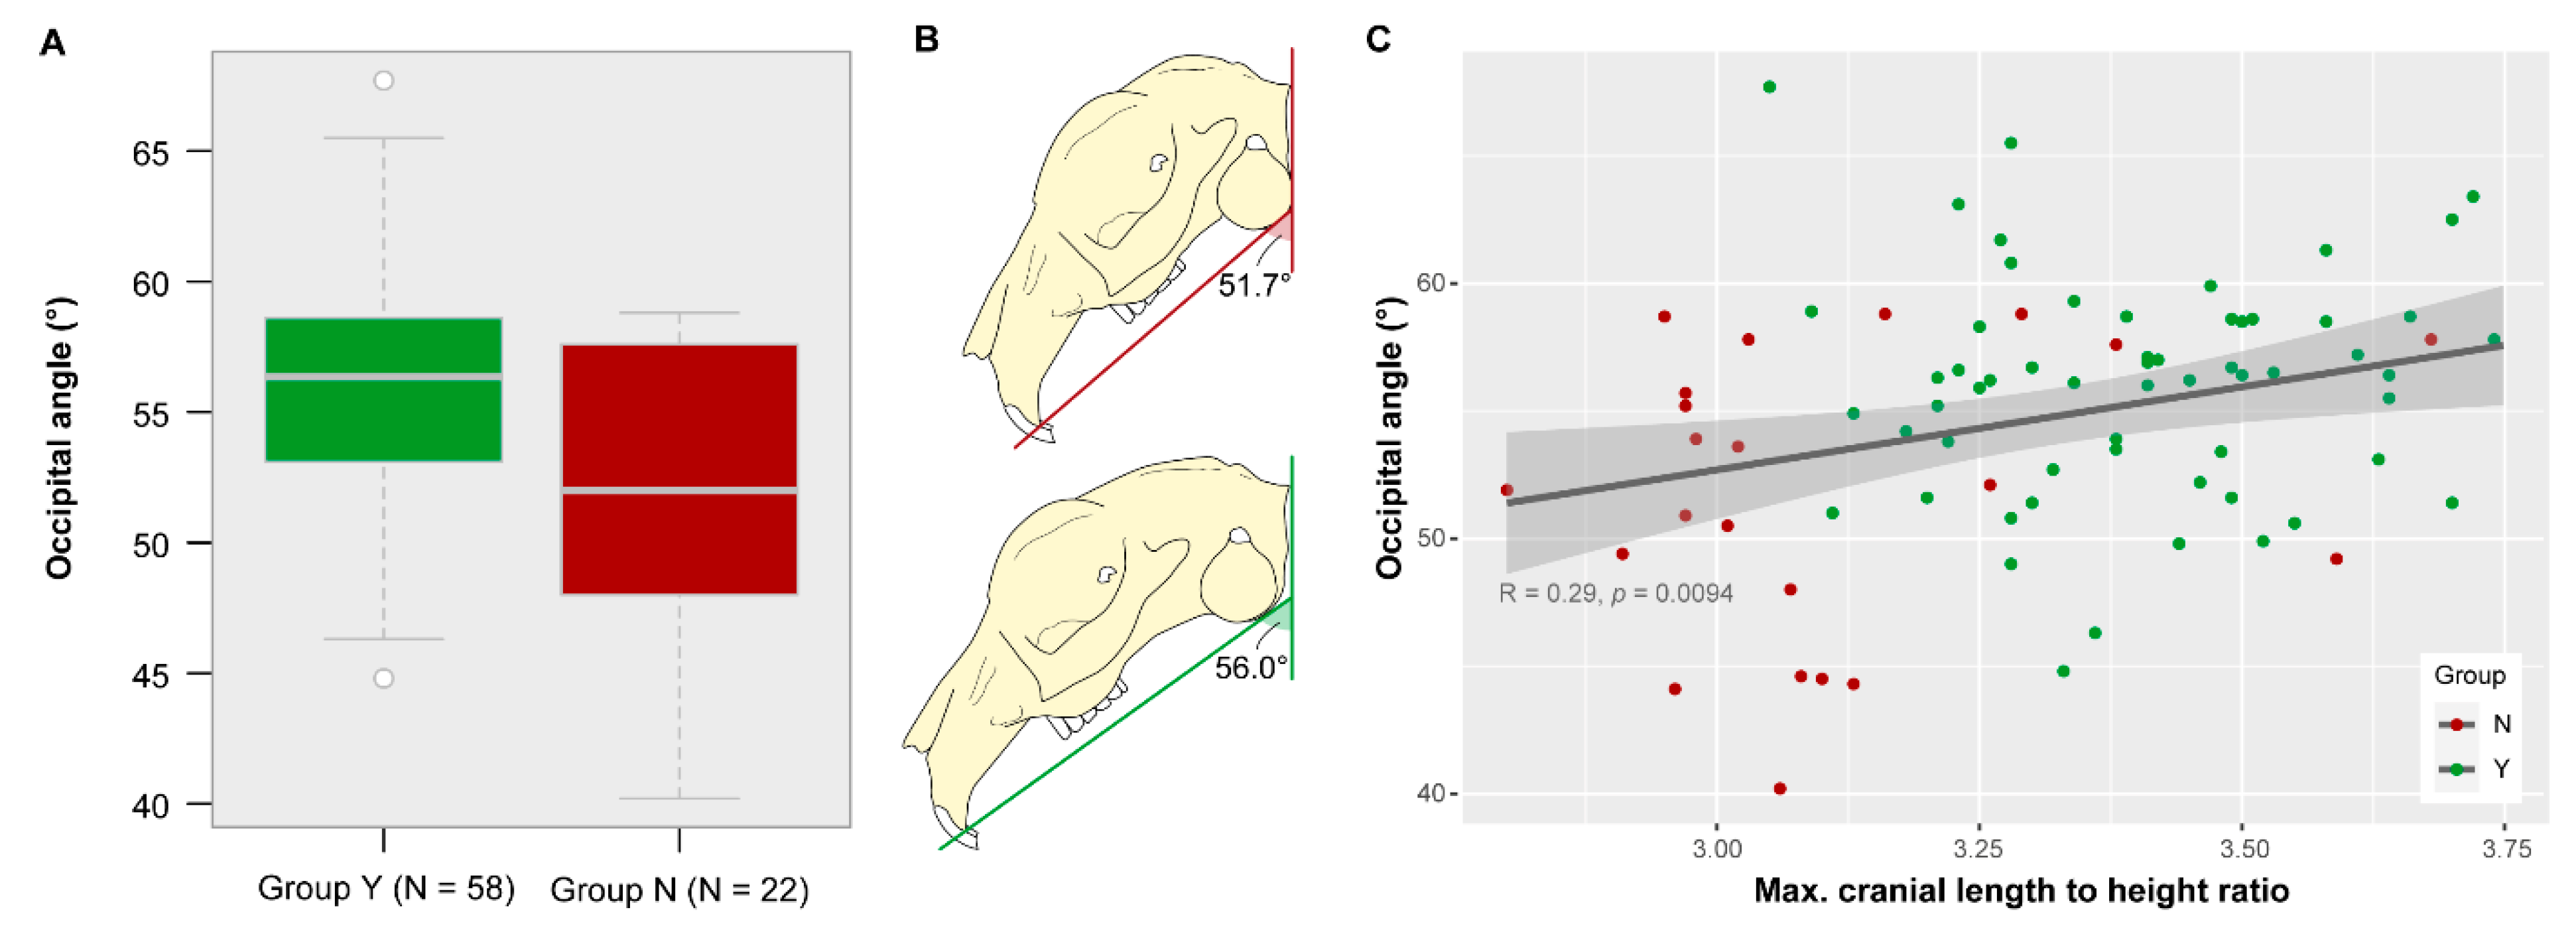
3.5. Occipital Angle
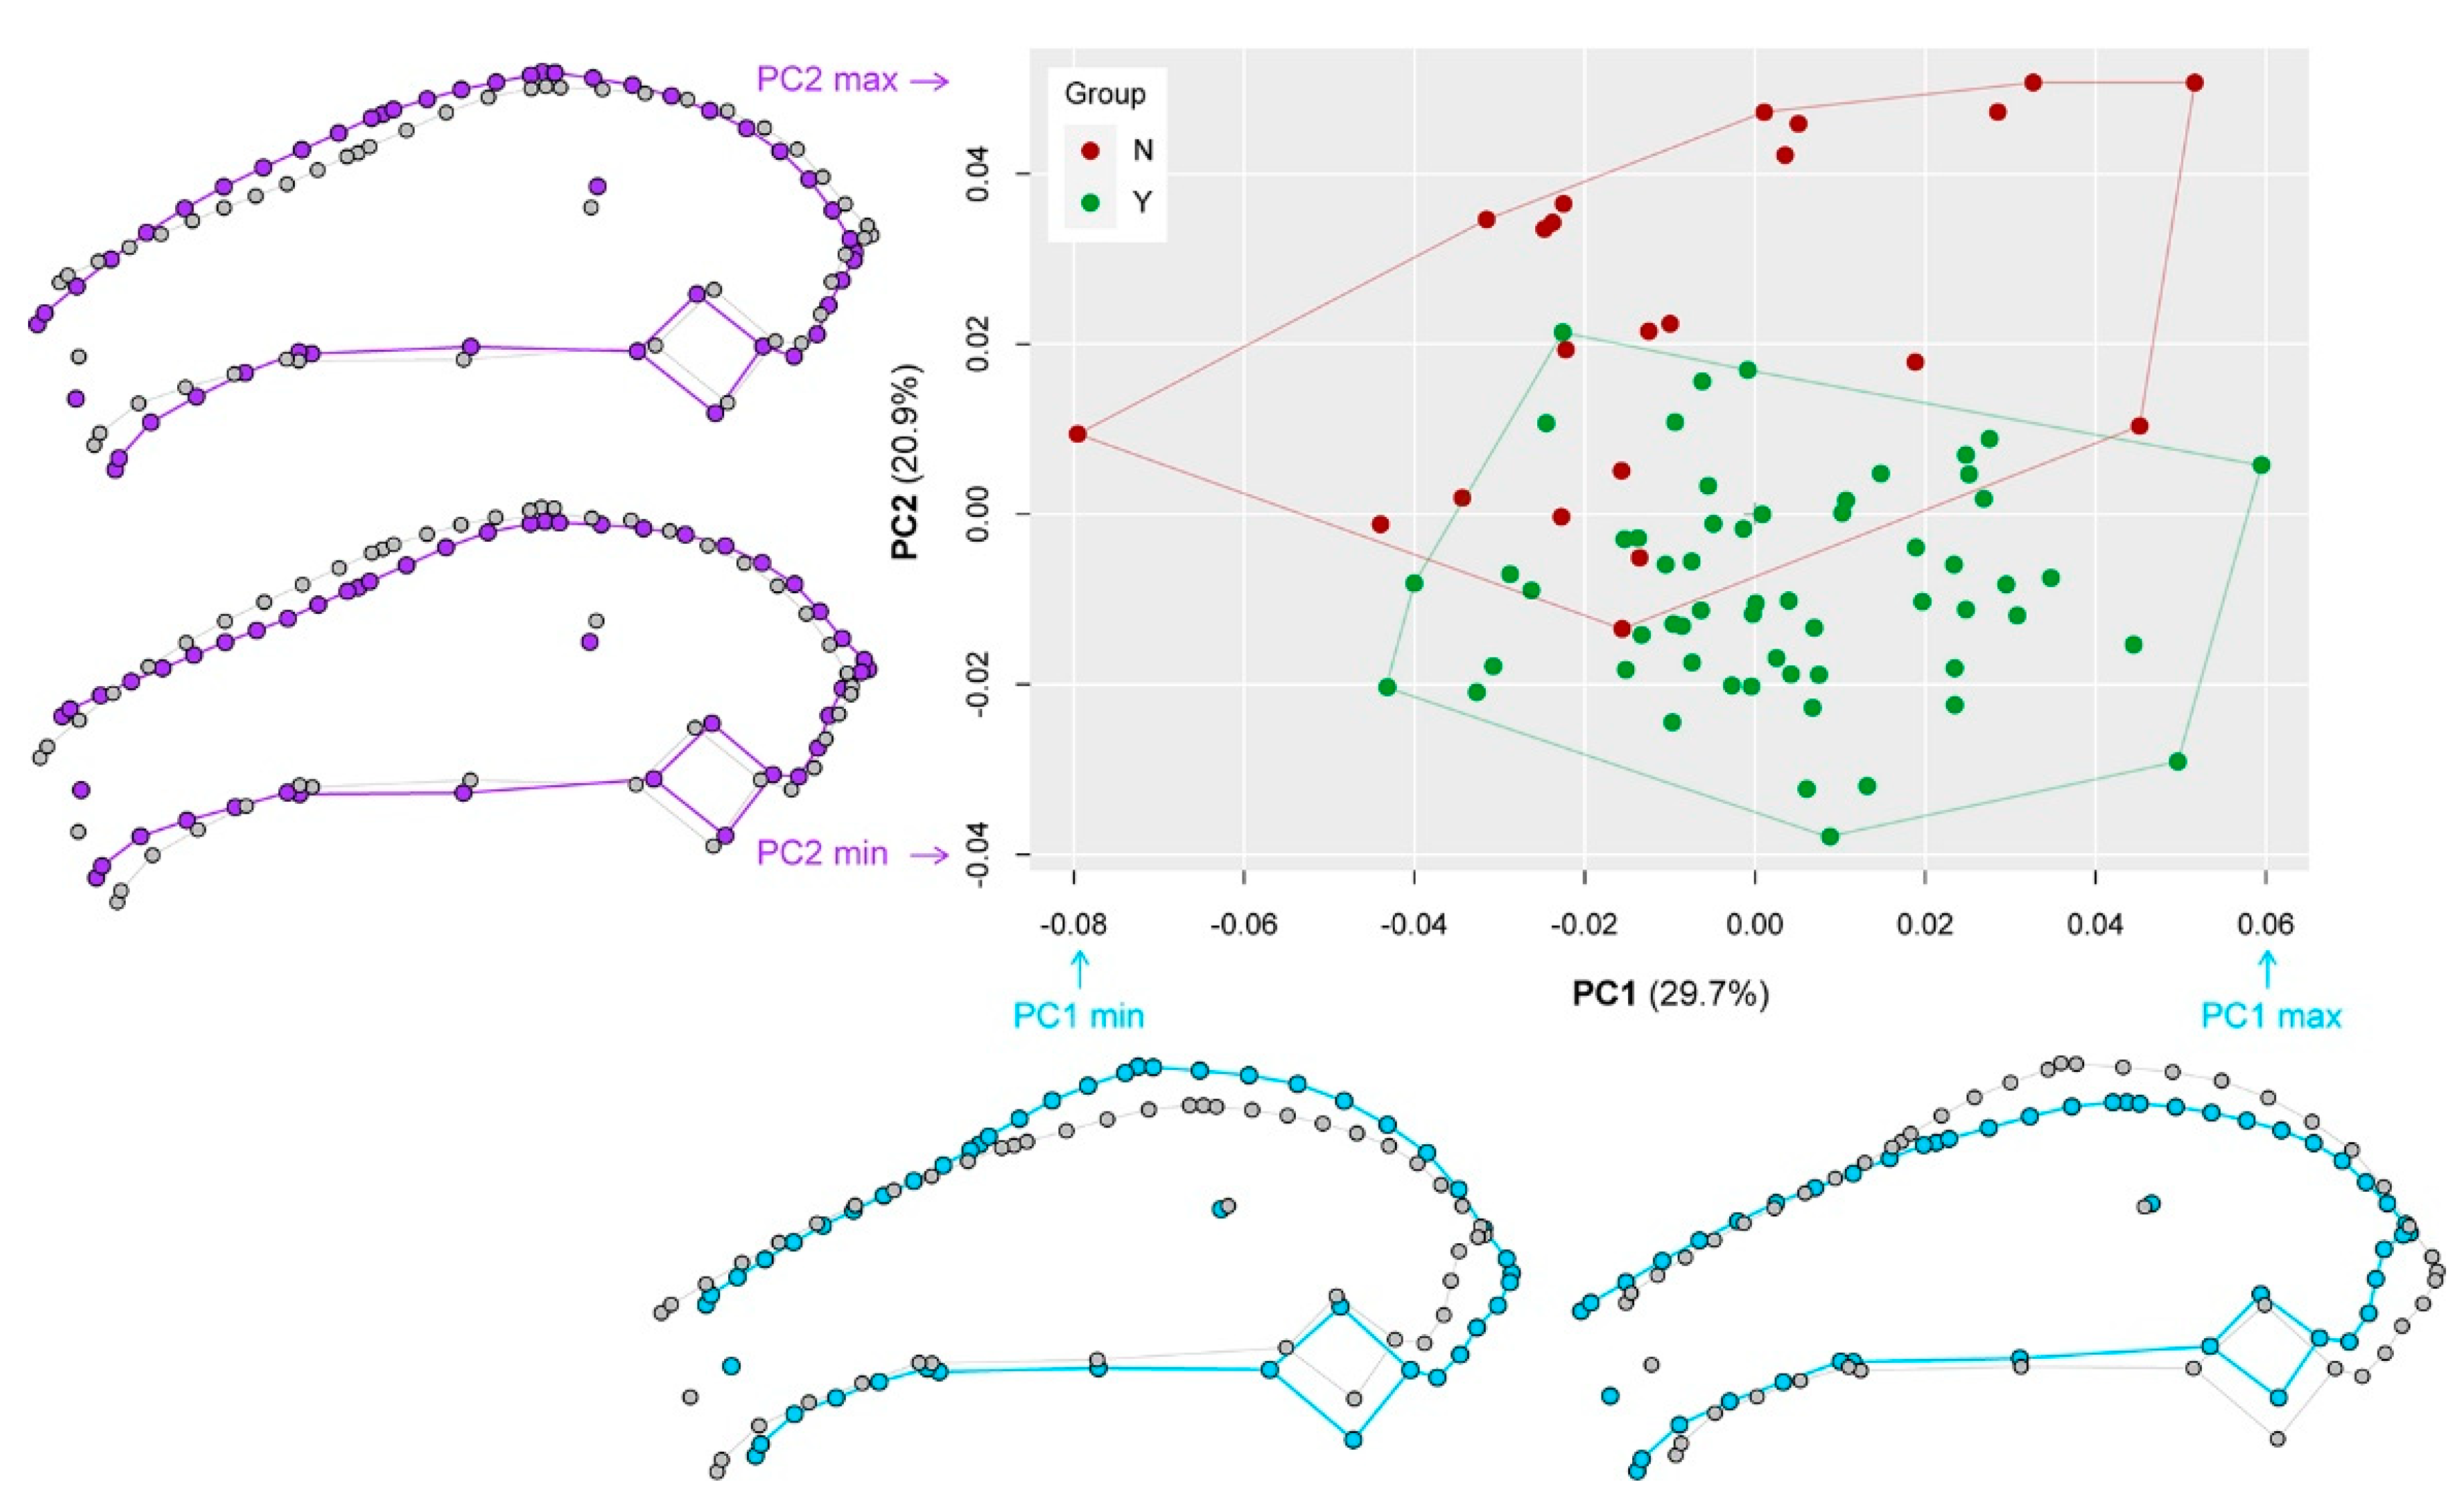
3.6. Geometric Morphometrics
4. Discussion
4.1. Skull Shape Diversity in Pet Rabbits
4.2. Evolutionary Transformations of the Rabbit Skull
4.3. Skull Development and Palate
4.4. Outlook: Breeding for Good Dental and Oral Health
5. Conclusions
Author Contributions
Funding
Conflicts of Interest
References
- O’Neill, D.G.; Craven, H.C.; Brodbelt, D.C.; Church, D.B.; Hedley, J. Morbidity and mortality of domestic rabbits (Oryctolagus cuniculus) under primary veterinary care in England. Veter. Rec. 2019, 186, 451. [Google Scholar] [CrossRef] [Green Version]
- Mullan, S.M.; Main, D.C.J. Survey of the husbandry, health and welfare of 102 pet rabbits. Veter. Rec. 2006, 159, 103–109. [Google Scholar] [CrossRef]
- British Small Animal Veterinary Association. BSAVA, Manual of Rabbit Surgery, Dentistry and Imaging; Harcourt-Brown, F.M., Chitty, J., Eds.; BSAVA: Gloucester, UK, 2016; p. 440. [Google Scholar]
- Jekl, V.; Hauptman, K.; Knotek, Z. Quantitative and qualitative assessments of intraoral lesions in 180 small herbivorous mammals. Veter. Rec. 2008, 162, 442–449. [Google Scholar] [CrossRef]
- Mäkitaipale, J.; Harcourt-Brown, F.M.; Laitinenvapaavuori, O. Health survey of 167 pet rabbits (Oryctolagus cuniculus) in Finland. Veter. Rec. 2015, 177, 418. [Google Scholar] [CrossRef] [PubMed]
- Weisbroth, S.H.; Ehrman, L. Malocclusion in the Rabbit: A Model for the Study of the Development, Pathology and Inheritance of Malocclusion. J. Hered. 1967, 58, 245–246. [Google Scholar] [CrossRef] [Green Version]
- Böhmer, E. Dentistry in Rabbits and Rodents; Wiley: Chisester, UK, 2015; p. 288. [Google Scholar]
- Rooney, N.J.; Blackwell, E.J.; Mullan, S.M.; Saunders, R.; Baker, P.E.; Hill, J.M.; Sealey, C.E.; Turner, M.J.; Held, S.D. The current state of welfare, housing and husbandry of the English pet rabbit population. BMC Res. Notes 2014, 7, 942. [Google Scholar] [CrossRef] [PubMed] [Green Version]
- Crossley, D.; Böhmer, E. Objective interpretation of dental disease in rabbits, guinea pigs and chinchillas. Tierärztliche Praxis Ausgabe K Kleintiere Heimtiere 2009, 37, 250–260. [Google Scholar] [CrossRef] [Green Version]
- Benato, L.; Rooney, N.J.; Murrell, J.C. Pain and analgesia in pet rabbits within the veterinary environment: A review. Veter. Anaesth. Analg. 2019, 46, 151–162. [Google Scholar] [CrossRef] [PubMed] [Green Version]
- Harcourt-Brown, F. Dental disease in pet rabbits: 1. Normal dentition, pathogenesis and aetiology. Practice 2009, 31, 370–379. [Google Scholar] [CrossRef]
- Capello, V. Diagnostic imaging of dental disease in pet rabbits and rodents. Veter. Clin. N. Am. Exot. Anim. Pr. 2016, 19, 757–782. [Google Scholar] [CrossRef]
- Korn, A.K.; Brandt, H.R.; Erhardt, G. Genetic and environmental factors influencing tooth and jaw malformations in rabbits. Veter. Rec. 2016, 178, 341. [Google Scholar] [CrossRef] [PubMed]
- Böhmer, C.; Böhmer, E. Shape Variation in the Craniomandibular System and Prevalence of Dental Problems in Domestic Rabbits: A Case Study in Evolutionary Veterinary Science. Veter. Sci. 2017, 4, 5. [Google Scholar] [CrossRef] [PubMed] [Green Version]
- Schneider, C.A.; Rasband, W.S.; Eliceiri, K.W. NIH Image to ImageJ: 25 years of image analysis. Nat. Methods 2012, 9, 671–675. [Google Scholar] [CrossRef] [PubMed]
- Bookstein, F.L. Morphometric Tools for Landmark Data: Geometry and Biology; Cambridge University Press: Cambridge, UK, 1991; p. 435. [Google Scholar]
- Rohlf, F.J. tpsDig2, version 2.17; Department of Ecology and Evolution, State University of New York at Stony Brook: Stony Brook, NY, USA, 2013. [Google Scholar]
- R Development Core Team. R: A Language and Environment for Statistical Computing; R Foundation for Statistical Computing: Vienna, Austria, 2020; Available online: https://www.eea.europa.eu/data-and-maps/indicators/oxygen-consuming-substances-in-rivers/r-development-core-team-2006 (accessed on 3 January 2020).
- Adams, D.C.; Otárola-Castillo, E. geomorph: Anrpackage for the collection and analysis of geometric morphometric shape data. Methods Ecol. Evol. 2013, 4, 393–399. [Google Scholar] [CrossRef]
- Zelditch, M.L.; Swiderski, D.L.; Sheets, H.D.; Fink, W.L. Geometric Morphometrics for Biologists; Academic Press: New York, NY, USA, 2004; p. 443. [Google Scholar]
- Rohlf, F.J.; Slice, D. Extensions of the Procrustes Method for the Optimal Superimposition of Landmarks. Syst. Zoöl. 1990, 39, 40–59. [Google Scholar] [CrossRef] [Green Version]
- Kassambara, A.; Mundt, F. Factoextra; R Foundation for Statistical Computing: Vienna, Austria, 2017. [Google Scholar]
- Kraatz, B.P.; Sherratt, E.; Bumacod, N.; Wedel, M.J. Ecological correlates to cranial morphology in Leporids (Mammalia, Lagomorpha). PeerJ 2015, 3, e844. [Google Scholar] [CrossRef] [Green Version]
- Crossley, A.D. Oral biology and disorders of lagomorphs. Veter. Clin. N. Am. Exot. Anim. Pr. 2003, 6, 629–659. [Google Scholar] [CrossRef]
- Bramble, D.M. Cranial Specialization and Locomotor Habit in the Lagomorpha. Am. Zool. 1989, 29, 303–317. [Google Scholar] [CrossRef] [Green Version]
- Moss, M.L.; Feliciano, W.C. A functional analysis of the fenestrated maxillary bone of the rabbit (Oryctolagus cuniculus). Anat. Histol. Embryol. 1977, 6, 167–187. [Google Scholar] [CrossRef]
- Dubrul, E.L. Posture, locomotion and the skull in Lagomorpha. Am. J. Anat. 1950, 87, 277–313. [Google Scholar] [CrossRef]
- Tucker, R. Studies in Functional and analytical craniology. 12. Experiments with the decalcified skull of the Rabbit. Aust. J. Zool. 1956, 4, 50. [Google Scholar] [CrossRef]
- Dawson, M.R. Late Tertiary Leporidae of North America. Univ. Kansas Paleont. Contrib. 1958, 22, 1–79. [Google Scholar]
- Vaughan, T.A.; Ryan, J.M.; Czaplewski, N.J. Mammalogy, 6th ed.; Jones & Bartlett Learning: Burlington, MA, USA, 2015; p. 756. [Google Scholar]
- Vidal, P.P.; Graf, W.; Berthoz, A. The orientation of the cervical vertebral column in unrestrained awake animals. Exp. Brain Res. 1986, 61, 549–559. [Google Scholar] [CrossRef] [PubMed]
- Martinez, N.L. Reconstruction of Ancestral Cranioskeletal Features in the Order Lagomorpha. In Evolutionary Relationships among Rodents; Springer Science and Business Media LLC.: New York, NY, USA, 1985; pp. 151–189. [Google Scholar] [CrossRef]
- Dubrul, E.L.; Laskin, D.M. Preadaptive potentialities of the mammalian skull: An experiment in growth and form. Am. J. Anat. 1961, 109, 117–132. [Google Scholar] [CrossRef]
- Babler, W.J. Effects of multiple suture closure on craniofacial growth in rabbits. In Craniofacial Morphogenesis and Dysmorphogenesis; Vig, K.W.L., Burdi, A.R., Ferrara, A., Eds.; Center for Human Growth and Development, University of Michigan: Ann Arbor, MI, USA, 1988; pp. 79–89. [Google Scholar]
- Babler, W.J.; Persing, J.A. Experimental alteration of cranial suture growth: Effects on the neurocranium, basicranium, and midface. Prog. Clin. Boil. Res. 1982, 101, 333–345. [Google Scholar]
- Moss, M.L. Rotation of the otic capsule in bipedal rats. Am. J. Phys. Anthr. 1961, 19, 301–307. [Google Scholar] [CrossRef]
- Ross, C.; Henneberg, M. Basicranial flexion, relative brain size, and facial kyphosis in Homo sapiens and some fossil hominids. Am. J. Phys. Anthr. 1995, 98, 575–593. [Google Scholar] [CrossRef]
- Ross, C.F.; Ravosa, M.J. Basicranial flexion, relative brain size, and facial kyphosis in nonhuman primates. Am. J. Phys. Anthr. 1993, 91, 305–324. [Google Scholar] [CrossRef]
- Solounias, N.; Moelleken, S.M.C. Dietary Adaptation of Some Extinct Ruminants Determined by Premaxillary Shape. J. Mammal. 1993, 74, 1059–1971. [Google Scholar] [CrossRef]
- Mess, A. The Evolutionary Differentiation of the Rostral Nasal Skeleton within Glires. A Review with New Data on Lagomorph Ontogeny. Zoosyst. Evol. 2008, 75, 217–228. [Google Scholar] [CrossRef]
- Frahner, S. Morphology and Evolution of the Glires Rostral Cranium. Zoosyst. Evol. 2008, 75, 229–246. [Google Scholar] [CrossRef]
- Berkovitz, B.; Shellis, P. The Teeth of Mammalian Vertebrates; Academic Press: London, UK, 2018. [Google Scholar]
- Ardran, G.M.; Kemp, F.H.; Ride, W.D.L. A radiographic analysis of mastication and swallowing in the domestic rabbit: Oryctolagus cuniculus. J. Zool. 2009, 130, 257–274. [Google Scholar] [CrossRef]
- Cardini, A.L.; Polly, P.D. Larger mammals have longer faces because of size-related constraints on skull form. Nat. Commun. 2013, 4, 2458. [Google Scholar] [CrossRef] [PubMed]
- Dingler, E.C. Die Schädelbasis in der vergleichenden Anatomie der Säugetiere bis zum Menschen. Anat. Histol. Embryol. 1974, 3, 1–28. [Google Scholar] [CrossRef]
- Hofer, H. Der Gestaltswandel des Schädels der Säugetiere und Vögel, mit besonderer Berücksichtigung der Knickungstypen und der Schädelbasis. Verh Anat Ges Marburg Anat Anz 1952, 99, 102–113. [Google Scholar]
- Rosenberg, K.F.A. Die postnatale Proportionsänderung der Schädel zweier extremer Wuchsformen des Haushundes. Z. für Tierzüchtung und Züchtungsbiologie 2010, 82, 1–36. [Google Scholar] [CrossRef]
- Geiger, M.; Haussman, S. Cranial Suture Closure in Domestic Dog Breeds and Its Relationships to Skull Morphology. Anat. Rec. Adv. Integr. Anat. Evol. Biol. 2016, 299, 412–420. [Google Scholar] [CrossRef] [Green Version]
- Nussbaumer, M. Über die Variabilität der dorso-basalen Schädelknickungen bei Haushunden. Zool. Anz. 1982, 209, 1–32. [Google Scholar]
- Menegaz, R.A.; Sublett, S.V.; Figueroa, S.D.; Hoffman, T.J.; Ravosa, M.J. Phenotypic Plasticity and Function of the Hard Palate in Growing Rabbits. Anat. Rec. Adv. Integr. Anat. Evol. Biol. 2009, 292, 277–284. [Google Scholar] [CrossRef]
- He, T.; Kiliaridis, S. Effects of masticatory muscle function on craniofacial morphology in growing ferrets (Mustela putorius furo). Eur. J. Oral Sci. 2003, 111, 510–517. [Google Scholar] [CrossRef]
- Kiliaridis, S. The Importance of Masticatory Muscle Function in Dentofacial Growth. Semin. Orthod. 2006, 12, 110–119. [Google Scholar] [CrossRef]
- Kiliaridis, S.; Engström, C.; Thilander, B. The relationship between masticatory function and craniofacial morphology: I. A cephalometric longitudinal analysis in the growing rat fed a soft diet. Eur. J. Orthod. 1985, 7, 273–283. [Google Scholar] [CrossRef] [PubMed]
- Strait, D.S.; Richmond, B.G.; Spencer, M.A.; Ross, C.F.; Dechow, P.C.; Wood, B.A. Masticatory biomechanics and its relevance to early hominid phylogeny: An examination of palatal thickness using finite-element analysis. J. Hum. Evol. 2007, 52, 585–599. [Google Scholar] [CrossRef] [PubMed]
- Holtgrave, E.A.; Muller, R. Kephalometrische Untersuchungen am Unterkiefer nach dorsaler Massetertransposition. J. Orofacial Orthop. Fortschritte der Kieferorthopädie 1993, 54, 268–275. [Google Scholar] [CrossRef]
- Clutton-Brock, J. A Natural History of Domesticated Mammals; Cambridge University Press: Cambridge, UK, 1999; p. 238. [Google Scholar]
- Whitman, B.D. Domestic Rabbits and Their Histories; Leathers Publishing: Leawodd, KN, USA, 2004; p. 456. [Google Scholar]
- Carneiro, M.; Afonso, S.; Geraldes, A.; Garreau, H.; Bolet, G.; Boucher, S.; Tircazes, A.; Queney, G.; Nachman, M.W.; Ferrand, N. The Genetic Structure of Domestic Rabbits. Mol. Biol. Evol. 2011, 28, 1801–1816. [Google Scholar] [CrossRef] [Green Version]


| Linear Measurement | Definition |
|---|---|
| Caudal nasal height | Distance (perpendicular to the nasal plane) between the caudal nasal roof and the palate (at the rostral intersection between maxillary bone and first maxillary cheek tooth P2) |
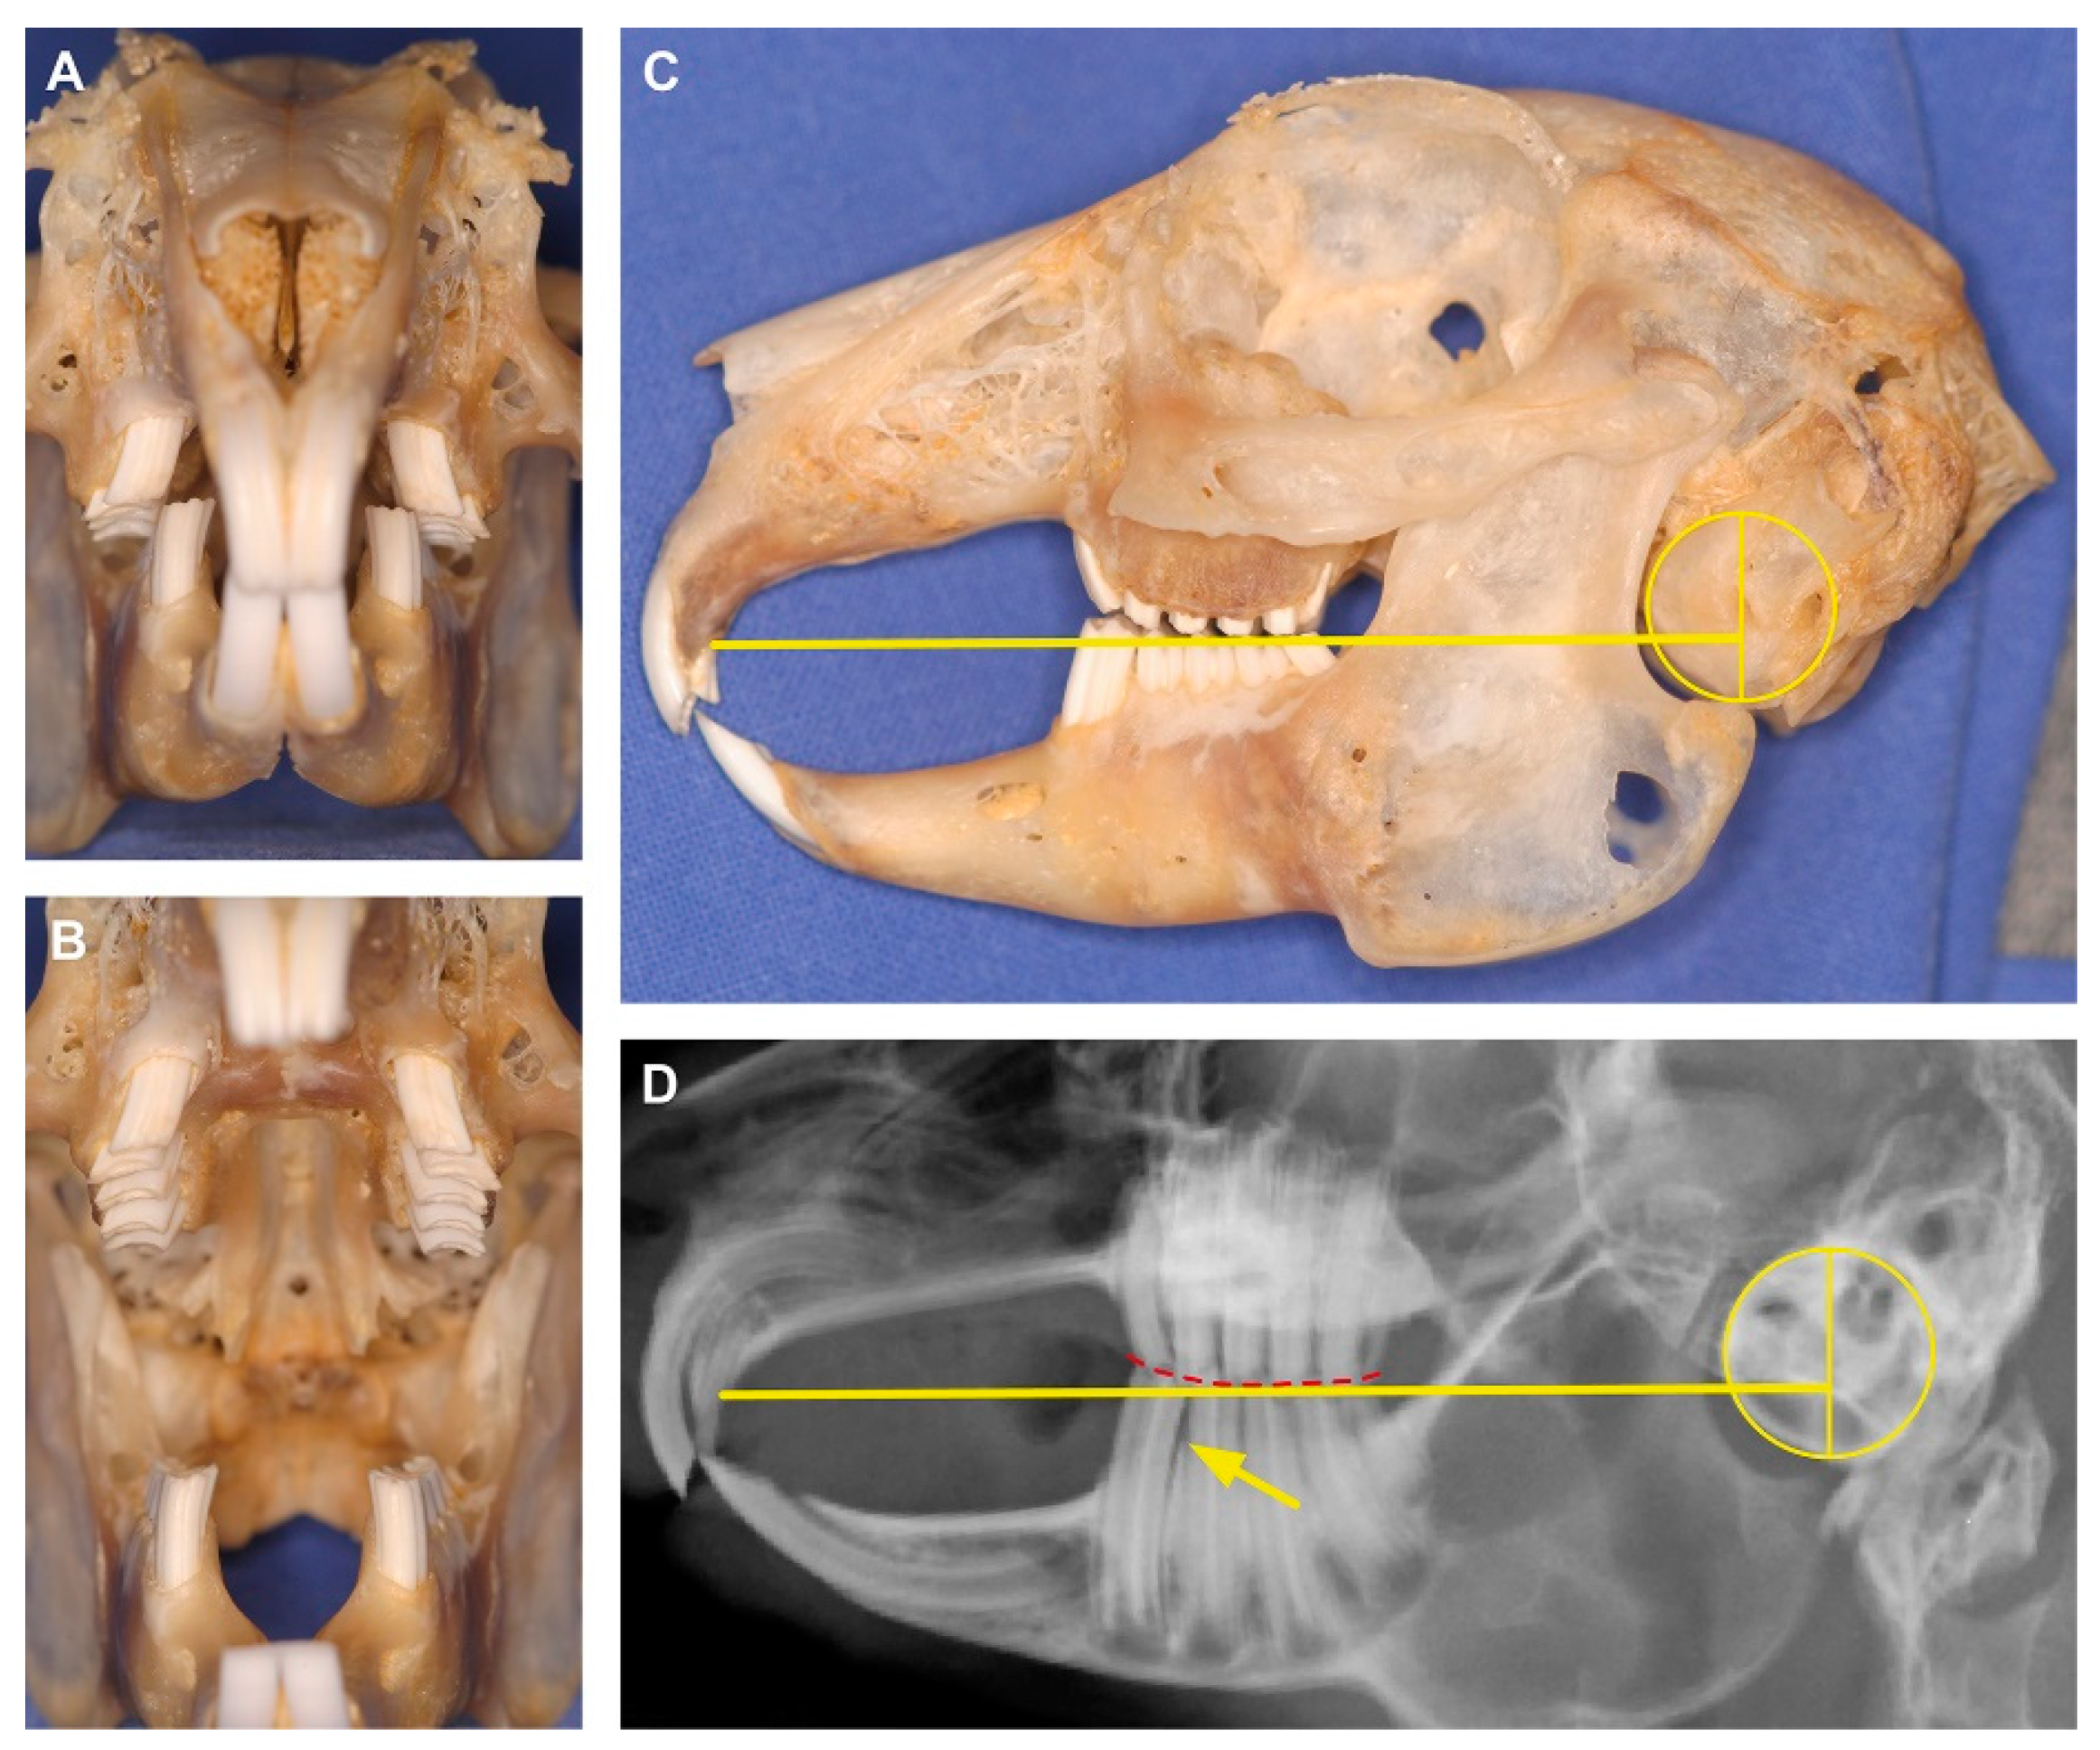
| Maximal cranial length | Maximal distance between the most rostral end of the upper incisor and the occipital protuberance (crossing the most rostral point of the hard palate) |
| Maximal cranial height | Maximal distance between the mandibular facial incisure to the most dorsal point of the frontal bone |
| Maxillary molar length | Maximal distance between the first maxillary cheek tooth P2 and the last maxillary molar M3 |
| Palatal length | Distance between the most rostral end of the palate (at the intersection between second maxillary incisor I2 (peg tooth) and maxillary bone) and the rostral intersection between maxillary bone and first maxillary cheek tooth P2 |
| Rostral nasal height | Distance (perpendicular to the nasal plane) between the rostral nasal roof (at the most rostral end of the nasal bone) and the palate |
| Plane | |
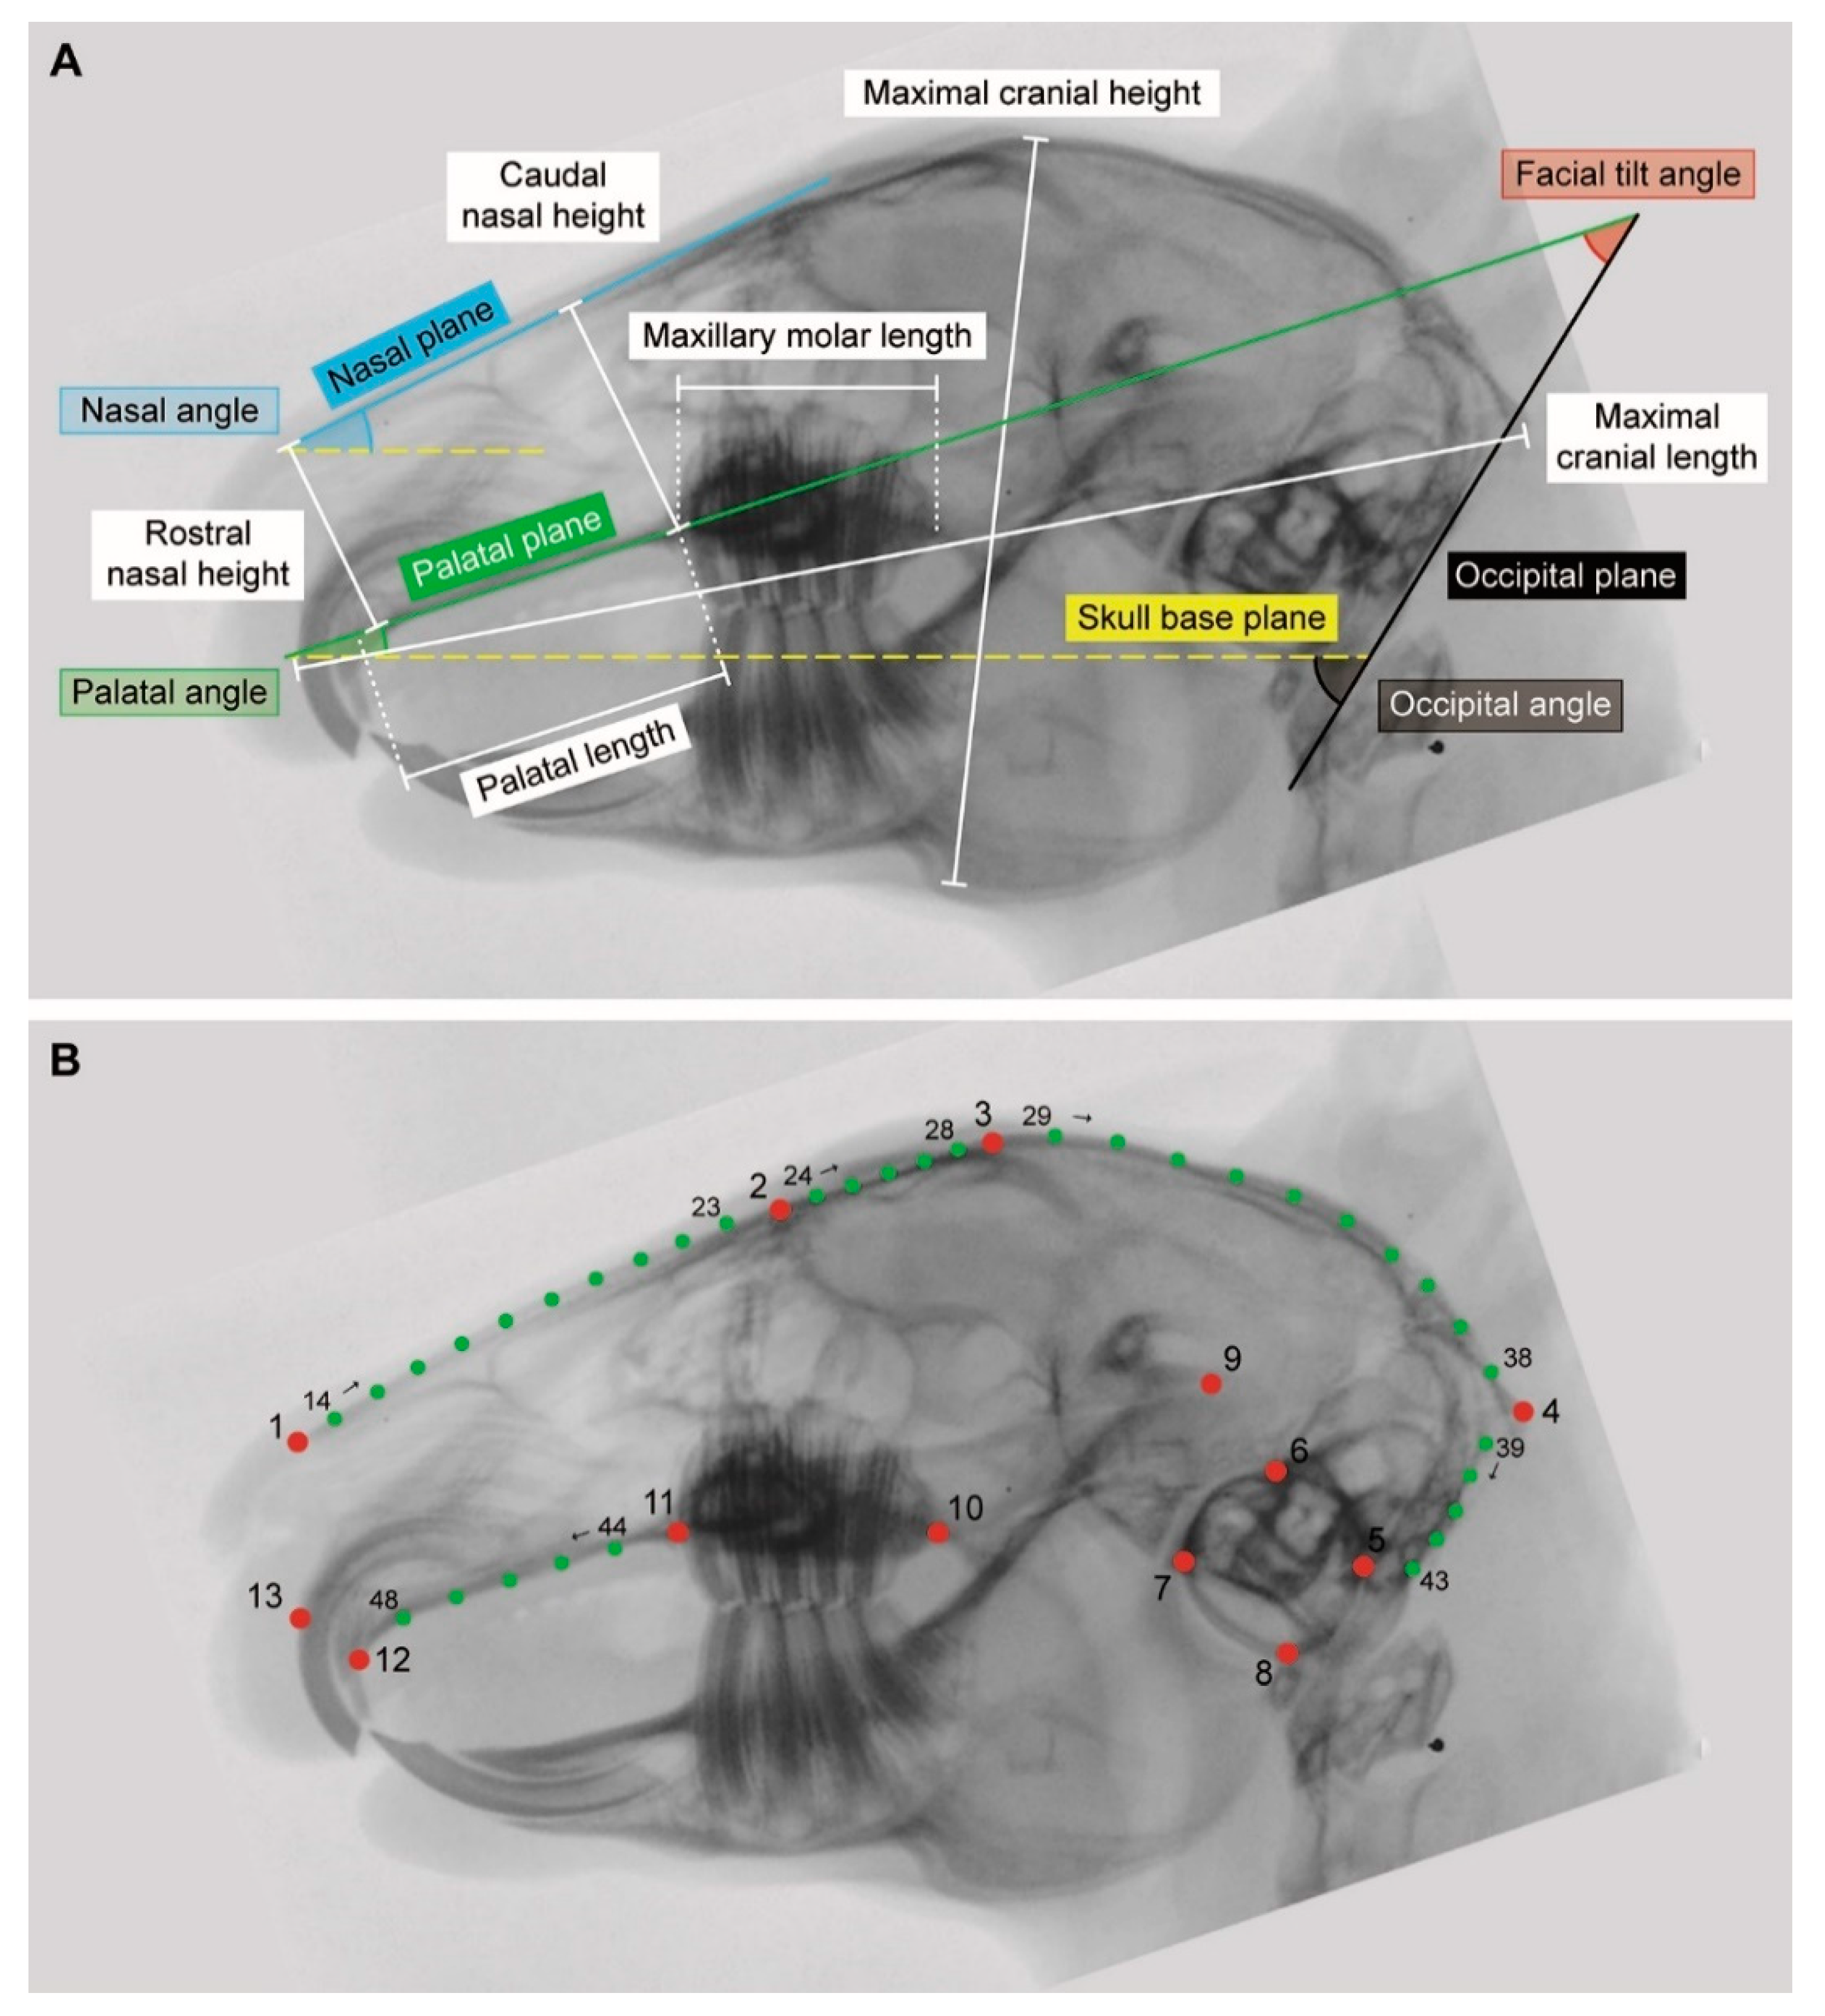
| Nasal plane | Tangent to the nasal bone |
| Occipital plane | Tangent to the occiput (great foramen) |
| Palatal plane | Tangent to the hard palate (without its most rostral part which slopes downwards) |
| Skull base plane | Line connecting the rostral end of the hard palate immediately caudal to the second incisor and the ventral border of the tympanic bullae |
| Angle | |
| Facial tilt angle | Angle between the palatal plane and the occipital plane |
| Nasal angle | Angle between the nasal plane and the skull base plane |
| Occipital angle | Angle between the occipital plane and the skull base plane |
| Palatal angle | Angle between the palatal plane and the skull base plane |
| # | Type | Definition |
|---|---|---|
| LM | ||
| 1 | II | Most rostral point of nasal bone |
| 2 | I | Intersection between nasal bone and rostral orbital roof |
| 3 | I | Intersection between frontal bone and caudal orbital roof |
| 4 | II | Most caudal point of occipital protuberance |
| 5 | II | Most caudal point of tympanic bulla |
| 6 | II | Most dorsal point of tympanic bulla |
| 7 | II | Most rostral point of tympanic bulla |
| 8 | II | Most ventral point of tympanic bulla |
| 9 | III | Center of temporomandibular joint |
| 10 | I | Caudal intersection between maxillary bone and last maxillary molar M3 |
| 11 | I | Rostral intersection between maxillary bone and first maxillary cheek tooth P2 |
| 12 | I | Intersection between second maxillary incisor I2 (peg tooth) and premaxillary bone |
| 13 | I | Rostral intersection between first maxillary incisor I1 and premaxillary bone |
| SemiLM | ||
| 14–23 | - | Nasal bone (curve between LM1 and LM2) |
| 24–28 | - | Orbital roof (curve between LM2 and LM3) |
| 29–38 | - | Dorsal braincase (curve between LM3 and LM4) |
| 39–43 | - | Occiput (curve between LM4 and LM5) |
| 44–48 | - | Palate (curve between LM11 and LM12) |
| Group Y vs. Group N | F Value | p-Value |
|---|---|---|
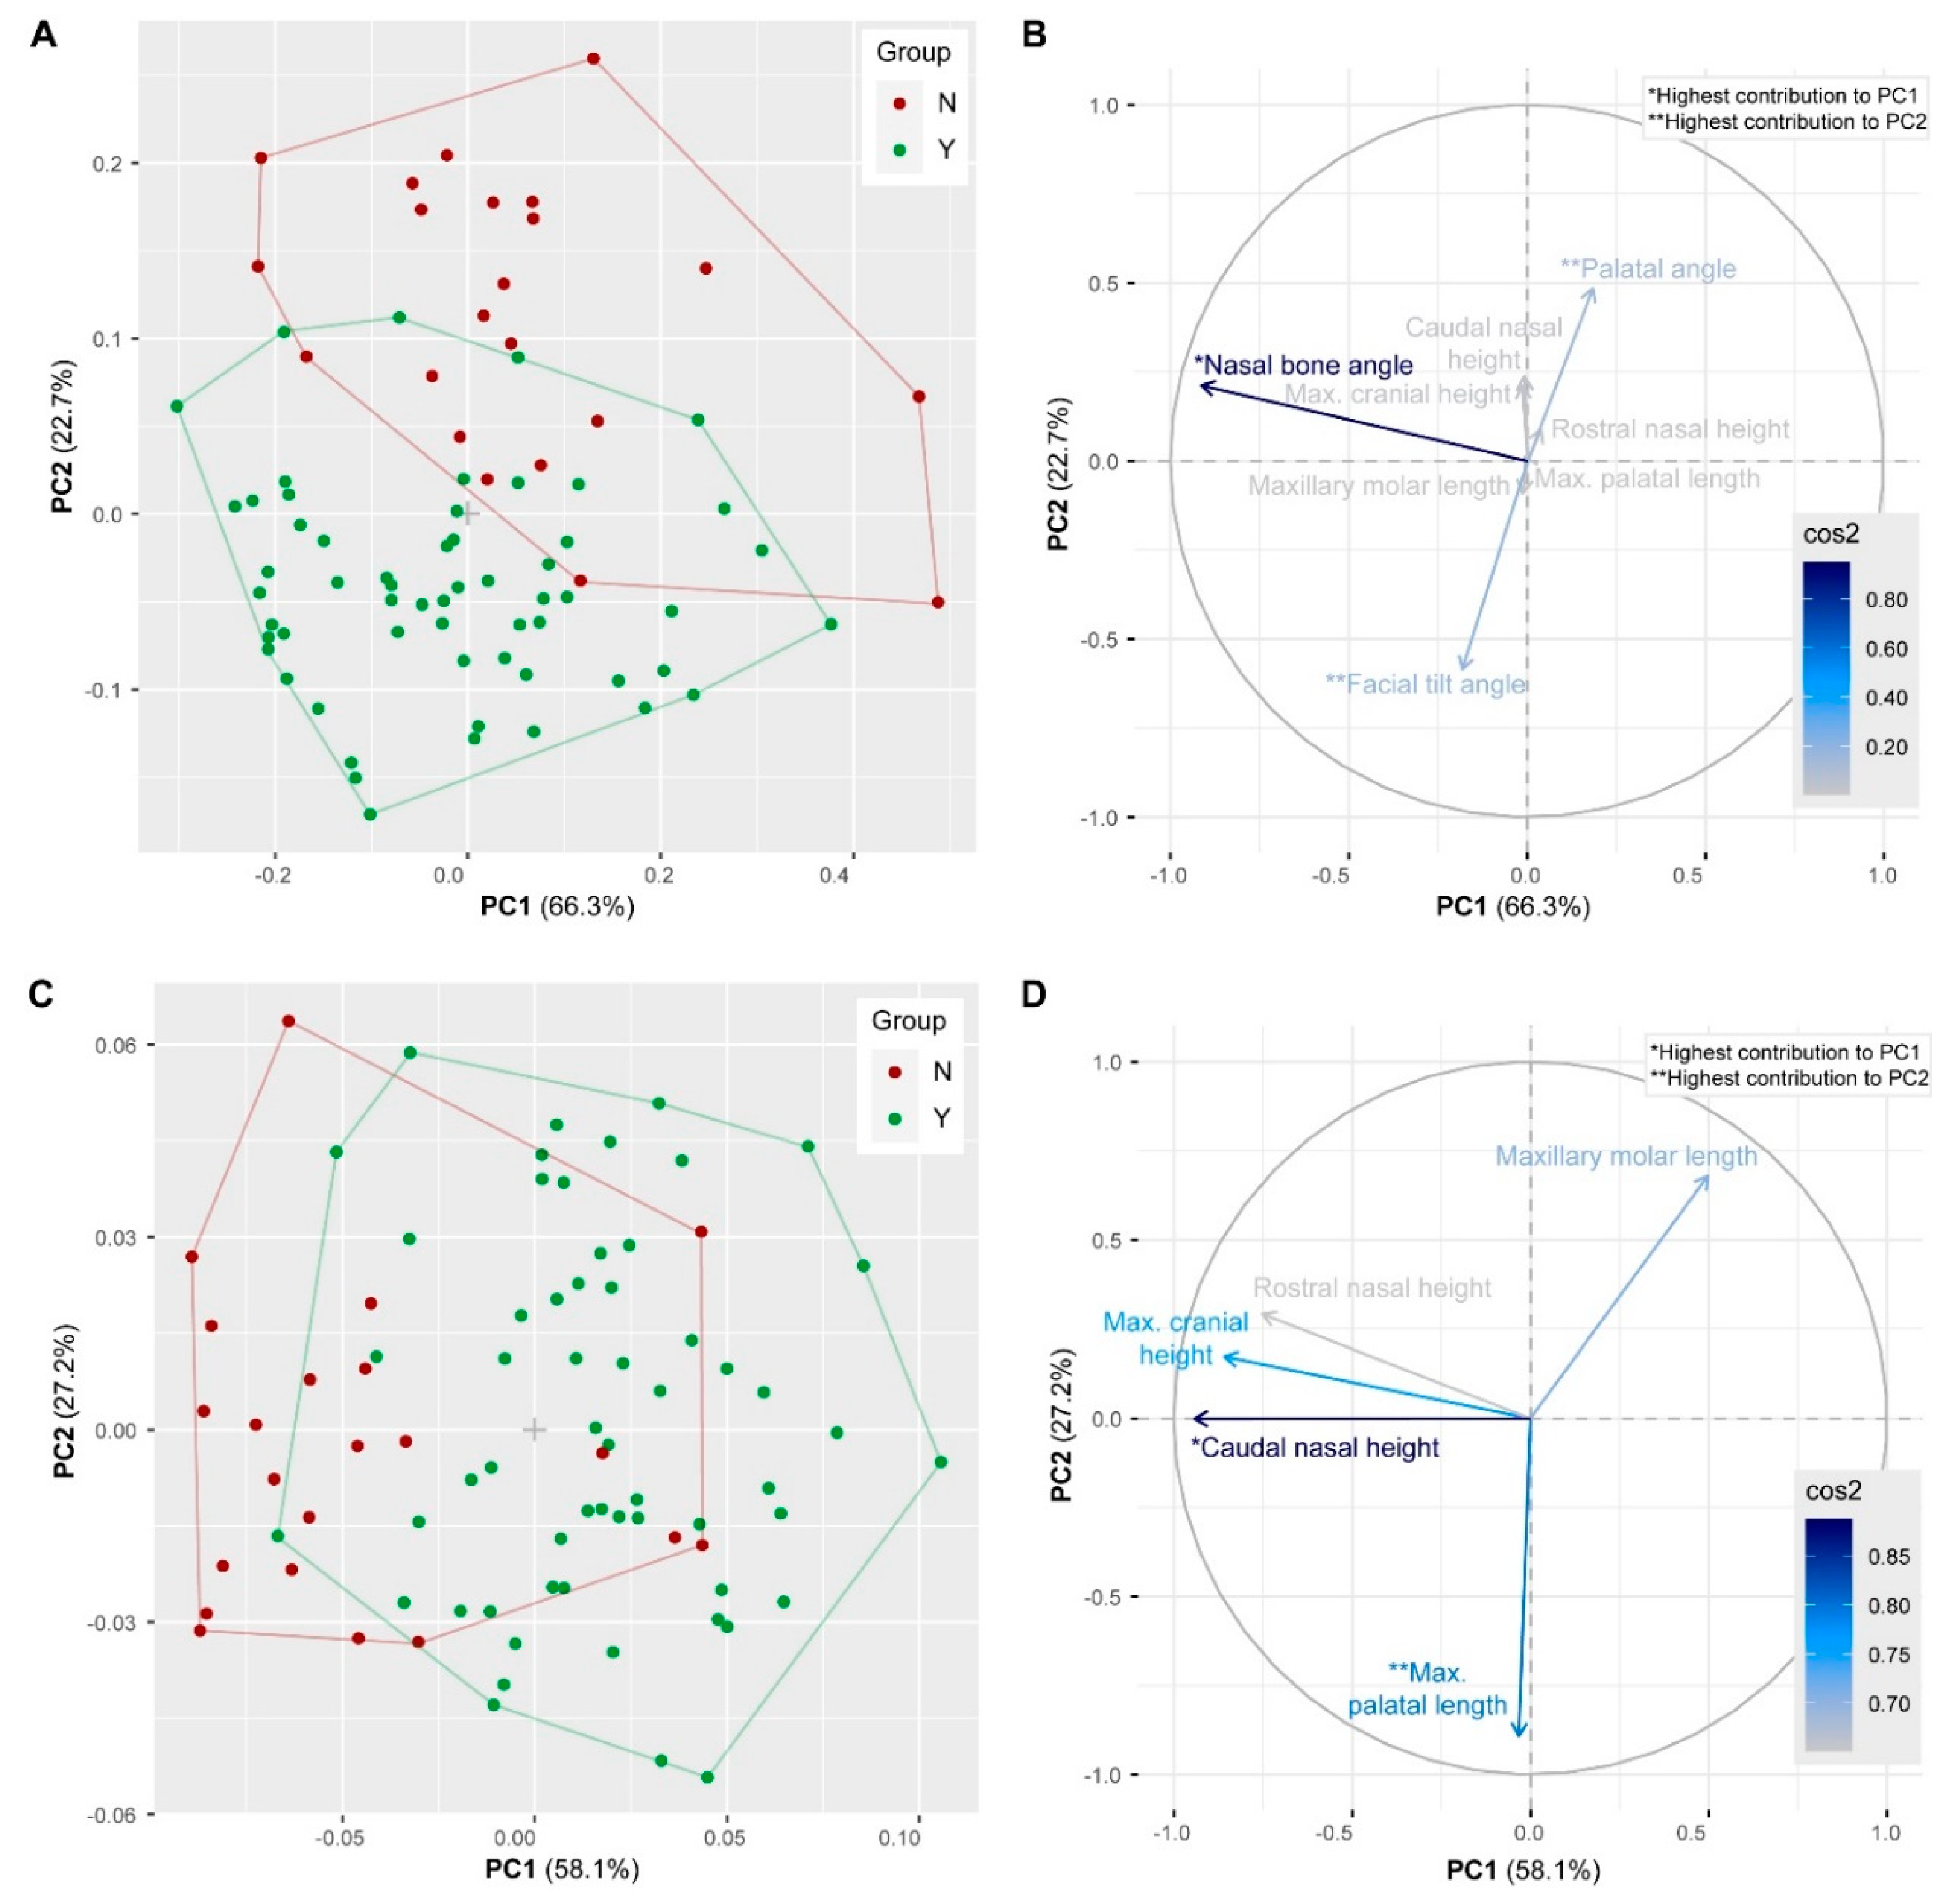
| Palatal angle | 90.654 | <0.0001 * |
| Caudal nasal height | 46.971 | <0.0001 * |
| Facial tilt angle | 43.599 | <0.0001 * |
| Maximal cranial height | 42.792 | <0.0001 * |
| Maxillary molar length | 6.6609 | 0.01 * |
| Rostral nasal height | 6.1633 | 0.01 * |
| Nasal bone angle | 0.6396 | 0.4263 |
| Maximal palatal length | 0.2096 | 0.6483 |
| l/h Ratio | Group Y (N = 58) | Group N (N = 22) |
|---|---|---|
| Minimum | 3.05 | 2.8 |
| Mean | 3.40 | 3.11 |
| Maximum | 3.74 | 3.68 |
| Variance | 0.03 | 0.05 |
| Variable | Correctly Assigned to Group N | Correctly Assigned to Group Y |
|---|---|---|
| Rostral nasal height | 22.7% | 51.7% |
| Caudal nasal height | 81.8% | 82.8% |
| Facial tilt angle | 77.3% | 62.1% |
| Palatal angle | 100% | 87.9% |
Publisher’s Note: MDPI stays neutral with regard to jurisdictional claims in published maps and institutional affiliations. |
© 2020 by the authors. Licensee MDPI, Basel, Switzerland. This article is an open access article distributed under the terms and conditions of the Creative Commons Attribution (CC BY) license (http://creativecommons.org/licenses/by/4.0/).
Share and Cite
Böhmer, C.; Böhmer, E. Skull Shape Diversity in Pet Rabbits and the Applicability of Anatomical Reference Lines for Objective Interpretation of Dental Disease. Vet. Sci. 2020, 7, 182. https://doi.org/10.3390/vetsci7040182
Böhmer C, Böhmer E. Skull Shape Diversity in Pet Rabbits and the Applicability of Anatomical Reference Lines for Objective Interpretation of Dental Disease. Veterinary Sciences. 2020; 7(4):182. https://doi.org/10.3390/vetsci7040182
Chicago/Turabian StyleBöhmer, Christine, and Estella Böhmer. 2020. "Skull Shape Diversity in Pet Rabbits and the Applicability of Anatomical Reference Lines for Objective Interpretation of Dental Disease" Veterinary Sciences 7, no. 4: 182. https://doi.org/10.3390/vetsci7040182