Article

Genetic Diversity and Reproduction Trends of Phytophthora infestans in Estonia: EU_41_A2 Detected without an Indication of Clonal Reproduction

1
Institute of Agricultural and Environmental Sciences, Estonian University of Life Sciences, Kreutzwaldi 1, 51006 Tartu, Estonia
2
Centre of Estonian Rural Research and Knowledge, 48309 Jõgeva, Estonia
*
Author to whom correspondence should be addressed.
J. Fungi 2024, 10(3), 233; https://doi.org/10.3390/jof10030233
Submission received: 5 March 2024 / Revised: 18 March 2024 / Accepted: 19 March 2024 / Published: 21 March 2024

Abstract

:
This study explores the population dynamics of Phytophthora infestans in Estonia from 2005 to 2022, focusing on genetic diversity and potential shifts in reproductive strategies. In total, 153 P. infestans isolates were collected throughout Estonia over ten growing seasons. Genotyping revealed considerable genetic diversity, with most isolates not corresponding to known multilocus genotypes (MLGs). Still, instances of invasive clonal lineages were observed, notably EU_41_A2. The data indicate the likelihood of random mating rather than clonal reproduction in all the analyzed years. The principal coordinate analysis (PCoA) results revealed no distinct clustering among the sampling years. Statistical analysis and the minimum spanning network (MSN) indicated low genetic differentiation between years with minimal fluctuations in allele frequencies. The continuous monitoring of P. infestans populations is essential for detecting any changes from the current evolutionary trajectory and implement effective disease management strategies, especially considering the recent emergence of EU_41_A2 in the Nordics and the potential impacts of climate change.

1. Introduction

Phytophthora infestans, an oomycete pathogen, has caused devastating epidemics, severely impacting potato and tomato production globally. The pathogen’s ability to rapidly adapt and overcome resistance measures [1,2] requires a comprehensive understanding of the pathogen’s population dynamics. In Northern Europe, the pathogen’s populations have been characterized by a wide range of genetic diversity and probable sexual reproduction events [3,4,5]. Epidemics have been initiated by soil-borne oospores, which survive the cold winters [5].
Recently, there has been a noticeable shift in these populations. While genetically diverse isolates remain predominant, new genotypes like EU_41_A2 and EU_43_A2 have become established in the region [6,7,8]. This transition might signify that P. infestans populations in Northern Europe have experienced changes in their reproductive strategies, raising questions about the factors responsible for this transition and its implications for the pathogen’s evolution and disease spread. Understanding the factors driving the transition from genetic diversity to clonal–sexual hybridization is important for implementing effective disease management strategies. Populations with sexual reproduction can be managed by targeting oospores through crop rotation, while populations with asexual reproduction can be managed by mitigating the risk of fungicide resistance development in clones due to the selection process.
The progression of a disease is a result of the combined influence of multiple elements that impact both the host and the pathogen. Even minor variations in microclimate conditions may alter the results of the interaction between the plant and the pathogen [9]. It is anticipated that P. infestans will be little affected by rising temperatures owing to its preference for cooler thermal conditions [10]. However, given the temperature increase observed in recent decades, P. infestans may acclimate, potentially leading to genetic adaptation and enhanced fitness [11].
Climate models suggest that global warming may lead to more frequent extreme temperatures at both ends of the spectrum [12]. Such temperature variability is likely to favor pathogen phenotypes with wider temperature niches. Consequently, the discovery that P. infestans strains with a larger thermal tolerance are also more resistant to pesticides is concerning. This is underscored by the observed correlation between azoxystrobin resistance and the temperature range in P. infestans [13].
Observations in Estonia have shown a delay in the beginning of epidemics or a total absence of late blight infection after prolonged heat and drought periods [14]. The resulting lower primary inoculum load may cause population bottlenecks or other ecological phenomena in the P. infestans populations. The loss of genetic diversity can alter the pathogen’s evolutionary trajectory and facilitate the establishment of clonal lineages [15]. However, it remains unclear whether shifts in climatic patterns have contributed to changes in pathogen population dynamics in Estonia.
Intensive agricultural practices, including the widespread cultivation of susceptible host varieties and the increased deployment of fungicides containing the same active ingredient, have the potential to exert selective pressure on P. infestans populations. Such practices may favor the emergence and spread of fungicide-resistant clonal lineages (e.g., EU_13_A2, EU_37_A2, EU_43_A1), thus influencing shifts in population structure and leading to disease control failures [7,16,17,18]. The virulence and fitness advantages of newly emerged clonal lineages (e.g., EU_41_A2) could play a significant role in their rapid expansion and subsequent persistence within the genetically diverse population [6].
Since its emergence in 2013, the genotype EU_41_A2 has rapidly spread across Northern Europe, reaching Norway and Sweden in 2016 and Finland in 2019 [9]. We hypothesized that EU_41_A2 might have also spread to Estonia and conducted a country-wide study. The purpose of this study was to understand any genetic changes that might enable this genotype to establish itself in Estonia. For this, we analyzed the potential genetic shifts within the population over the years.

2. Materials and Methods

2.1. Isolate Collection and Genotyping

In total, 153 P. infestans isolates were collected in ten growing seasons during a period of 18 years from 2005 to 2022 (Table 1). The isolates were collected throughout Estonia from conventional and organic fields, large- and small-scale growers, and untreated experimental fields (Figure 1). The research included 30 isolates from 2010 to 2012 from a previously published study [19]. Single P. infestans lesions were sampled from fields randomly from potato (Solanum tuberosum L.) leaves exhibiting typical late blight symptoms, each from a different plant. The samples were collected either on a Flinders Technology Associates (FTA) card (Whatman Classic FTA card, Cytiva, Marlborough, MA, USA) or as leaflets from where axenic cultures with distinct morphological characteristics were isolated.
The samples of P. infestans were isolated in the laboratory to rye B agar and grown at 18 °C in the dark. When the Petri dishes were fully colonized, the mycelia were collected into 2 mL tubes and placed at −80 °C for long-term storage and −20 °C for short-term storage until DNA extraction.
The DNA from mycelia was extracted using the DNeasy® Plant Mini Kit (QIAGEN N.V., Hilden, Germany). The DNA and the FTA cards were sent to the James Hutton Institute, where the samples were genotyped with a 12-plex SSR marker set [20]. Genotypes were assigned to clonal lineages or regarded as unique by matching their SSR profiles to reference isolates in the Euroblight database [8].

2.2. Statistical Analysis

Data analysis for the SSR profiles for all 153 isolates was performed using the Microsoft Office Excel 2016 (Microsoft Corporation, Redmond, WA, USA) add-in GenAlEx (version 6.503), developed by Peakall, R. and Smouse, P.E. at the Australian National University, Canberra, Australia [21,22]. The add-in was used to calculate the loci’s allele frequency and gene diversity. The third allele in the triploid isolates had to be discarded to analyze the samples with the add-in, which was the case for less than 8% of all the samples in loci Pi02, Pi4B, G11, SSR4, SSR6, and SSR8.
The allele frequency was calculated as the proportion of the allele in a single year. The expected heterozygosity, i.e., gene diversity of a locus, was calculated using the following formula H e = 1 i = 1 I p i 2 , where I is the number of distinct alleles at the locus and p is the frequency of the ith allele at the locus [23]. The genetic structure was analyzed with the inbreeding coefficient (FIS) and fixation index (FST). FIS was calculated by subtracting the observed heterozygosity (Ho, the proportion of heterozygous samples at a given locus) from the expected heterozygosity averaged across years (He) and dividing the value with He. FST was calculated by subtracting He from the expected heterozygosity averaged for the overall total population (Ht) and dividing the value with Ht. Nei’s genetic distance [24] and FST values were analyzed through pairwise comparison among the sampled years. The significance of pairwise FST values was tested using 999 permutations. Genotypic diversity was calculated using a normalized Shannon’s diversity index (Hs) [25].
The data analysis in R (R Core Team version 4.3.0, 2023) was continued with the 11 loci using the poppr package (version 2.9.4, Kamvar Z.N., Tabima J.F., Grünwald N.J., Australian National University, Canberra, Australia; Oregon State University, Corvallis, OR, USA) [26]. The extent of linkage disequilibrium among alleles at different loci within populations was calculated using the standardized association index ( r ¯ d ). Genotypic diversity within each population, based on the number of unique multilocus genotypes (MLGs), was calculated using the Stoddart and Taylor’s index (G) [27]. The evenness of the distribution of MLGs in the population was calculated using the Evenness value (E.5). Genetic dissimilarity between individuals was calculated with Bruvo’s genetic distance [28]. The results were visualized using principal coordinate analysis (PCoA) to identify clusters of genetic similarity between the sampling years. To further explore the genetic relatedness among the P. infestans isolates, a minimum spanning network (MSN) analysis based on Bruvo’s genetic distances was performed.

3. Results

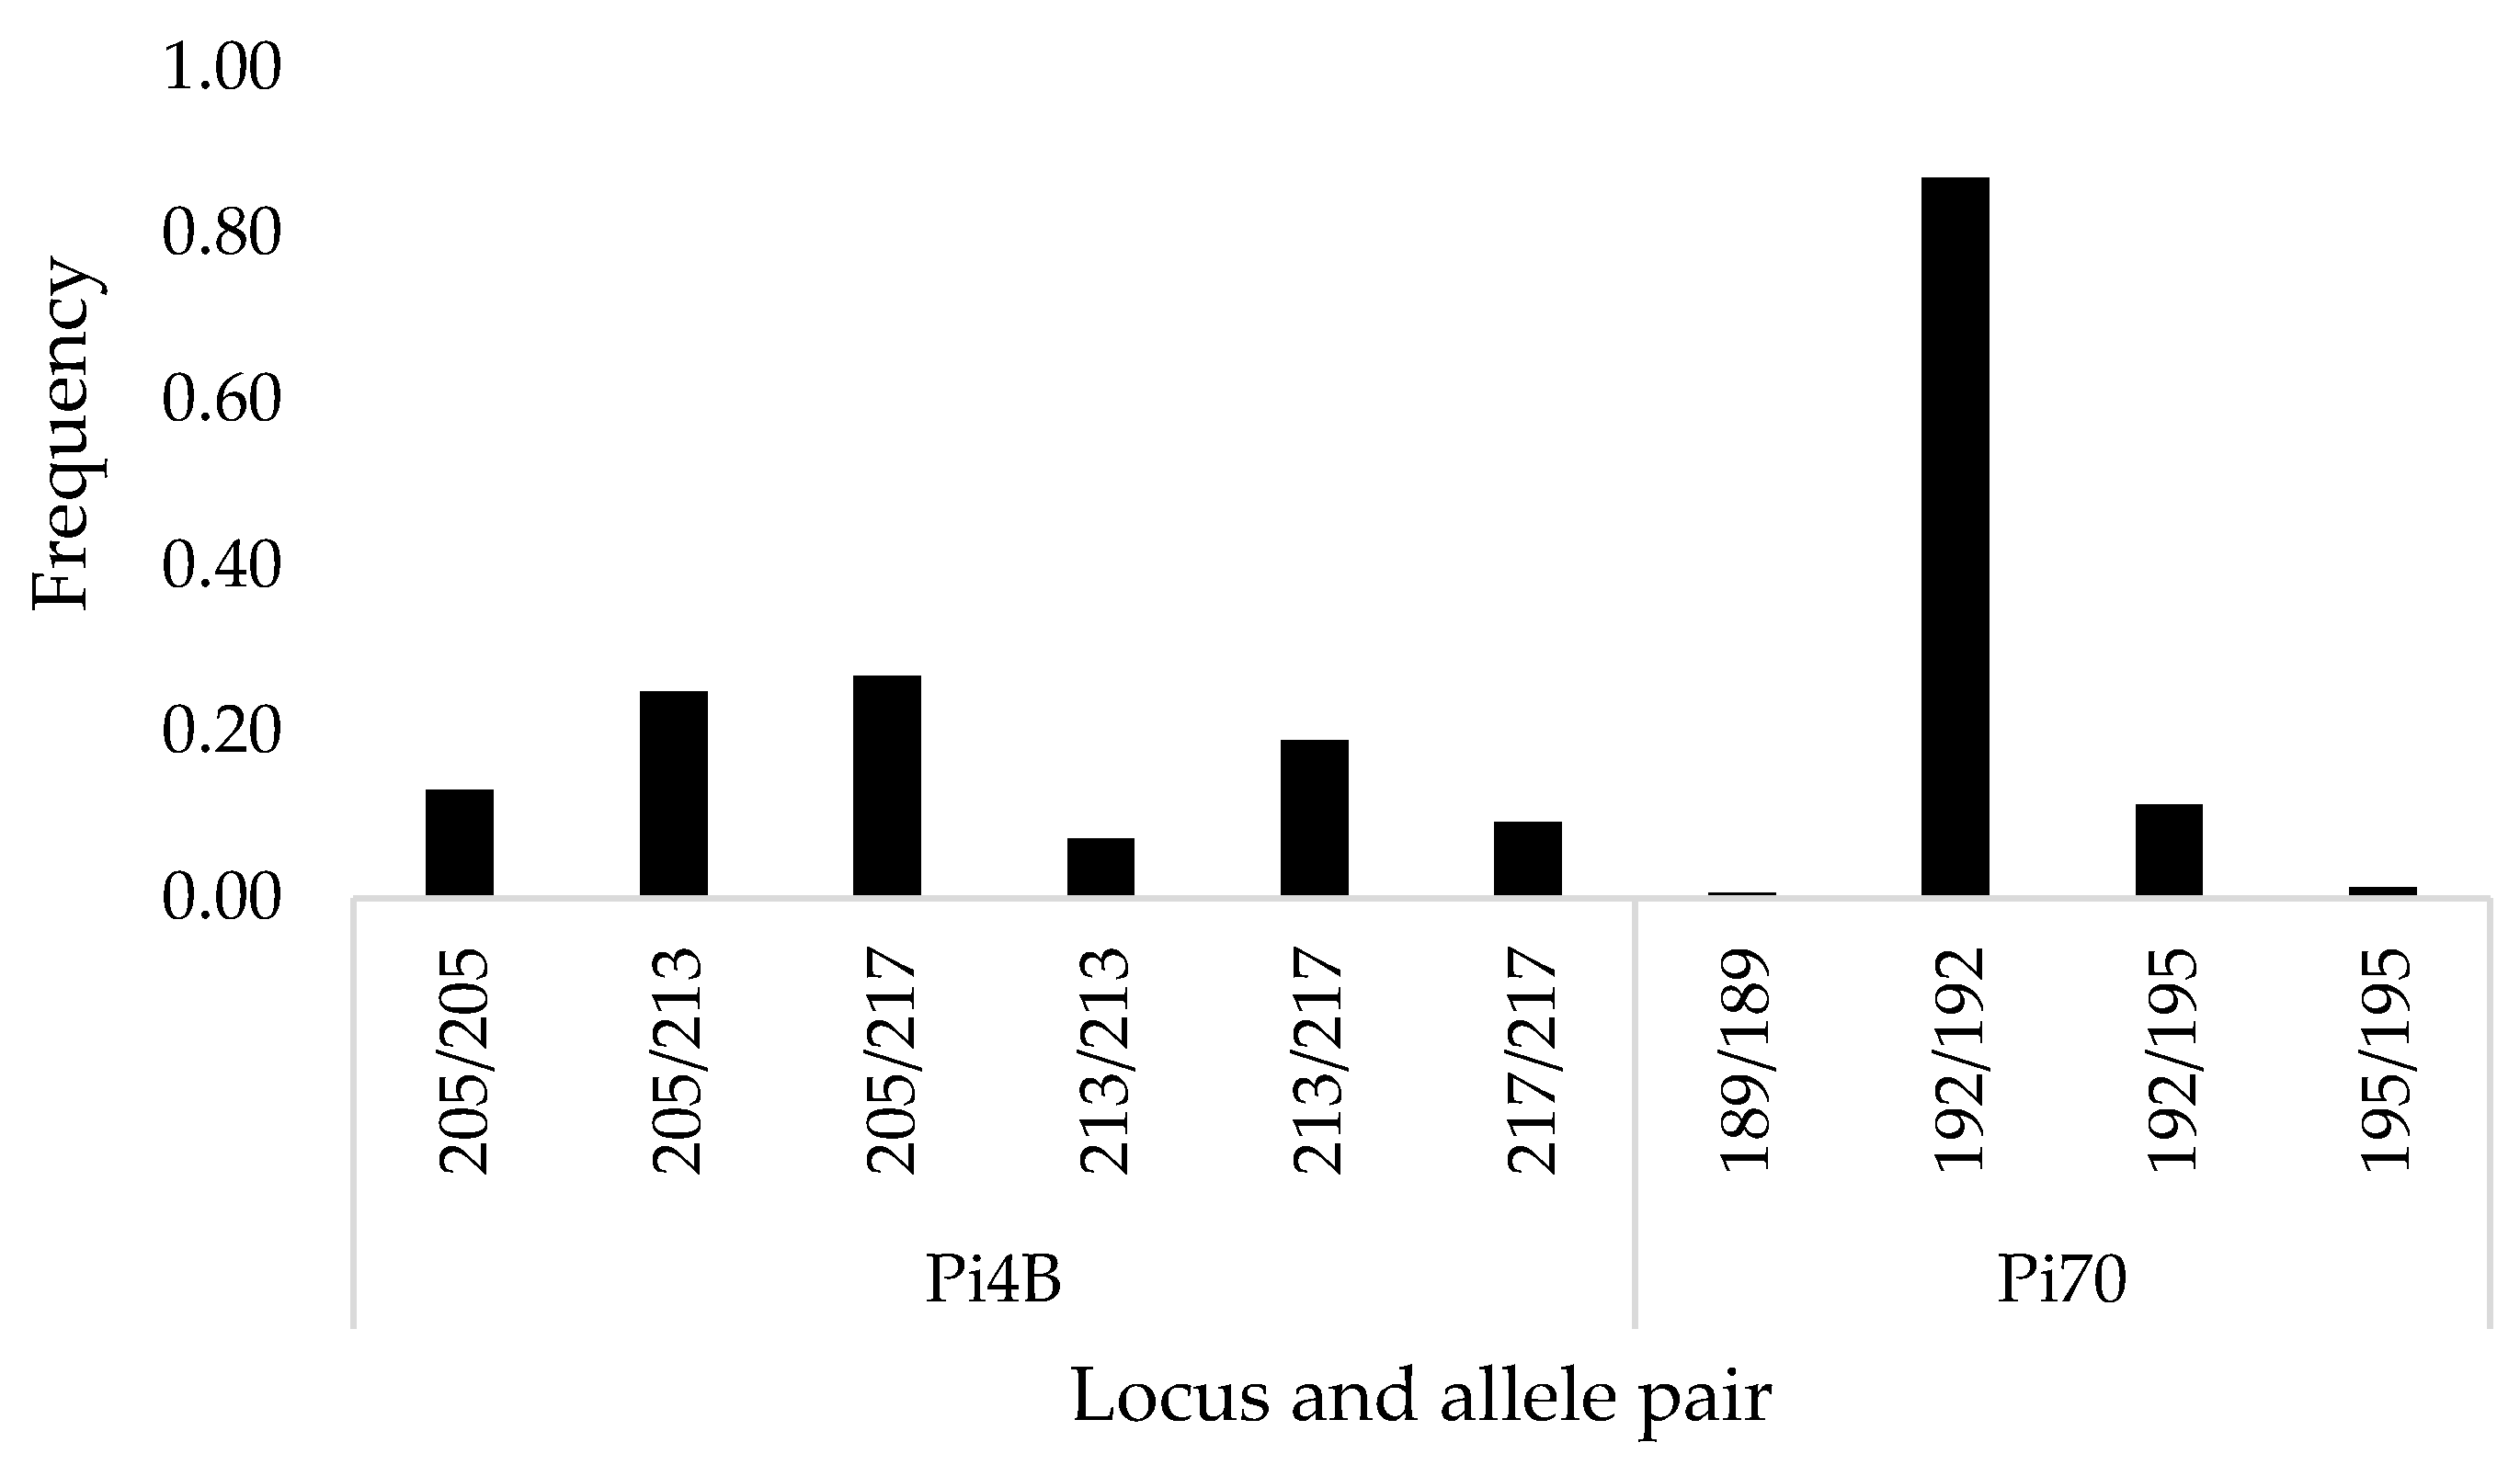
3.1. Allele Frequencies

The SSR profiles were analyzed for allele frequency (Table S1). Locus D13 had 34% of its data missing from the whole data set. As up to 54% of the data were missing for most of the sampling years, the locus D13 was omitted from the analysis. This corroborates with Kiiker et al.’s [4] finding that D13 is an uninformative locus for describing the Estonian population. Other loci (G11, Pi63, Pi70, SSR11, and SSR8), which had up to 14% missing data in some years, were left in the analysis.
A total of 54 alleles were found in the eleven loci, all of which were polymorphic (Table S1). The least number of alleles, only two, were found in locus SSR2. The most alleles were found in loci SSR4 and G11 (9 and 15, respectively). Still, even among the loci with many different alleles, only a few dominated most of the years (284 and 294 in SSR4; 154 and 162 in G11). About 40% of all different alleles (22 out of 54) had an overall frequency below 0.05. These alleles were found only on a few isolates in the same year. Also, they were quite rare throughout the years. Twelve alleles were found only in one year and, five were found in two out of the ten sampling years.

3.2. Genetic Diversity

Most of the isolates did not correspond to any of the MLGs in the EuroBlight database and were classified in the “others” group of isolates [8]. However, in 2021, one isolate from the mainland corresponded to genotype EU_6_A1, and two isolates (one from the mainland and one from the island of Hiiumaa) corresponded to genotype EU_41_A2 (Figure 1).
Gene diversity (He) was calculated for each SSR locus (Table S1). The He value ranged from 0.142 for locus Pi70 to 0.786 for locus G11. The low He value shows low heterozygosity at locus Pi70, which has one dominant homozygous genotype (192/192 with a frequency of 0.87) (Figure 2). The highest He value was calculated for locus G11, where 31 different allele pairs were found, only 7 of which were homozygous. Still, the most frequent genotypes were homozygous (162/162 with a frequency of 0.21 and 154/154 with a frequency of 0.14). The analysis also showed high genetic diversity for locus Pi4B (He = 0.662), where, on the contrary, the most frequent genotypes were heterozygous (205/217, 205/213, and 213/217), and only six different genotypes were found (Figure 2).
Altogether, 104 different locus genotypes were found for the 11 analyzed loci (Table S2). All loci, except Pi4B, SSR11, SSR2, and SSR8, had allele pairs that occurred only once throughout all the years. In locus G11, there were 15 of such throughout all the monitored years. Interestingly, the FIS for G11 was the highest of all loci (Table 2), which indicates fewer heterozygotes than expected. The high value of the inbreeding coefficient shows the locus is not in Hardy–Weinberg equilibrium, as is the case with locus Pi04, which has a high negative FIS value, and locus Pi70, which has a high positive FIS value. The FST values were between 0.024 and 0.071, which shows that there is very low genetic differentiation between the years (Table 2).
Combining alleles from the 11 SSR loci resulted in MLGs for all 153 isolates. A total of 119 were unique, making up 55% to 100% of the isolates collected in the same year (Table 1). Most of the MLGs found more than once were from the same locations in the same years. The maximum number of the same MLGs found more than once was three in 2006. Hs was high throughout all years, ranging from 0.822 in 2022 to 1.000 in 2016 (Table 1). Furthermore, the pairwise analysis of genetic differentiation (FST ranging from 0 to 0.038) and Nei’s genetic distance (ranging from 0 to 0.041) revealed a low level of genetic differentiation throughout the years (Table 3).
G, measuring the number of unique MLGs in relation to the sample size, showed high genotypic diversity across all years (Table 1). The highest G values were measured in 2016 and 2017, whereas the lowest appeared in 2022. The E.5 value, which assesses the evenness of the distribution of MLGs within the population each year, shows high evenness in most years (E.5 > 0.9). This indicates that the population had a relatively balanced distribution of genotypes and that there was no major dominance of any single genotype. The evenness in 2006 and 2022 was still relatively high but lower when compared to the rest of the population (E.5 < 0.9).
The data consistently indicate random mating for most of the evaluated years (Table 1). Even though the years 2011, 2021, and 2022 show negative r ¯ d values, the null hypothesis of no linkage among the alleles within a population failed to be rejected (p > 0.001) and, therefore, supports the likelihood of random mating rather than clonal reproduction in these years.
The MSN had several clades compiled of MLGs from different collecting years (Figure 3). MSN showed high relatedness between MLGs collected in consecutive years. In addition, the MSN revealed some closely related similar MLGs from 2005 to 2022. None of the MLGs were shared over the years. The PCoA results revealed no distinct clustering among the sampling years (Figure 4).

4. Discussion

Both P. infestans mating types have been present in Europe since the 1980s [29]. Henceforth, the production of oospores has become a relevant survival mechanism in the life cycle of P. infestans and a new primary source of inoculum in Northern Europe [5]. In Estonia, previous studies of P. infestans at the beginning of the 2000s showed a near-even presence of A1 and A2 mating types [30]. The oospore inoculum is increased by numerous small household potato growers who have limited availability for both, adequate crop protection and long crop rotation in their gardens [31,32].
The Estonian P. infestans population is genetically and genotypically highly diverse. During the study period of 2005 to 2022, a high percentage of MLGs was found in most years, and invasive clonal lineages were observed only on a few occasions. This is supported by G results, the high E.5 values, Hs, and He analysis in this study. The results also correspond to previous studies conducted in this region [4,19].
This high genetic diversity and the results from the r ¯ d suggest that the population reproduces sexually. The data indicate a rise in linkage disequilibrium in 2006, which means there was likely more clonal reproduction that year. Despite this, subsequent years did not show a continued trend towards clonality. This could imply that the factors favoring certain genotypes in 2006 were temporary, and these genotypes were outcompeted in the following years. No departure from random mating was proven, even in 2021, where three isolates with genotypes widely distributed in Europe (EU_6_A1 and EU_41_A2) were found.
The results of our study resemble those of Kiiker et al. [4], showing that Pi70 is the least informative and G11 is the most informative locus. While a range of alleles was identified at the G11 locus, a select few, notably alleles 154, 156, 160, and 162, were predominantly observed. These findings align with those of previous studies in the Nordics, Baltics, and Poland [19,33,34]. When a locus exhibits high heterozygosity, whereas most individuals primarily show homozygous genotypes, it suggests a complex dynamic within that population. The presence of many unique allele pairs alongside a high FIS at the locus might suggest a selective pressure, inbreeding, or a population bottleneck. However, the results for genetic diversity suggest a somewhat stable or even increasing genetic diversity at different loci over time. Additionally, there is no drastic shift from one allele pair to another as the dominant one over the years.
The population’s genetic structure does not remain completely static, as evidenced by slight deviations from the Hardy–Weinberg equilibrium. But despite the changes, minimal genetic differentiation between the years suggests that while individuals might show variations, the broader population remains genetically consistent. The variation is attributed to the presence of sexual reproduction arising from the surviving oospores, the differences in the sampled fields, and the weather conditions of the years. This genetic consistency was also shown in the MSN analysis, as there were several clades of MLGs compiled from different collecting years, and there was a high degree of relatedness between the MLGs collected in consecutive years. Especially interesting is the occurrence of similar MLGs between the years 2005 and 2022, as it suggests that the population has remained relatively unchanged for a long period.
The establishment of EU_41_A2 in Denmark, Norway, and other Northern European countries raises multiple questions regarding the underlying ecological, genetic, and environmental factors [6]. The invasive success of EU_41_A2 may be attributable to the synergy of its inherent fitness characteristics and shifting environmental conditions that have become more favorable to the persistence of clones as a consequence of climate change [6]. As P. infestans exhibits adaptation to specific temperature ranges in different regions, the likelihood of the pathogen causing widespread outbreaks is based on prevailing local temperature conditions [35]. Therefore, the findings of clonal lineage EU_41_A2 in two different regions (island and mainland) in Estonia were not unexpected.
One plausible hypothesis for the findings of EU_41_A2 is that the bottleneck effect during the years with unfavorable weather conditions could have led to a loss in genetic variation. If, epidemiologically, there were years where the pathogen population was critically low due to adverse conditions, it might have allowed for specific genotypes or alleles which were previously rare or suppressed to be successful when the conditions became favorable again. The growing seasons of 2018 and 2019 were unfavorable for late blight development, with prolonged drought and high-temperature periods, and only very few late blight outbreaks were recorded [14]. Prolonged unfavorable conditions decreased the late blight pathogen population size, but an effect on diversity was not observed in our research. Instead, the detection of EU_41_A2 and EU_6_A1 in 2021 seems to be a random occurrence, and the clones were probably imported with the seed potatoes.
Although no similar large-scale sampling has been conducted since the EU_41_A2 was detected in Estonia in 2021, genotyping P. infestans in the same area on the mainland in the subsequent growing seasons [14] resulted in only unique MLGs. While the bottleneck effect during unfavorable years provides a compelling explanation for the reduction in the inoculum from volunteer tubers, the oospores in the soil were still able to withstand unfavorable weather conditions. Although the number of viable oospores also reduced in time [36], the population size might have been big enough and the genetic structure might have been stable enough for the bottleneck effect not to take place.
Specific local weather patterns and differences in agricultural practices or cultivated potato varieties could affect how the lineage spreads and adapts to new areas. While the climatic conditions in Estonia are similar to those of the Nordics, most of the cultivars grown in Estonia are susceptible to the pathogen, and a limited number of sprays are applied during the growing seasons. These factors do not support selection for higher virulence or for fungicide resistance among pathogen populations. The potato growing area is very small, declining from 13,959 ha in 2005 to only 3381 ha in 2022 [37]. Additionally, there are a lot of sparsely located small-scale farmers, which, in turn, reduces the selection pressure on the pathogen. Our research shows that infections in Estonian potato fields start from oospores in the fields of small-scale growers. Accordingly, control measures should be directed towards decreasing the formation and survival of infectious oospores, and thereby, the primary inoculum, through better disease control and prolonged crop rotations.
Previous epidemics of P. infestans have shown that the pathogen’s populations need to be monitored continuously [38]. This is well illustrated through the recent emergence of the mandipropamid-resistant genotype EU_43_A2 in the Danish population, which was detected in a timely manner through meticulous monitoring and well controlled by adequately applied measures [7,39]. Even though the establishment of clonal lineages in Estonia has not been proven, it is important to keep monitoring the population nationwide. The current study and previous studies [4,19] have shown a high diversity in Estonia, but even infrequent occurrences of sexual reproduction are enough to generate considerable variation within a population [40,41]. Moreover, it is suggested that single-nucleotide polymorphism (SNP) markers and genotyping-by-sequencing (GBS) might reveal a higher clonality of isolates than with SSR analysis [41,42]. Therefore, future studies should focus on other markers for a more comprehensive analysis of the population changes.

5. Conclusions

Our comprehensive study of P. infestans in Estonia from 2005 to 2022 reveals a complex and evolving pathogen population. The analysis shows that the population is genetically diverse, with a high percentage of unique MLGs. The study indicated that the method of reproduction is predominantly sexual, although instances of isolates from clonal lineages like EU_41_A2 were observed. The results show that the population has remained relatively unchanged for a long period, potentially due to the lack of selection pressure on the potato fields.
The detection of the clonal lineage EU_41_A2 in Estonia, paralleling its spread in other Northern European countries, underscores the need for continuous monitoring and research. While our study did not find conclusive evidence of a shift in pathogen reproduction strategy, the presence of EU_41_A2 and EU_6_A1 in 2021 suggests potential introductions through imported seed potatoes.
The genetic complexity and adaptability of P. infestans in Estonia call for a holistic approach to disease management, integrating genetic studies, local environmental conditions, and agricultural practices. Future research should employ advanced genotyping techniques to provide a more nuanced understanding of the pathogen’s population structure and dynamics in Estonia.

Supplementary Materials

The following supporting information can be downloaded at: https://www.mdpi.com/article/10.3390/jof10030233/s1, Table S1: Gene diversity (He) in 11 SSR loci and allele frequencies for all 153 sampled isolates by sampling year (2005 (n = 16), 2006 (n = 15), 2007 (n = 14), 2010 (n = 10), 2011 (n = 10), 2012 (n = 10), 2016 (n = 25), 2017 (n = 23), 2021 (n = 19), and 2022 (n = 11)) in Estonia.; Table S2: The number of allele pairs found in the isolates of the Estonian P. infestans population in the different sampling years (2005 (n = 16), 2006 (n = 15), 2007 (n = 14), 2010 (n = 10), 2011 (n = 10), 2012 (n = 10), 2016 (n = 25), 2017 (n = 23), 2021 (n = 19), and 2022 (n = 11)).

Author Contributions

Conceptualization, R.K. and B.P.; formal analysis, B.P.; resources, B.P., R.K. and M.K.; writing—original draft preparation, B.P. and R.K.; writing—review and editing, B.P., R.K. and M.K.; visualization, B.P.; supervision, R.K. and M.K.; project administration, B.P., R.K., and M.K.; funding acquisition, B.P., R.K. and M.K. All authors have read and agreed to the published version of the manuscript.

Funding

This research was funded by the Estonian Ministry of Rural Affairs (grant 8T150054PKTK), Estonian Ministry of Education and Research (project IUT36-2), Estonian Research Council (project T210106PKTE (4-8/21/24) “Eco-friendly solutions for the integrated management of late and early blight of potatoes”), and the European Union, European Regional Development Fund (Estonian University of Life Sciences ASTRA project “Value-chain based bio-economy”).

Institutional Review Board Statement

Not applicable.

Informed Consent Statement

Not applicable.

Data Availability Statement

Data are contained within the article and Supplementary Materials.

Acknowledgments

We acknowledge David E. L. Cooke, Marika Mänd, Eve Runno-Paurson, Neda Najdabbassi, Seyed Mahyar Mirmajlessi, Kaire Loit, and Liina Soonvald.

Conflicts of Interest

The authors declare no conflicts of interest. The funders had no role in the design of the study; in the collection, analyses, or interpretation of data; in the writing of the manuscript; or in the decision to publish the results.

References

  1. Fry, W.E. Phytophthora infestans: The plant (and R gene) destroyer. Mol. Plant Pathol. 2008, 9, 385–402. [Google Scholar] [CrossRef] [PubMed]
  2. McDonald, B.A.; Linde, C. Pathogen population genetics, evolutionary potential, and durable resistance. Annu. Rev. Phytopathol. 2002, 40, 349–379. [Google Scholar] [CrossRef] [PubMed]
  3. Brurberg, M.B.; Elameen, A.; Hermansen, A.; Lehtinen, A.; Hannukkala, A.O.; Hansen, J.G.; Andersson, B.; Yuen, J.E.; Voglmayr, H.; Le, V.H.; et al. Genetic analysis of Phytophthora infestans populations in the Nordic European countries reveals high genetic variability. Fungal Biol. 2011, 115, 335–342. [Google Scholar] [CrossRef]
  4. Kiiker, R.; Hansen, M.; Williams, I.H.; Cooke, D.E.L.; Runno-Paurson, E. Outcome of sexual reproduction in the Phytophthora infestans population in Estonian potato fields. Eur. J. Plant Pathol. 2018, 152, 395–407. [Google Scholar] [CrossRef]
  5. Yuen, J.E.; Andersson, B. What is the evidence for sexual reproduction of Phytophthora infestans in Europe? Plant Pathol. 2013, 62, 485–491. [Google Scholar] [CrossRef]
  6. Puidet, B.; Mabon, R.; Guibert, M.; Kiiker, R.; Soonvald, L.; Le, V.H.; Eikemo, H.; Dewaegeneire, P.; Saubeau, G.; Chatot, C.; et al. Examining phenotypic traits contributing to the spread in Northern European potato crops of EU_41_A2, a new clonal lineage of Phytophthora infestans. Phytopathology 2022, 112, 414–421. [Google Scholar] [CrossRef]
  7. Abuley, I.K.; Lynott, J.S.; Hansen, J.G.; Cooke, D.E.L.; Lees, A.K. The EU43 genotype of Phytophthora infestans displays resistance to mandipropamid. Plant Pathol. 2023, 72, 1305–1313. [Google Scholar] [CrossRef]
  8. EuroBlight Pathogen Monitoring. Available online: http://euroblight.net/ (accessed on 17 March 2024).
  9. Singh, B.K.; Delgado-Baquerizo, M.; Egidi, E.; Guirado, E.; Leach, J.E.; Liu, H.; Trivedi, P. Climate change impacts on plant pathogens, food security and paths forward. Nat. Rev. Microbiol. 2023, 21, 640–656. [Google Scholar] [CrossRef]
  10. Sparks, A.H.; Forbes, G.A.; Hijmans, R.J.; Garrett, K.A. Climate change may have limited effect on global risk of potato late blight. Glob. Chang. Biol. 2014, 20, 3621–3631. [Google Scholar] [CrossRef]
  11. Wu, E.J.; Wang, Y.P.; Yahuza, L.; He, M.H.; Sun, D.L.; Huang, Y.M.; Liu, Y.C.; Yang, L.N.; Zhu, W.; Zhan, J. Rapid adaptation of the Irish potato famine pathogen Phytophthora infestans to changing temperature. Evol. Appl. 2020, 13, 768–780. [Google Scholar] [CrossRef]
  12. Rahmstorf, S.; Coumou, D. Increase of extreme events in a warming world. Proc. Natl. Acad. Sci. USA 2011, 108, 17905–17909. [Google Scholar] [CrossRef] [PubMed]
  13. Lurwanu, Y.; Wang, Y.-P.; Wu, E.-J.; He, D.-C.; Waheed, A.; Nkurikiyimfura, O.; Wang, Z.; Shang, L.-P.; Yang, L.-N.; Zhan, J. Increasing temperature elevates the variation and spatial differentiation of pesticide tolerance in a plant pathogen. Evol. Appl. 2021, 14, 1274–1285. [Google Scholar] [CrossRef] [PubMed]
  14. Koppel, M.; (Estonian University of Life Sciences, Tartu, Estonia). Personal communication, 2024.
  15. McDonald, B.A.; Linde, C. The population genetics of plant pathogens and breeding strategies for durable resistance. Euphytica 2002, 124, 163–180. [Google Scholar] [CrossRef]
  16. Cooke, D.E.L.; Cano, L.M.; Raffaele, S.; Bain, R.A.; Cooke, L.R.; Etherington, G.J.; Deahl, K.L.; Farrer, R.A.; Gilroy, E.M.; Goss, E.M.; et al. Genome analyses of an aggressive and invasive lineage of the Irish potato famine pathogen. PLoS Pathog. 2012, 8, e1002940. [Google Scholar] [CrossRef] [PubMed]
  17. Cooke, L.R.; Quinn, L.; Nugent, P.; Walker, E. The potato blight population in Northern Ireland in 2012: Ongoing changes and fungicide performance. In Proceedings of the Fourteenth EuroBlight Workshop, Limassol, Cyprus, 12–15 May 2013; pp. 145–152. [Google Scholar]
  18. Puidet, B.; Mabon, R.; Guibert, M.; Kiiker, R.; Loit, K.; Le, V.H.; Eikemo, H.; Dewaegeneire, P.; Saubeau, G.; Chatot, C.; et al. Investigating phenotypic traits as potential drivers of the emergence of EU_37_A2, an invasive new lineage of Phytophthora infestans in Western Europe. Plant Pathol. 2023, 72, 797–806. [Google Scholar] [CrossRef]
  19. Kiiker, R.; Skrabule, I.; Ronis, A.; Cooke, D.E.L.; Hansen, J.G.; Williams, I.H.; Mänd, M.; Runno-Paurson, E. Diversity of populations of Phytophthora infestans in relation to patterns of potato crop management in Latvia and Lithuania. Plant Pathol. 2019, 68, 1207–1214. [Google Scholar] [CrossRef]
  20. Li, Y.; Cooke, D.E.L.; Jacobsen, E.; van der Lee, T. Efficient multiplex simple sequence repeat genotyping of the oomycete plant pathogen Phytophthora infestans. J. Microbiol. Methods 2013, 92, 316–322. [Google Scholar] [CrossRef]
  21. Peakall, R.; Smouse, P.E. GENALEX 6: Genetic analysis in Excel. Population genetic software for teaching and research. Mol. Ecol. Notes 2006, 6, 288–295. [Google Scholar] [CrossRef]
  22. Peakall, R.; Smouse, P.E. GenALEx 6.5: Genetic analysis in Excel. Population genetic software for teaching and research—An update. Bioinformatics 2012, 28, 2537–2539. [Google Scholar] [CrossRef]
  23. Nei, M. Analysis of gene diversity in subdivided populations. Proc. Natl. Acad. Sci. USA 1973, 70, 3321–3323. [Google Scholar] [CrossRef]
  24. Nei, M. Estimation of average heterozygosity and genetic distance from a small number of individuals. Genetics 1978, 89, 583–590. [Google Scholar] [CrossRef]
  25. Sheldon, A.L. Equitability indices: Dependence on the species count. Ecology 1969, 50, 466–467. [Google Scholar] [CrossRef]
  26. Kamvar, Z.N.; Tabima, J.F.; Grünwald, N.J. Poppr: An R package for genetic analysis of populations with clonal, partially clonal, and/or sexual reproduction. PeerJ 2014, 2, e281. [Google Scholar] [CrossRef]
  27. Stoddart, J.A.; Taylor, J.F. Genotypic diversity: Estimation and prediction in samples. Genetics 1988, 118, 705–711. [Google Scholar] [CrossRef] [PubMed]
  28. Bruvo, R.; Michiels, N.K.; D’Souza, T.G.; Schulenburg, H. A simple method for the calculation of microsatellite genotype distances irrespective of ploidy level. Mol. Ecol. 2004, 13, 2101–2106. [Google Scholar] [CrossRef] [PubMed]
  29. Spielman, L.J.; Drenth, A.; Davidse, L.C.; Sujkowski, L.J.; Gu, W.; Tooley, P.W.; Fry, W.E. A second world-wide migration and population displacement of Phytophthora infestans? Plant Pathol. 1991, 40, 422–430. [Google Scholar] [CrossRef]
  30. Runno-Paurson, E.; Hannukkala, A.O.; Kotkas, K.; Koppel, M.; Williams, I.H.; Mänd, M. Population changes and phenotypic diversity of Phytophthora infestans isolates from Estonia and Finland. J. Plant Pathol. 2014, 96, 85–95. [Google Scholar] [CrossRef]
  31. Brylińska, M.; Sobkowiak, S.; Stefańczyk, E.; Śliwka, J. Potato cultivation system affects population structure of Phytophthora infestans. Fungal Ecol. 2016, 20, 132–143. [Google Scholar] [CrossRef]
  32. Hannukkala, A.O.; Kaukoranta, T.; Lehtinen, A.; Rahkonen, A. Late-blight epidemics on potato in Finland, 1933–2002; increased and earlier occurrence of epidemics associated with climate change and lack of rotation. Plant Pathol. 2007, 56, 167–176. [Google Scholar] [CrossRef]
  33. Sjöholm, L.; Andersson, B.; Högberg, N.; Widmark, A.K.; Yuen, J. Genotypic diversity and migration patterns of Phytophthora infestans in the nordic countries. Fungal Biol. 2013, 117, 722–730. [Google Scholar] [CrossRef]
  34. Chmielarz, M.; Sobkowiak, S.; Debski, K.; Cooke, D.E.L.; Brurberg, M.B.; Śliwka, J. Diversity of Phytophthora infestans from Poland. Plant Pathol. 2014, 63, 203–211. [Google Scholar] [CrossRef]
  35. Mariette, N.; Androdias, A.; Mabon, R.; Corbière, R.; Marquer, B.; Montarry, J.; Andrivon, D. Local adaptation to temperature in populations and clonal lineages of the Irish potato famine pathogen Phytophthora infestans. Ecol. Evol. 2016, 6, 6320–6331. [Google Scholar] [CrossRef] [PubMed]
  36. Andersson, B.; Widmark, A.K.; Yuen, J.E.; Kessel, G.J.T.; Evenhuis, A.; Turkensteen, L.J.; Lehtinen, A.; Nielsen, B.; Ravnskov, S.; Hansen, J.G.; et al. The role of oospores in the epidemiology of potato late blight. Acta Hortic. 2009, 834, 61–68. [Google Scholar] [CrossRef]
  37. Statistics Estonia Statistical Database. Available online: https://www.stat.ee/ (accessed on 29 February 2024).
  38. Fry, W.E.; Birch, P.R.J.; Judelson, H.S.; Grünwald, N.J.; Danies, G.; Everts, K.L.; Gevens, A.J.; Gugino, B.K.; Johnson, D.A.; Johnson, S.B.; et al. Five reasons to consider Phytophthora infestans a reemerging pathogen. Phytopathology 2015, 105, 966–981. [Google Scholar] [CrossRef]
  39. Abuley, I.K.; (Aarhus University, Slagelse, Denmark). Personal communication, 2024.
  40. Bengtsson, B.O. Genetic variation in organisms with sexual and asexual reproduction. J. Evol. Biol. 2003, 16, 189–199. [Google Scholar] [CrossRef]
  41. Maurice, S.; Montes, M.S.; Nielsen, B.J.; Bødker, L.; Martin, M.D.; Jønck, C.G.; Kjøller, R.; Rosendahl, S. Population genomics of an outbreak of the potato late blight pathogen, Phytophthora infestans, reveals both clonality and high genotypic diversity. Mol. Plant Pathol. 2019, 20, 1134–1146. [Google Scholar] [CrossRef]
  42. Hansen, Z.R.; Everts, K.L.; Fry, W.E.; Gevens, A.J.; Gugino, B.K.; Johnson, D.A.; Johnson, S.B.; Gru, J.; Judelson, S.; Knaus, B.J.; et al. Genetic variation within clonal lineages of Phytophthora infestans revealed through implications for late blight epidemiology. PLoS ONE 2016, 11, e0165690. [Google Scholar] [CrossRef] [PubMed]
Figure 1. Phytophthora infestans isolates collected from Estonia by sampling year and multilocus genotype group (MLG). Each circle represents a sampling site, the color shade and the number in the circle correspond to the number of isolates collected. Base map from GADM 3.6 (https://gadm.org/download_country36.html, accessed on 20 March 2024).
Jof 10 00233 g001
Figure 2. Allele pair frequencies of Phytophthpra infestans isolates sampled in Estonia (2005–2021) for two loci with three alleles—mainly homozygous Simple Sequence Repeat (SSR) locus Pi70 (n = 151) and highly heterozygous Pi4B (n = 153).
Jof 10 00233 g002
Figure 3. Minimum spanning network (MSN) based on Bruvo’s genetic distances of Phytophthora infestans isolates analyzed with 11 SSR markers. Each node represents one multilocus genotype (MLG). The node size corresponds to the number (1–3) of isolates with the same MLG, whereas the longer and lighter edges indicate a greater genetic distance between them.
Jof 10 00233 g003
Figure 4. Principal coordinate analysis (PCoA) based on Bruvo’s genetic distances, illustrating the lack of clustering of Estonian Phytophthora infestans isolates by sampling year.
Jof 10 00233 g004
Table 1. Characteristics of Phytophthora infestans collected from across Estonia from 2005 to 2022 by sampling year. Percentages of isolates with unique multilocus genotypes (MLGs), normalized Shannon’s diversity index (Hs) values, standardized index of association ( r ¯ d ) values, Stoddard and Taylor’s index (G) values, and Evenness (E.5) values are presented.
YearNumber of IsolatesUnique MLGsHs r ¯ d GE.5
20051675%0.9380.01612.800.947
20061580%0.9190.092 *10.710.880
20071486%0.9620.02812.250.963
20101060%0.8800.0227.140.934
20111060%0.880−0.0147.140.934
20121080%0.9400.0418.330.952
201625100%1.0000.00325.001.000
20172391%0.9810.01421.160.976
20211958%0.901−0.01513.370.938
20221155%0.822−0.0226.370.868
All years15378%0.9660.003121.290.939
* Calculated probability: p ≤ 0.001
Table 2. Inbreeding coefficient values within populations (FIS) and fixation index between populations (FST) (2005 (n = 16), 2006 (n = 15), 2007 (n = 14), 2010 (n = 10), 2011 (n = 10), 2012 (n = 10), 2016 (n = 25), 2017 (n = 23), 2021 (n = 19), and 2022 (n = 11)) for 11 SSR loci from Phytophthora infestans isolates collected from Estonia.
LocusFISFST
Pi020.0710.031
Pi4B−0.0820.045
G110.3180.071
Pi04−0.2620.029
Pi63−0.0720.036
Pi700.1400.065
SSR110.0130.071
SSR2−0.0140.026
SSR4−0.0680.054
SSR6−0.0540.029
SSR8−0.0910.024
Table 3. Phytophthora infestans isolates’ genetic differentiation by fixation index (FST) (above diagonal) and Nei’s genetic distance (below diagonal) values between different sampling years (2005 (n = 16), 2006 (n = 15), 2007 (n = 14), 2010 (n = 10), 2011 (n = 10), 2012 (n = 10), 2016 (n = 25), 2017 (n = 23), 2021 (n = 19), and 2022 (n = 11)) in Estonia.
Year2005200620072010201120122016201720212022
2005-0.0360.0290.0200.0000.0060.0020.0050.0180.014
20060.041-0.0060.0320.0130.0380.0080.0270.0290.014
20070.0380.000-0.0380.0110.0120.0120.0140.0130.012
20100.0190.0320.035-0.0000.0220.0260.0170.0110.026
20110.0000.0120.0080.000-0.0000.0030.0040.0000.000
20120.0080.0410.0120.0200.000-0.0130.0050.0190.016
20160.0040.0080.0100.0290.0040.015-0.0000.0240.021
20170.0030.0280.0130.0140.0020.0050.000-0.0160.033
20210.0280.0320.0150.0080.0000.0240.0300.022-0.007
20220.0200.0120.0090.0250.0000.0170.0250.0350.007-
All years-0.0360.0290.0200.0000.0060.0020.0050.0180.014
Disclaimer/Publisher’s Note: The statements, opinions and data contained in all publications are solely those of the individual author(s) and contributor(s) and not of MDPI and/or the editor(s). MDPI and/or the editor(s) disclaim responsibility for any injury to people or property resulting from any ideas, methods, instructions or products referred to in the content.

