Article

Incidence, Speciation, and Morpho-Genetic Diversity of Penicillium spp. Causing Blue Mold of Stored Pome Fruits in Serbia

1
Faculty of Agriculture, University of Belgrade, 11000 Belgrade, Serbia
2
USDA-ARS, Food Quality Laboratory, Beltsville, MD 20705, USA
*
Author to whom correspondence should be addressed.
J. Fungi 2021, 7(12), 1019; https://doi.org/10.3390/jof7121019
Submission received: 3 November 2021 / Revised: 22 November 2021 / Accepted: 25 November 2021 / Published: 28 November 2021

Abstract

:
Blue mold, caused by Penicillium spp., is one of the most economically important postharvest diseases of pome fruits, globally. Pome fruits, in particular apple, is the most widely grown pome fruit in Serbia, and the distribution of Penicillium spp. responsible for postharvest decay is unknown. A two-year survey was conducted in 2014 and 2015, where four pome fruits (apple, pear, quince, and medlar) with blue mold symptoms were collected from 20 storage locations throughout Serbia. Detailed morphological characterization, analysis of virulence in three apple cultivars, and multilocus phylogeny revealed three main Penicillium spp. in order of abundance: P. expansum, P. crustosum, and P. solitum. Interestingly, P. expansum split into two distinct clades with strong statistical support that coincided with several morphological observations. Findings from this study are significant and showed previously undocumented diversity in blue mold fungi responsible for postharvest decay including the first finding of P. crustosum, and P. solitum as postharvest pathogens of quince and P. crustosum of medlar fruit in the world, and P. expansum of quince in Serbia. Data from this study provide timely information regarding phenotypic, morphological and genotypic plasticity in P. expansum that will impact the design of species-specific detection tools and guide the development of blue mold management strategies.

1. Introduction

Pome fruits consist of apples (Malus domestica Borkh.), pears (Pyrus communis L.), quince (Cydonia oblonga Mill.), Asian pear (Pyrus seratina Rehd.), medlar (Mespilus germanica L.), and many other wild species of the Rosaceae family [1]. Most pome fruits are stored for extended periods of time (6 to 12 months) in a cold and controlled atmosphere. This allows fruit to be preserved and be of high quality so they can be available for year-round consumption and for trade to other countries. However, fruit rots reduce fresh fruit for consumption, negatively impact fruit quality, and contribute to mycotoxin contamination, specifically patulin, which is the case for Penicillium spp. [2].
Blue mold caused by Penicillium spp. is one of the most economically important postharvest diseases and a survey in Washington State revealed that it accounted for 28% of fruit decays in storage [3]. Blue mold is characterized by a soft, watery rot that is light brown in color accompanied by the appearance of blue-green conidia on the fruit surface that develops at advanced stages of decay. P. expansum Link., and other Penicillium spp. do not directly infect fruits, as they require wounds caused by stem punctures and bruises that occur before, during, and after harvest [2,4]. Conidia are the primary source of inoculum and are detectable in the packinghouse in flume water, on bin surfaces, fruit, and in the air [5,6,7,8]. Unfortunately, no resistance to blue mold is present in commercial apple cultivars as they are all susceptible [9].
Penicillium expansum is the most common and economically important causal agent of blue mold of stored apple and pear worldwide [9,10,11]. However, other species have been shown to be significant contributors of blue mold which include P. aurantiogriseum Dierckx, P. brevicompactum Dierckx, P. carneum Frisvad, P. chrysogenum Thom, P. commune Thom, P. crustosum Thom, P. dendriticum Pitt, P. digitatum (Pers.: Fr.) Sacc., P. glabrum (Wehmer) Westling, P. griseofulvum Dierckx, P. ramulosum Visagie & K. Jacobs, P. rugulosum Thom, P. solitum Westling and P. verrucosum Dierckx [5,6,12,13,14,15]. P. expansum has also been found to cause blue mold on quince [16]. However, it is well documented in the literature that P. expansum is the most common and aggressive species while P. solitum is a weak pathogen of apple and pears [6,17,18].
Apple is one of the most widely grown pomes in Serbia. In 2019, apples were cultivated on 26,089 ha, with a production of 499,578 tones, which comprises 3% of the total European apple production. Pear was produced on significantly less area, 4970 ha producing 54,859 t, representing 2.2% of the European pear market. Quince is a high value fruit in Serbia that is used to make jams, jellies, and brandy. Annual quince production is 11,074 t, from 1915 ha which provided 31% of total quince fruit grown in Europe. Serbia is the second largest quince producer in Europe and the ninth in the world [19]. P. expansum and P. crustosum have been described as causal agents of blue mold on apple [20,21,22,23] and pear fruit [24] in Serbia, and there are no data regarding incidence and distribution of blue mold fungal species on other pome fruits. Therefore, the aim of the current study was to identify the causal agents of blue mold on pome fruit in Serbia, gain insight into the diversity of Penicillium spp. via morphological and genetic characterization, and to evaluate the virulence of predominant species on different apple fruit cultivars.

2. Materials and Methods

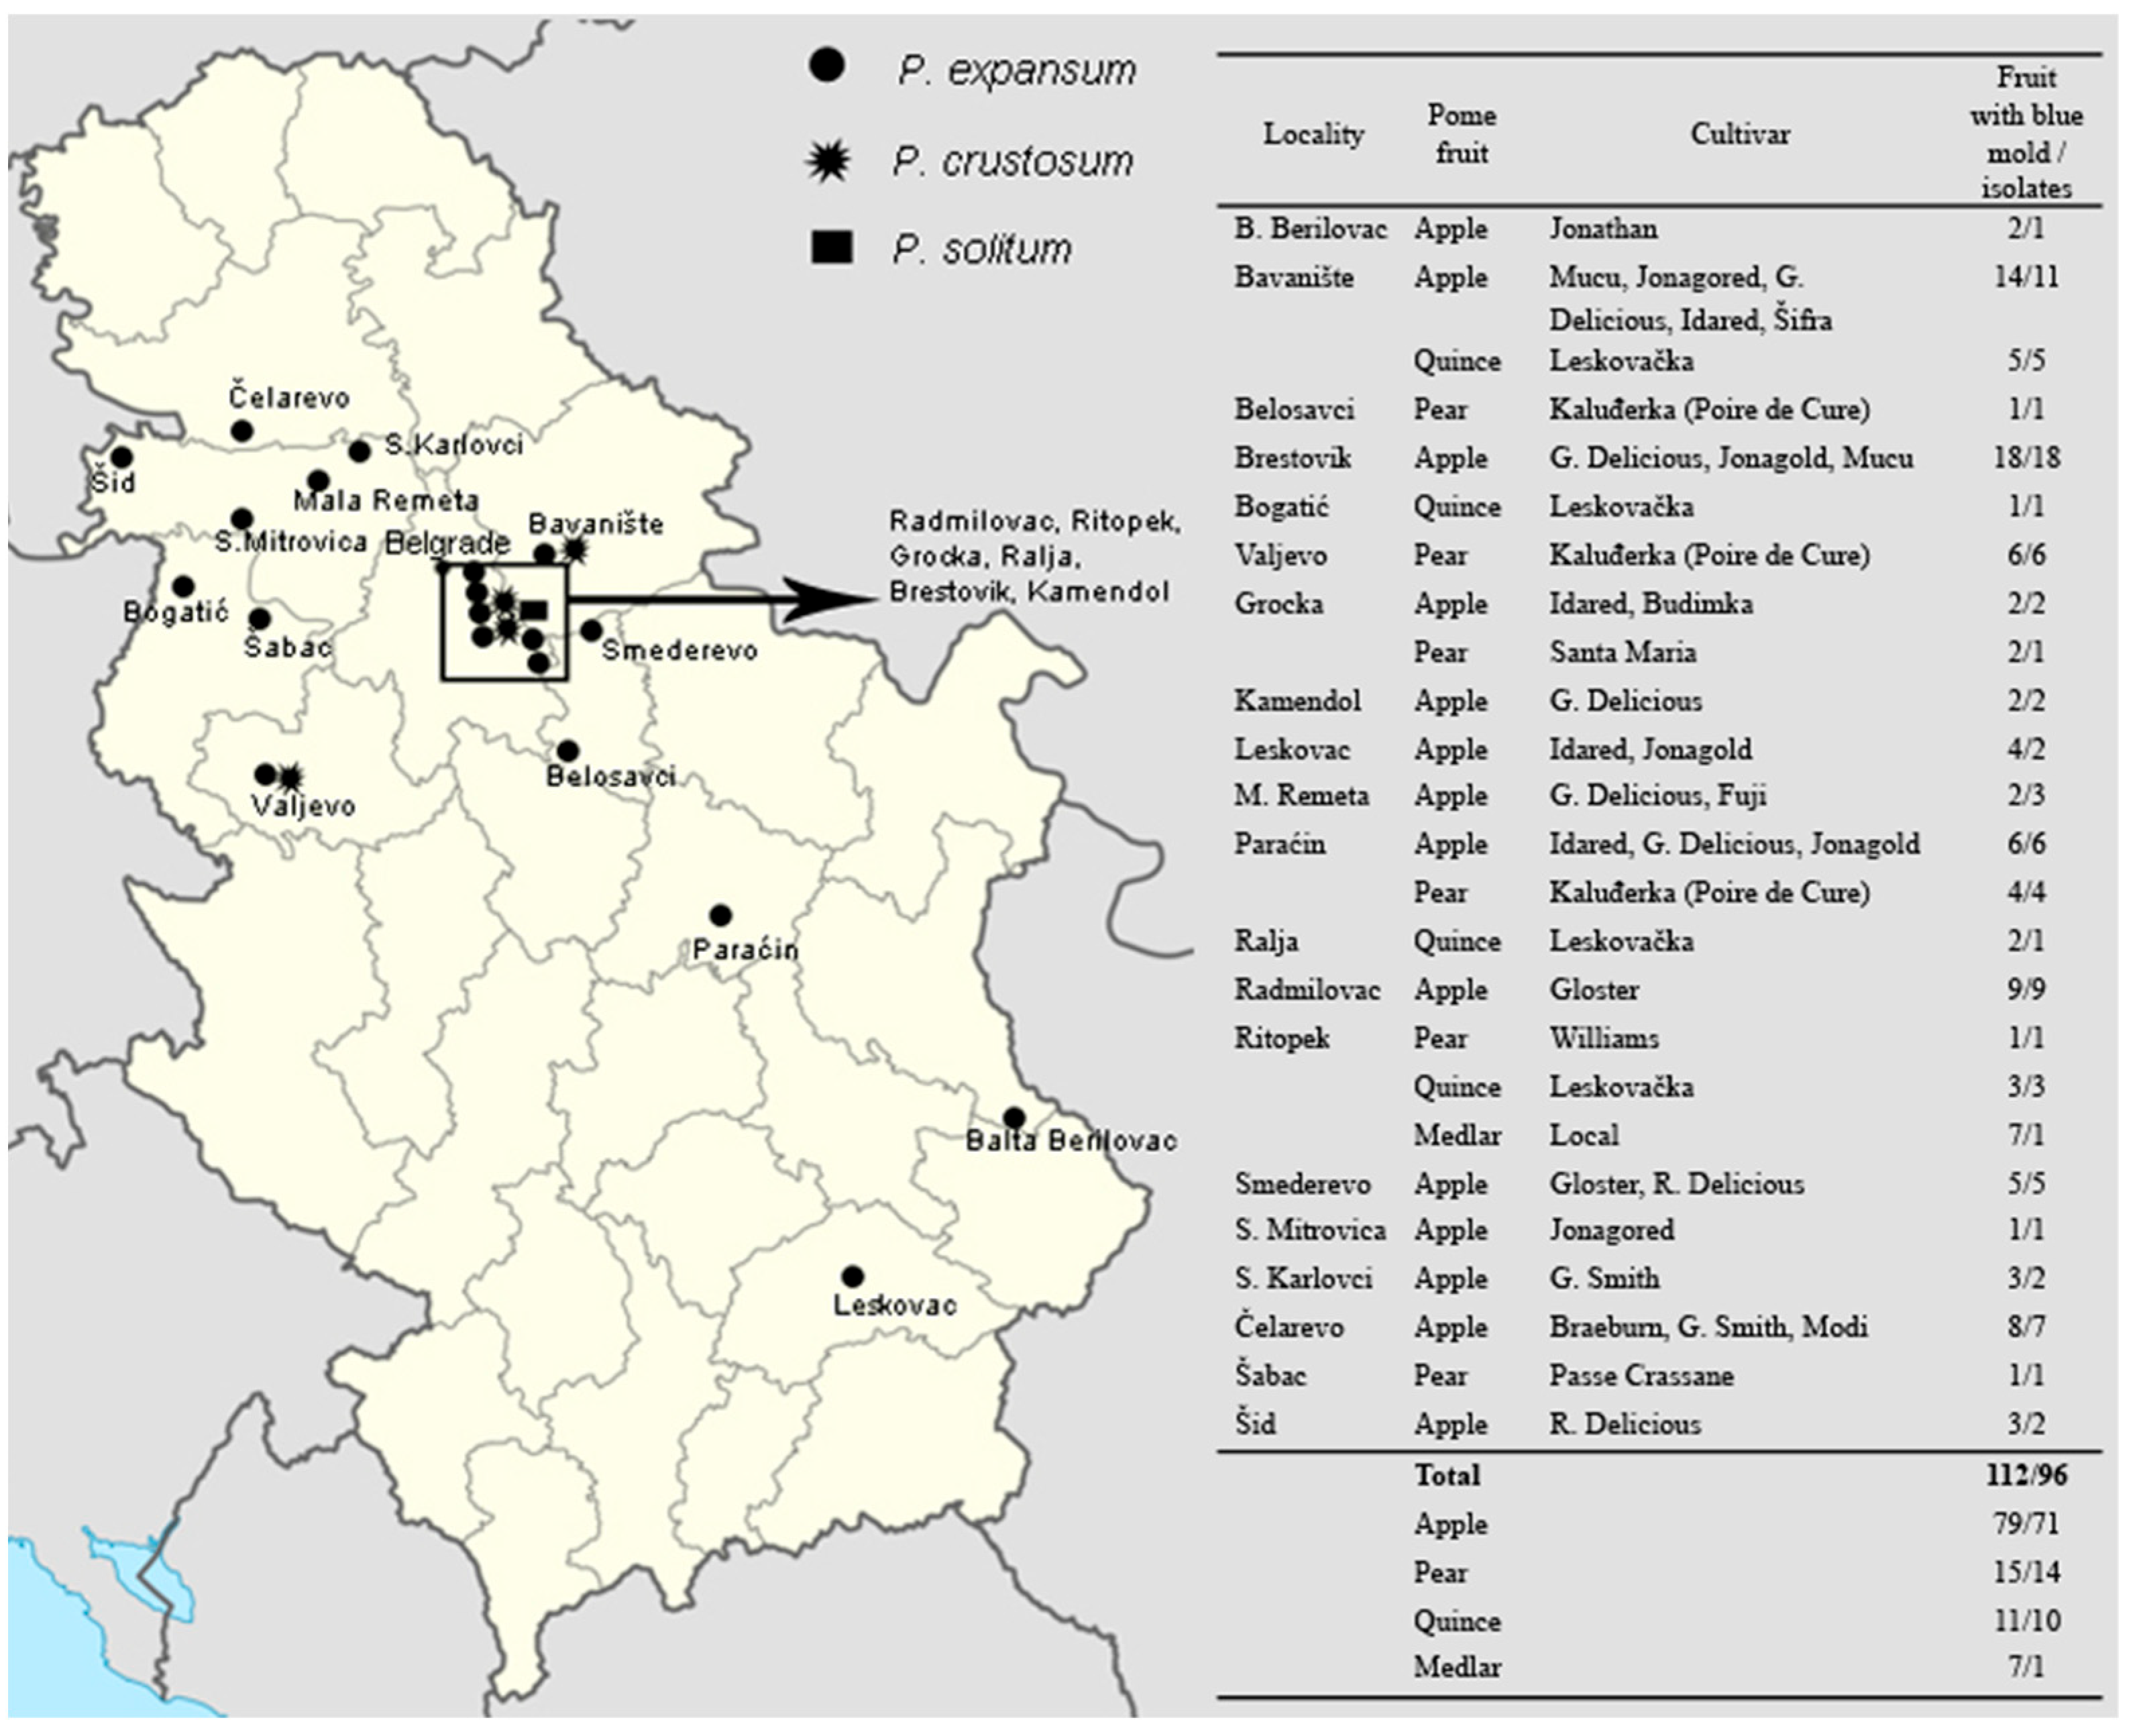
2.1. Sample Collection and Fungal Isolation

In a two-year survey, during 2014 and 2015, four different pome fruits (apple, pear, quince and medlar) with blue mold symptoms were collected from 20 storage locations (Figure 1). Fungal isolation was done from the internal portion of decayed tissue from surface disinfected fruit in 70% ethanol, after aseptic removal of the skin. Fragments from the margin of healthy and decayed tissue were placed on potato dextrose agar (PDA, EMD, Darmstadt, Germany, pH 5.6 ± 0.2) in Petri dishes (90 mm). After 5 days incubation at 24 ± 2 °C in the dark, colony fragments were transferred to PDA to obtain pure cultures, which were used to obtain monosporial isolates. For long term maintenance, isolates were kept as conidial suspensions in 30% glycerol 0.05% agar 0.05% Tween 20 (Sigma-Aldrich, Burlington, MA, USA) at −80 °C.

2.2. Pathogenicity Test

‘Idared’ apple, ‘Williams‘ pear, ‘Leskovačka‘ quince and medlar (local cultivar) fruit obtained from a local market (IPM orchard origin), were washed and surfaced sanitized with 70% ethanol, then wounded with the point of a finishing nail (14 mm × 4 mm) on two opposite sides of the fruit at the equator. Spore suspensions (~106 spores/mL) were prepared by adding one fungal fragment (6 mm in diameter) from 7-day-old-cultures grown on PDA in 5 mL sterilized water with Tween 20 (0.05%) and adjusted using a haemocytometer [25,26]. Artificial inoculations were conducted by pipetting 40 µL of spore suspension into each wound and two fruit of every pome species were used per isolate. All isolates were inoculated onto apple fruit, whereas five isolates from pear were inoculated on pear, four isolates from quince onto quince and one from medlar onto medlar. Control fruit were wounded and inoculated with 40 µL of sterilized water containing Tween 20 (0.05%). Inoculated and control fruit were placed in plastic containers under high humidity and kept at 24 ± 2 °C for 7 days in natural light dark cycles. Re-isolation of the pathogen was performed as described above.

2.3. DNA Extraction, PCR Amplification, and Amplicon Sequencing

DNA extraction was performed by the CTAB protocol of Day and Shatock [27] from 7-day-old cultures of obtained 96 Penicillium spp. isolates grown on PDA (Supplementary Table S1). Initially, to detect presence of P. expansum, all isolates were tested using specific P. expansum primers PEF/PER, based on partial polygalacturonase gene (Pepg1), which amplifies a 404 bp fragment [28]. Further, for 26 selected isolates (including 18 detected P. expansum isolates selected based on pome fruit host, locality, cultivar, and difference in PDA colony reverse color, and 8 undetermined Penicillium isolates) nuclear ribosomal internal transcribed spacer region (ITS, 600 bp), portions of the β tubulin (BenA, 511 bp), calmodulin (CaM, 580 bp) and RNA polymerase II second largest subunit (RPB2, 1000 bp) were amplified using ITS1/ITS4, Bt2a/Bt2b, CMD5/CMD6 and 5F/7CR primers, respectively [29,30,31,32,33]. PCR reaction mix (25 µL) contained 1 µL of template DNA, 1xPCR Master Mix (Thermo Scientific, Vilnius, Lithuania) and 0.4 µM of each primer. Conditions for Pepg1 amplification were: initial denaturation at 92 °C for 5 min, followed by 30 cycles at 92 °C for 1 min, 55 °C for 45 s and 72 °C for 45 s, and final elongation at 72 °C for 10 min. Conditions for amplification of ITS region were: initial denaturation at 95 °C for 2 min, followed by 35 cycles at 95 °C for 30 s, 55 °C for 30 s and 72 °C for 60 s, and final elongation at 72 °C for 10 min. Conditions for BenA and CaM amplifications were: initial denaturation at 94 °C for 5 min, followed by 35 cycles at 94 °C for 45 s, 55 °C for 45 s and 72 °C for 60 s, and final elongation at 72 °C for 7 min. Conditions for RPB2 amplification were: initial denaturation at 94 °C for 5 min, followed by 5 cycles at 94 °C for 45 s, 50 °C for 45 s and 72 °C for 60 s, then 5 cycles at 94 °C for 45 s, 52 °C for 45 s and 72 °C for 60 s and 30 cycles at 94 °C for 45 s, 55 °C for 45 s and 72 °C for 60 s. Final elongation occurred for 7 min at 72 °C [33]. PCR products (5 µL) were observed in 1.5% agarose gel, stained in ethidium bromide and visualized with UV transilluminator. Amplified products were purified and sequenced using forward and reverse primers to yield a 2X consensus amplicon sequence. Sequences were assembled using Pregap4 from the Staden programme package [34] and deposited in the NCBI GenBank.

2.4. Multilocus Sequence Analysis and Phylogeny

The obtained fungal DNA sequences were compared with those publicly available using MegaBlast (http://www.ncbi.nlm.nih.gov/, accessed on 1 June 2021). Related sequences and those of the closest species were retrieved from GenBank and aligned with those obtained in this study using ClustalX [35], under MEGA version X [36]. Evolutionary history was inferred based on individual and combined analyses of four loci (ITS, BenA, CaM, and RPB2) of 26 isolates obtained in this study, reference isolates and Penicillium lanosocoeruleum CBS 215.30 as an outgroup (Table 1), using the Maximum Likelihood (ML) and Maximum Parsimony (MP) methods (MEGA X). For ML, the best nucleotide substitution model was determined using the “find best model” option in MEGA X. Initial tree(s) for the heuristic search were obtained automatically by applying Neighbour-Join and BioNJ algorithms to a matrix of pairwise distances estimated using the Maximum Composite Likelihood approach, and then selecting the topology with superior log likelihood value. The MP trees were obtained using the Subtree-Pruning-Regrafting (SPR) algorithm with search level 3, in which the initial trees were obtained by the random addition of sequences (ten replicates). To estimate the statistical significance of the inferred clades, 1000 bootstraps were performed.

2.5. Cultural Morphology

For 26 selected isolates, colony morphology (appearance, presence of exudate, reverse color) and growth were analysed on Malt Extract Agar (MEA), Czapek Yeast Extract Agar (CYA), and Yeast Extract Sucrose Agar (YES) as described by Visagie et al. [33], and additionally on Potato Dextrose Agar (PDA). Plates were inoculated at three points with 1 µL of spore suspension (106 conidia/mL, as stated for pathogenicity test) of each isolate. Three plates were used per media. All inoculated plates were kept in the dark at 24 ± 2 °C. Morphology of conidiophores and conidia, type of conidiophores and their ornamentation were evaluated from 7–10 day-old-cultures grown on MEA at 24 ± 2 °C [18,33] using compound microscope Zeiss Axio Lab, Jena, Germany. Photographs of conidiophores and conidia and their sizes were obtained using camera: Axiocam ERc 5s, Zeiss and software ZEN 2 (blue edition), Jena, Germany.

2.6. Ehrlich Test

The production of cyclopiazonic acid and other alkaloids was examined according to Lund [37]. Filter paper (20 mm × 20 mm) was immersed in Ehrlich reagent (2 g 4-dimethylamino-benzaldehide in 85 mL 96% ethanol, with 15 mL 10 N HCl) and was placed on top of the mycelial side of agar plugs (three plugs per isolate, diameter 8 mm) from 7 day-old-cultures grown on CYA at 24 ± 2 °C. After 2–10 min incubation, color or color change were recorded.

2.7. Virulence Assessment in Apple Fruit

Fungal virulence was assessed using 15 selected isolates of Penicillium spp. (seven P. expansum, seven P. crustosum and one P. solitum isolate) (Table 1) on three apple cultivars: ’Golden Delicious’, ’Red Delicious’, and ’Granny Smith’. Mature apple fruit were wound-inoculated as described in the pathogenicity test. Each apple fruit was inoculated with 40 µL of spore suspension on two opposite sides of the fruit. Spore suspensions were adjusted to concentration 105 conidia/mL using a haemocytometer [25,26]. Two apple fruit were used per cultivar (six per isolate). Control fruit were wounded and inoculated containing 40 µL of sterilized water with Tween 20 (0.05%). All fruit were kept under moist conditions in sterile plastic boxes at 24 ± 2 °C temperature under natural light dark cycles. Lesion size was measured at the equatorial and longitudinal axes at 7- and 9-days post inoculation (dpi).

2.8. Statistical Analysis

Kolmogorov–Smirnov and Shapiro–Wilk tests were used to check for normal distribution of the data and Levene test assessed homogeneity of variances. Some of the data were not normally distributed, and homogeneity of variances was violated. Due to large sample sizes parametric tests were used [38,39]. To avoid type I error, we chose more stringent conditions by using p = 0.01 as a significance level. Two-way ANOVA was used to determine which species and culture media affected colony size, and how species and cultivar impacted lesion diameter. One-way ANOVA was used to determine if there was a difference in colony size between isolates, species or between culture media; difference in sizes of conidiophore parts (ramus, metulae, phialide and conidia) between isolates or species and to determine a difference in lesion size between isolates, species or cultivars. Post hoc Tukey HSD test was used to evaluate differences that occurred in testing multiple groups (between isolates of same species or between three species). Evaluating effect size of two factors on the dependent variable was measured using partial eta squared (η2). η2 < 0.06 is considered as weak; η2 > 0.06 moderate and η2 > 0.14 as strong effect [40]. The statistical analyses were conducted with IBM SPSS 22 software (SPSS Inc., Chicago, IL, USA).

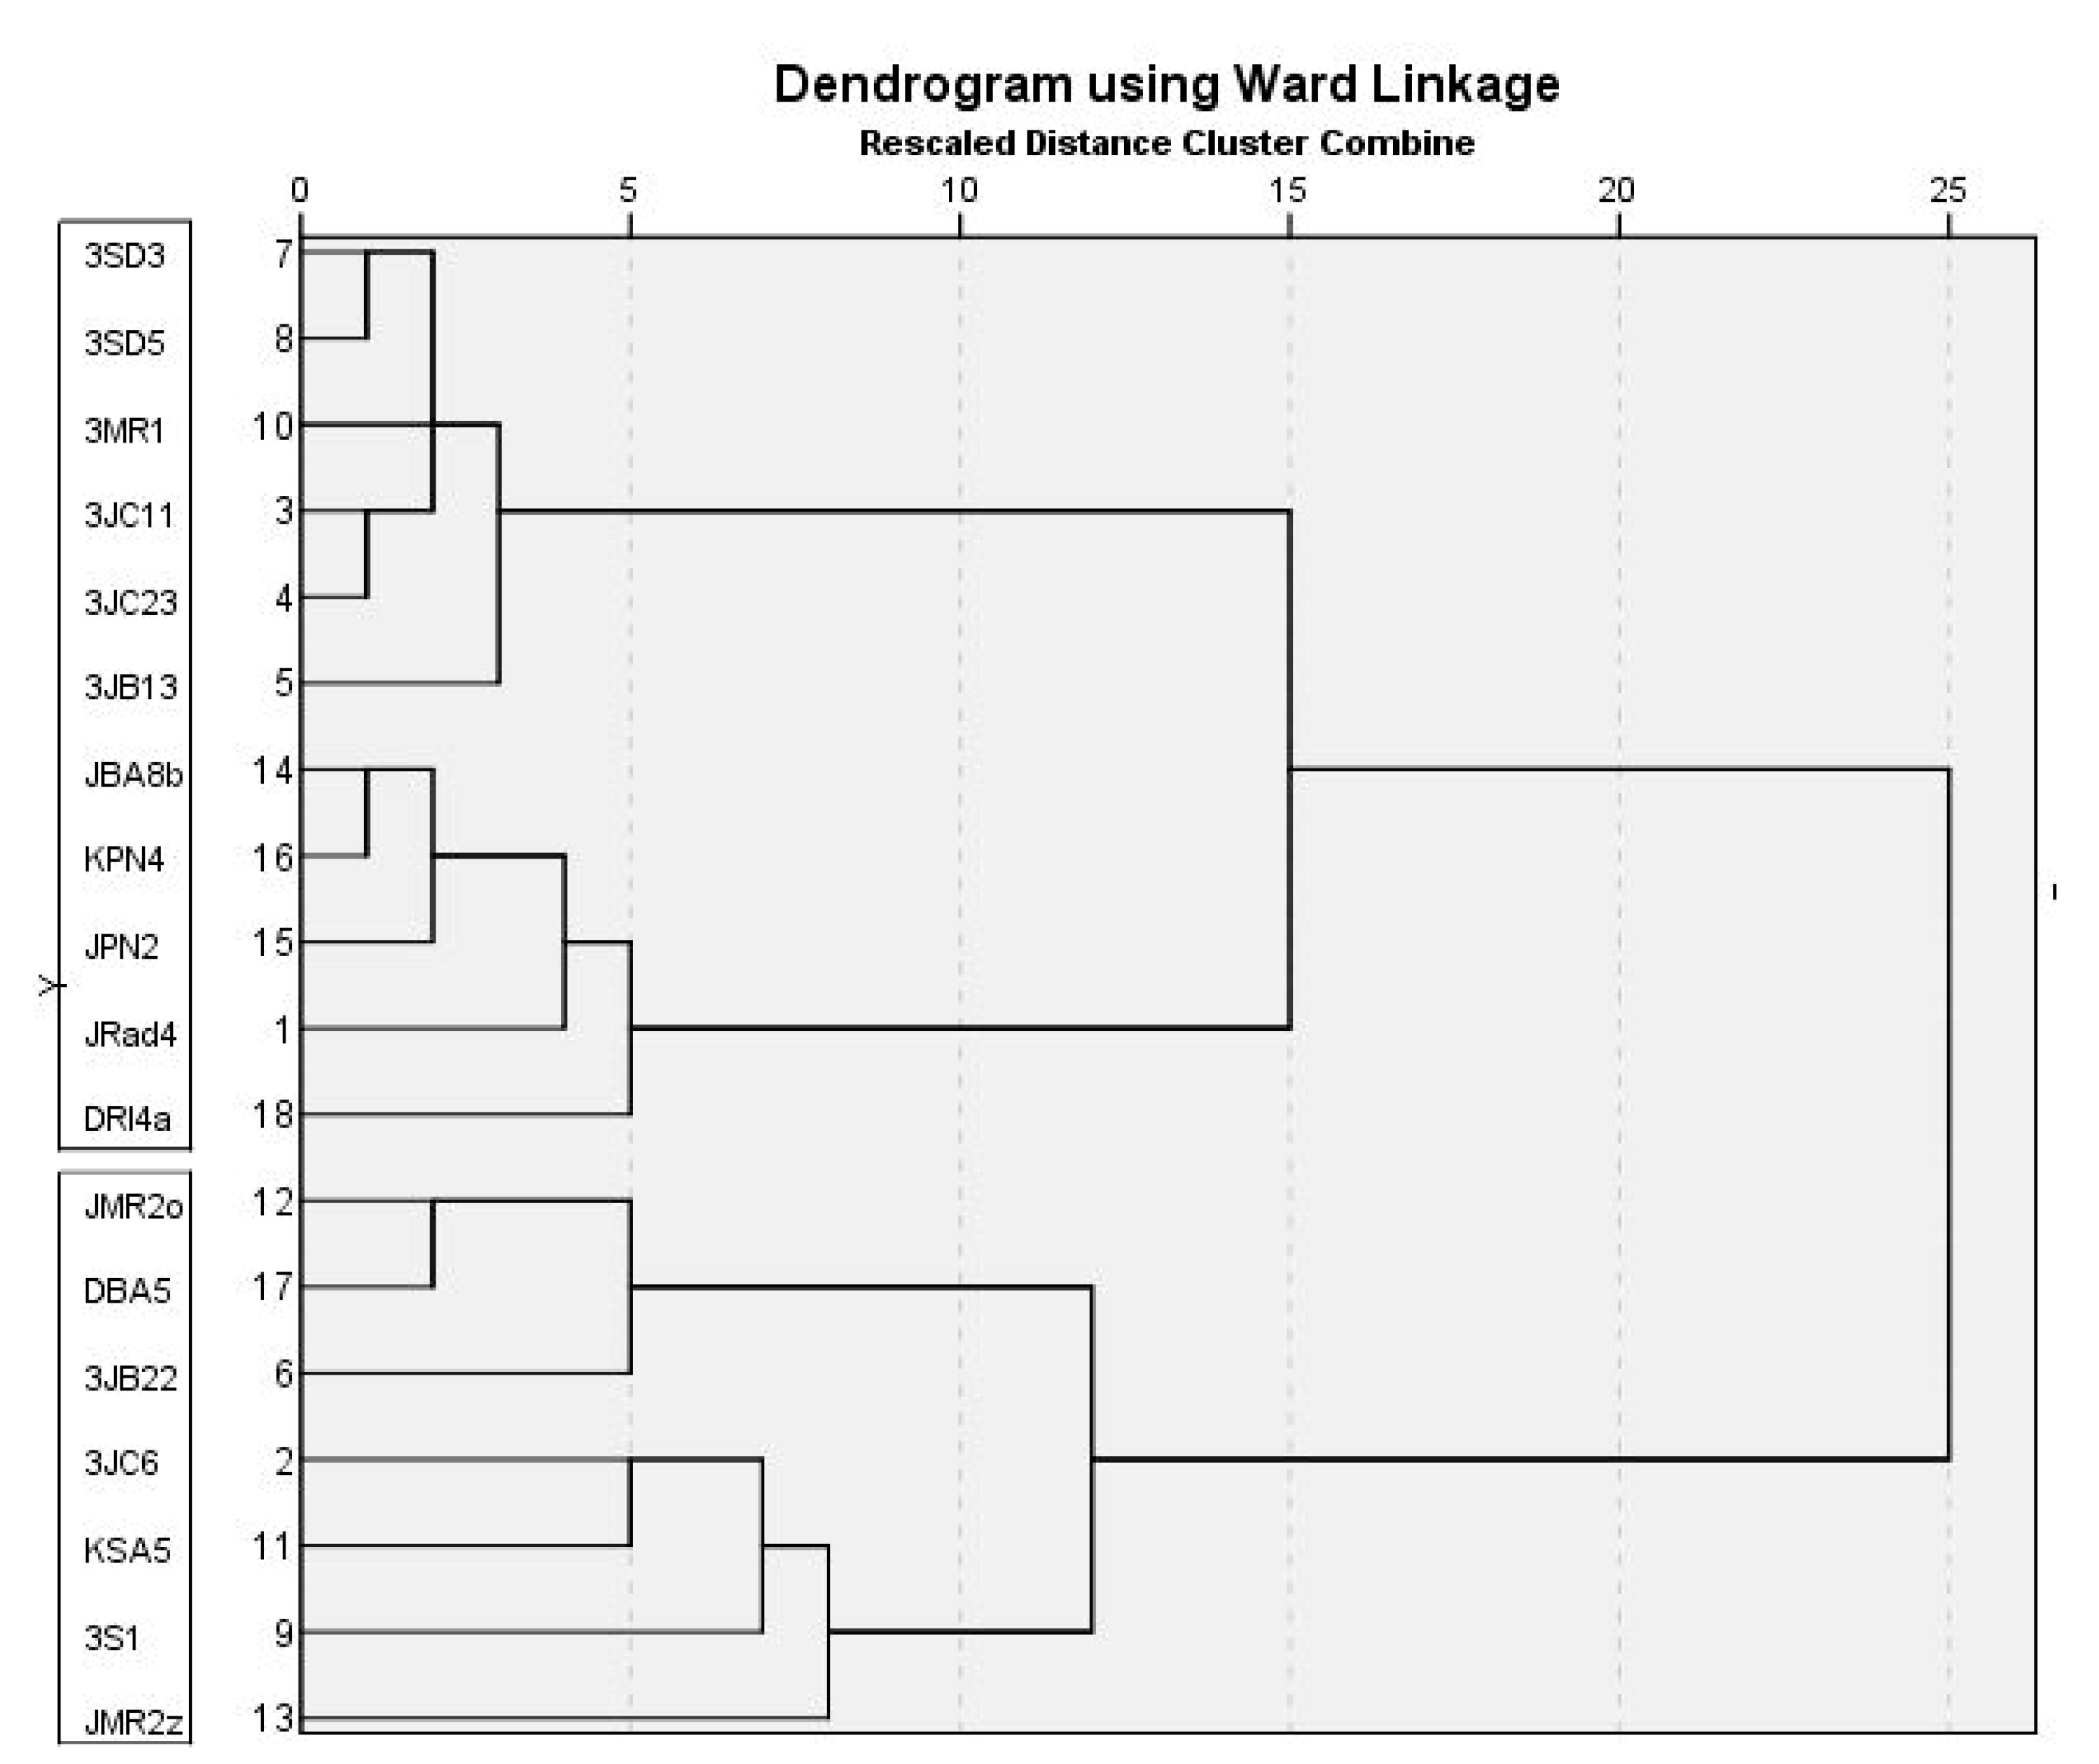
2.9. Cluster Analysis

To interpret the similarities and differences amongst P. expansum or P. crustosum isolates, a multivariate statistical analysis with hierarchical cluster analysis based on Ward’s method and Euclidian distance interval was used. To prevent dominance by large values at the expense of small ones, data were z-standardized using the formula: z = (xμ)σ − 1. IBM SPSS Statistics 22 (SPSS Inc., Chicago, IL, USA), was used for statistical analysis.

2.10. Principle Component Analysis

To enable a comprehensive assessment of data obtained in this study, a Principal Component Analysis (PCA) with PAST 3.17 software [41] was used. To prevent dominance in the PCA by large values at the expense of small ones, data were z-standardized using the formula: z = (xμ)σ − 1. Morphological characteristics (colony diameter on all tested media, conidia, metulae, and rami width, and metulae length, presence of yellow pigment in PDA and MEA reverse, and CYA reverse color) were analysed for 26 isolates, while both morphology and virulence were assessed for 14 select isolates.
Table 1. Isolates used in this study.
IsolateGeographic Origin/Host cv.DateGenBank Accession NumberReferences
ITSBenACaMRPB2
Penicillium expansum
JRad4Serbia, Radmilovac/Apple ‘Gloster’December 2014MZ364021MZ364047MZ364097MZ364075This study
3JC6Serbia, Čelarevo/Apple ‘Braeburn’January 2015MZ364023MZ364056MZ364098MZ364076This study
3JC11Serbia, Čelarevo/Apple ’Granny Smith’April 2015OK432548MZ364048MZ364099MZ364077This study
3JC23Serbia, Čelarevo/Apple ‘Modi’April 2015MZ364024MZ364049MZ364100MZ364078This study
3JB13Serbia, Brestovik/Apple ’Jonagold’January 2015.MZ364025MZ364050MZ364101MZ364079This study
3JB22Serbia, Brestovik/ Apple ‘G. Delicious’January 2015MZ364026MZ364061MZ364102MZ364080This study
3SD3Serbia, Smederevo/Apple ‘R. Delicious’January 2015MZ364027MZ364051MZ364103MZ364081This study
3SD5Serbia, Smederevo/Apple ‘R. Delicious’January 2015MZ364028MZ364052MZ364110MZ364082This study
3S1Serbia, Šid/Apple ‘R. Delicious’January 2015MZ364029MZ364057MZ364104MZ364083This study
3MR1Serbia, Mala Remeta/Apple ‘G. Delicious’January 2015MZ364030MZ364053MZ364105MZ364084This study
KSA5Serbia, Šabac/Pear ‘Passe Crassane‘March 2015MZ364031MZ364045MZ364111MZ364071This study
JMR2o *Serbia, Mala Remeta/Apple ‘Fuji’November 2015MZ364033MZ364058MZ364108MZ364085This study
JMR2z *Serbia, Mala Remeta/Apple ‘Fuji’November 2015MZ364034MZ364059MZ364109MZ364086This study
JBA8b *Serbia, Bavanište/Apple ‘Jonagored‘December 2015MZ364035MZ364054MZ364106MZ364087This study
JPN2 *Serbia, Paraćin/Apple ‘Idared’December 2015MZ364036MZ364055MZ364107MZ364088This study
KPN4 *Serbia, Paraćin/Pear ‘Poire de Cure‘December 2015MZ364032MZ364046MZ364112MZ364072This study
DBA5 *Serbia, Bavanište/Quince ‘Leskovačka’December 2015MZ364022MZ364062MZ364114MZ364073This study
DRI4a *Serbia, Ritopek/Quince ‘Leskovačka’December 2015MZ364020MZ364060MZ364113MZ364074This study
Penicillium crustosum
JBA8a *Serbia, Bavanište/Apple ‘Jonagored’December 2015MZ364037MZ364067MZ389067MZ364089This study
JBA11 *Serbia, Bavanište/Apple ‘Šifra’December 2015MZ364038MZ364068MZ389061MZ364090This study
KGR2 *Serbia, Grocka/Pear ‘Santa Maria’October 2015MZ364039MZ364063MZ389062MZ364091This study
KRI1P *Serbia, Ritopek/Pear ‘Williams’December 2015MZ364040MZ364064MZ389063MZ364092This study
KVA8 *Serbia, Valjevo/Pear ‘Poire de Cure‘December 2015MZ364041MZ364065MZ389064MZ364093This study
DRI4b *Serbia, Ritopek/Quince ‘Leskovačka’December 2015MZ364042MZ364066MZ389065MZ364094This study
MRI4 *Serbia, Ritopek/Medlar local cv.December 2015MZ364043MZ364069MZ389066MZ364095This study
Penicillium solitum
DRI3 *Serbia, Ritopek/Quince ‘Leskovačka’December 2015MZ364044MZ364070MZ364115MZ364096This study
NCBI isolate
Penicillium expansum
CBS 325.48 **USA/Apple fruit AY3739121AY6744002DQ9111342JF41742721[42]; 2[43]
F758USA, Idaho/ Sugar beet2014MG714838MG714864MG714821MG714845[44]
PCASItaly/Chestnut2015MG821365MF100860MF100880/[45]
P34Italy /Withered grape /KU554673//[46]
4Greece/Kiwi fruit2017/MH040784//[47]
CV 2860South Africa/Fynbos biome /JX091539JX141580/[48]
CV 2861South Africa/Fynbos biome /JX091540JX141581/[48]
LUBSerbia, Ub/Onion2015/KY770971//[49]
Penicillium marinum
CBS 109550 **Japan/Sandy soil KJ834512AY674392KU896842KU904357[42]
CBS 109547Tunisia/Sandy soil /AY674390//[50]
Penicillium crustosum
CBS 115503 **Scotland, Aberdeen/Lemon MH8629851AY6743532DQ9111323MN96911431[51]; 2[50]; 3[42]
CV 0241South Africa/Fynbos biome JX091403JX091536JX141576MN149972[52]
5AItaly/Chestnut2015MG821363MF100874MF100894/[45]
N2ASSerbia/Nectarine2021/MT799805//[53]
Penicillium echinulatum
CBS 317.48 **Canada, Culture contaminant AF033473AY674341DQ911133KU904352[42]
DTO228I4Unknown/Unknown /MN149925MN149944MN149964[52]
Penicillium solitum
CBS 424.89 **Germany/Unknown AY3739321AY6743542KU8968511KU90436311[42]; 2[50]
XFItaly/Chestnut2015MG821373MF100861MF100881/[45]
Penicillium discolor
CBS 474.84 **Israel/Raphanus sativus AJ004816AY674348KU896834KU904351[42]
DTO047A2Unknown/Unknown /MN149922MN149941MN149961[52]
Penicillium lanosocoeruleum
CBS 215.30USA/Culture contaminant NR_1635411KU8968172JX9969672JX99671231[51]; 2[42]; 3[54]
* Isolates used in virulence study; ** Ex-type/referent isolates.

3. Results

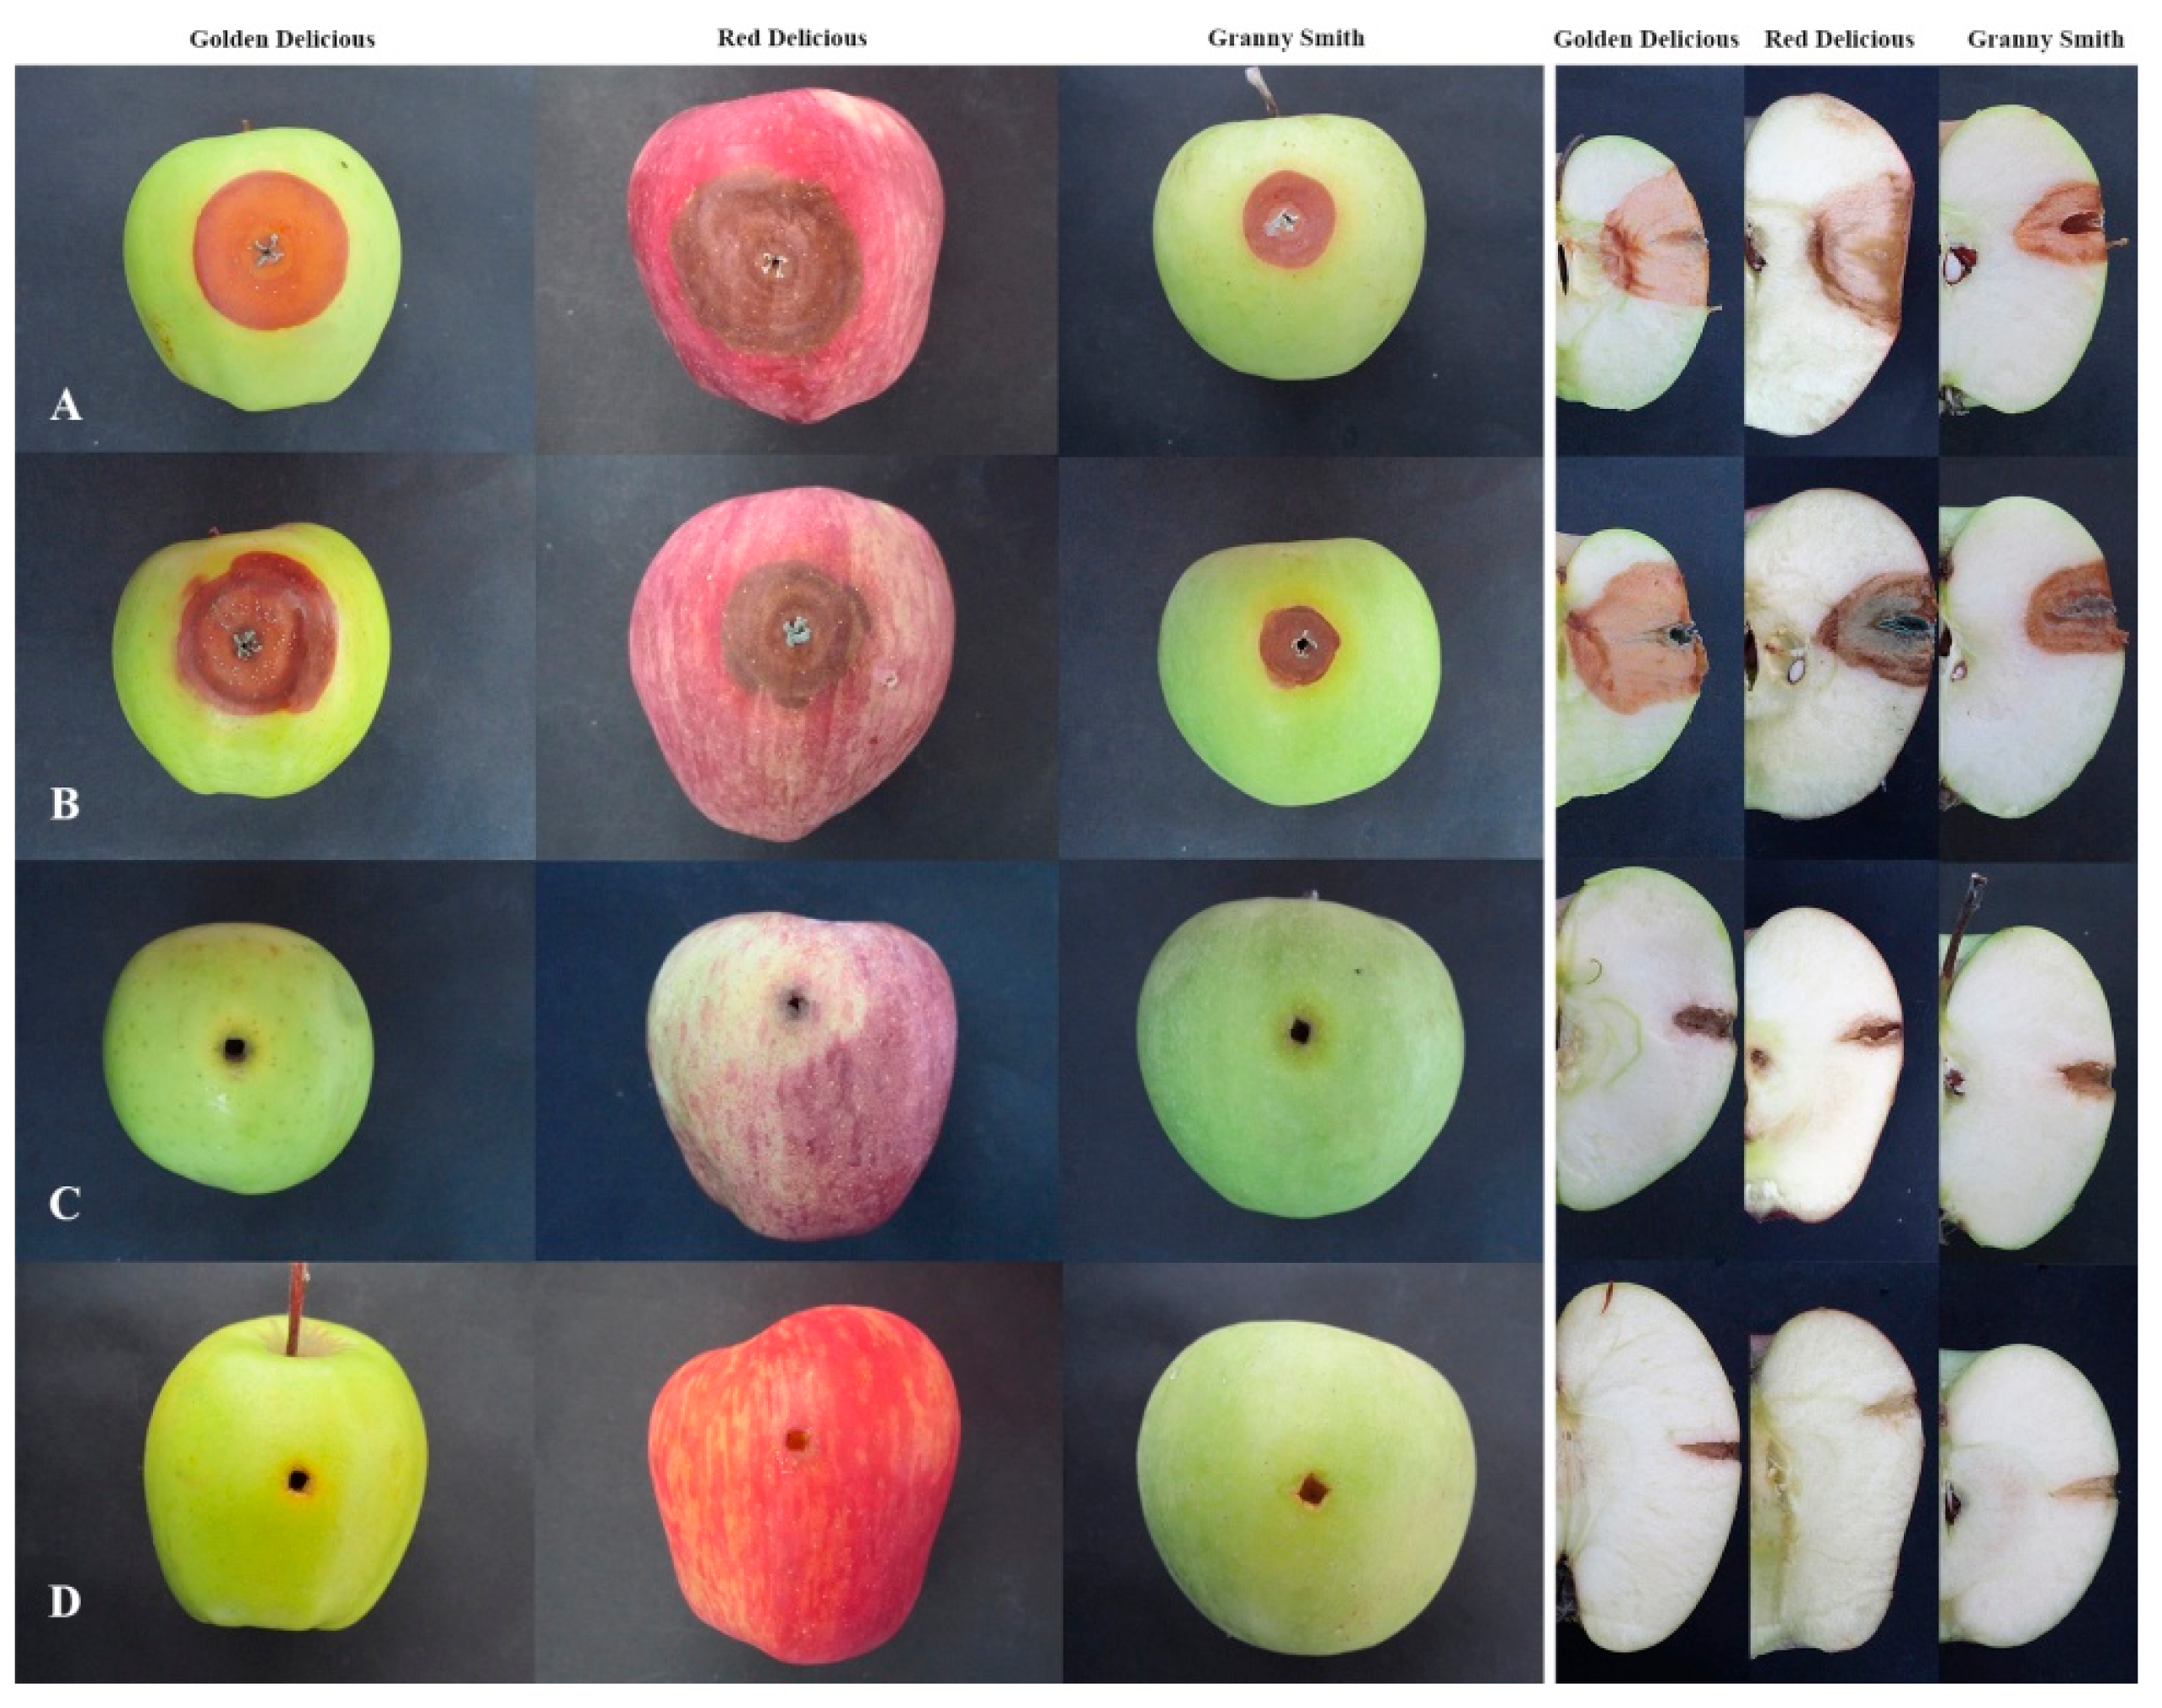
3.1. Blue Mold Symptoms and Koch’s Postulates

Pome fruits, sampled from 20 different locations in Serbia, exhibited typical blue mold symptoms. The decayed area was light brown, soft and watery, and easily separated from the healthy tissue, and ranged from small lesions to completely decayed fruit. In most cases decayed fruit were covered with blue-green colored spores, and had an earthy, musty odour. In total, 96 Penicillium spp. isolates were obtained, 71 originating from apples, 14 from pears, 10 from quince, and one from medlar. All isolates were pathogenic and caused decay on inoculated healthy ‘Idared’ apple fruit, whereas five isolates from pear were pathogenic to pear, four isolates from quince to quince and one from medlar to medlar. P. crustosum induced slightly darker colored decay on inoculated pome fruits than P. expansum, which was the most evident on fruits with yellow skin. Control fruits remained symptomless. On inoculated fruits, blue-green sporulation was mainly present at the inoculation site. Reisolated fungi exhibited identical morphological characteristics that mirrored the original isolate, thus completing Koch’s postulates. Blue mold on representative inoculated pome fruits is presented in Figure 2.

3.2. Molecular Identification and Single Nucleotide Polymorphism

P. expansum specific primers (PEF/PER) generated amplicons of 404 bp in 88 out of 96 tested isolates, while no amplification was observed in 8 isolates and the negative controls. For ITS, BenA, CaM, and RPB2 amplicons of expected size (600, 511, 580, 1000 bp, respectively) were obtained in 26 selected isolates (18 isolates which were positive with P. expansum specific primers and 8 isolates other than P. expansum). Sequencing of the obtained amplicons yielded nucleotide sequences 559–561 nt long for ITS, 428–432 nt for BenA, 501–504 nt for CaM, and 971 nt for RPB2, excluding primers, which were deposited in the NCBI GenBank under accession numbers given in Table 1.
The identity of isolates was confirmed based on single and multilocus phylogeny. Therefore, 18 isolates were identified as P. expansum and confirmed the results of specific primer identification, while seven isolates were identified as P. crustosum, and one as P. solitum. Molecular identification (total of 96 Penicillium isolates) revealed that 91.64% of blue mold on pome fruit collected in this study was caused by P. expansum, 7.29% P. crustosum and 1.04% P. solitum.
Multiple sequence alignment of the P. expansum isolates revealed that: (i) no sequence variation was identified in ITS amplicons, (ii) two sequence variants were found in BenA sequences (2 nt differences) and CaM (3 nt differences), and (iii) three sequence variants were identified in RPB2 (1, 14 and 15 nt differences) (Table 2). Penicillium expansum ITS sequences were identical to those from P. expansum deposited in NCBI GenBank (i.e., AY373912, MG714838, and MG821365). One BenA variant (11 isolates) had sequences that matched several P. expansum sequences (i.e., JX091539, JX091540) and the other BenA variant (7 isolates) had sequences in line with P. expansum (i.e., MH040784) deposited in NCBI. One CaM variant (11 isolates) was identical with P. expansum sequences deposited in NCBI GenBank (e.g., DQ911134, MG714821). The other CaM variant (7 isolates) differed in 3 nt. One RPB2 variant (12 isolates) was identical with P. expansum sequences JF417427 and MG714845, while the second RPB2 variant (four isolates) showed 14 nt differences, and the third (two isolates) had 1 nt difference. Between second and third RPB2 variants, the difference was in 15 nt (Table 2).
Multiple sequence alignment of the P. crustosum isolates revealed that: (i) no sequence variation was identified in sequences of ITS and BenA, (ii) two sequence variants occurred in CaM genomic fragments (1 nt differences), and iii) four variants were identified in RPB2 (having 1, 1, 1, 2 nt differences) (Table 2). ITS and BenA from P. crustosum sequences (seven isolates) were identical with those from P. crustosum isolate CV 0241, i.e., JX091403 and JX091536, respectively. Based on the CaM locus, six isolates were identical, and matched sequences of the P. crustosum isolate CV 0241 (JX141576) and CBS 115503 (DQ911132), while the sequence of one isolate, JBA8a differed from the others in 1 nt. One RPB2 variant (two isolates) was identical with the sequence from P. crustosum isolate CBS 115503 (MN969114), while the second RPB2 variant (two isolates) matched CV 0241 (MN149972), and the variants differed in 2 nt. The third RPB2 variant (two isolates) differed in 2 nt from both the first and the second variant. The fourth variant (one isolate) differed in 3, 3, and 1 nt from the first, second, and third variant, respectively.
P. solitum obtained ITS and CaM sequences were identical with those of P. solitum CBS 424.89 (AY373932 and KU896851, respectively) and BenA had the highest similarity with CBS 424.89 (AY674354), while RPB2 aligned with P. solitum CBS 424.84 (KU904363).

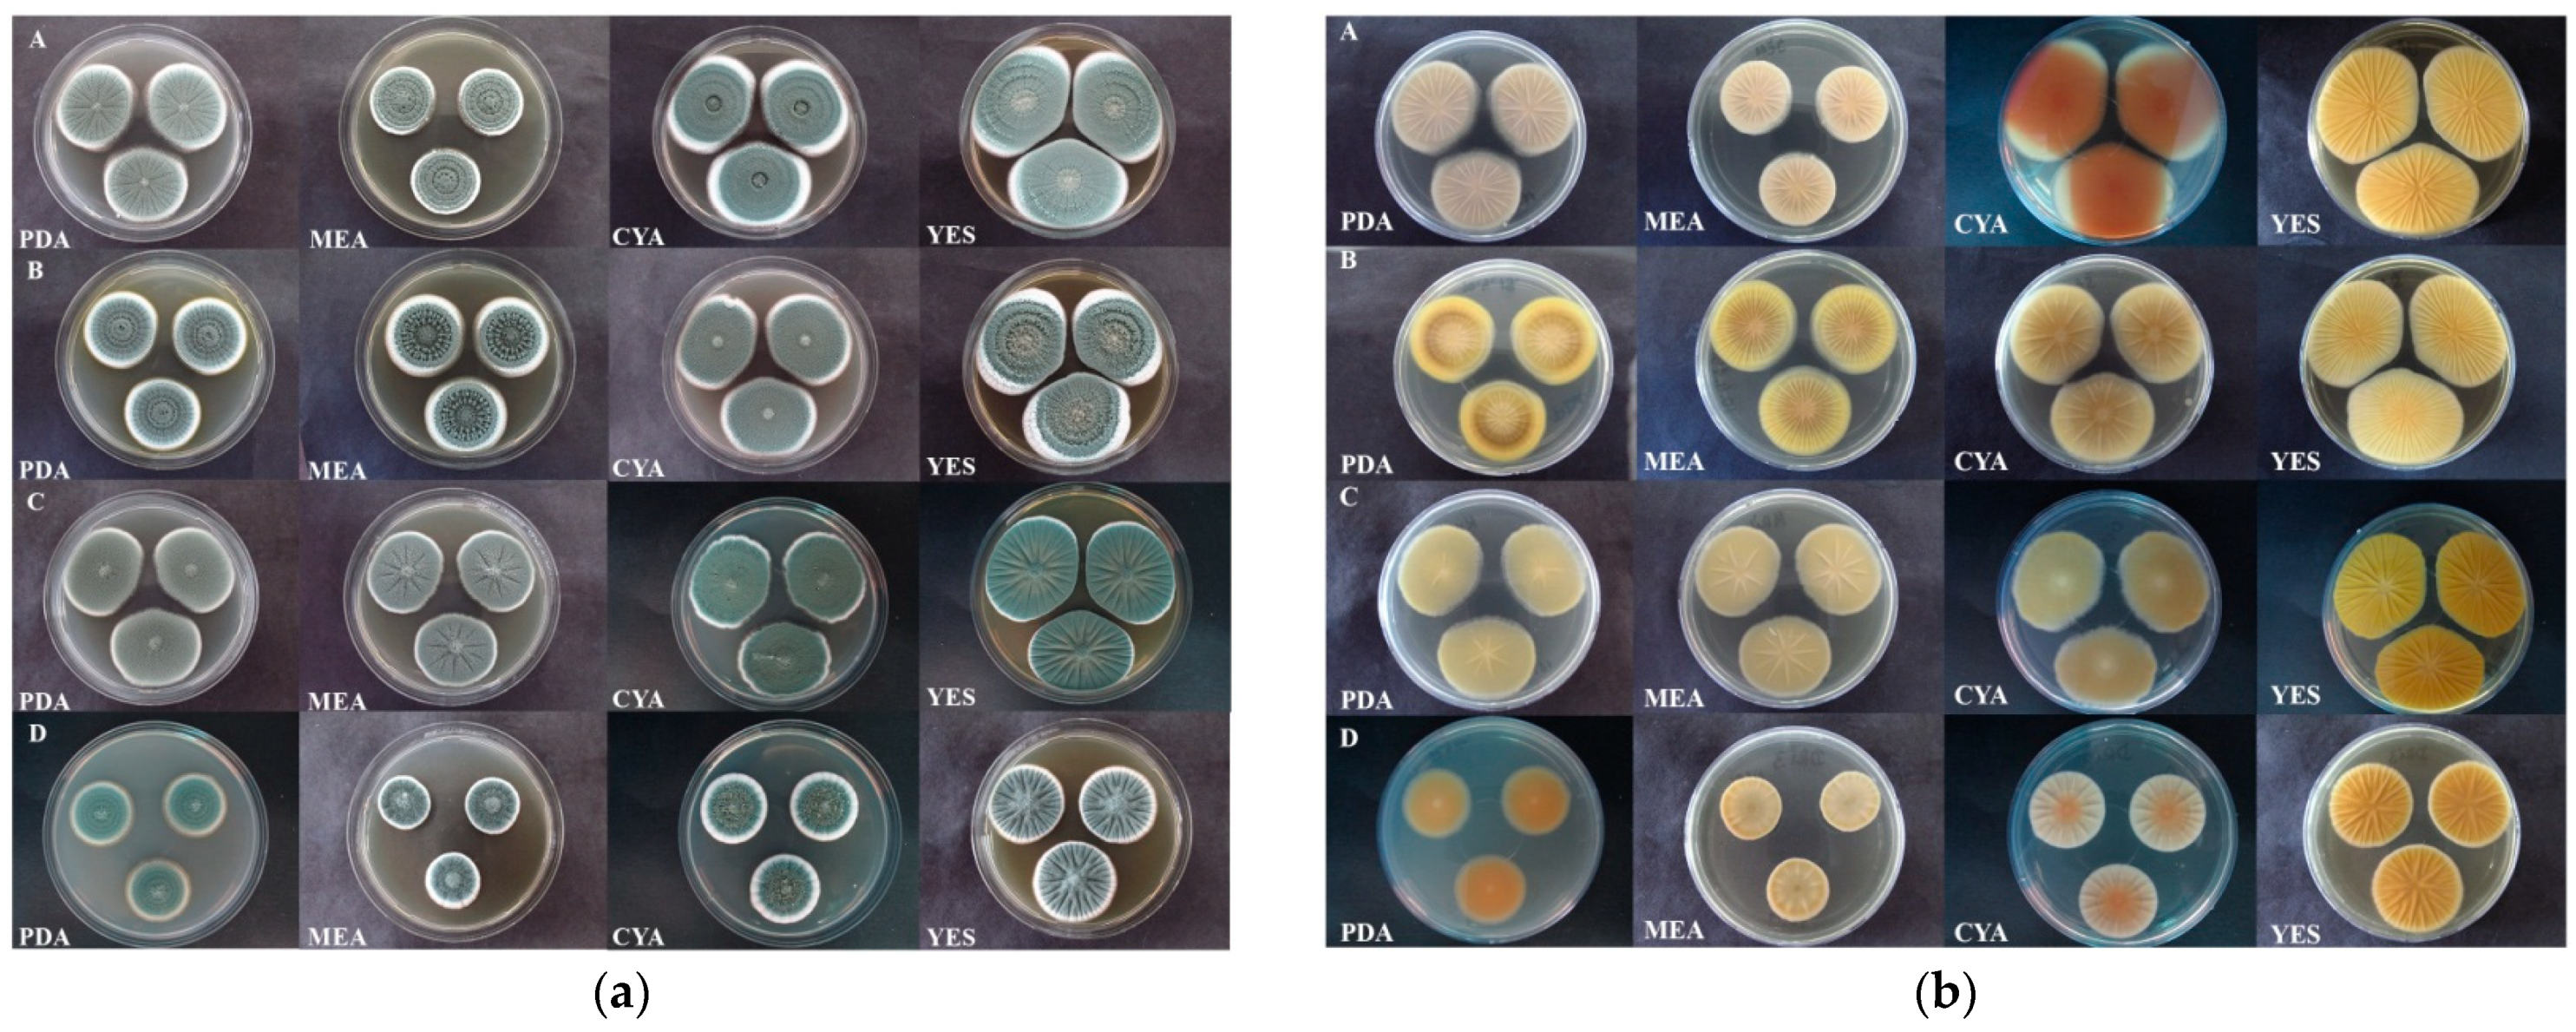
3.3. Macromorphology

P. expansum isolates formed white mycelia (visible as white margins) with blue green conidia on all media. On PDA, colonies were mostly fasciculate with or without concentric zones and radially sulcate. Colony margins were entire. Exudate was absent. Colony reverse in most isolates was cream to pale yellow except for isolates 3JC6, 3S1 (intense yellow with brown ring around centre), KSA5 (intense yellow with cream centre), and JMR2z (dark yellow). On MEA, P. expansum formed fasciculate colonies mostly with concentric zones and were radially sulcate. Scarce clear exudate droplets were present on the colony edge. Colony reverse was in most isolates cream coloured, while in some yellow (3JC6, KSA5, and JMR2z—intense yellow with cream centre; 3S1—yellow with light brown ring). On CYA, colonies were concentrically fasciculate and weakly radially sulcate, rarely velutinous. Colonies were dense and differed in exudate production from no exudate, scarce, to abundant exudate droplets. Colony reverse varied from cream, yellow, salmon pink to red. Most isolates formed salmon pink to red reverse of different intensities, some formed yellow reverse (3JC6, 3S1, and KSA5) and some cream reverse (3JB22, JMR2o, and DBA5). On YES, colonies were mostly fasciculate with or without concentric zones, radially sulcate, sometimes velutinous (3JC23, KPN4, and DRI4a). Conidia color was blue green to grey, and colonies were sometimes cream around the centre, and exudate was absent. Colony reverse was pale yellow to intense yellow, with or without orange centre (Figure 3a,b).
P. crustosum isolates formed white mycelia (visible as white margins) with blue dull green conidia on all media. Colonies on PDA and MEA were similar: velutinous, sometimes radially sulcate, which become crustose after 10 days. Colony margins were white and exudate was absent. Colony reverse was cream to intense yellow. On CYA, P. crustosum formed velutinous, sometimes radially sulcate colonies mainly with irregular margins. Colonies were with or without exudate. Colony reverse was cream to yellow. On YES, colonies were velutinous, radially sulcate and dense. Conidia color was blue green and sometimes grey. Margins were entire and exudate was absent. Colony reverse was yellow to intense yellow (Figure 3a,b). Among P. crustosum one isolate (DRI4b) differed by forming concentrically floccose to fasciculate colonies on CYA and YES, and orange reverse on PDA, MEA, and CYA.
P. solitum isolate formed white mycelia with blue green conidia on all media. On PDA, colony was velutinous to floccose with concentric zones, without exudate. Colony reverse was orange with a cream margin. On MEA, the colony was floccose and radially sulcate, without exudate. Colony reverse was cream to light brown at the margin. On CYA, colony was floccose and radially sulcate, and abundant clear exudate droplets were present. Colony reverse was cream with a bright orange centre. On YES, colony was floccose and radially sulcate with bright blue grey conidia. Exudate was absent. Colony reverse was intense yellow (Figure 3a,b).

3.4. Colony Growth

Colony growth of P. expansum, P. crustosum and P. solitum on four media is presented in Table 3. The most favourable growth media for all three species was YES, followed by CYA and PDA, while colony diameter was smaller on MEA (p < 0.01). P. expansum growth was faster on CYA and YES compared to P. crustosum (p < 0.0001) (and P. solitum (p < 0.0001)), while on PDA and MEA was the same as P. crustosum (p = 0.901). P. solitum had the slowest colony growth on all media (p < 0.01). Variability in colony growth was observed within isolates of P. expansum (on all media) (p < 0.01) and P. crustosum (on MEA, CYA, and YES) (p < 0.01). Among P. expansum two groups of isolates were observed, fast growing (11 out of 18) and slower growing (7 out of 18) (Table 3, Figure 4). Two-way ANOVA revealed that both species and culture media had a large influence on colony growth. Variation in colony growth of 20.9% (η2 = 0.209, p < 0.0001) is due to differences between species, while 17.3% (η2 = 0.173, p < 0.0001) is caused by differences in culture media. Combined effect of species characteristics and culture media on its growth was negligible 2.6% (η2 = 0.026, p < 0.0001). We did not observe that isolate origin had an influence on colony growth (data not shown). Cluster analysis based on colony diameter on three different media (PDA, CYA, and YES), presence/absence of yellow colony reverse on PDA and MEA, and colony reverse on CYA separated P. expansum isolates into two groups and corresponds with two sub clusters obtained via phylogenetic analysis (BenA, CaM) (Figure 4. The first group of isolates (11 out of 18) had faster growing colonies, cream reverse (absence of yellow reverse) on PDA and MEA, and salmon pink to red CYA reverse. A second group of isolates (7 out of 18) had slower colony growth, yellow reverse on PDA and MEA, and variable color of CYA colony reverse (yellow, cream or red). Cluster analysis based on colony growth on three different media (MEA, CYA, and YES) separated P. crustosum isolates into three groups (Figure 5), and it corresponds with three sub clusters obtained via phylogenetic analysis (RPB2 and multilocus).

3.5. Micromorphology

P. expansum formed mostly terverticillate and sometimes biverticillate conidiophores with smooth walls. Conidia were grey green to blue green in color, smooth, globose, subglobose, and elliptical, with average conidia size 3.24 ± 0.30 × 2.73 ± 0.24 µm. Phialides were smooth, mostly cylindrical and sometimes ampuliform, with average size 10.14 ± 1.32 × 2.94 ± 0.47 µm. Metulae (12.94 ± 2.30 × 3.61 ± 0.65 µm) and rami (19.66 ± 4.47 × 3.96 ± 0.97 µm) were smooth and cylindrical. P. crustosum formed mostly terverticillate and sometimes biverticillate conidiophores with evidently roughened walls. Conidia were dull green to blue green, smooth, globose to subglobose, with average conidia size 3.33 ± 0.27 × 3.06 ± 0.23 µm. Phialides were smooth, rarely roughened, ampuliform to cylindrical, and its average size was 10.05 ± 1.35 × 3.10 ± 0.41 µm. Metulae were roughened to smooth and cylindrical (14.02 ± 2.43 × 3.86 ± 0.54 µm), while rami were roughened and cylindrical (21.23 ± 4.45 × 4.11 ± 0.60 µm). Stipes were also roughened. P. solitum formed mostly terverticillate and sometimes biverticillate conidiophores with smooth or finely roughened walls. Conidia were smooth, mostly globose sometimes subglobose, with average size 3.67 ± 0.17 × 3.42 ± 0.18 µm. Color of conidia was grey green to blue green, the same as P. expansum conidia. Phialides were smooth, ampuliform to cylindrical, with average size 10.13 ± 1.92 × 3.11 ± 0.41 µm. Metulae were smooth and cylindrical (12.20 ± 2.03 × 4.21 ± 0.56 µm), while rami were smooth to finely roughened and cylindrical (18.17 ± 4.09 × 4.41 ± 0.69 µm). Stipes were roughened. Comparative micromorphology (Table 4) between P. expansum and P. crustosum revealed: (i) there was no difference in conidia length (p = 0.09), while conidia of P. expansum were smaller in width than P. crustosum (p < 0.0001) (P. solitum isolate had significantly larger conidia than P. expansum and P. crustosum (p < 0.0001); (ii) there was no difference in phialides length (p = 0.75), and width (p = 0.011); (iii) metulae length and width were larger in P. crustosum compared to P. expansum (p < 0.0001) (P. solitum formed the widest metulae); (iv) rami were of similar size (p = 0.368 for length, p = 0.177 for width) (P. solitum formed the shortest and widest rami); (v) difference between investigated species was large in conidia width (η2 = 0.175), moderate in conidia length (η2 = 0.061), small in metulae and rami length and width (η2 = 0.047; η2 = 0.055 for metulae and η2 = 0.03; η2 = 0.023 for rami), (vi) variability within P. expansum isolates was observed in conidia, phialide, metulae, and rami size, while within P. crustosum isolates in conidia size and phialide length (p < 0.01). Isolate origin did not impact conidia or conidiophore size (statistical data not shown).

3.6. Ehrlich Test

Ehrlich reagent reacted with 12 out of 18 P. expansum isolates as yellow rings were detected and six isolates formed faint violet rings. All P. crustosum isolates formed faint yellow to yellow rings and P. solitum isolate also formed a yellow ring. Observed reactions indicated that six P. expansum isolates produced cyclopiazonic acid, while the other 12 P. expansum isolates, and all P. crustosum isolates and P. solitum isolate produced other alkaloids.

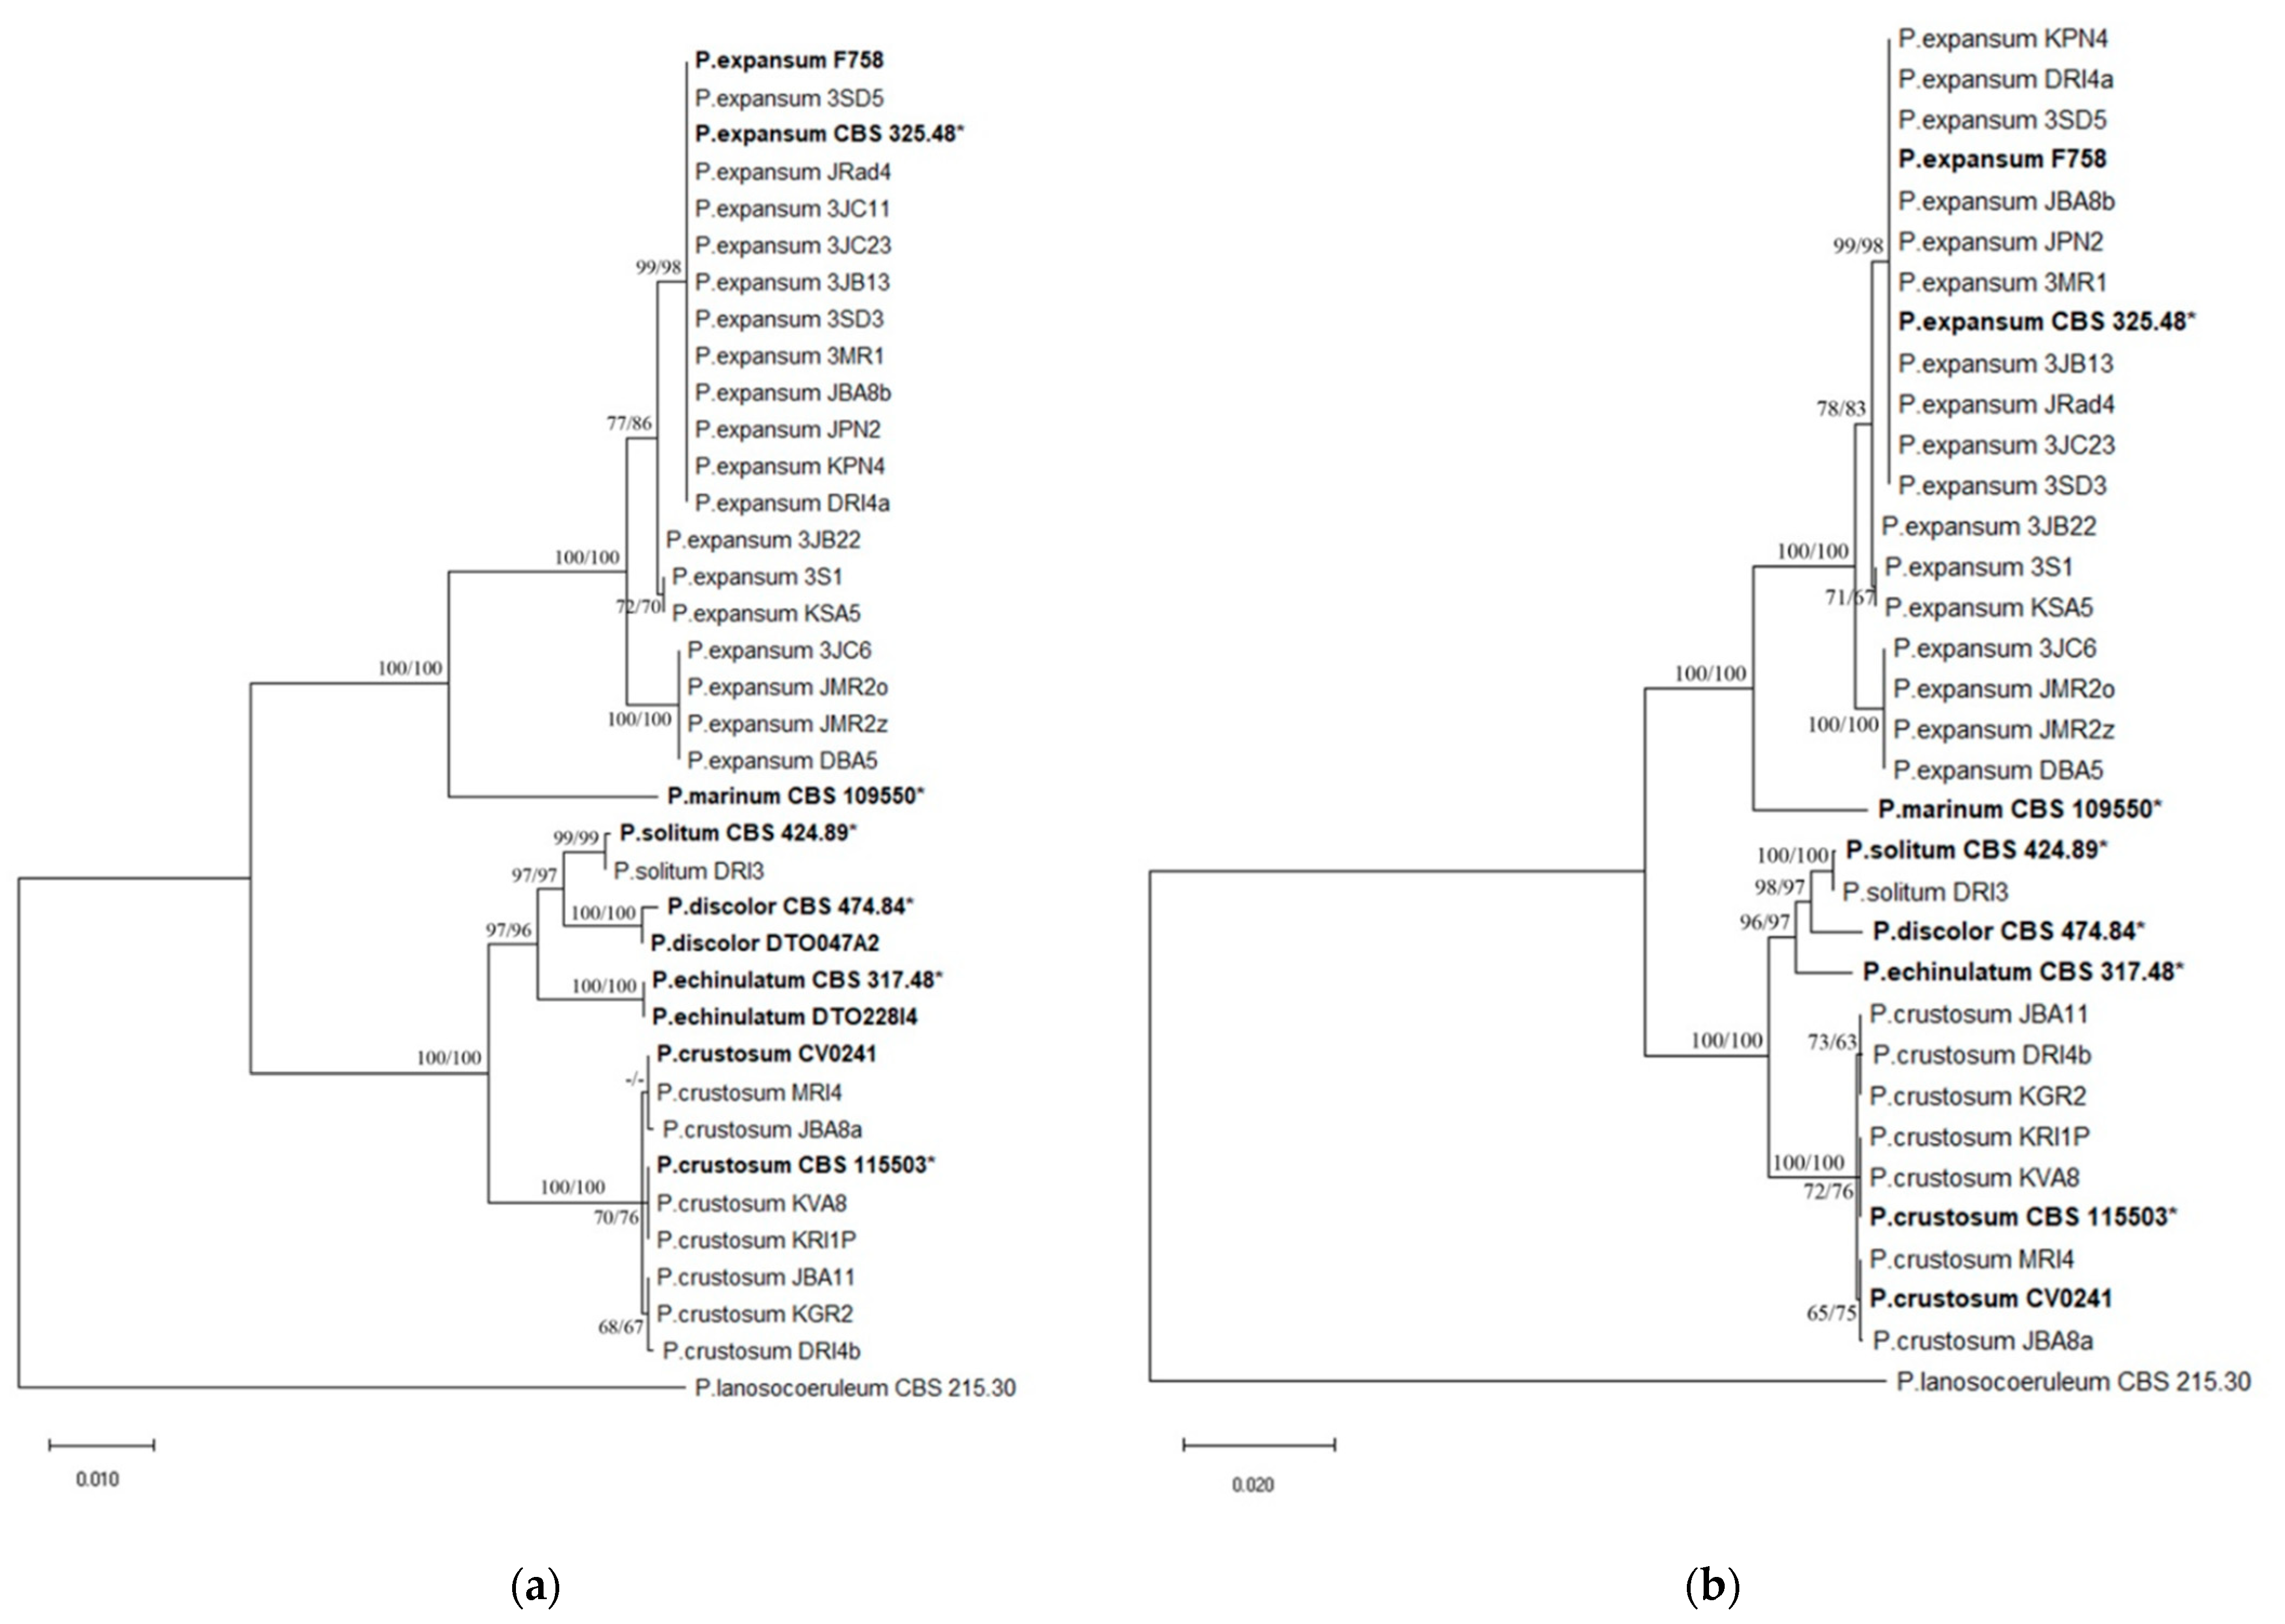
3.7. Penicillium Multilocus Phylogeny

The ITS, BenA, CaM, and RPB2 multiple sequence alignments contained 561, 448, 521, and 971 nucleotides, of which 9, 40, 53, and 90, were parsimony informative, respectively. Different nucleotide substitution models were used for individual ML analyses: Tamura’s 3-parameter model (T92) for ITS, Kimura’s 2-parameter model (K2) for BenA and CaM, and Kimura’s 2-parameter model with a discrete gamma distribution (K2 + G) for RPB2. MP analyses of ITS, BenA, CaM, and RPB2 resulted each in 10 equally most parsimonious trees. ML and MP analyses, based on the same single locus, produced trees with identical topologies. Comparing the trees inferred from different loci, the most congruent were those based on BenA and CaM. The combined dataset of the concatenated three single locus alignments (BenA, CaM, and RPB2) contained 1928 characters, of which 176 were parsimony informative, and the combined dataset of the concatenated four single locus alignments contained 2498 characters, of which 169 were parsimony informative. Multilocus phylogenetic trees constructed by ML method, using K2 + G, had the same topology as MP trees, and were consistent with topology of RPB2 tree. MP analysis resulted in 10 equally most parsimonious trees. Selected phylogenetic trees are presented in Figure 6 and Figure 7.
Each phylogenetic analysis conducted in this study clearly separated P. expansum and P. crustosum. No difference within species was observed in phylogenetic analysis based on the ITS region. P. expansum isolates were (sub) divided into two well-supported clades based on BenA and CaM phylogeny, corresponding to two groups separated by macromorphology. RPB2 and multilocus phylogeny confirmed the separation of P. expansum isolates into two groups with the exception of three isolates that were relocated from one group to another (Table 5).
P. crustosum isolates resided in one clade based on ITS, BenA and CaM phylogeny. RPB2 and multilocus phylogeny revealed three groups within P. crustosum clade, all of which received bootstrap support above 60% in ML analyses based on both datasets. P. solitum isolate was grouped with reference isolates of P. solitum into one clade based on each phylogenetic analysis conducted in this study, except the one based on ITS which could not separate P. solitum from some similar Penicillium species. P. solitum clade received the highest bootstrap support (100%) in multilocus phylogeny, followed by RPB2 phylogeny (99%). RPB2 has shown to be the most variable region in all obtained Penicillium spp.

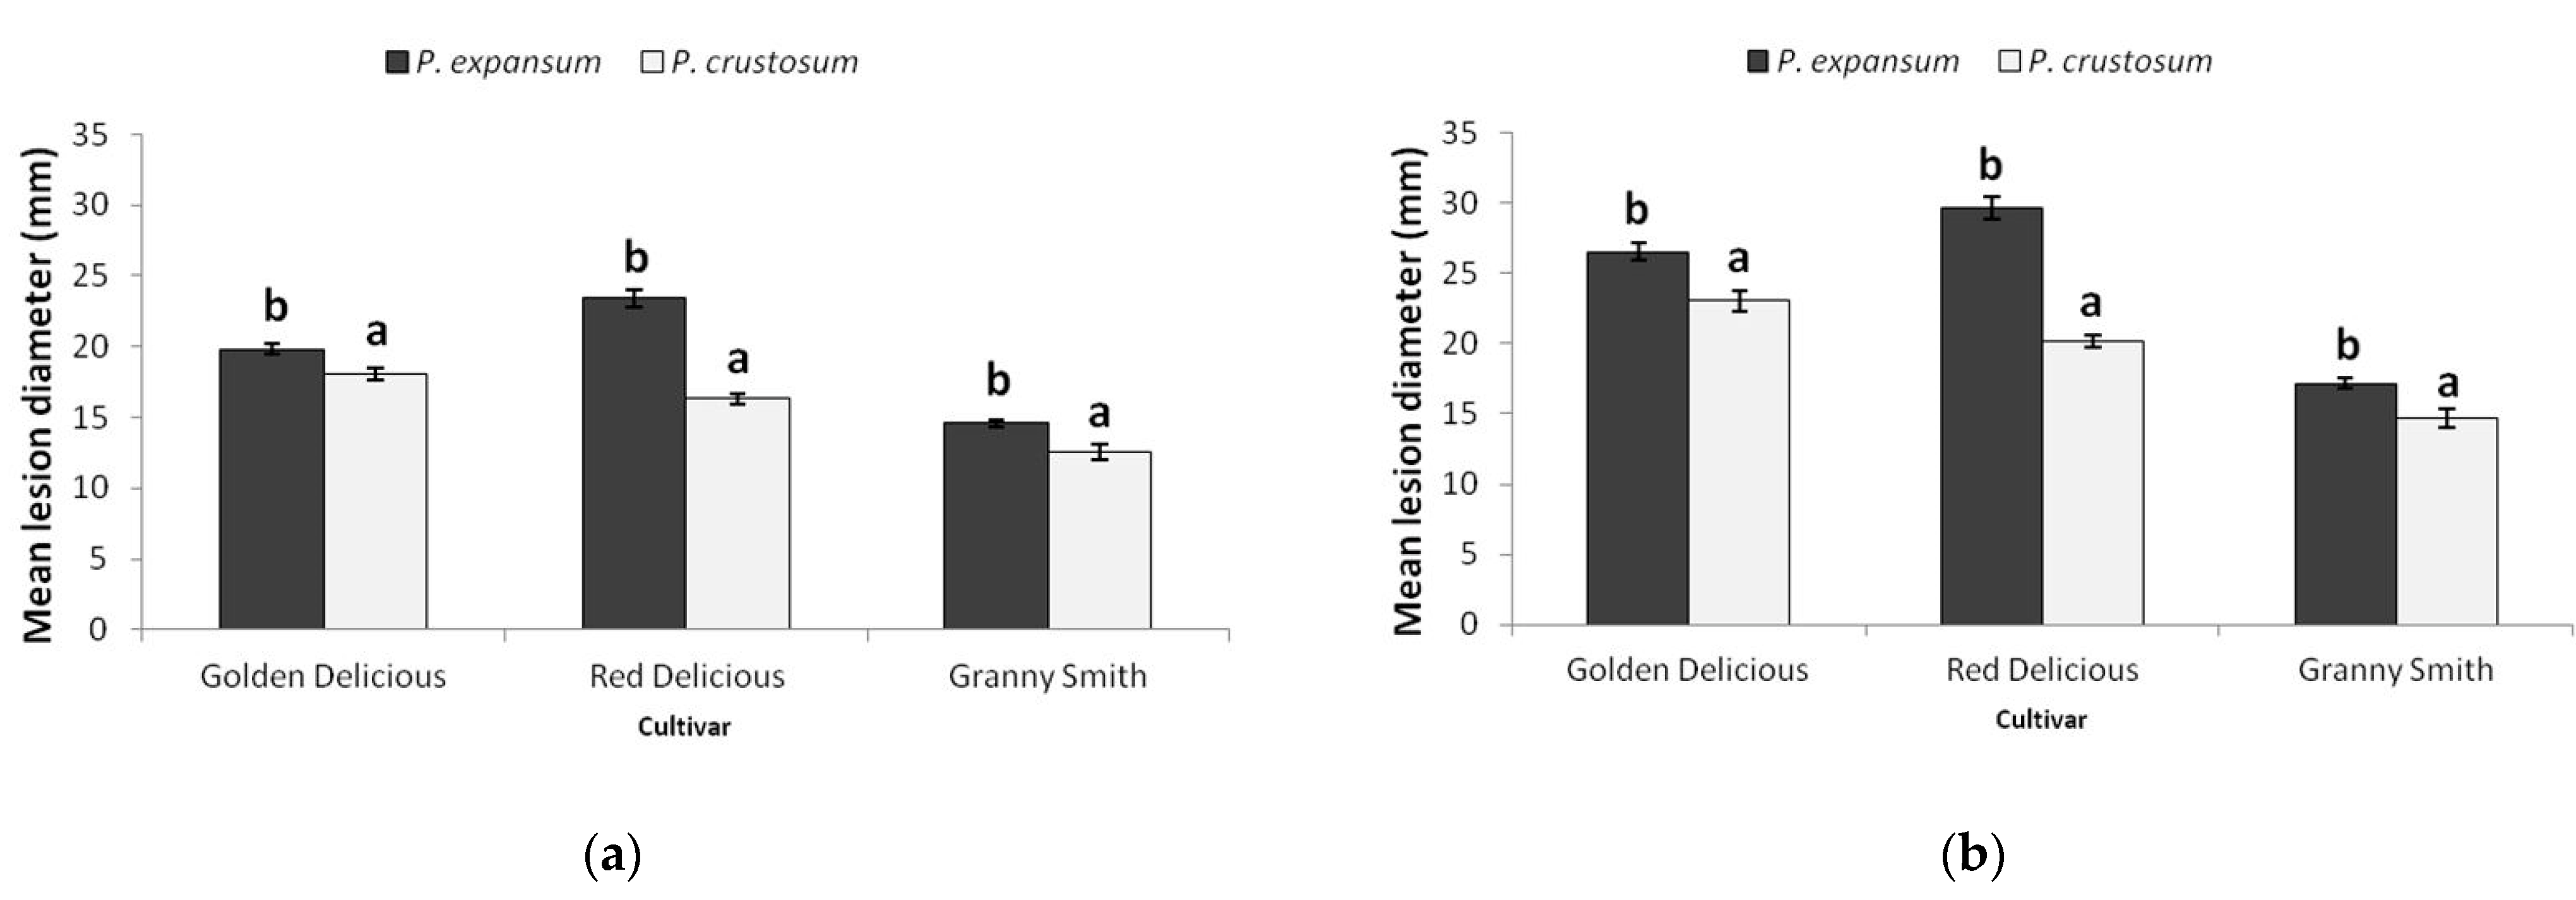
3.8. Virulence Phenotypes in Apple Fruit

Representative P. expansum and P. crustosum isolates caused typical blue mold symptoms in all apple cultivars evaluated. Lesions were soft, watery, light to medium brown, with or without concentric zones, with smooth or irregular margins, and with blue green conidial tufts present mainly around the inoculation cite. In some cases (i.e., P. crustosum isolates JBA8a, MRI4) on apple fruit ‘Granny Smith’ a yellow ring was observed around decayed area. On cross sections of inoculated apple fruit, differences between the decay caused by P. expansum and P. crustosum, were observed. P. crustosum isolates caused slightly darker color of the decayed tissue in all cultivars and sporulated both around the wound an in the apple flesh of ‘Red Delicious’. P. expansum isolates formed lightly coloured decayed areas and scarcely sporulated only around the inoculation cite, not in the apple flesh. In apple fruit inoculated with P. solitum, tissue darkening was observed only around inoculation cite and a yellow ring was present (Figure 8).
Based on lesion size, P. expansum was significantly more virulent than P. crustosum on all three apple cultivars (‘Golden Delicious’, ‘Red Delicious’, and ‘Granny Smith’), 7 dpi (p = 0.003, p < 0.0001, p = 0.001) (Figure 9a) and 9 dpi (p < 0.0001, p = 0.001, p = 0.002) (Figure 9b). Nevertheless, virulence of each species depended on the apple cultivar. P. expansum was the most virulent on ‘Red Delicious’, and produced larger lesions than on ‘Golden Delicious’ (p < 0.0001). P. crustosum was equally virulent on ‘Golden Delicious’ and ‘Red Delicious’ (7 dpi, p = 0.015). Both species were the least virulent on ‘Granny Smith’. The largest difference in virulence between P. expansum and P. crustosum was observed on ‘Red Delicious’.
Within species, variability in virulence was observed amongst P. expansum isolates on ‘Red Delicious’ (7 dpi p < 0.0001), and amongst P. crustosum isolates on ‘Granny Smith’ (7 dpi, p < 0.0001). Cluster analyses based on lesion size, separated three groups within P. crustosum isolates the same way that was determined for colony growth (shown in Figure 5), and it corresponds with three sub clusters obtained via phylogenetic analysis (RPB2 and multilocus). No influence of isolate origin on virulence was observed (statistical data not shown). Two-way ANOVA revealed that both apple cultivar (η2 = 0.419 for 7 dpi and η2 = 0.475 for 9 dpi) and species (η2 = 0.237 for 7 dpi, η2 = 0.252 for 9 dpi) had a large influence on lesion size. Combined influence of both factors: species and apple cultivar on lesion size was moderate (η2 = 0.123 for 7 dpi and η2 = 0.110 for 9 dpi), suggesting that the combination of the most susceptible cultivar and the most virulent pathogen caused rapid disease progression (‘Red Delicious’ + P. expansum), while disease progressed more slowly in case of less susceptible cultivar and less aggressive pathogen (‘Granny Smith’ + P. crustosum).

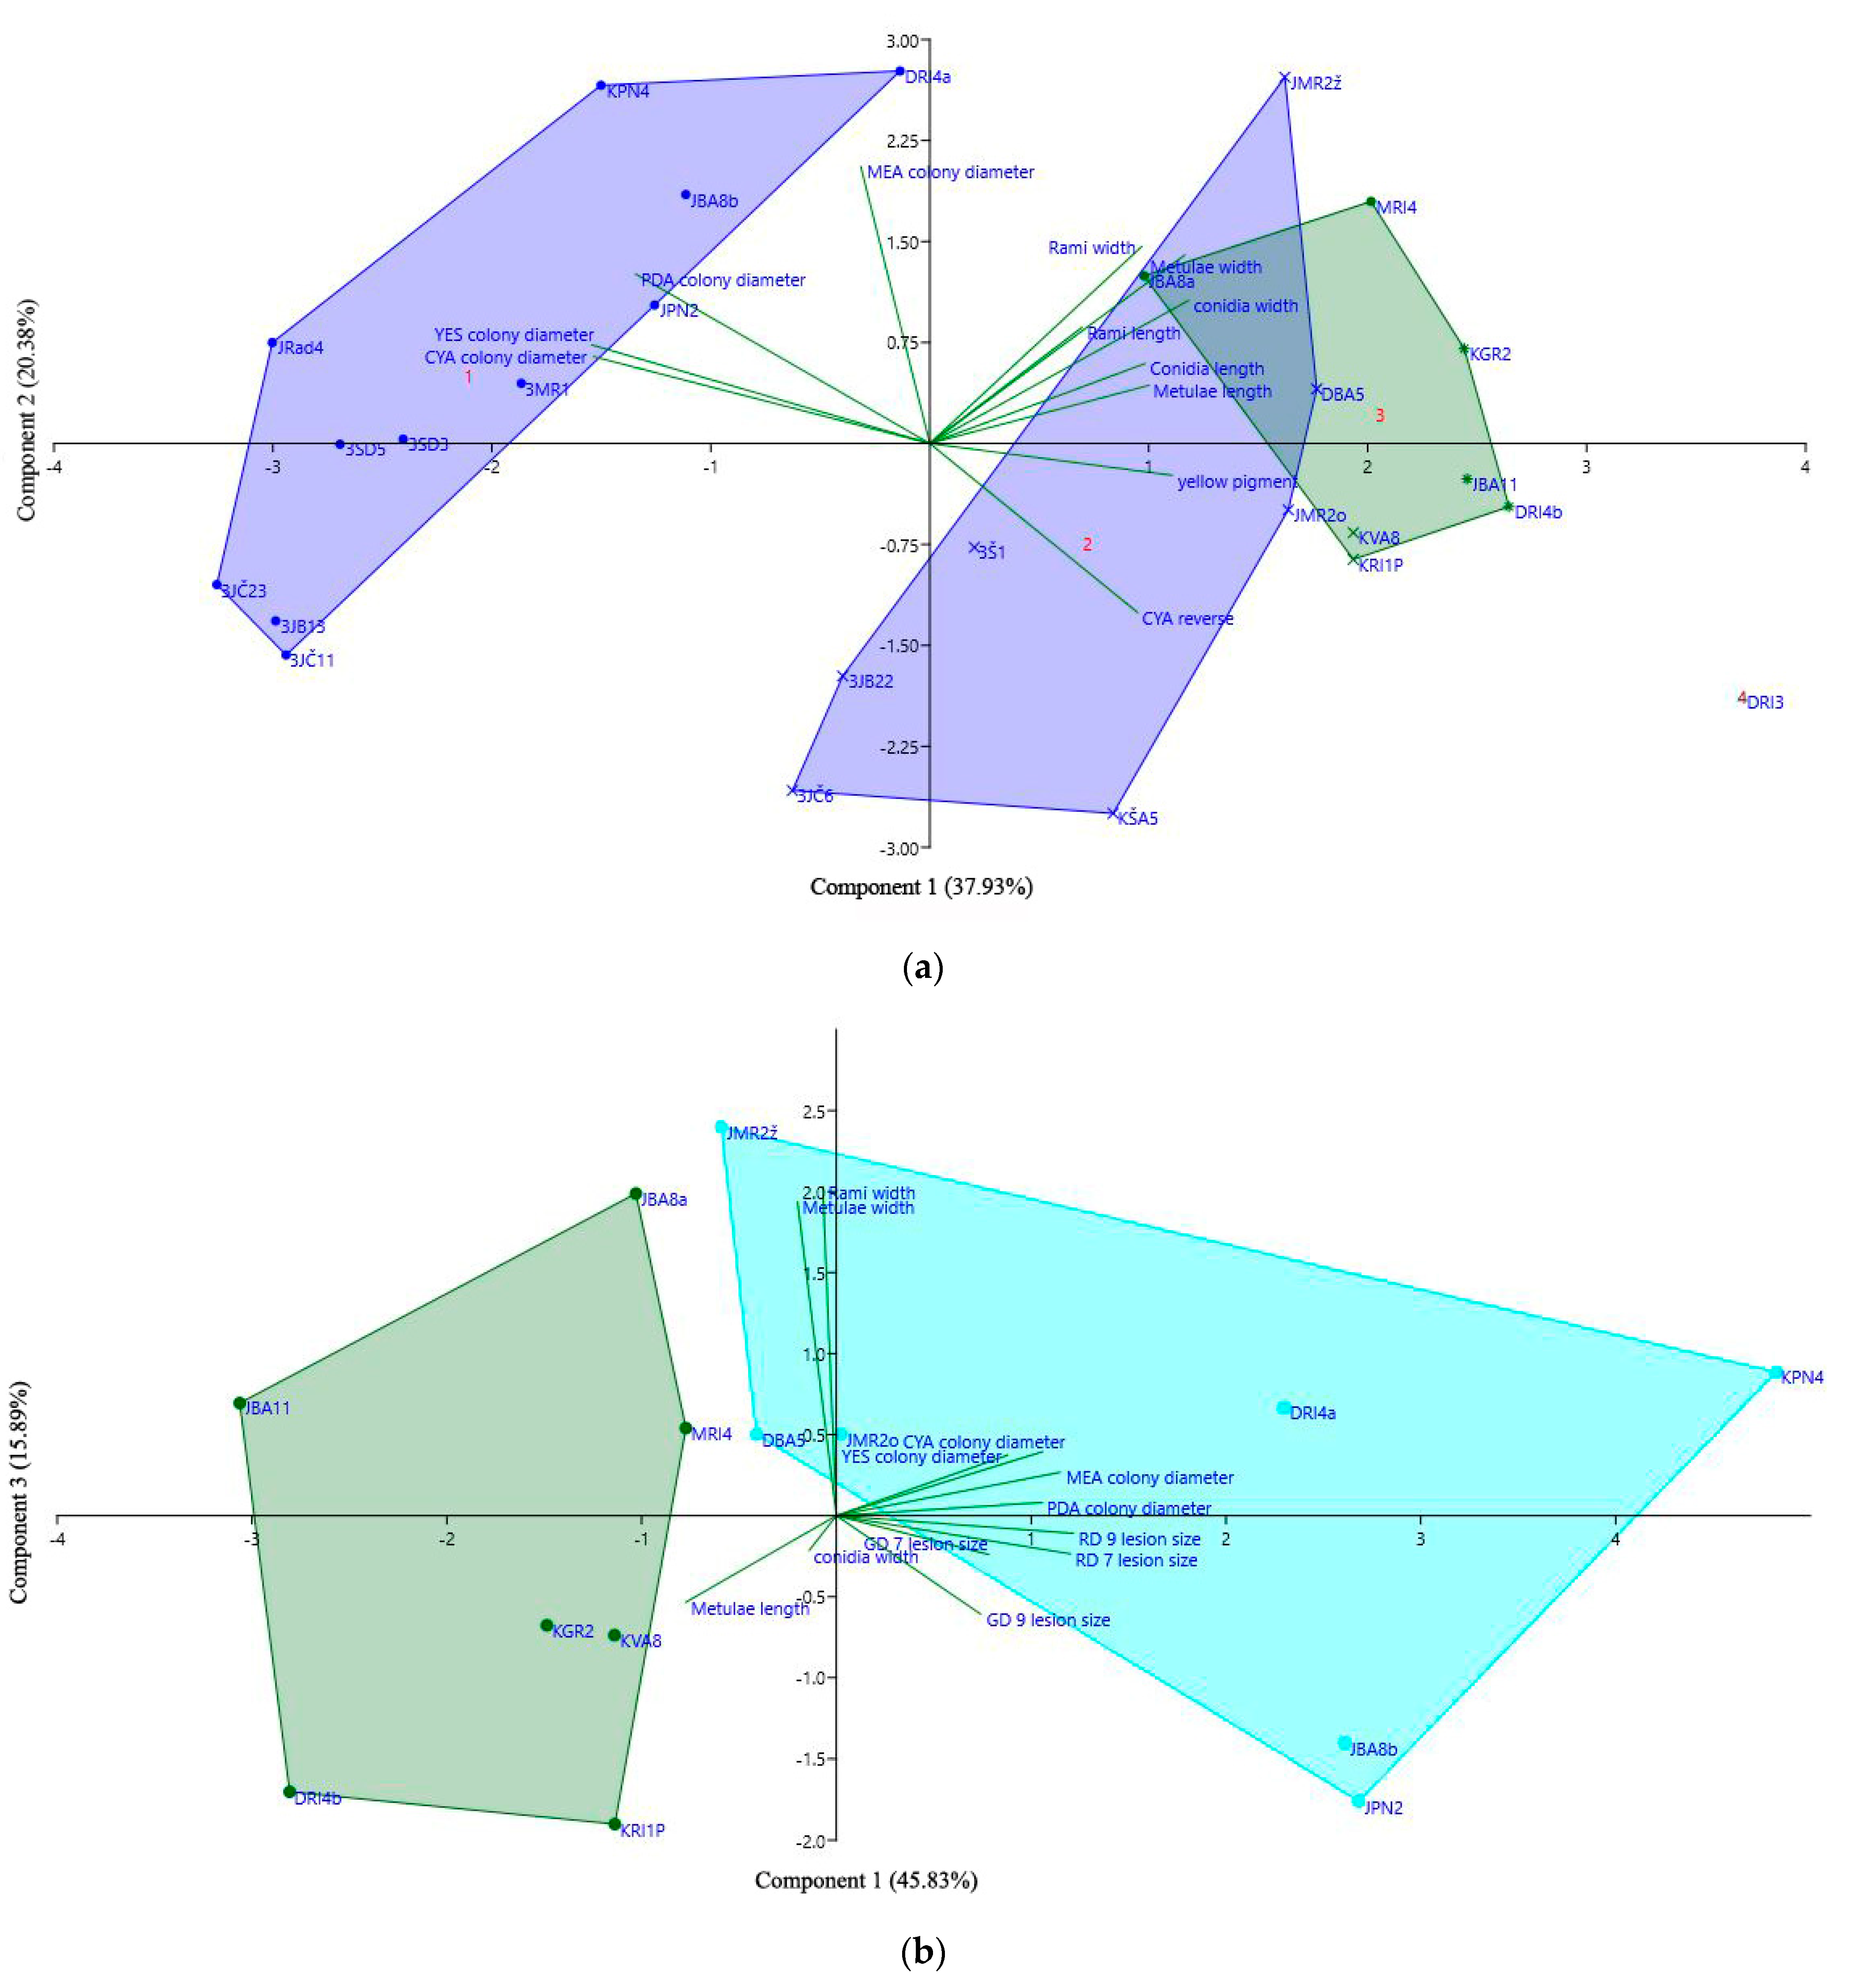
3.9. Principle Component Analysis

PCA analysis separated all 26 tested isolates based on morphological data (micro, macro and growth rate) in three groups (Figure 10a). The total variability of 58.31% was explained by first and second component. Principal component 1 (PC1), accounts for 37.93% of the variance, was mostly positively associated with conidia and metulae width and negatively associated with colony diameter on PDA, CYA and YES. It clearly separates faster growing isolates (left) from those with smaller colonies and with larger conidia or conidiophore parts (right). PC2, which accounts for 20.38% of the variance, is strongly positively associated with colony diameter on MEA and PDA, and metulae width, while is negatively associated with coloration on CYA reverse (red and pink coloration has smaller value than yellow or cream coloration). It separates faster growing isolates firstly on MEA, then on PDA with wider metulae (up) from isolates that have cream or yellow coloration on CYA reverse (down). It also shows the similarity of the second P. expansum group to P. crustosum. Separation of P. expansum isolates into two groups based on morphology was in accordance with phylogenetic separation based on single BenA and CaM loci (Table 5).
PCA analysis grouped 14 representative isolates based on macro- and micromorphology and virulence on ‘Red Delicious’ and ‘Golden Delicious’ at 7 and 9 dpi. The total variability of 61.72% was explained by first and third component. PC1 accounts for 45.83% of the observed variance, and was mostly associated with colony diameter on all tested media, and lesion size on ‘Red Delicious’ at 7 dpi and 9 dpi. It separates more virulent isolates with larger colony growth, from less virulent isolates, which formed smaller colonies. Thus, the majority of P. expansum isolates were distinct from P. crustosum isolates, and were grouped on the right side of the graph, except from two isolates DBA5 and JMR2z. PC3, which accounts for 15.89% of the variance, is strongly and positively associated with metulae and rami width, and separates isolates with wider metulae and rami (up) from isolates that formed narrower metulae and rami (down) (Figure 10b).

4. Discussion

Data regarding the incidence of blue mold decay, diversity of pome fruit hosts, variation in fungal virulence, and distribution of Penicillium spp. causing postharvest rot resulted in confirmatory and novel findings. Penicillium expansum and P. crustosum caused blue mold on stored apple and pears which is congruent with previous studies [20,21,22,23,24,55], while blue mold on quince caused by P. expansum, P. crustosum and P. solitum is a novel find in Serbia. Additionally, P. crustosum has not been identified on medlar nor quince, indicating two new hosts for this blue mold causing species. Occurrence of P. solitum on quince has not been previously reported in the literature, and multiple gaps regarding various pome fruit hosts and causative Penicillium spp. were unknown. Hence, novel discoveries resulted from the comprehensive survey, virulence assessment and accompanying morpho-genetic characterization of Penicillium spp.
Incidence regarding the most common causal agent of blue mold on pomaceus fruit in Serbia showed that P. expansum was most prevalent (91.64%), followed by P. crustosum (7.29%) which were detected on all pome fruit examined, with P. solitum having the lowest occurrence. A survey of apples and pears with blue mold symptoms from Oregon and Washington State showed that several Penicillium spp. (P. auarantiogriseum, P. commune, P. solitum, P. verrucosum, and P. expansum) caused blue mold [14]. Another study conducted in British Columbia showed that P. brevicompactum, P. crustosum, and P. expansum were isolated from apple fruit with blue mold symptoms [15]. In Uruguay, it was found that P. expansum and P. solitum were the main causal agents of apple and pear decay in storage [13]. Our findings mirror what has been shown over different parts of the world regarding Penicillium spp. diversity, and it appears that regardless of geographical location, P. expansum is most prevalent and aggressive of all blue mold fungi obtained from stored pomes. Many factors may underpin P. expansum’s cosmopolitan status including but not limited to: e.g., the pathogens genomic plasticity, its ability to supress, inactivate and overcome preformed and induced host plant defences, deployment of an arsenal of virulence factors, and the biosynthesis of small molecules that aid in decay [56]. Future comparative multiomics investigations with the isolates from this study will be used to ascertain the underlying mechanism(s) that facilitate P. expansum’s broad ranging success as a necrotrophic fungal pathogen.
Penicillium expansum is the most virulent Penicillium species and is well adapted to infect, colonize and decay apple fruit [9]. Our findings agree with Morales et al. [57] that there is low variability in P. expansum’s ability to colonize apple flesh, however variation in some features (e.g., macromorphology and phylogeny) was observed. Also, we support the suggestion of Morales et al. [57] that factors involved in fruit colonization seem to be constant in each P. expansum population. In this study P. expansum was found to be more virulent than P. crustosum on all three apple fruit cultivars, which was also observed in other studies on stored apple and pear fruits [6,14,58]. Differences in P. expansum and P. crustosum virulence in apple could be explained via metabolic flux in the host during the infection process. P. expansum causes more intense and dynamic metabolic changes which helps the pathogen overcome host defenses and results in decreased pools of phenolics and glutathione compared to P. crustosum-mediated decay [59,60]. It is well known that high phenolic content is important for apple fruit defence against blue mold decay [61,62,63]. This difference is also reflected in the array of observed virulence phenotypes in apple fruit conducted during this study. Even though P. crustosum is a less well adapted pathogen compared to P. expansum, it caused decay in apple fruit, and is supported by its ability to abundantly sporulate in the wound. Together, these factors allow P. crustosum to be classified as the second most important Penicillium species found to cause apple fruit decay. However, both P. expansum and P. crustosum were least virulent on ’Granny Smith’ and its hypothesized that this could be due to differences in flavanol and glutathione content, which is higher in this cultivar than others [64,65]. Additionally, a yellow ring surrounding the infected area was primarily observed in ’Granny Smith’ infected with P. crustosum. Interestingly, a similar reaction was observed on immature and commercially mature ‘Golden Delicious’ fruit infected with an incompatible apple fruit pathogen P. digitatum [66]. Both infection and wounding activate H2O2 accumulation to generate high ROS levels which can damage chloroplasts, resulting in the yellow-colored ring, reminiscent of the same phenomenon we observed during our study [67,68].
Since P. expansum and P. crustosum were found to be the most dominant causal agents of blue mold in Serbia, the isolates from different origins were subjected to detailed morphological characterization. We observed that YES was the most favourable media for the growth of both species, which agreed with descriptions for P. expansum and P. crustosum by Pitt and Hocking [69] and Frisvad and Samson [18]. Interestingly, two distinct groups of P. expansum were observed based on colony growth, presence/absence of yellow colony reverse on PDA and MEA, and CYA reverse. The first group had: faster growing colonies, cream reverse on PDA and MEA, and salmon pink to red CYA reverse while the second group had: slower colony growth, yellow reverse on PDA and MEA, and variable colour of CYA colony reverse (yellow, cream or red). Variability and correlation of morphological and genetic characteristics was observed for some other Penicillium species such as P. glabrum. Barreto et al. [70] noted high intraspecific variation of P. glabrum from cork in micro-and macromorphology and extrolite profiles, which was supported by partial β-tubulin and calmodulin sequence analyses. Similarly, variability of P. glabrum isolates from onion bulbs was observed via molecular (BenA), macromorphological and pathogenic characters and these features were correlated [49].
Examination of the Penicillium spp. isolates using multiple loci (ITS, BenA, CaM, RPB2) largely agreed with the morphological findings to reveal three main species of blue mold fungi from four different pome fruit hosts. While several distinct Penicillium spp. were isolated and characterized, we observed the presence of multiple, well supported subgroups for P. expansum based on individual and concatenated loci. Our data show that two well supported subclades, congruent with morphological data, were present for P. expansum via BenA, CaM, and concatenated loci. While the consequence for this observation is unclear, it is possible that P. expansum is undergoing genetic change(s) that accompany the observed morphological differences that function in ecological, biological and or niche specialization. Despite the biological consequence, our findings are congruent with the literature that the BenA is amongst the most stable and of utmost phylogenetic value for Penicillium speciation [50]. Houbraken et al. [42] indicate that subspecific levels such as subspecies, varieties, forma specialis etc. should not be used in a formal taxonomic manner. While their taxonomic value remains debatable, a deeper look into the various subspecies via comparative approaches (e.g., metabolite profiles, genomic organization, and secondary metabolic gene cluster arrangement) will likely yield an abundance of fundamental information to ascertain the biological basis for these observations.
While P. expansum and P. crustosum were the most prevalent blue mold fungi obtained from pome fruits, isolate origin did not impact the observed morphological, genetic and pathogenic features evaluated in the current study. This is in contrast with what Sanzani et al. [71] who showed genetic and morphological variation amongst P. expansum and P. crustosum isolates, based on a single locus BenA, which grouped the isolates based on the origin of the host (confirmed by the High-Resolution Melting). Thus, they proposed that host specialization had occurred amongst the isolates of the same species. However, we didn’t observe this pattern. It is possible that our isolates are not as evolved and or that the isolates from Italian collection possess more genetic variation at loci that mediate outcrossing and or recombination. A detailed genome-wide study conducted by Julca et al. [72] supports our finding in that they showed a relatively high sequence divergence of P. expansum, which did not correlate with the geographical distance between isolates. This indicates that isolates may have diverged a long time ago but that the geographical structure of the populations may have been influenced by migration. P. expansum has the capacity to undergo both meiotic and mitotic recombination and exhibits large genetic diversity, despite its primary asexual mode of reproduction. This is further supported by genome mining studies that show P. expansum is heterothallic. Hence, there is potential that cryptic mating amongst divergent strains may have contributed to the observed patterns of genomic variation [72].
Our two-year survey highlights new morphological, and phylogenetic aspects of Penicillium spp. from stored pome fruits in Serbia, has filled several knowledge gaps, brought forth new findings concerning fungal virulence, and uncovered interesting observations to further explore. Our study showed for the first time that P. crustosum and P. solitum infect quince, and that medlar is a new host of P. crustosum. Additionally, P. expansum is a new pathogen of quince in Serbia. Rigorous phylogenetic and morphological investigations show that there are three species that predominate pome fruit storage and that P. expansum has two distinct phylogenetic subgroups and P. crustosum has three according to various loci. Consistent with previous findings we have shown that in general, P. expansum is the most commonly isolated and aggressive blue mold species followed by P. crustosum and the least prevalent and weakest is P. solitum. Our morphological and phylogenetic findings suggest that P. expansum is changing at multiple levels and we propose future omics-based and functional genetic studies to understand the basis for the observed differences within P. expansum sub-clades.

Supplementary Materials

The following are available online at https://www.mdpi.com/article/10.3390/jof7121019/s1, Table S1: List of Penicillium spp. isolates obtained in this study.

Author Contributions

Conceptualization, A.Ž., N.D., N.V., W.M.J.II, I.V.; methodology, A.Ž., N.D., N.V., W.M.J.II, I.V.; software, A.Ž.; validation, A.Ž., N.D., N.V., W.M.J.II, I.V.; formal analysis, A.Ž., N.D., N.V., W.M.J.II, I.V.; investigation, A.Ž., N.D., N.V., I.V.; resources, N.D., W.M.J.II, I.V.; data curation, A.Ž.; writing—original draft preparation, A.Ž., N.D., N.V., W.M.J.II, I.V.; writing—review and editing, A.Ž., N.D., N.V., W.M.J.II, I.V.; visualization, A.Ž., N.D., N.V., W.M.J.II, I.V.; supervision, N.D., I.V.; project administration, N.D., I.V.; funding acquisition, N.D., W.M.J.II, I.V. All authors have read and agreed to the published version of the manuscript.

Funding

This work was supported by Ministry of Education, Science and Technological Development of the Republic of Serbia (451-03-9/2021-14/ 200116), and in part by base funds provided to USDA-ARS project plan #8042-42430-002-00D entitled “Development of Novel Tools to Manage Fungal Plant Pathogens That Cause Postharvest Decay of Pome Fruit to Reduce Food Waste” under USDA-ARS National Program 303 Plant Diseases.

Institutional Review Board Statement

Not applicable.

Informed Consent Statement

Not applicable.

Data Availability Statement

All relevant data are within the manuscript. Sequence data have been uploaded on Genbank with accession numbers as indicated in Table 1.

Acknowledgments

Mention of trade names or commercial products in this publication is solely for providing specific information and does not imply recommendation or endorsement by the U.S. Department of Agriculture. The authors thank Boris Obrovski for valuable suggestions in statistical analysis and Stefan Pavić for technical assistance with cultural morphology and virulence experiments.

Conflicts of Interest

The authors declare no conflict of interest.

References

  1. Knee, M. Pome fruits. In Biochemistry of Fruit Ripening; Seymour, G.B., Taylor, J.E., Tucker, G.A., Eds.; Springer: Dordrecht, The Netherlands, 1993; p. 325. [Google Scholar]
  2. Errampalli, D. Penicillium expansum (Blue Mould). In Postharvest Decay, Control Strategies; Bautista-Banos, S., Ed.; Elsevier: London, UK, 2004; pp. 190–191. [Google Scholar]
  3. Kim, Y.K.; Xiao, C.L. Distribution and incidence of Sphaeropsis rot in apple in Washington State. Plant Dis. 2008, 92, 940–946. [Google Scholar] [CrossRef] [PubMed] [Green Version]
  4. Rosenberger, D.A.; Engle, C.A.; Meyer, F.W.; Watkins, C.B. Penicillium expansum invades apples through stems during controlled atmosphere storage. Plant Health Prog. 2006, 7, 1. [Google Scholar] [CrossRef]
  5. Amiri, A.; Bompeix, B. Diversity and population dynamics of Penicillium spp. on apples in pre- and postharvest environments: Consequences for decay development. Plant Pathol. 2005, 54, 74–81. [Google Scholar] [CrossRef]
  6. Louw, J.P.; Korsten, L. Pathogenic Penicillium spp. on apple and pear. Plant Dis. 2014, 98, 590–598. [Google Scholar] [CrossRef] [Green Version]
  7. Scholtz, I.; Korsten, L. Profile of Penicillium species in the pear supply chain. Plant Pathol. 2016, 65, 1126–1132. [Google Scholar] [CrossRef] [Green Version]
  8. Sutton, T.B.; Aldwinckle, A.; Agnello, A.M.; Walgenbach, J.F. Compendium of Apple and Pear Diseases and Pests, 2nd ed.; APS Press: St. Paul, MN, USA, 2014. [Google Scholar]
  9. Jurick II, W.M.; Cox, K.D. Pre and postharvest fungal apple diseases. In Achieving Sustainable Apple Production; Evans, K., Ed.; Burleigh Dodds Science Publishing: Cambridge, UK, 2016. [Google Scholar]
  10. Xiao, C.L.; Boal, R.J. Residual activity of fludioxonil and pyrimethanil against Penicillium expansum on apple fruit. Plant Dis. 2009, 93, 1003–1008. [Google Scholar] [CrossRef] [Green Version]
  11. Rosenberger, D.A. Blue mold. In Compendium of Apple and Pear Diseases; Sutton, T.B., Aldwinkle, H.S., Angello, A.M., Walgenbach, J.F., Eds.; APS Press: St. Paul, MN, USA, 2014; p. 76. [Google Scholar]
  12. van der Walt, L.; Spotts, R.A.; Visagie, C.M.; Jacobs, K.; Smit, F.J.; McLeod, A. Penicillium species associated with preharvest wet core rot in South Africa and their pathogenicity on apple. Plant Dis. 2010, 94, 666–675. [Google Scholar] [CrossRef] [Green Version]
  13. Pianzzola, M.J.; Moscatelli, M.; Vero, S. Characterization of Penicillium isolates associated with blue mold on apple in Uruguay. Plant Dis. 2004, 88, 23–28. [Google Scholar] [CrossRef] [Green Version]
  14. Sanderson, P.G.; Spotts, R.A. Postharvest decay of winter pear and apple fruit caused by species of Penicillium. Phytopathology 1995, 85, 103–110. [Google Scholar] [CrossRef]
  15. Sholberg, P.L.; Haag, P.D. Incidence of postharvest pathogens of stored apples in British Columbia. Can. J. Plant Pathol. 1996, 18, 81–85. [Google Scholar] [CrossRef]
  16. Sharma, Y.P.; Sumbali, G. Unrecorded post-harvest fungal rot of quince fruits from India. Natl. Acad. Sci. Lett. 1997, 20, 35–37. [Google Scholar]
  17. Jurick II, W.M.; II Vico, I.; Gaskins, V.L.; Garrett, W.M.; Whitaker, B.D.; Janisiewicz, W.J.; Conway, W.S. Purification and biochemical characterization of polygalacturonase produced by Penicillium expansum during postharvest decay of ‘Anjou’ pear. Phytopathology 2010, 100, 42–48. [Google Scholar] [CrossRef] [Green Version]
  18. Frisvad, J.C.; Samson, R.A. Polyphasic taxonomy of Penicillium subgenus Penicillium. A guide to identification of food and air-borne terverticillate Penicillia and their mycotoxins. Stud. Mycol. 2004, 49, 1–174. [Google Scholar]
  19. Food and Agriculture Organization. FAOstat. World Agriculture Statistics Data Base. 2021. Available online: http://www.fao.org/faostat/en/#data/QC (accessed on 24 April 2021).
  20. Vico, I.; Duduk, N.; Vasić, M.; Nikolić, M. Identification of Penicillium expansum causing postharvest blue mold decay of apple fruit. Pestic. Fitomed. 2014, 29, 257–266. [Google Scholar] [CrossRef]
  21. Vico, I.; Gaskins, V.; Duduk, N.; Vasić, M.; Yu, J.J.; Peter, K.A.; Jurick II, W.M. First report of Penicillium crustosum causing blue mold on stored apple fruit in Serbia. Plant Dis. 2014, 98, 1430. [Google Scholar] [CrossRef] [PubMed]
  22. Babović, M.; Perišić, M.; Marković, S.; Stojanović, S.; Pantelić, Z. Investigation on rot of apple fruits in cold storehouse. Zaštita Bilja 1979, 147, 83–87. [Google Scholar]
  23. Perišić, M.M. Penicillium expansum, the cause of soft rot of apple fruits. Jugosl. Voćarstvo 1972, 21/22, 843–846. [Google Scholar]
  24. Stošić, S.; Ristić, D.; Savković, Ž.; Ljaljević-Grbić, M.; Vukojević, J.; Živković, S. Penicillium and Talaromyces species as postharvest pathogens of pear fruit (Pyrus communis L.) in Serbia. Plant Dis. 2021. [Google Scholar] [CrossRef]
  25. Jurick, W.M.; Vico, I.; McEvoy, J.L.; Whitaker, B.D.; Janisiewicz, W.; Conway, W.S. Isolation, purification, and characterization of a polygalacturonase produced in Penicillium solitum-decayed ‘Golden Delicious’ apple fruit. Phytopathology 2009, 99, 636–641. [Google Scholar] [CrossRef] [Green Version]
  26. Quaglia, M.; Ederli, L.; Pasqualini, S.; Zazzerini, A. Biological control agents and chemical inducers of resistance for postharvest control of Penicillium expansum Link. on apple fruit. Posthar. Biol. Technol. 2011, 59, 307–315. [Google Scholar] [CrossRef]
  27. Day, J.P.; Shattock, R.C. Aggressiveness and other factors relating to displacement of populations of Phytophthora infestans in England and Wales. Eur. J. Plant Pathol. 1997, 103, 379–391. [Google Scholar] [CrossRef]
  28. Marek, P.; Annamalai, Y.; Venkitanarayanan, K. Detection of Penicillium expansum by polymerase chain reaction. Int. J. Food Microbiol. 2003, 89, 139–144. [Google Scholar] [CrossRef]
  29. White, T.J.; Bruns, T.; Lee, S.; Taylor, J. Amplification and direct sequencing of fungal ribosomal RNA genes for phylogenetics. In PCR Protocols: A Guide to Methods and Applications; Innis, M.A., Gelfand, D.H., Sninsky, J.J., White, T.J., Eds.; Academic Press: San Diego, CA, USA, 1990; pp. 315–322. [Google Scholar]
  30. Glass, N.L.; Donaldson, G.C. Development of premier sets designed for use with the PCR to amplify conserved genes from filamentous Ascomycetes. Appl. Environ. Microbiol. 1995, 61, 1323–1330. [Google Scholar] [CrossRef] [PubMed] [Green Version]
  31. Hong, S.-B.; Cho, H.-S.; Shin, H.-D.; Frisvad, J.C.; Samson, A. Novel Neosartorya species isolated from soil in Korea. Int. J. Syst. Evol. Microbiol. 2006, 56, 477–486. [Google Scholar] [CrossRef] [Green Version]
  32. Liu, Y.J.; Whelen, S.; Hall, B.D. Phylogenetic relationships among ascomycetes: Evidence from an RNA polymerse II subunit. Mol. Biol. Evol. 1999, 16, 1799–1808. [Google Scholar] [CrossRef]
  33. Visagie, C.M.; Houbraken, J.; Frisvad, J.C.; Hong, S.-B.; Klaassen, C.H.W.; Perrone, G.; Seifert, K.A.; Varga, J.; Yaguchi, T.; Samson, R.A. Identification and nomenclature of the genus Penicillium. Stud. Mycol. 2014, 78, 343–371. [Google Scholar] [CrossRef] [Green Version]
  34. Staden, R.; Beal, K.F.; Bonfield, J.K. The Staden package, 1998. Methods Mol. Biol. 2000, 132, 115–130. [Google Scholar] [PubMed]
  35. Thompson, J.D.; Gibson, T.J.; Plewniak, F.; Jeanmougin, F.; Higgins, D.G. The Clustal X windows interface: Flexible strategies for multiple sequence alignment aided by quality analysis tools. Nucleic Acids Res. 1997, 25, 4876–4882. [Google Scholar] [CrossRef] [Green Version]
  36. Kumar, S.; Stecher, G.; Li, M.; Knyaz, C.; Tamura, K. MEGAX: Molecular evolutionary genetics analysis across computing platforms. Mol. Biol. Evol. 2018, 35, 1547–1549. [Google Scholar] [CrossRef]
  37. Lund, F. Differentiating Penicillium species by detection of indole metabolites using a filter paper method. Lett. App. Microbiol. 1995, 20, 228–231. [Google Scholar] [CrossRef]
  38. Tabachnick, B.G.; Fidell, L.S. Using Multivariate Statistic; Pearson Education: Boston, MA, USA, 2007. [Google Scholar]
  39. Stevens, J. Applied Multivariate Statistics for the Social Sciences; Lawrence Erlbaum: Mahwah, NJ, USA, 1996. [Google Scholar]
  40. Cohen, J. Statistical Power Analysis for the Behavioral Sciences; Routledge Academic: New York, NY, USA, 1988. [Google Scholar]
  41. Hammer, Ø.; Harper, D.A.T.; Ryan, P.D. PAST: Paleontological statistics software package for education and data analysis. Palaeontol. Electron. 2001, 4, 9. [Google Scholar]
  42. Houbraken, J.; Kocsubé, S.; Visagie, C.M.; Yilmaz, N.; Wang, X.-C.; Meijer, M.; Kraak, B.; Hubka, V.; Samson, R.A.; Frisvad, J.C. Classification of Aspergillus, Penicillium, Talaromyces and related genera (Eurotiales): An overview of families, genera, subgenera, sections, series and species. Stud. Mycol. 2020, 95, 5–169. [Google Scholar] [CrossRef]
  43. Houbraken, J.; Wang, L.; Lee, H.B.; Frisvad, J.C. New sections in Penicillium containing novel species producing patulin, pyripyropens or other bioactive compounds. Persoonia 2016, 36, 299–314. [Google Scholar] [CrossRef] [Green Version]
  44. Strausbaugh, K. Incidence, distribution, and pathogenicity of fungi causing root rot in Idaho long-term sugar beet storage piles. Plant Dis. 2018, 102, 2296–2307. [Google Scholar] [CrossRef] [PubMed] [Green Version]
  45. Prencipe, S.; Siciliano, I.; Gatti, C.; Garibaldi, A.; Lodovica Gullino, M.; Botta, R.; Spadaro, D. Several species of Penicillium isolated from chestnut flour processing are pathogenic on fresh chestnuts and produce mycotoxins. Food Microbiol. 2018, 76, 396–404. [Google Scholar] [CrossRef] [PubMed]
  46. Lorenzini, M.; Cappello, M.S.; Logrieco, A.; Zapparol, G. Polymorphism and phylogenetic species delimitation in filamentous fungi from predominant mycobiota in withered grapes. Int. J. Food Microbiol. 2016, 238, 56–62. [Google Scholar] [CrossRef]
  47. Prodromou, I.; Thomidis, T.; Zambounis, A. First report of Penicillium expansum (Link) Thom. causing postharvest fruit rot of kiwifruit in Northern Greece. Plant Dis. 2018, 102, 1851. [Google Scholar] [CrossRef]
  48. Visagie, C.M.; Houbraken, J.; Dijksterhuis, J.; Seifert, K.A.; Jacobs, K.; Samson, R.A. A taxonomic review of Penicillium species producing conidiophores with solitary phialides, classified in section Torulomyces. Persoonia 2016, 36, 134–155. [Google Scholar] [CrossRef] [Green Version]
  49. Duduk, N.; Lazarević, M.; Žebeljan, A.; Vasić, M.; Vico, I. Blue mold decay of stored onion bulbs caused by Penicillium polonicum, P. glabrum and P. expansum. J. Phytopathol. 2017, 165, 662–669. [Google Scholar] [CrossRef]
  50. Samson, R.A.; Seifert, K.A.; Kuijpers, A.F.A.; Houbraken, J.; Frisvad, J.C. Phylogenetic analysis of Penicillium subgenus Penicillium using partial β-tubulin sequences. Stud. Mycol. 2004, 49, 175–200. [Google Scholar]
  51. Vu, D.; Groenewald, M.; de Vries, M.; Gehrmann, T.; Stielow, B.; Eberhardt, U.; Al-Hatmi, A.; Groenewald, J.Z.; Cardinali, G.; Houbraken, J.; et al. Large-scale generation and analysis of filamentous fungal DNA barcodes boosts coverage for kingdom fungi and reveals thresholds for fungal species and higher taxon delimitation. Stud. Mycol. 2019, 92, 1–20. [Google Scholar] [CrossRef] [PubMed]
  52. Visagie, C.M.; Yilmaz, N.; Vanderwolf, K.; Renaud, J.B.; Sumarah, M.W.; Houbraken, J.; Assebgui, R.; Seifert, K.A.; Malloch, D. Penicillium diversity in Canadian bat caves, including a new species, P. speluncae. Fungal Systemat. Evol. 2020, 5, 1–15. [Google Scholar] [CrossRef] [PubMed]
  53. Duduk, N.; Bekčić, F.; Žebeljan, A.; Vučković, N.; Vico, I. First report of blue mold caused by Penicillium crustosum on nectarine fruit in Serbia. Plant Dis. 2020, 105, 487. [Google Scholar] [CrossRef]
  54. Houbraken, J.; Frisvad, J.C.; Seifert, K.A.; Overy, D.P.; Tuthill, D.M.; Valdez, J.G.; Samson, R.A. New penicillin-producing Penicillium species and an overview of section Chrysogena. Persoonia 2012, 29, 78–100. [Google Scholar] [CrossRef] [Green Version]
  55. Farr, D.F.; Rossman, A.Y. Fungal Databases. U.S. National Fungus Collections, Agricultural Research Service, U.S. Department of Agriculture. Available online: https://nt.ars-grin.gov/fungaldatabases/ (accessed on 19 November 2021).
  56. Luciano-Rosario, D.; Keller, N.P.; Jurick, W.M. Penicillium spp.: Biology, omics, and management tools for a global postharvest pathogen causing blue mold of pome fruit. Mol. Plant Pathol. 2020, 21, 1391–1404. [Google Scholar] [CrossRef] [PubMed]
  57. Morales, H.; Marín, S.; Obea, L.; Patiño, B.; Doménech, M.; Ramos, A.J.; Sanchis, V. Ecophysiological characterization of Penicillium expansum population in lleida (Spain). Int. J. Food Microbiol. 2008, 122, 243–252. [Google Scholar] [CrossRef]
  58. Lichtner, F.J.; Gaskins, V.L.; Cox, K.D.; Jurick, W.M. Global transcriptomic responses orchestrate difenoconazole resistance in Penicillium spp. causing blue mold of stored apple fruit. BMC Genom. 2020, 21, 1–15. [Google Scholar] [CrossRef] [PubMed]
  59. Žebeljan, A.; Vico, I.; Duduk, N.; Žiberna, B.; Urbanek Krajnc, A. Dynamic changes in common metabolites and antioxidants during Penicillium expansum-apple fruit interactions. Physiol. Mol. Plant Pathol. 2019, 106, 166–174. [Google Scholar] [CrossRef]
  60. Žebeljan, A.; Vico, I.; Duduk, N.; Žiberna, B.; Urbanek Krajnc, A. Profiling changes in primary metabolites and antioxidants during apple fruit decay caused by Penicillium crustosum. Physiol. Mol. Plant Pathol. 2021, 113, 101586. [Google Scholar] [CrossRef]
  61. Sun, J.; Janisiewicz, W.J.; Nichols, B.; Jurick, W.M.; Chen, P. Composition of phenolic compounds in wild apple with multiple resistance mechanisms against postharvest blue mold decay. Posthar. Biol. Technol. 2017, 127, 68–75. [Google Scholar] [CrossRef] [Green Version]
  62. Ahmadi-Afzadi, M.; Nybom, H.; Ekholm, A.; Tahir, I.; Rumpunen, K. Biochemical contents of apple peel and flesh affect level of partial resistance to blue mold. Posthar. Biol. Technol. 2015, 110, 173–182. [Google Scholar] [CrossRef]
  63. Schovankova, J.; Opatova, H. Changes in phenols composition and activity of phenylalanine-ammonia lyase in apples. Hortic. Sci. 2011, 38, 1–10. [Google Scholar] [CrossRef] [Green Version]
  64. Čebulj, A.; Cunja, V.; Mikulič-Petkovšek, M.; Veberič, R. Importance of metabolite distribution in apple fruit. Hortic. Sci. 2017, 214, 214–220. [Google Scholar] [CrossRef]
  65. Lata, B.; Trampczynska, A.; Paczesna, J. Cultivar variation in apple peel and whole fruit phenolic composition. Hortic. Sci. 2009, 121, 176–181. [Google Scholar] [CrossRef]
  66. Vilanova, L.; Teixido, N.; Torres, R.; Usall, J.; Vinas, I. The infection capacity of P. expansum and P. digitatum on apples and histochemical analysis of host response. Int. J. Food Microbiol. 2012, 157, 360–367. [Google Scholar] [PubMed]
  67. Buron-Moles, G.; Torres, R.; Teixido, N.; Usall, J.; Vilanova, L.; Vinas, I. Characterisation of H2O2 production to study compatible and non-host pathogen interactions in orange and apple fruit at different maturity stages. Posthar. Biol. Technol. 2015, 99, 27–36. [Google Scholar] [CrossRef]
  68. Su, J.; Tu, K.; Cheng, L.; Tu, S.; Wang, M.; Xu, H.; Zhan, G. Wound-induced H2O2 and resistance to Botrytis cinerea decline with the ripening of apple fruit. Posthar. Biol. Technol. 2011, 62, 64–70. [Google Scholar] [CrossRef]
  69. Pitt, J.I.; Hocking, A.D. Fungi and Food Spoilage; Springer: New York, NY, USA, 2009. [Google Scholar]
  70. Barreto, M.C.; Houbraken, J.; Samson, R.A. Taxonomic studies of the Penicillium glabrum complex and the description of a new species P. subericola. Fungal Divers. 2011, 49, 23–33. [Google Scholar] [CrossRef] [Green Version]
  71. Sanzani, S.M.; Montemurro, C.; Di Rienzo, V.; Solfrizzo, M.; Ippolito, A. Genetic structure and natural variation associated with host of origin in Penicillium expansum strains causing blue mould. Int. J. Food Microbiol. 2013, 165, 111–120. [Google Scholar] [CrossRef]
  72. Julca, I.; Droby, S.; Sela, N.; Marcet-Houben, M.; Gabaldon, T. Contrasting genomic diversity in two closely related postharvest pathogens: Penicillium digitatum and Penicillium expansum. Genome Biol. Evol. 2015, 8, 218–227. [Google Scholar] [CrossRef] [PubMed] [Green Version]
Figure 1. Map of Serbia showing different locations where Penicillium spp. isolates from pome fruits were obtained.
Jof 07 01019 g001
Figure 2. Blue mold on pome fruits: apple (1), pear (2), quince (3), and medlar (4) inoculated with representative isolates of P. expansum (A), P. solitum (B), P. crustosum (C), and uninoculated control (D).
Jof 07 01019 g002
Figure 3. Colony characteristics (a) and colony reverse (b) of representative Penicillium expansum (A—group I, B—group II), P. crustosum (C), and P. solitum (D) isolates on different media (PDA, MEA, CYA, and YES) 7 dpi at 24 ± 2 °C.
Jof 07 01019 g003
Figure 4. Dendogram showing the grouping of Penicillium expansum isolates based on colony diameter on different media (PDA, MEA, CYA, and YES), reverse on PDA and MEA (cream or yellow), and CYA reverse characteristics, using Ward’s model with Euclidian Distance interval. P. expansum isolates within a clade are indicated in black boxes.
Jof 07 01019 g004
Figure 5. Dendogram showing grouping of Penicillium crustosum isolates based on colony diameter on different media (PDA, MEA, CYA, and YES), using Ward’s model with Euclidian Distance interval. P. crustosum isolates within a clade are indicated in black boxes.
Jof 07 01019 g005
Figure 6. Phylogenetic relationships amongst Penicillium expansum, P. crustosum, and P. solitum based on ITS, BenA, CaM, and RPB2. Bootstrap values larger than 60 of the Maximum Likelihood (ML) and Maximum Parsimony (MP) analysis are shown above or below the branches. The tree is rooted with Penicillium lanosocoeruleum as an outgroup. Numbers on the branches present bootstrap values obtained for 1000 replicates. Bolded isolates are reference isolates, and bolded isolates with * are ex-type isolates.
Jof 07 01019 g006
Figure 7. Phylogenetic relationships amongst Penicillium expansum, P. crustosum, and P. solitum based on three (BenA, CaM, and RPB2) (a) and four loci (ITS, BenA, CaM, and RPB2) (b). Bootstrap values larger than 60 of the Maximum Likelihood (ML) and Maximum Parsimony (MP) analysis are shown above or below the branches. The tree is rooted with Penicillium lanosocoeruleum as an outgroup. Numbers on the branches present bootstrap values obtained for 1000 replicates. Bolded isolates are reference isolates, and bolded isolates with * are ex-type isolates.
Jof 07 01019 g007
Figure 8. Blue mold decay caused by Penicillium expansum (A), P. crustosum (B), and P. solitum (C) on different apple fruit cvs. 9 dpi at 24 ± 2 °C and control (D).
Jof 07 01019 g008
Figure 9. Penicillium expansum and P. crustosum mean lesion diameter (mm ± SE) on inoculated apple fruit ‘Golden Delicious’, ‘Red Delicious’ and ‘Granny Smith’ at 7 dpi (a) and 9 dpi (b). Numbers with different letters represent significant difference in lesion diameter amongst species according to Tukey HSD test (p < 0.01).
Jof 07 01019 g009
Figure 10. Projection of Penicillium expansum and P. crustosum isolates based on: (a) first and second principal component, according to principal component analysis (PCA) of isolate characteristics (micro, macromorphology, and colony growth). P. expansum isolate groups are purple, while P. crustosum isolate group is green (DRI3 is P. solitum isolate); (b) first and third principal component, according to principal component analysis (PCA) of isolate characteristics (micro, macromorphology, colony growth, and virulence). P. expansum isolate group is turquoise, while P. crustosum isolate group is green.
Jof 07 01019 g010
Table 2. Haplotype analysis of Penicillium expansum and P. crustosum isolates.
SequencePosition
Penicillium expansum
BenA232260
I variantTC
II variantGT
CaM79154356
I variantTCA
II variantCTG
RPB21391513253403734545207608418548899439589791036
I variantCAGTGCTCTCTGACC
II variantTGACATCTCCCACTT
III variantCAGTGCTCTTTGACC
Penicillium crustosum
CaM303337414
I variantCAT
II variant-G-
RPB2175724940979
I variantTCAC
II variantTCCT
III variantTTCC
IV variantCTCC
Gray background represents differences amongst variants.
Table 3. Colony diameter of Penicillium, expansum, P. crustosum and P. solitum isolates on different media 7 dpi, in the dark at 24 ± 2 °C.
IsolateColony Diameter on Different Culture Media
(mm ± Standard Deviation)
PDAMEACYAYES
Penicillium expansum
JRad447.00 ± 0.97f *37.22 ± 0.73hi48.72 ± 1.25h51.31 ± 1.21d–f
3JC1142.69 ± 0.86d–f30.67 ± 1.08b–d44.18 ± 1.59d–g49.71 ± 1.78c–f
3JC2345.81 ± 1.02ef31.58 ± 0.69c–e43.09 ± 1.10c–f52.44 ± 0.63ef
3JB1340.58 ± 0.81b–e29.42 ± 1.48a–c46.13 ± 1.09e–h50.53 ± 0.85d–f
3SD343.85 ± 1.26d–f31.06 ± 0.97c–e46.94 ± 1.57f–h51.69 ± 1.14d–f
3SD543.92 ± 0.97d–f30.72 ± 0.89b–d46.34 ± 1.66e–h53.28 ± 1.17f
3MR144.83 ± 1.20d–f32.08 ± 1.03de47.73 ± 1.02gh49.10 ± 1.54b–f
JBA8b43.47 ± 7.05d–f36.69 ± 2.12gh44.39 ± 6.26e–h49.64 ± 9.88c–f
JPN243.92 ± 7.85d–f37.89 ± 1.92hi42.42 ± 5.53b–e48.39 ± 8.64b–f
KPN444.56 ± 8.03d–f39.03 ± 3.58i44.50 ± 5.96e–h48.89 ± 8.77b–f
DRI4a44.91 ± 7.60d–f37.50 ± 2.81–i45.14 ± 6.31e–h50.21 ± 8.46d–f
3JC636.77 ± 0.87a–c27.33 ± 0.49a46.22 ± 0.86e–h49.31 ± 1.01b–f
3JB2239.33 ± 1.42b–d28.64 ± 1.41ab38.69 ± 0.67a–c45.00 ± 2.61b–d
3S132.92 ± 1.62a36.38 ± 1.50gh42.47 ± 0.63b–e48.03 ± 1.47b–f
KSA536.64 ± 0.70ab27.25 ± 0.46a38.36 ± 1.12ab42.50 ± 1.72ab
JMR2o35.03 ± 4.24ab32.06 ± 1.03de38.39 ± 3.21ab37.53 ± 2.17a
JMR2z42.41 ± 6.47c–f34.75 ± 2.06fg39.94 ± 2.43a–d45.72 ± 6.56b–e
DBA536.78 ± 4.56a–c33.17 ± 1.20ef36.28 ± 2.15a43.00 ± 5.54a–c
Avg.41.45 ± 5.76b **32.94 ± 4.00b43.17 ± 4.75c48.03 ± 6.25c
Penicillium crustosum
JBA8a39.58 ± 5.18a35.03 ± 2.27c43.81 ± 5.99b47.19 ± 8.38ab
JBA1136.38 ± 3.09a30.39 ± 1.12a36.00 ± 2.54a41.61 ± 5.13ab
KGR238.36 ± 2.84a32.39 ± 1.36ab39.13 ± 6.09ab44.09 ± 6.19ab
KRI1P38.97 ± 2.61a31.34 ± 1.57ab38.69 ± 3.28ab40.92 ± 4.72a
KVA837.91 ± 3.37a31.64 ± 1.60ab38.92 ± 3.79ab41.58 ± 5.12ab
DRI4b37.71 ± 3.07a33.25 ± 1.40bc35.53 ± 1.69a41.44 ± 4.35ab
MRI439.71 ± 4.10a35.26 ± 2.48c40.53 ± 5.64ab48.47 ± 8.46b
Avg.38.39 ± 3.64b32.77 ± 2.45b38.90 ± 5.05b43.51 ± 6.67b
Penicillium solitum
DRI328.02 ± 0.50a24.31 ± 0.68a29.75 ± 0.69a34.53 ± 1.22a
* Numbers with different letters represent a statistically significant difference in colony diameter within isolates of the same species per media according to Tukey HSD test (p < 0.01). ** Bolded numbers with different letters represent significant difference in colony diameter among species per media according to Tukey HSD test (p < 0.01).
Table 4. Micromorphology of Penicillium expansum, P. crustosum and P. solitum isolates.
IsolateAverage Size (µm ± Standard Deviation)
ConidiaPhialidesMetulaeRami
LengthWidthLengthWidthLengthWidthLengthWidth
Penicillium expansum
JRad43.25 ± 0.25c–e *2.72 ± 0.19bc9.74 ± 1.38ab2.84 ± 0.55a–d12.72 ± 2.41a–e3.35 ± 0.59a–e19.64 ± 4.20a–c3.67 ± 0.63ab
3JC113.13 ± 0.30a–d2.56 ± 0.26ab10.06 ± 0.91a–d2.85 ± 0.34a–d11.63 ± 1.46a3.19 ± 0.38ab18.61 ± 2.10a–c3.58 ± 0.43a
3JC233.13 ± 0.24a–d2.52 ± 0.18a9.09 ± 1.35a2.89 ± 0.53a–e11.99 ± 2.65a–c3.23 ± 0.68a–c16.67 ± 3.51a3.78 ± 0.77ab
3JB133.00 ± 0.22ab2.52 ± 0.19a9.82 ± 0.77ab2.69 ± 0.28a–c12.94 ± 1.83a–e3.27 ± 0.36a–d19.58 ± 2.77a–c3.56 ± 0.39a
3SD33.05 ± 0.22a–c2.54 ± 0.21ab9.65 ± 1.05ab2.74 ± 0.39a–d12.77 ± 3.19a–e3.56 ± 0.72a-g18.55 ± 4.15a–c4.15 ± 0.68a–c
3SD52.96 ± 0.23a2.56 ± 0.20ab10.13 ± 1.21b–d2.97 ± 0.40b-e11.81 ± 2.09ab3.78 ± 0.76e-h17.83 ± 3.16a–c4.10 ± 0.64a–c
3MR13.16 ± 0.29a-d2.56 ± 0.21ab10.48 ± 1.11b–d2.92 ± 0.37b-e13.51 ± 1.76c–e3.51 ± 0.37a-f24.65 ± 5.84d3.74 ± 0.39ab
JBA8b3.22 ± 0.24b-e2.98 ± 0.24de9.86 ± 1.11a–c3.03 ± 0.39d–f14.30 ± 2.26e3.64 ± 0.54b-g20.45 ± 4.33a-d4.01 ± 0.64a–c
JPN23.25 ± 0.31c–e2.80 ± 0.22cd10.36 ± 1.35b–d2.98 ± 0.36c–e13.50 ± 1.96b-e3.67 ± 0.43c–h19.39 ± 4.75a–c3.83 ± 0.63ab
KPN43.27 ± 0.37c–e2.98 ± 0.30de10.91 ± 1.46d3.20 ± 0.35ef14.01 ± 2.51e3.96 ± 0.53fgh22.02 ± 4.64cd4.17 ± 0.56a–c
DRI4a3.61 ± 0.39f3.22 ± 0.30f9.75 ± 1.38ab3.03 ± 0.44d–f13.62 ± 2.06c–e3.91 ± 0.65fgh18.91 ± 3.56a–c4.23 ± 0.45bc
3JC63.56 ± 0.27f2.99 ± 0.29e10.27 ± 1.05b–d2.57 ± 0.27a11.29 ± 1.18a3.13 ± 0.47a17.89 ± 2.26a–c3.58 ± 0.54a
3JB223.10 ± 0.24a–d2.47 ± 0.17a10.33 ± 1.02b–d2.64 ± 0.38ab13.84 ± 2.38de3.58 ± 0.77a–g19.91 ± 4.39a–c3.83 ± 0.81ab
3S12.93 ± 0.29a2.48 ± 0.23a10.39 ± 1.79b–d2.97 ± 0.44b–e12.79 ± 2.09a–e3.69 ± 0.77d–h20.92 ± 3.60b–d4.15 ± 0.94a–c
KSA53.32 ± 0.29de2.63 ± 0.19ab10.24 ± 1.32b–d2.79 ± 0.32a–d12.63 ± 1.76a–e3.36 ± 0.44a–e19.75 ± 4.11a–c3.83 ± 0.48ab
JMR2o3.46 ± 0.39ef2.82 ± 0.31c–e9.78 ± 1.10ab3.32 ± 0.55f12.15 ± 1.45a–d4.10 ± 0.47h16.79 ± 3.22ab4.25 ± 0.65bc
JMR2z3.42 ± 0.36ef2.99 ± 0.25e10.34 ± 1.11b–d3.20 ± 0.53ef13.90 ± 2.45e4.11 ± 0.60h21.75 ± 5.48cd4.58 ± 0.53c
DBA53.45 ± 0.47ef2.81 ± 0.31c–e10.83 ± 1.47cd3.20 ± 0.52ef13.46 ± 2.28b–e4.01 ± 0.53gh20.61 ± 5.60a–d4.26 ± 0.53bc
Avg.3.24 ± 0.30a **2.73 ± 0.24a10.14 ± 1.32a2.94 ± 0.47a12.94 ± 2.30a3.61 ± 0.65a19.66 ± 4.47ab3.96 ± 0.97a
Penicillium crustosum
JBA8a3.10 ± 0.24a2.76 ± 0.23a10.67 ± 1.56d3.08 ± 0.49a14.37 ± 2.30ab4.10 ± 0.53b21.52 ± 4.38ab4.31 ± 0.69b
JBA113.27 ± 0.38a–c3.00 ± 0.27b10.59 ± 1.52cd3.23 ± 0.51a13.30 ± 11.86a4.01 ± 0.56ab20.37 ± 3.65ab4.22 ± 0.57ab
KGR23.61 ± 0.27d3.34 ± 0.22c9.67 ± 1.05a–c3.03 ± 0.32a13.71 ± 1.88ab3.71 ± 0.46a21.18 ± 3.87ab4.16 ± 0.44ab
KRI1P3.28 ± 0.23a–c3.06 ± 0.18b10.36 ± 1.57b–d3.09 ± 0.34a13.97 ± 2.79ab3.77 ± 0.53a20.01 ± 4.73a3.88 ± 0.48ab
KVA83.23 ± 0.21ab2.97 ± 0.20b9.63 ± 1.10ab3.06 ± 0.38a13.62 ± 3.05a3.83 ± 0.48ab19.87 ± 4.55a4.10 ± 0.66ab
DRI4b3.36 ± 0.33bc2.98 ± 0.27b9.36 ± 0.96a2.99 ± 0.39a15.04 ± 2.24b3.75 ± 0.54a23.37 ± 4.33b3.78 ± 0.59a
MRI43.45 ± 0.23c3.28 ± 0.23c10.07 ± 1.41a–d3.21 ± 0.45a14.34 ± 1.79ab3.86 ± 0.58ab22.26 ± 4.82ab4.28 ± 0.55b
Avg.3.33 ± 0.27a3.06 ± 0.23b10.05 ± 1.35a3.10 ± 0.41a14.02 ± 2.43b3.86 ± 0.54b21.23 ± 4.45b4.11 ± 0.60ab
Penicillium solitum
DRI33.67 ± 0.17b3.42 ± 0.18c10.13 ± 1.92a3.11 ± 0.41a12.20 ± 2.03a4.21 ± 0.56c18.17 ± 4.09a4.41 ± 0.69b
* Numbers with different letters represent significant difference within isolates of the same species according to Tukey HSD test (p < 0.01); ** Bolded numbers with different letters represent significant difference in micromorphology among species according to Tukey HSD test (p < 0.01).
Table 5. Placement of Penicillium expansum isolates based on different characteristics.
Macromorphology
(Cluster Analysis: Colony Diameter, PDA, MEA, CYA Reverse)
Phylogeny
BenA
CaM
RPB2
Multilocus
I groupJRad4 *JRad4JRad4
3JC113JC113JC11
3JC233JC233JC23
3JB133JB133JB13
3SD33SD33SD3
3SD53SD53SD5
3MR13MR13MR1
JBA8bJBA8bJBA8b
JPN2JPN2JPN2
KPN4KPN4KPN4
DRI4aDRI4aDRI4a
3JB22
3S1
KSA5
II group3JB223JB22
3S13S1
KSA5KSA5
3JC63JC63JC6
JMR2oJMR2oJMR2o
JMR2zJMR2zJMR2z
DBA5DBA5DBA5
* Bolded isolates show stable placement in groups based on all characters.
Publisher’s Note: MDPI stays neutral with regard to jurisdictional claims in published maps and institutional affiliations.

