Article

Characterization of Complete Mitochondrial Genomes of the Five Peltigera and Comparative Analysis with Relative Species

College of Life Sciences and Technology, Xinjiang University, Urumchi 830017, China
*
Author to whom correspondence should be addressed.
J. Fungi 2023, 9(10), 969; https://doi.org/10.3390/jof9100969
Submission received: 4 August 2023 / Revised: 15 September 2023 / Accepted: 16 September 2023 / Published: 26 September 2023
(This article belongs to the Section Fungal Genomics, Genetics and Molecular Biology)

Abstract

:
In the present study, the complete mitochondrial genomes of five Peltigera species (Peltigera elisabethae, Peltigera neocanina, Peltigera canina, Peltigera ponojensis, Peltigera neckeri) were sequenced, assembled and compared with relative species. The five mitogenomes were all composed of circular DNA molecules, and their ranged from 58,132 bp to 69,325 bp. The mitochondrial genomes of the five Peltigera species contain 15 protein-coding genes (PCGs), 2 rRNAs, 26–27 tRNAs and an unidentified open reading frame (ORF). The PCG length, AT skew and GC skew varied among the 15 PCGs in the five mitogenomes. Among the 15 PCGs, cox2 had the least K2P genetic distance, indicating that the gene was highly conserved. The synteny analysis revealed that the coding regions were highly conserved in the Peltigera mitochondrial genomes, but gene rearrangement occurred in the intergenic regions. The phylogenetic analysis based on the 14 PCGs showed that the 11 Peltigera species formed well-supported topologies, indicating that the protein-coding genes in the mitochondrial genome may be used as a reliable molecular tool in the study of the phylogenetic relationship of Peltigera.

1. Introduction

Lichens, symbiotic complexes composed of a fungus and one or more green algae/cyanobacteria, are important parts of their ecosystem [1,2]. In this symbiotic relationship, lichenized fungi (mycobiont) provide water and inorganic salts for algae or cyanobacteria (photobiont/phycobiont). At the same time, they obtain organic compounds from photobionts, forming a mutually beneficial symbiotic relationship [3,4]. The unique structure of lichens enables them to survive in extreme environments where higher plants cannot live, such as mountains and deserts, or the environments of Antarctica [5,6,7]. As a typical symbiont, the main characteristic difference between lichens and other organisms is that they can produce secondary metabolites. These offer good value for food, medicine, medical treatment, environmental monitoring and so on [8,9,10,11]. In lichen, lichenized fungi occupy the main position and determine the morphological characteristics of the lichen. Therefore, lichens are named after the fungal partner in the symbiosis [12].
Peltigera Willd. (Lecanoramycetes: Peltigerales) is a lichen-forming genus, and is one of the more widely distributed genera [13]. There is a wide range of morphological and chemical variations in Peltigera species, leading to some difficulties in species identification. This has resulted in the taxonomic study of this genus becoming increasingly attractive to many lichenologists [13,14,15,16,17,18]. In 2000, Miadlikowska systematically studied the phylogenetic status of Peltigera based on chemical, morphological and large-subunit ribosomal DNA (LSU nrDNA) data and divided the Peltigera into eight sections [14]. After that, more researchers began to study the relationship between species in different sections, such as the Peltigera section [15,16] and the Polydocolon section [17]. Thus far, research on Peltigera has been limited mainly to traditional taxonomic studies. Despite the increasing number of genomic data that have been published in recent decades [18,19,20], there are still few studies about the Peltigera [21,22,23]. Until now, only six mitochondrial complete genome data of the Peltigera could be obtained in the NCBI database, greatly limiting our understanding of the genetic evolution characteristics of the genus.
Mitochondria (Mt), the primary source for the aerobic respiration of cells, are semi-autonomous organelles with their own genomes. The protein-coding genes in the mitochondrial genome can provide abundant sites for phylogeny and help us to understand eukaryotic evolution and genetics [24,25]. With the continuous development of molecular technology, some mitochondrial genes are considered to be universal ‘barcodes’ for the rapid identification of eukaryotes and have become an important molecular marker [26,27]. The size, gene arrangement and structure of fungal mitochondrial genomes vary greatly, even among species of the same genus [28,29,30]. Elucidating the characteristics of fungal mitochondrial genomes, including the changes of these characteristics among different species, will contribute to a comprehensive understanding of the phylogenetic and evolutionary relationships of fungi.
In this study, we sequenced, assembled and annotated five Peltigera species. Firstly, the characteristics of five Peltigera mitogenomes were revealed. Secondly, by comparing and analyzing the five mitogenomes with the published Peltigera mitogenomes, the similarities and differences between the mitochondrial genomes were revealed. Finally, a phylogenetic tree based on protein-coding genes was constructed for the first time to reveal the role of protein-coding genes in the mitochondrial genome in determining the phylogenetic relationship of the genus. This study not only enriches the genome data of the Peltigera but also provides information for understanding the genetic evolution of the Peltigera species.

2. Materials and Methods

2.1. Sample Collection and DNA Extraction

Five samples in this study were collected from Xinjiang, China. The species information is shown in Supplementary Table S1. All five species were identified by morphological characteristics and ITS sequence (P. elisabethae: OR468759; P. neocanina: OR473628; P. canina: OR470683; P. ponojensis: OR468758, P. neckeri: OR468736). Specimens were deposited in Herbarium of the College of Life Science and Technology at Xinjiang University in Urumchi, China. Genomic DNA was extracted by fungal DNA extraction kit (Sangon Biotech, Shanghai, China), following the manufacturer’s instructions.

2.2. Sequencing, Assembly, and Annotation of Mitochondrial Genomes

Whole genomic sequencing (WGS) of Peltigera species was conducted by the DNBSEQ sequencing platform (Shenzhen, China). GetOrganelle v7.4.1 [31] and NOVOPlasty v4.2 [32] were used to assemble Peltigera mitogenomes. The complete mitogenomes of Peltigera were annotated using MFannot [33], MITOS [34] based on the mitochondrial genetic code 4 [35], and Geseq [36]. Graphical maps of the five Peltigera mitogenomes were drawn using OGDraw v1.2 [37].

2.3. Sequence Analyses of Mitogenomes

Base composition of the 11 Peltigera mitogenomes (the accession numbers are shown in Table S9) was analyzed using the DNASTAR Lasergene v7.1 (https://www.dnastar.com/, accessed on 11 July 2023). Strand asymmetries of the mitogenomes were calculated according to the following formulas: AT skew = [A − T]/[A + T], and GC skew = [G − C]/[G + C] [38]. Fifteen PCGs (atp6, atp8, atp9, cytb, cox1, cox2, cox3, nad1, nad2, nad3, nad4, nad4L, nad5, nad6, and rps3) in the eleven Peltigera mitogenomes were used to detect pairwise genetic distances based on the Kimura-2-parameter (K2P) substitution model, using MEGA v6.06 [39]. The nonsynonymous substitution rates (Ka) and synonymous substitution rates (Ks) of the 15 PCGs (without introns) of the mitogenomes were calculated using DnaSP v6.10.01 [40]. The secondary structure of the tRNA genes in the five Peltigera species was predicted by tRNAscan-SE v1.3.1 software [41]. Gene synteny analysis of the five mitogenomes was also calculated using Mauve v2.4.0 [42].

2.4. Repetitive Element Analysis

BLASTN searches of the five Peltigera mitogenomes against themselves were detected at an E-value of <10−10. Tandem repeats in the mitogenomes were identified using the Tandem Repeats Finder software [43]. REPuter [44] was used to detect interspersed repeats in the five mitochondrial genomes: hamming distance was 3, maximum computed repeats was 5000, and minimal repeat size was 30. MISA [45] was used to detect simple sequence repeats (SSRs) in the mitogenomes. The conditions were 10 repeats for mononucleotide, 5 repeats for dinucleotide, 4 repeats for trinucleotide, and 3 repeats for tetranucleotide, pentanucleotide, and hexanucleotide.

2.5. Phylogenetic Analysis

We used maximum likelihood (ML) and Bayesian inference (BI) to create phylogenies based on the 14 core genes (atp6, atp8, atp9, cytb, cox1, cox2, cox3, nad1, nad2, nad3, nad4, nad4L, nad5, nad6), except rps3 gene that was not annotated in P. dolichospora. The Cairneyella variabilis was used as an outgroup. Phylosuite used to extract gene [46], MAFFT V7.313 [47] was used for gene alignment, and SequenceMatrix was used for gene concatenation [48]. ModelFinder [49] was used to select the best-fit evolutionary model for the combined gene alignment.
The maximum likelihood (ML) analysis was performed based on the Bayesian information criterion (BIC). Under the Edge-unlinked partition model and ML analysis was performed using IQ-tree V1.6.8 [50], and 1000 ultra-fast bootstrap replications were performed. Bayesian analyses were performed with MrBayes v3.2.7a [51]. Two independent runs with four chains (three heated and one cold) each were conducted simultaneously for 2×10⁶ generations. Each run was sampled every 100 generations. We assumed that stationarity had been reached when the estimated sample size (ESS) was greater than 100 and the potential scale reduction factor (PSRF) approached 1.0. The first 25% of the samples were discarded as burn-in, and the remaining trees were used to calculate Bayesian posterior probabilities (BPP) in a 50% majority-rule consensus tree [52]. Finally, the ML and BI phylogenetic trees were viewed and edited by the network-based Figtree (http://treebioedacuk/software/figtree/, accessed on 23 July 2023).

3. Results

3.1. Mitogenome Features

In the present study, the complete mitogenomes of P. elisabethea, P. neocanina, P. canina, P. ponojensis and P. neckeri were assembled, annotated and analyzed. The five Peltigera mitogenomes were composed of circular DNA molecules, and their size ranged from 58,132 bp to 69,325 bp (Figure 1). The P. canina had the largest mitogenome (69,325 bp) and the P. neckeri had the smallest mitogenome (58,132 bp). The average GC contents of the five mitogenomes were very close, with an average of 26.7%. A total of 17 to 21 free-stranding protein-coding genes (PCGs) were detected in the 5 Peltigera mitogenomes. All mitogenomes contained 15 PCGs, including atp6, atp8, atp9, cytb, cox1, cox2, cox3, nad1, nad2, nad3, nad4, nad4L, nad5, nad6 and rps3. Among the 15 PCGs, cox1, cytb, nad1, cox2, nad4L and nad5 contained introns, and ORFs with different sizes were detected in intron regions of the cox1 gene. In the five Peltigera mitochondrial genomes, intergenic regions and intronic regions accounted for more than 65% of the whole mitogenomes. Genetic regions accounted for 20.04–23.45% of the entire mitogenomes, and the rRNA genes and tRNA genes only accounted for 7.15–8.16% and 2.80–3.34%, respectively (Table S2).The largest intergenic region was located between nad4 and nad1 among the five mitogenomes, with a size of 4202 bp–7673 bp. In addition, one overlapping nucleotide was found in each of the five mitochondrial genomes, located between nad4L and nad5 (Table S3).

3.2. RNA Genes

All of the five Peltigera mitogenomes contained two rRNA genes: the small-subunit ribosomal RNA (rns) and the large-subunit ribosomal RNA (rnl). The lengths of rnl genes in the five Peltigera mitogenomes ranged from 3188 bp to 3417 bp and 1537 bp to 1539 bp in the rns genes. The rnl gene had 2–4 introns (Table S3).
The 5 mitogenomes had 26 tRNA genes, with the exception of P. ponojensis, which had 27 tRNA genes. All of the tRNA genes were encoded for the 20 standard amino acids. Further, 26 tRNA genes had the same classical cloverleaf structures in four mitogenomes (Figure 2). Two of the tRNA genes code for leucine, arginine, serine and tyrosine in four of the mitogenomes, with the exception of P. ponojensis, with one tRNA gene for tyrosine and three for arginine. Three tRNA genes code for methionine in the five mitogenomes. In the mitogenomes of P. elisabethae, P. neocanina, P. canian and P. neckeri, one tRNA gene codes phenylalanine, but two tRNA genes code in P. ponojensis. The length of the tRNA genes ranged from 71 bp to 86 bp, and the trnS gene was the largest. The lengths of trnS, trnL and trnY were >80 bp, and these tRNAs all contained extra arms, indicating that the size variations of tRNAs were mainly due to size variations in extra arms in the Peltigera mitogenomes.

3.3. Codon Usage Analysis

We compared the start codons of 15 PCGs in the 11 Peltigera species that have been published (Table S4). Among the 15 PCGs, the atp6, atp8, atp9, cox1, cox3, nad1, nad2, nad3, nad4, nad4L, nad5 and rps3 genes used ATG as start codons. The start codon of cytb was CTG in all observed species, and cox2 and nad6 used ATT and ATA as the start codon in the Peltigera mitogenomes, except for P. dolichorrhiza and P. polydactylon, which used GTG as the start codon for the cox2 gene and ATG for nad6.
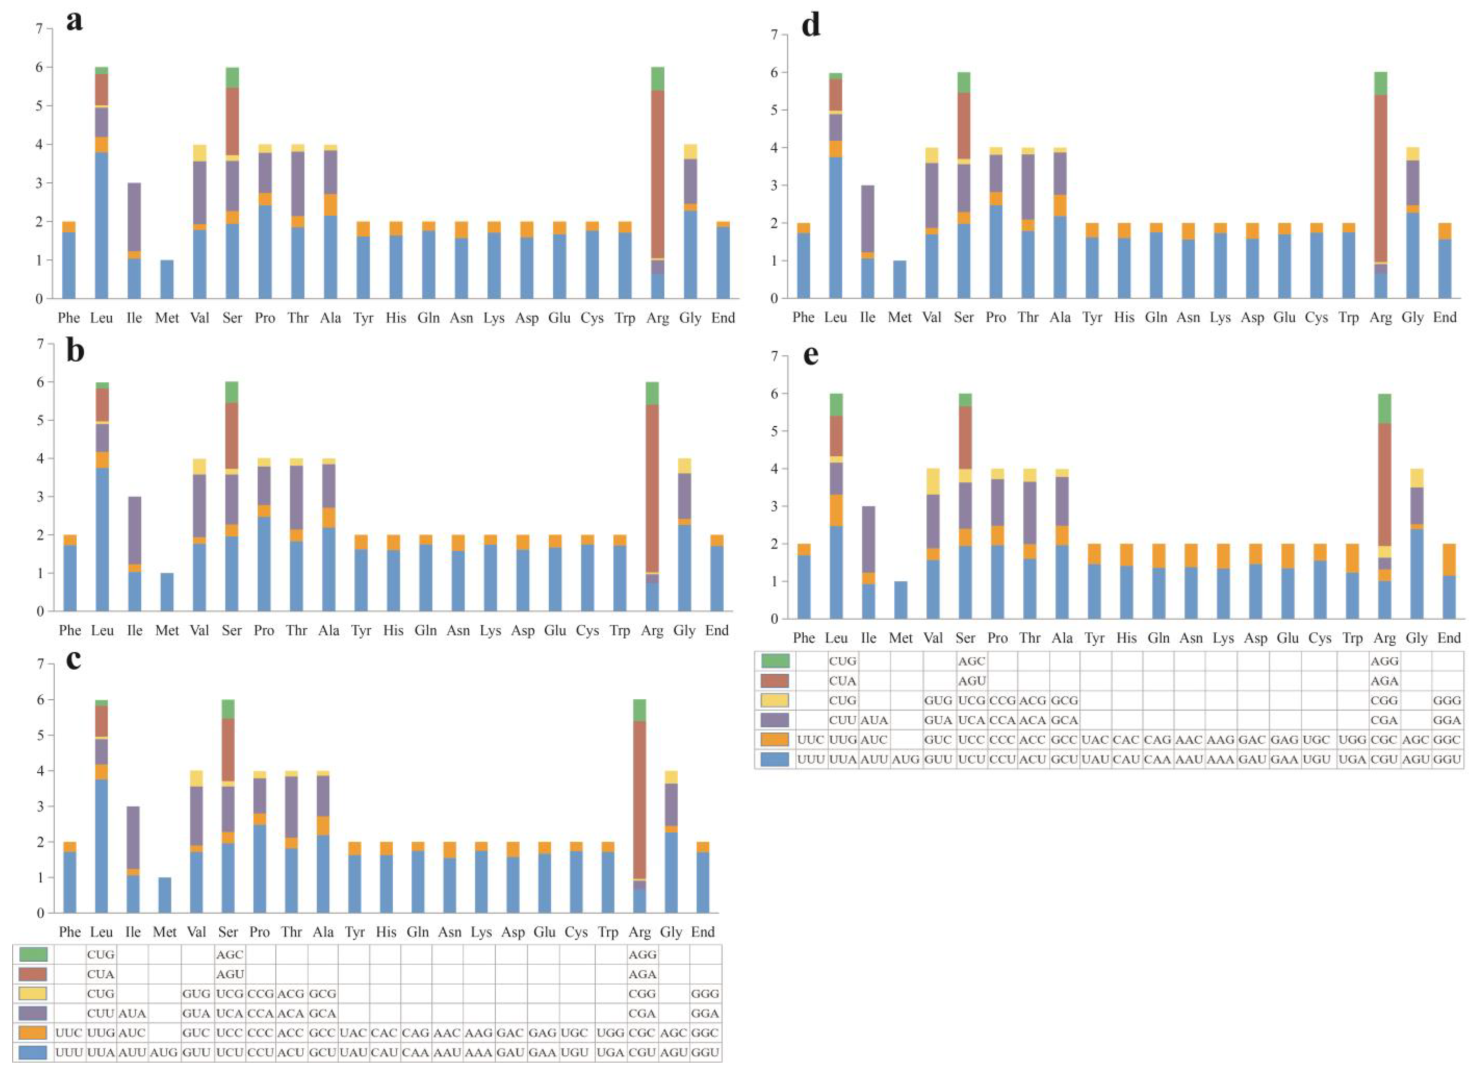
Codon usage analysis indicated that the codon preferences of the five mitochondrial genomes were highly similar (Figure 3). AGA (for arginase; Arg), UUA (for Leucine; Leu) CCU (proline; Pro), GCU (alanine; Ala) and AGU (Glycine; Gly) were the most frequently used codons in the five mitogenomes.

3.4. Repetitive Element Analysis

Through BLASTN searches of the 5 Peltigera mitogenomes against themselves, we identified 4, 6, 16, 10 and 6 repeat regions in the P. elisabethae, P. neocanina, P. canina, P. ponojensis and P. neckeri mitogenomes, respectively (Table S5). These repeats ranged from 46 to 229 bp. The longest repeats were found in P. canina, and the shortest repeat regions were found in P. neckeri. In the mitochondrial genome of P. elisabethae, P. neocanina, P. canina, P. ponojensis and P. neckeri we detected 10, 13, 23, 7 and 10 tandem repeats (Table S6). The length of repeat units ranged from 4 bp to 124 bp, and the copy number ranged from 1.9 to 12.8. Mononucleotide, dinucleotide, trinucleotide, tetranucleotide, pentanucleotide and hexanucleotide repeats were found in the mitochondrial genome of the five Peltigera mitogenomes (Table S7). Among all of the repeat types, mononucleotide (A/T) and dinucleotide (AT) repeats were the most abundant. A total of 58, 54, 58, 50 and 52 SSRs were detected in the P. elisabetnae, P. neocanina, P. canina, P. ponojensis and P. neckeri mitogenomes. Among the F (forward repeats), R (reverse repeats), C (complementary repeats) and P (palindromic repeats), forward repeats were found most among the five mitogenomes (Table S8).
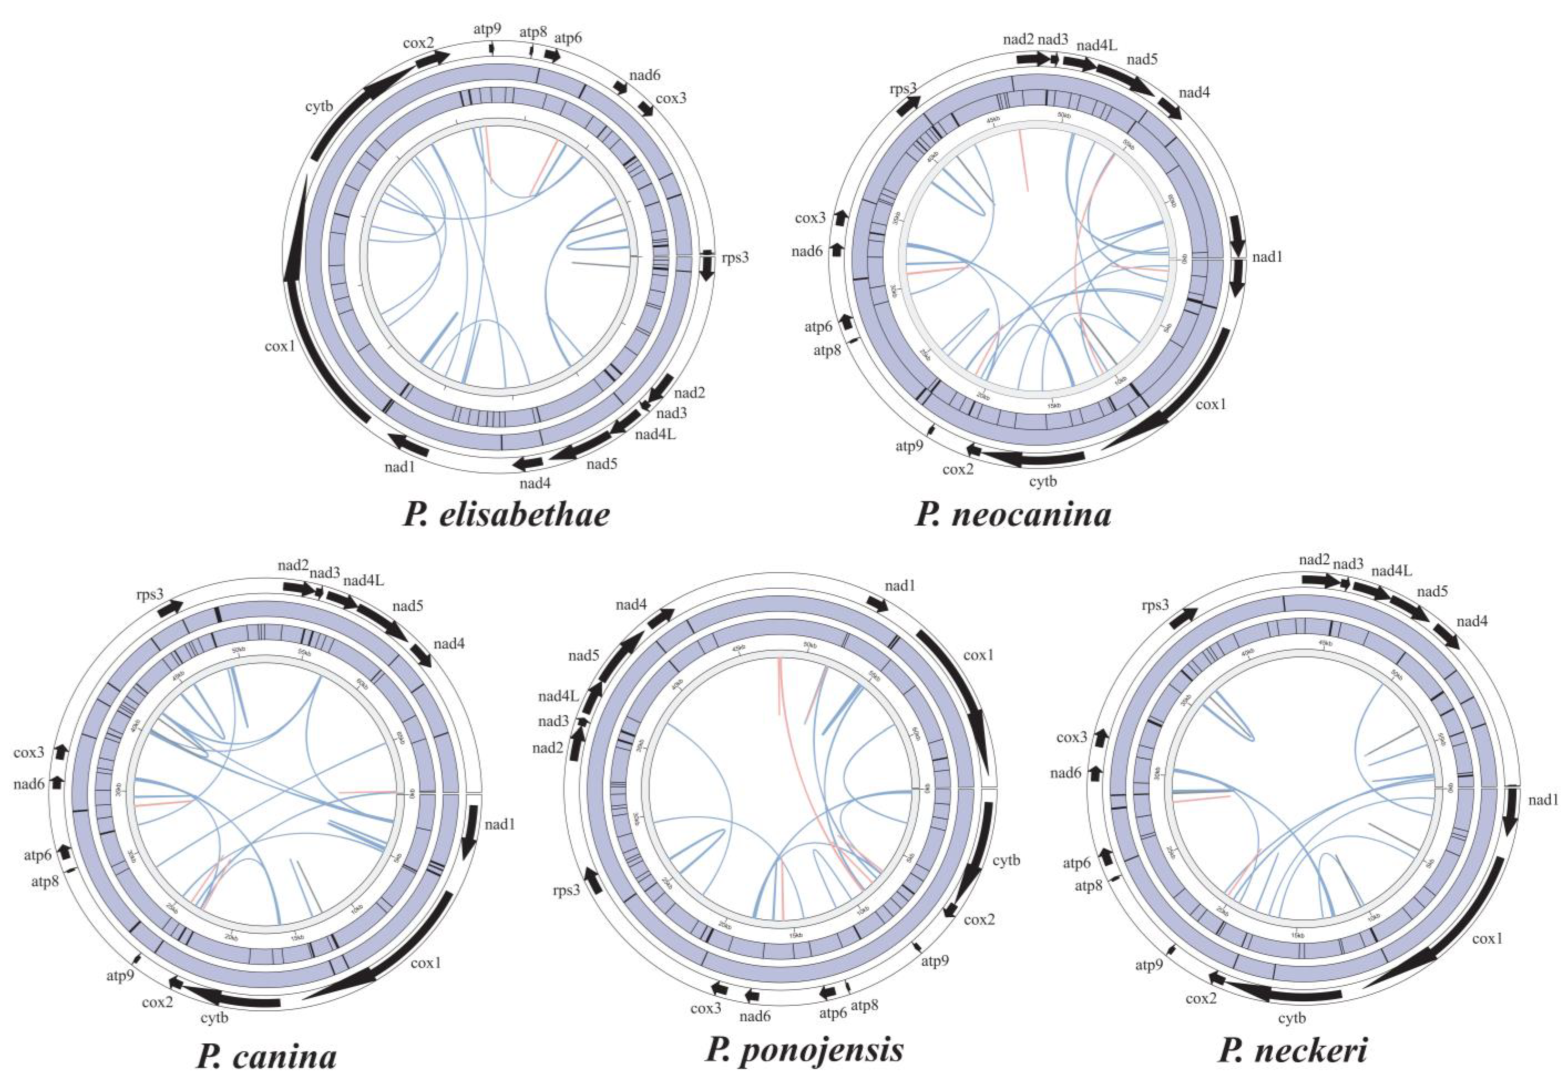
The results of the distribution characteristics of mitochondrial genome repeat sequences show that P. neocanina, which had the longest mitochondrial genome, had the most repeat sequences. In addition, repetitive sequences are mainly distributed in intronic and intergenic regions in the mitogenomes (Figure 4).

3.5. Variation, Genetic Distance, and Evolutionary Rates of PCGs

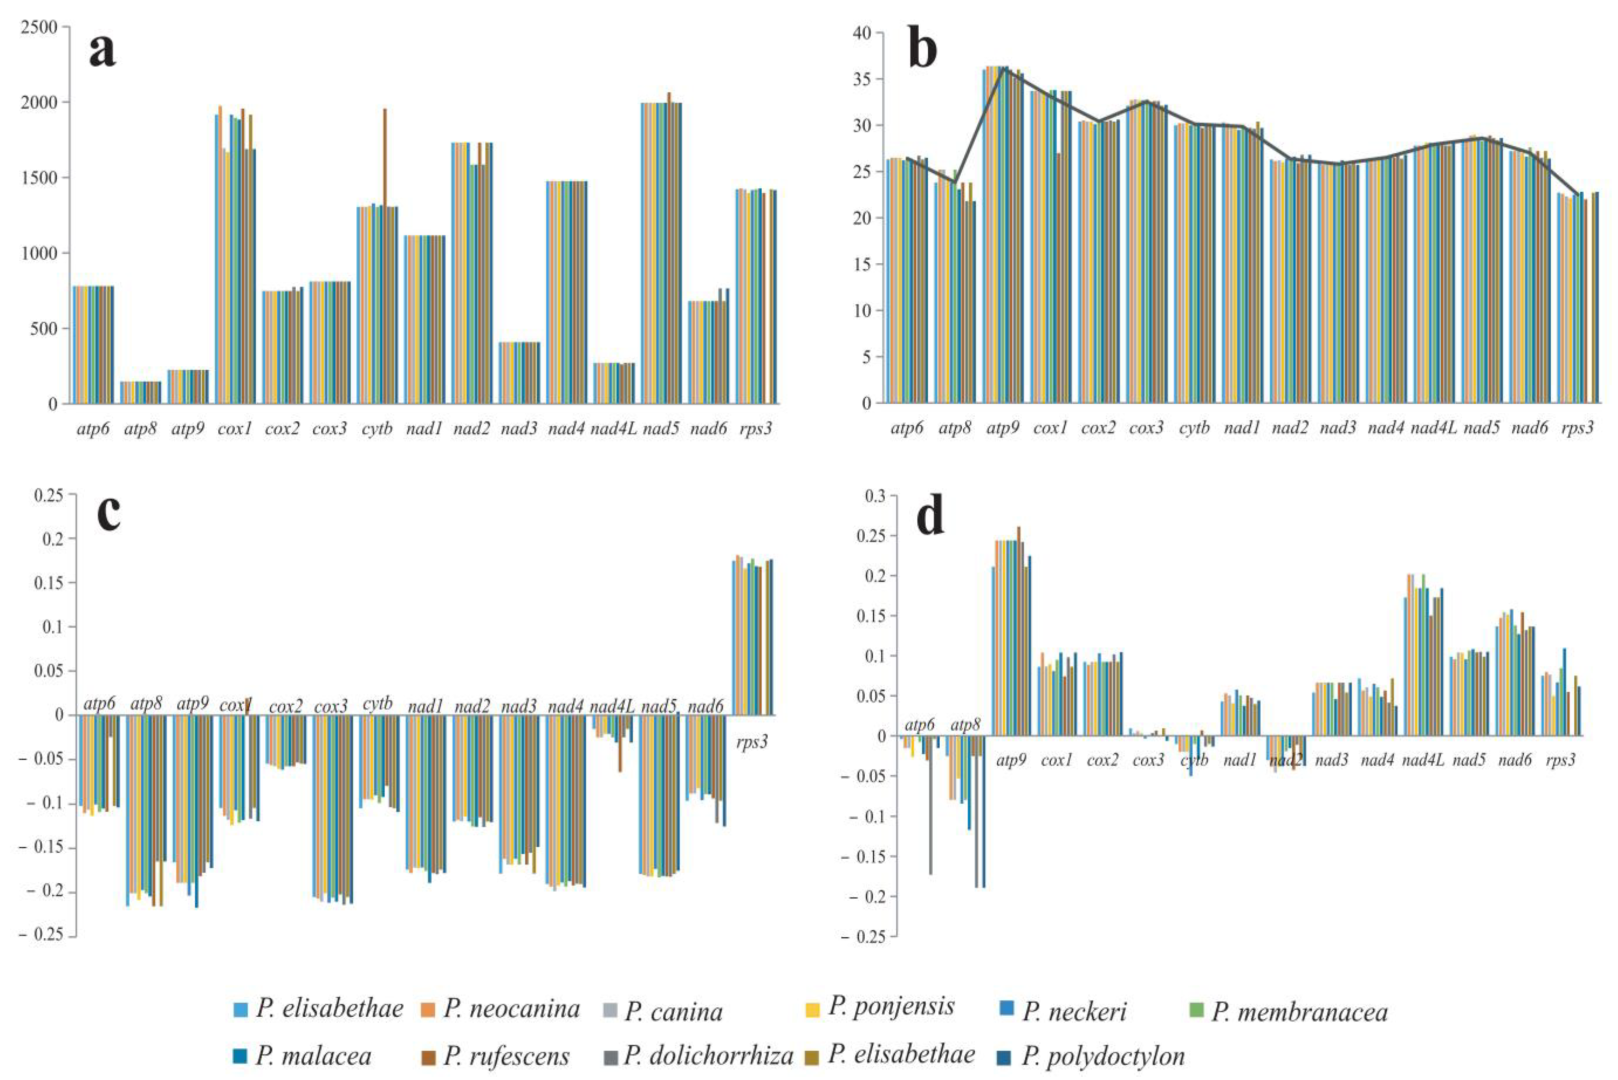
Among the 15 protein-coding genes, the lengths of atp6, atp8, atp9, cox3, nad1, nad3, nad4 and nad4L genes were the same in the 11 Peltigera mitogenomes (Figure 5, Table S9). The length of the cytb gene was between 1305 bp and 1328 bp, except for P. rufescens with a length of 1956 bp. The length of the cox1 gene varied greatly among the 11 species, and the rps3 gene was not annotated in P. dolichospora. Except for the cox1 gene, the GC content variation in each gene in the 11 mitochondrial genomes was very small. The GC content of the cox1 gene was 27% in P. rufescens and 33.5% to 33.8% in the other 10 mitogenomes. Among the 15 protein-coding genes, atp9 had the highest GC content, with an average of 36.1%, and rps3 had the lowest GC content, with an average of 22.5%. AT skew of the rps3 gene was positive, AT skews of the remaining 14 genes were negative, but the cox1 gene in the P. rufescens was positive. GC skews of 15 PCGs were variable in the 11 Peltigera mitogenomes; among these, atp6, atp8, cytb and nad2 genes were negative, and other genes were positive. GC skews of the cox3 gene were negative in P. neckeri and P. polydactylon but positive in the other mitogenomes.
The nonsynonymous substitution rate, synonymous substitution rate and the Kimura-2-parameter distance were also analyzed in the 11 Peltigera mitogenomes (Figure 6). The cox1 gene had the largest genetic distance, which indicates that the cox1 exhibited the fastest mutation rate among the 15 PCGs, while the cox2 gene had the lowest genetic distance, indicating that the cox2 was highly conserved. Among the 15 PCGs, the cox1 gene had the highest non-synonymous substitution rate (Ka), and the cox2 gene had the lowest. The synonymous substitution rate (Ks) of cox1 was the highest, and that of cox2 was the lowest. The Ka/ks values of the 15 PCGs were less than 1, which indicates that these genes were selected through purification.

3.6. Synteny Analysis

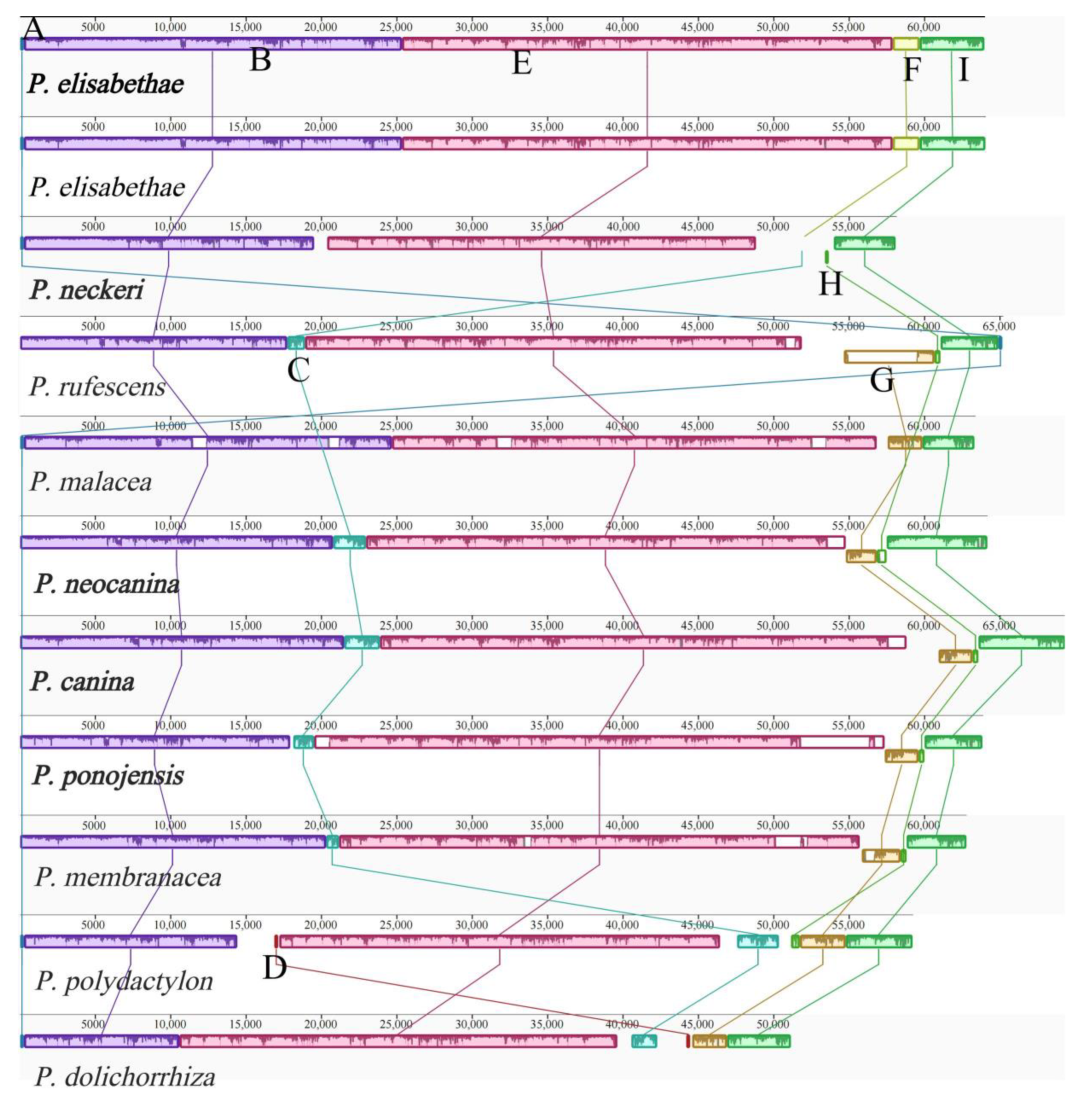
A total of 9 locally collinear blocks (A to I) were detected in 11 Peltigera mitogenomes based on the analysis in Mauve (Figure 7). Across the 9 locally collinear blocks detected, B, E and I were found in all 11 mitogenomes. Locally collinear block D was only detected in P. polydoctylon and P. dolichorrhiza, F and G were found in P. elisabethea and P. neckeri. Locally collinear block C appeared in nine Peltigera mitogenomes, except for P. elisabethae, and the size of these regions varied among each species. Among the 11 Peltigera species that were analyzed, P. polydactylon exhibited 8 locally collinear blocks, except F, while P. elisabethae and P. malacea exhibited 5 locally collinear blocks. Genome collinearity analyses showed that the position of the PCGs, tRNAs and rRNAs was highly conserved in the Peltigera mitogenomes.

3.7. Phylogenetic Analysis

A phylogenetic tree of 11 Peltigera species was constructed based on the 14 core PCGs (atp6, atp8, atp9, cytb, cox1, cox2, cox3, nad1, nad2, nad3, nad4, nad4L, nad5, nad6, and rps3), using both the Bayesian inference (BI) and maximum likelihood (ML) methods. The phylogenetic tree indicates that all branches are well supported (Figure 8). According to the phylogenetic study of Miadlikowska et al., the species used to construct phylogeny were distributed in four sections, while five species in the study were in section D and section E. P. elisabethae had a close relationship with P. neckeri. P. ponojensis and P. rufescens formed a sister clade.

4. Discussion

In this study, we obtained the mitogenome sequences of five Peltigera and analyzed them together with previously published mitochondrial genomes. P. canina had the largest mitogenome (69,325 bp), and P. neckeri had the smallest mitogenome (58,132 bp) among the five Peltigera that were analyzed here. In the fungal mitochondrial genome, the intergenic regions and intronic regions are the main factors affecting the size and variation of the mitochondrial genome [53,54]. The largest mitogenome contained 15 introns with a length of 22,755 bp, accounting for 32.8% of the whole mitogenome. In contrast, the smallest mitogenome had 10 introns, a length of 16,112 bp and accounted for 27.7% of the entire mitogenome. The intergenic regions of P. elisabethae were the shortest (17,019 bp, 26.59%) among the five mitochondrial genomes, while the intronic regions were the longest (26,199, 40.94%). The intergenic region and intronic region accounted for 67.53%, 67.17%, 70.01%, 67.39% and 65.05% of the whole mitogenomes in P. elisabethae, P. neocanina, P. canina, P. ponojensis and P. neckeri, respectively. Variations in intergenic regions are the primary factors underlying the mitogenome size in Peltigera, following the intronic region (Table S2).
The 5 mitochondrial genomes obtained in this study contained 14 core protein-coding genes and 1 rps3 gene. Furthermore, the 15 PCGs in the Peltigera mitogenomes were very conserved in gene order and number but were various in length (Table S3, Figure 5). Among the 15 PCGs, 8 genes (atp6, atp8, atp9, cox3, nad1, nad3, nad4, nad4L) had the same length, but the length of the cox1 gene varied greatly in the 11 Peltigera species. Additionally, the Ka, Ks and K2P of the cox1 gene were the highest in the 15 PCGs, demonstrating that the cox1 gene had the largest variation in the evolution process. The four mitochondrial genomes, except for P. neckeri, have a 504 bp coding region that encodes a hypothetical protein between the nad6 and rps3 genes. In addition, the intronic region of the cox1 gene in the Peltigera mitogenome had ORFs of varying lengths, but the way in which introns encode regions is poorly understood. The available mitochondrial genome data are very limited, which makes it impossible for us to conduct more in-depth research on the genomic and evolutionary characteristics of the genus. More genomic data are needed to help us further understand the function of ORFs and hypothetical proteins in fungal mitogenomes.
The tRNA sizes in the five mitochondrial genomes ranged from 71 bp to 86 bp. The existence and size of the extra arm in the trnS, trnL and trnY are the primary factors affecting the size of the tRNA gene. Some studies have found that tRNA mutations affect protein synthesis and various diseases [55,56,57]. Among the G-U, C-U and A-C mismatches, the G-U mismatches are rather unstable; however, G-U mismatches have been found in some fungal genome studies [58,59,60,61]. The predicted tRNA secondary structure showed a large number of G-U mismatches in our study. Different from the P. elisabethae, P. neocanina, P. canina and P. neckeri mitochondrial genomes, the P. ponojensis mitochondrial genome lacks the trnY2 gene, and the tyrosine (Tyr) is encoded by only one tRNA gene. In addition, phenylalanine (F) is encoded by two tRNA genes, and only one tRNA gene is encoded in other species. In the secondary structure of other genera of lichens and other fungi, phenylalanine (F) is encoded by only one tRNA gene [62,63].
We detected simple repeats, interspersed repeats and tandem repeats in the mitogenomes (Figure 4), and the results show that the repeat sequences in the mitogenomes were distributed in the intergenic regions. Repetitive sequences in fungal mitogenomes correlate with the mitochondrial gene rearrangement [59]. Synteny analysis found that the protein-coding region was highly conserved in the mitochondrial genome of the Peltigera, and the main differences appeared in the non-coding regions (Figure 7). Therefore, the repetitive sequences are likely to be one of the reasons for the large differences between species.
The large variations in the morphology and chemistry of the Peltigera species, leading to morphology and anatomy, have not been successfully and quantitively explored in this genus [14]. Although many studies have used multi-gene loci to explore the phylogenetic position of the Peltigera [14,15,16,17,21], there are still many species to be discovered, and we need something with richer genetic features to perform phylogenetic analysis on the Peltigera [15]. Therefore, we used 14 conserved single-copy protein-coding genes to construct a phylogenetic tree to determine the phylogenetic position of the genus [62,63,64]. According to the previous taxonomic studies of the Peltigera, P. polydactylon was found in the Polydactylon section, P. malecea in the Peltidea section, P. elisabethae and P. neckeri in the Horizontales section and P. neocanina, P. canina, P. ponojensis, P. rufescens and P. membranacea in the Peltigera section. In our results, P. elisabethae and P. neckeri are well clustered together, and the five species of the Peltigera section are also clustered together with high support. Although our phylogenetic analysis is consistent with the previous results, the data analyzed in this study are limited, and it cannot be confirmed that the protein-coding genes are reliable molecular markers for the phylogenetic study of the Peltigera. In future studies, more data are needed to confirm the application and reliability of protein-coding genes in the phylogeny of the Peltigera.

5. Conclusions

In the present study, we sequenced and assembled five Peltigera mitogenomes and compared them with six published Peltigera species. The genetic region, intergenic region, intronic region and RNA region were calculated, in which the intergenic region was the main factor affecting the mitogenome size in the Peltigera. Gene arrangements were detected in the Peltigera mitogenomes, but the protein-coding genes, tRNA genes and rRNA genes were highly conservative in position. Multiple repetitive sequences were found in the five Peltigera mitogenomes, including tandem repeats, interspersed repeats and SSRs, and these repetitive sequences are distributed in the intergenic regions and intronic regions. The results of the phylogenetic analysis show that the species of different sections were well clustered together, which indicates the reliability of the protein-coding genes of the mitogenome in the study of the phylogenetic position of the Peltigera. This study provides the mitochondrial genome data of the five Peltigera and enriches the genome database. In addition, the characteristics of the Peltigera mitogenome were revealed, and the similarities and differences among the Peltigera species were analyzed, providing information for the genetic evolution of the genus in the future.

Supplementary Materials

The following supporting information can be downloaded at https://www.mdpi.com/article/10.3390/jof9100969/s1: Table S1: Species information of the five Peltigera; Table S2: Comparison of mitogenomes among the five Peltigera species; Table S3: Characterization of the five Peltigera mitogenomes; Table S4: Start codon analyses of 15 PCGs in 11 Peltigera mitogenomes; Table S5: Local BLAST analysis of the five Peltigera mitogenomes against themselves; Table S6: Tandem repeats in the five Peltigera mitogenomes using Tandem Repeats Finder; Table S7: SSRs identified in mitochondrial genome in the five Peltigera mitogenomes using MISA; Table S8: Scattered repeats in the five Peltigera mitogenomes using Reputer; Table S9: The accession number of the 11 Peltigera species.

Author Contributions

R.M. proposed and designed experiments. J.W. performed experiments. G.A. analyzed data and wrote the paper. All authors have read and agreed to the published version of the manuscript.

Funding

Natural Science Foundation of Xinjiang Province [2022D03005], National Natural Science Foundation of China [31760052].

Institutional Review Board Statement

Not applicable.

Informed Consent Statement

Not applicable.

Data Availability Statement

The five Peltigera mitogenomes of P. elisabethae, P. neocanina, P. canina, P. ponojensis and P. neckeri were submitted to GenBank under the accession numbers OR343174, OR350404, OR350405, OR350406 and OR350407; and their raw sequencing data were submitted to SRA database under the accession numbers SRR25885166, SRR25885165, SRR25885164, SRR25885163 and SRR25885162, respectively.

Acknowledgments

Not applicable.

Conflicts of Interest

The authors declared no conflict of interest.

Abbreviations

Mitogenome (mitochondrial genome), PCG (protein-coding gene), ORF (open reading frame), rRNA (ribosomal RNAKs), (synonymous substitution rates), Ka (nonsynonymous substitution rates), K2P (the Kimura-2-parameter distance), BI (Bayesian inference), ML (maximum likelihood).

References

  1. Ahmadjian, V. The Lichen Symbiosis; John Wiley and Sons: New York, NY, USA, 1993. [Google Scholar]
  2. Spribille, T.; Tuovinen, V.; Resl, P.; Vanderpool, D.; Wolinski, H.; Aime, M.C.; McCutcheon, J.P. Basidiomycete yeasts in the cortex of ascomycete macrolichens. Science 2016, 353, 488–492. [Google Scholar] [CrossRef]
  3. Sharma, M.; Mohammad, A. Lichens and lichenology: Historical and economic prospects. Lichen-Deriv. Prod. Extr. Appl. 2020, 101–118. [Google Scholar] [CrossRef]
  4. Watkinson, S.C. Mutualistic symbiosis between fungi and autotrophs. In The Fungi; Academic Press: Cambridge, MA, USA, 2016; pp. 205–243. [Google Scholar]
  5. Honegger, R. The lichen symbiosis—What is so spectacular about it? Lichenologist 1998, 30, 193–212. [Google Scholar] [CrossRef]
  6. Kappen, L. Response to extreme environments. In The Lichens; Academic Press: Cambridge, MA, USA, 1973; pp. 311–380. [Google Scholar]
  7. Shukla, V.; Kumar, S.; Kumar, N. Plant Adaptation Strategies in Changing Environment; Springer: Singapore, 2017. [Google Scholar]
  8. Kłos, A.; Rajfur, M.; Šrámek, I.; Wacławek, M. Use of lichen and moss in assessment of forest contamination with heavy metals in Praded and Glacensis Euroregions (Poland and Czech Republic). Water Air Soil Pollut. 2011, 222, 367–376. [Google Scholar] [CrossRef] [PubMed]
  9. Zhao, Y.; Wang, M.; Xu, B. A comprehensive review on secondary metabolites and health-promoting effects of edible lichen. J. Funct. Foods 2021, 80, 104283. [Google Scholar] [CrossRef]
  10. Deduke, C.; Timsina, B.; Piercey-Normore, M.D. Effect of environmental change on secondary metabolite production in lichen-forming fungi. In International Perspectives on Global Environmental Change; InTech: Houston, TX, USA, 2012; pp. 197–230. [Google Scholar]
  11. Luo, H.; Wei, X.; Yamamoto, Y.; Liu, Y.; Wang, L.; Jung, J.S.; Hur, J.S. Antioxidant activities of edible lichen Ramalina conduplicans and its free radical-scavenging constituents. Mycoscience 2010, 51, 391–395. [Google Scholar] [CrossRef]
  12. Honegger, R. Functional aspects of the lichen symbiosis. Annu. Rev. Plant Biol. 1991, 42, 553–578. [Google Scholar] [CrossRef]
  13. MartÍnez, I.; Burga, A.R.; Vitikainen, O.; Escudero, A. Distribution patterns in the genus Peltigera Willd. Lichenologist 2003, 35, 301–323. [Google Scholar] [CrossRef]
  14. Miadlikowska, J.; Lutzoni, F. Phylogenetic revision of the genus Peltigera (lichen-forming Ascomycota) based on morphological, chemical, and large subunit nuclear ribosomal DNA data. Int. J. Plant Sci. 2000, 161, 925–958. [Google Scholar] [CrossRef]
  15. Magain, N.; Tniong, C.; Goward, T.; Niu, D.; Goffinet, B.; Sérusiaux, E.; Miadlikowska, J. Species delimitation at a global scale reveals high species richness with complex biogeography and patterns of symbiont association in Peltigera section Peltigera (lichenized Ascomycota: Lecanoromycetes). Taxon 2018, 67, 836–870. [Google Scholar] [CrossRef]
  16. Miadlikowska, J.; Richardson, D.; Magain, N. Phylogenetic placement, species delimitation, and cyanobiont identity of endangered aquatic Peltigera species (lichen-forming Ascomycota, Lecanoromycetes). Am. J. Bot. 2014, 101, 1141–1156. [Google Scholar] [CrossRef] [PubMed]
  17. Miadlikowska, J.; Magain, N.; Pardo de la Hoz, C.; Niu, D.; Goward, T.; Sérusiaux, E.; Lutzoni, F. Species in section Peltidea (aphthosa group) of the genus Peltigera remain cryptic after molecular phylogenetic revision. Plant Fungal Syst. 2018, 63, 45–64. [Google Scholar] [CrossRef]
  18. Funk, E.R.; Adams, A.N.; Spotten, S.M.; Van Hove, R.A.; Whittington, K.T.; Keepers, K.G.; Kane, N.C. The complete mitochondrial genomes of five lichenized fungi in the genus Usnea (Ascomycota: Parmeliaceae). Mitochondrial DNA Part B 2018, 3, 305–308. [Google Scholar] [CrossRef] [PubMed]
  19. Simon, A.; Liu, Y.; Sérusiaux, E.; Goffinet, B. Complete mitogenome sequence of Ricasolia amplissima (Lobariaceae) reveals extensive mitochondrial DNA rearrangement within the Peltigerales (lichenized ascomycetes). Bryologist 2017, 120, 335–339. [Google Scholar] [CrossRef]
  20. Lan, Y.; Huang, F. The complete mitochondrial genome of the lichenized fungi Usnea jiangxiensis (Ascomycota: Parmeliaceae). Mitochondrial DNA Part B 2020, 5, 1477–1478. [Google Scholar] [CrossRef]
  21. Magain, N.; Miadlikowska, J.; Goffinet, B.; Sérusiaux, E.; Lutzoni, F. Macroevolution of specificity in cyanolichens of the genus Peltigera section Polydactylon (Lecanoromycetes, Ascomycota). Syst. Biol. 2017, 66, 74–99. [Google Scholar] [CrossRef] [PubMed]
  22. Wang, L.; Mamut, R. Mitochondrial genome from the lichenized fungus Peltigera rufescens (Weiss) Humb, 1793 (Ascomycota: Peltigeraceae). Mitochondrial DNA Part B 2021, 6, 2186–2187. [Google Scholar] [CrossRef]
  23. Xavier, B.B.; Miao, V.P.; Jonsson, Z.O.; Andresson, O.S. Mitochondrial genomes from the lichenized fungi Peltigera membranacea and Peltigera malacea: Features and phylogeny. Fungal Biol. 2012, 116, 802–814. [Google Scholar] [CrossRef]
  24. Delsuc, F.; Stanhope, M.J.; Douzery, E.J. Molecular systematics of armadillos (Xenarthra, Dasypodidae): Contribution of maximum likelihood and Bayesian analyses of mitochondrial and nuclear genes. Mol. Phylogenet. Evol. 2003, 28, 261–275. [Google Scholar] [CrossRef]
  25. Hassanin, A.; An, J.; Ropiquet, A.; Nguyen, T.T.; Couloux, A. Combining multiple autosomal introns for studying shallow phylogeny and taxonomy of Laurasiatherian mammals: Application to the tribe Bovini (Cetartiodactyla, Bovidae). Mol. Phylogenet. Evol. 2013, 66, 766–775. [Google Scholar] [CrossRef]
  26. O’Brien, H.E.; Miadlikowska, J.; Lutzoni, F. Assessing reproductive isolation in highly diverse communities of the lichen-forming fungal genus Peltigera. Evolution 2009, 63, 2076–2086. [Google Scholar] [CrossRef] [PubMed]
  27. Hebert, P.D.; Cywinska, A.; Ball, S.L.; DeWaard, J.R. Biological identifications through DNA barcodes. Proc. Royal. Soc. B 2003, 270, 313–321. [Google Scholar] [CrossRef]
  28. Nelsen, M.P.; Lücking, R.; Grube, M.; Mbatchou, J.S.; Muggia, L.U.C.I.A.; Plata, E.R.; Lumbsch, H.T. Unravelling the phylogenetic relationships of lichenised fungi in Dothideomyceta. Stud. Mycol. 2009, 64, 135–144. [Google Scholar] [CrossRef] [PubMed]
  29. Carpi, G.; Kitchen, A.; Kim, H.L.; Ratan, A.; Drautz-Moses, D.I.; McGraw, J.J.; Schuster, S.C. Mitogenomes reveal diversity of the European Lyme borreliosis vector Ixodes ricinus in Italy. Mol. Biol. Evol. 2016, 101, 194–202. [Google Scholar] [CrossRef] [PubMed]
  30. Olivieri, A.; Sidore, C.; Achilli, A.; Angius, A.; Posth, C.; Furtwängler, A.; Torroni, A. Mitogenome diversity in Sardinians: A genetic window onto an island’s past. Mol. Biol. Evol. 2017, 34, 1230–1239. [Google Scholar] [CrossRef]
  31. Jin, J.J.; Yu, W.B.; Yang, J.B.; Song, Y.; DePamphilis, C.W.; Yi, T.S.; Li, D.Z. GetOrganelle: A fast and versatile toolkit for accurate de novo assembly of organelle genomes. Genome Biol. 2020, 21, 1–31. [Google Scholar] [CrossRef]
  32. Dierckxsens, N.; Mardulyn, P.; Smits, G. NOVOPlasty: De novo assembly of organelle genomes from whole genome data. Nucleic Acids Res. 2017, 45, e18. [Google Scholar] [CrossRef] [PubMed]
  33. Valach, M.; Burger, G.; Gray, M.; Lang, B.F. Widespread occurrence of organelle genome-encoded 5S rRNAs including permuted molecules. Nucleic Acids Res. 2014, 42, 13764–13777. [Google Scholar] [CrossRef] [PubMed]
  34. Bernt, M.; Donath, A.; Jühling, F.; Externbrink, F.; Florentz, C.; Fritzsch, G.; Stadler, P.F. MITOS: Improved de novo metazoan mitochondrial genome annotation. Mol. Phylogenet. Evol. 2013, 69, 313–319. [Google Scholar] [CrossRef]
  35. Andrzej, E.; Jim, O. The Bacterial, Archaeal and Plant Plastid Code. 2013. [Google Scholar]
  36. Tillich, M.; Lehwark, P.; Pellizzer, T.; Ulbricht-Jones, E.S.; Fischer, A.; Bock, R.; Greiner, S. GeSeq–versatile and accurate annotation of organelle genomes. Nucleic Acids Res. 2017, 45, W6–W11. [Google Scholar] [CrossRef]
  37. Lohse, M.; Drechsel, O.; Bock, R. Organellar Genome DRAW (OGDRAW): A tool for the easy generation of high-quality custom graphical maps of plastid and mitochondrial genomes. Curr. Genet. 2007, 52, 267–274. [Google Scholar] [CrossRef]
  38. Li, Q.; Wang, Q.; Jin, X.; Chen, Z.; Xiong, C.; Li, P.; Huang, W. Characterization and comparative analysis of six complete mitochondrial genomes from ectomycorrhizal fungi of the Lactarius genus and phylogenetic analysis of the Agaricomycetes. J. Biol. Macromol. 2019, 121, 249–260. [Google Scholar] [CrossRef]
  39. Kumar, S.; Nei, M.; Dudley, J.; Tamura, K. MEGA: A biologist-centric software for evolutionary analysis of DNA and protein sequences. Brief. Bioinform. 2008, 9, 299–306. [Google Scholar] [CrossRef]
  40. Rozas, J.; Ferrer-Mata, A.; Sánchez-DelBarrio, J.C.; Guirao-Rico, S.; Librado, P.; Ramos-Onsins, S.E.; Sánchez-Gracia, A. DnaSP 6: DNA sequence polymorphism analysis of large data sets. Mol. Biol. Evol. 2017, 34, 3299–3302. [Google Scholar] [CrossRef]
  41. Lowe, T.M.; Chan, P.P. tRNAscan-SE On-line: Integrating search and context for analysis of transfer RNA genes. Nucleic Acids Res. 2016, 44, W54–W57. [Google Scholar] [CrossRef]
  42. Darling, A.C.E.; Mau, B.; Blattner, F.R.; Perna, N.T. Mauve: Multiple alignment of conserved genomic sequence with rearrangements. Genome Res. 2004, 14, 1394–1403. [Google Scholar] [CrossRef]
  43. Benson, G. Tandem repeats finder: A program to analyze DNA sequences. Nucleic Acids Res. 1999, 27, 573–580. [Google Scholar] [CrossRef]
  44. Kurtz, S.; Choudhuri, J.V.; Ohlebusch, E.; Schleiermacher, C.; Stoye, J.; Giegerich, R. REPuter: The manifold applications of repeat analysis on a genomic scale. Nucleic Acids Res. 2001, 29, 4633–4642. [Google Scholar] [CrossRef]
  45. Beier, S.; Thiel, T.; Münch, T.; Scholz, U.; Mascher, M. MISA-web: A web server for microsatellite prediction. Bioinformatics 2017, 33, 2583–2585. [Google Scholar] [CrossRef]
  46. Xiang, C.Y.; Gao, F.; Jakovlić, I.; Lei, H.P.; Hu, Y.; Zhang, H.; Zhang, D. Using PhyloSuite for molecular phylogeny and tree-based analyses. iMeta 2023, 2, e87. [Google Scholar] [CrossRef]
  47. Katoh, K.; Rozewicki, J.; Yamada, K.D. MAFFT online service: Multiple sequence alignment, interactive sequence choice and visualization. Brief. Bioinform. 2019, 20, 1160–1166. [Google Scholar] [CrossRef]
  48. Vaidya, G.; Lohman, D.L.; Meier, R. SequenceMatrix: Concatenation software for the fast assembly of multi-gene datasets with character set and codon information. Cladistics 2011, 27, 171–180. [Google Scholar] [CrossRef]
  49. Kalyaanamoorthy, S.; Minh, B.Q.; Wong, T.K.; Von Haeseler, A.; Jermiin, L.S. ModelFinder: Fast model selection for accurate phylogenetic estimates. Nat. Methods 2017, 14, 587–589. [Google Scholar] [CrossRef]
  50. Nguyen, L.T.; Schmidt, H.A.; Von Haeseler, A.; Minh, B.Q. IQ-TREE: A fast and effective stochastic algorithm for estimating maximum-likelihood phylogenies. Mol. Biol. Evol. 2015, 32, 268–274. [Google Scholar] [CrossRef]
  51. Ronquist, F.; Teslenko, M.; van der Mark, P.; Ayres, D.L.; Darling, A.; Höhna, S.; Larget, B.; Liu, L.; Suchard, M.A.; Huelsenbeck, J.P. MrBayes 3.2: Efficient Bayesian Phylogenetic Inference and Model Choice across a Large Model Space. Syst. Biol. 2012, 61, 539–542. [Google Scholar] [CrossRef]
  52. Li, Q.; Wu, P.; Li, L.; Feng, H.; Tu, W.; Bao, Z.; Huang, W. The first eleven mitochondrial genomes from the ectomycorrhizal fungal genus (Boletus) reveal intron loss and gene rearrangement. Int. J. Biol. Macromol. 2021, 172, 560–572. [Google Scholar] [CrossRef]
  53. Fonseca, P.L.; De-Paula, R.B.; Araújo, D.S.; Tomé, L.M.R.; Mendes-Pereira, T.; Rodrigues, W.F.C.; Góes-Neto, A. Global characterization of fungal mitogenomes: New insights on genomic diversity and dynamism of coding genes and accessory elements. Front. Microbiol. 2021, 12, 787283. [Google Scholar] [CrossRef]
  54. Zhang, Y.; Zhang, S.; Zhang, G.; Liu, X.; Wang, C.; Xu, J. Comparison of mitochondrial genomes provides insights into intron dynamics and evolution in the caterpillar fungus Cordyceps militaris. Fungal Genet. Biol. 2015, 77, 95–107. [Google Scholar] [CrossRef]
  55. Blakely, E.L.; Yarham, J.W.; Alston, C.L.; Craig, K.; Poulton, J.; Brierley, C.; Taylor, R.W. Pathogenic Mitochondrial t RNA Point Mutations: Nine Novel Mutations Affirm Their Importance as a Cause of Mitochondrial Disease. Hum. Mutat. 2013, 34, 1260–1268. [Google Scholar] [CrossRef]
  56. Yarham, J.W.; Elson, J.L.; Blakely, E.L.; McFarland, R.; Taylor, R.W. Mitochondrial tRNA mutations and disease. WIRES RNA 2010, 1, 304–324. [Google Scholar] [CrossRef]
  57. Pang, Y.L.J.; Poruri, K.; Martinis, S.A. tRNA synthetase: tRNA aminoacylation and beyond. WIRES RNA 2014, 5, 461–480. [Google Scholar] [CrossRef]
  58. Chen, C.; Li, Q.; Fu, R.; Wang, J.; Xiong, C.; Fan, Z.; Lu, D. Characterization of the mitochondrial genome of the pathogenic fungus Scytalidium auriculariicola (Leotiomycetes) and insights into its phylogenetics. Sci. Rep. 2019, 9, 17447. [Google Scholar] [CrossRef]
  59. Ma, Q.; Geng, Y.; Li, Q.; Cheng, C.; Zang, R.; Guo, Y.; Zhang, M. Comparative mitochondrial genome analyses reveal conserved gene arrangement but massive expansion/contraction in two closely related Exserohilum pathogens. Comput. Struct. Biotechnol. J. 2022, 20, 1456–1469. [Google Scholar] [CrossRef]
  60. Mamut, R.; FANG, J.J.; Anwar, G. Characterization and phylogenetic analysis of Ramalina sinensis mitogenome. Mycosystema 2023, 42, 1273–1284. [Google Scholar] [CrossRef]
  61. FANG, J.J.; Payzulla, T.; Anwar, G.; Mamut, R. Mitochondrial genome characteristics and phylogeny of Usnea lapponica. Genom. Appl. Biol. 2023, 42, 73–83. [Google Scholar] [CrossRef]
  62. Li, Q.; Yang, M.; Chen, C.; Xiong, C.; Jin, X.; Pu, Z.; Huang, W. Characterization and phylogenetic analysis of the complete mitochondrial genome of the medicinal fungus Laetiporus sulphureus. Sci. Rep. 2018, 8, 9104. [Google Scholar] [CrossRef]
  63. Li, Q.; Ren, Y.; Shi, X.; Peng, L.; Zhao, J.; Song, Y.; Zhao, G. Comparative mitochondrial genome analysis of two ectomycorrhizal fungi (Rhizopogon) reveals dynamic changes of intron and phylogenetic relationships of the subphylum Agaricomycotina. Int. J. Mol. Sci. 2019, 20, 5167. [Google Scholar] [CrossRef]
  64. Bibi, S.; Wang, D.; Wang, Y.; Mustafa, G.; Yu, H. Mitogenomic and Phylogenetic Analysis of the Entomopathogenic Fungus Ophiocordyceps lanpingensis and Comparative Analysis with Other Ophiocordyceps Species. Genes 2023, 14, 710. [Google Scholar] [CrossRef]
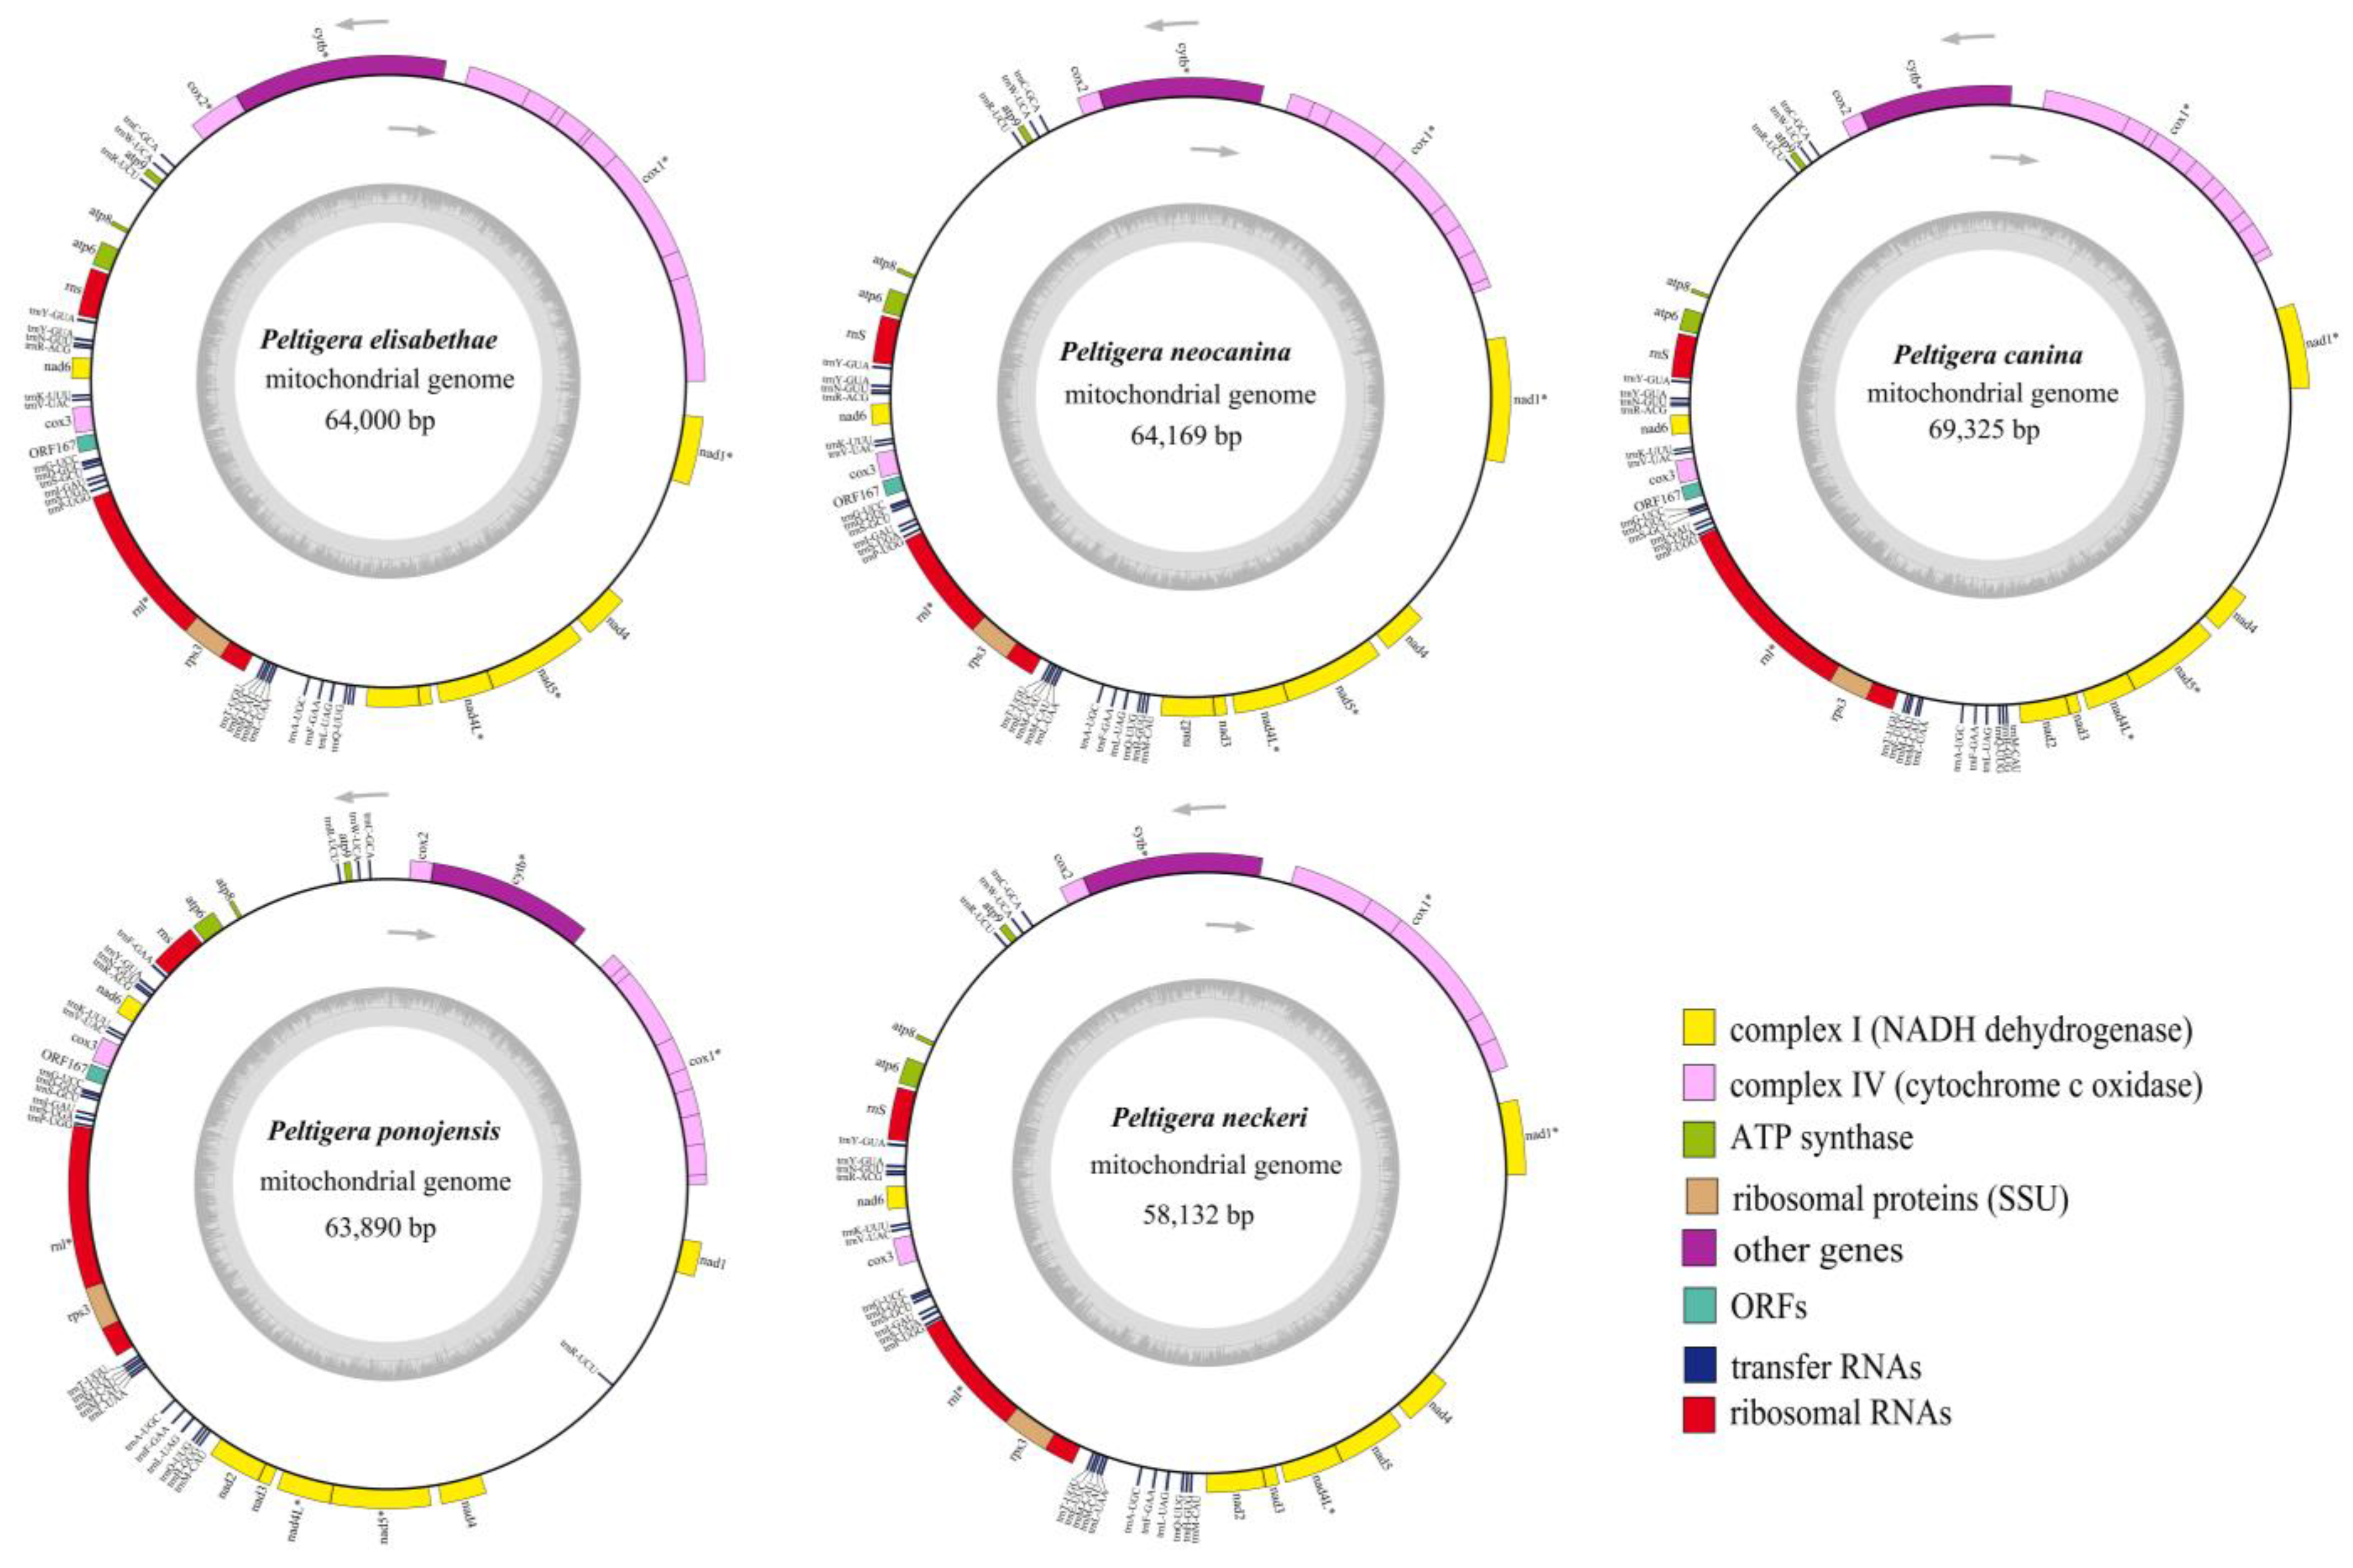
Figure 1. Circular maps of the five Peltigera mitogenomes. Genes with different functions are represented by different colors. The genes inside the circle are on the direct strand, and the genes outside the circle are on the reverse strand. Genes with introns are marked with *.
Jof 09 00969 g001
Figure 2. Predicted tRNA secondary structure in the five Peltigera mitogenomes. The green tRNAs are present in all five of the mitogenomes, the blue tRNA is present in four Peltigera species except P. ponojensis, and the purple tRNAs are only present in P. ponojensis. The G-U mismatch sites are shown in the red box.
Jof 09 00969 g002
Figure 3. Codon usage analysis of the five Peltigera mitogenomes. (a) P. elisabethae; (b) P. neocanina; (c) P. canina; (d) P. ponojensis; (e) P. neckeri. The X-axis represents the 20 standard amino acids that encode the protein, and below each of the amino acids is the codon that encodes the amino acid. The Y-axis represents the frequency of codon usage.
Jof 09 00969 g003
Figure 4. Repeats in the five Peltigera mitogenomes. From inside to outside, each circle represents interspersed repeats, simple repeats, tandem repeats and the position of protein-coding genes, respectively. Orange lines indicate forward repeats, blue lines indicate palindromic repeats and grey lines indicate reverse repeats.
Jof 09 00969 g004
Figure 5. Variation in the length and base composition of each of the 15 protein-coding genes (PCGs) in the 11 Peltigera mitogenomes. (a) PCG length variation; (b) GC content; (c) AT skew; (d) GC skew.
Jof 09 00969 g005
Figure 6. Genetic analysis of 15 protein-coding genes in the 11 Peltigera mitogenomes. K2P: the Kimura-2-parameter distance; Ka: non-synonymous substitution rate; Ks: synonymous substitution rate.
Jof 09 00969 g006
Figure 7. Comparative mitogenomic gene rearrangement analysis of the five Peltigera species using Mauve. Locally collinear blocks between different species were represented by the same color blocks. The five species sequenced in this study were displayed in bold.
Jof 09 00969 g007
Figure 8. Phylogeny of 11 Peltigera species based on the 14 core PCGs using the Bayesian inference (BI) and maximum likelihood (ML) methods, and with Cyirneyella variabilis was used as an outgroup. The numbers in the nodes represent bootstrap values (left) and Bayesian posterior probabilities (right). Section labels were lined up with those defined in Miadlikowska. The species and the accession numbers for the mitogenomes used in the phylogenetic analysis are provided in Supplementary Table S9.
Jof 09 00969 g008
Disclaimer/Publisher’s Note: The statements, opinions and data contained in all publications are solely those of the individual author(s) and contributor(s) and not of MDPI and/or the editor(s). MDPI and/or the editor(s) disclaim responsibility for any injury to people or property resulting from any ideas, methods, instructions or products referred to in the content.