
3D Printing Properties of Heat-Induced Sodium Alginate–Whey Protein Isolate Edible Gel

Abstract
1. Introduction
2. Results and Discussion
2.1. Rheological Properties of Gels
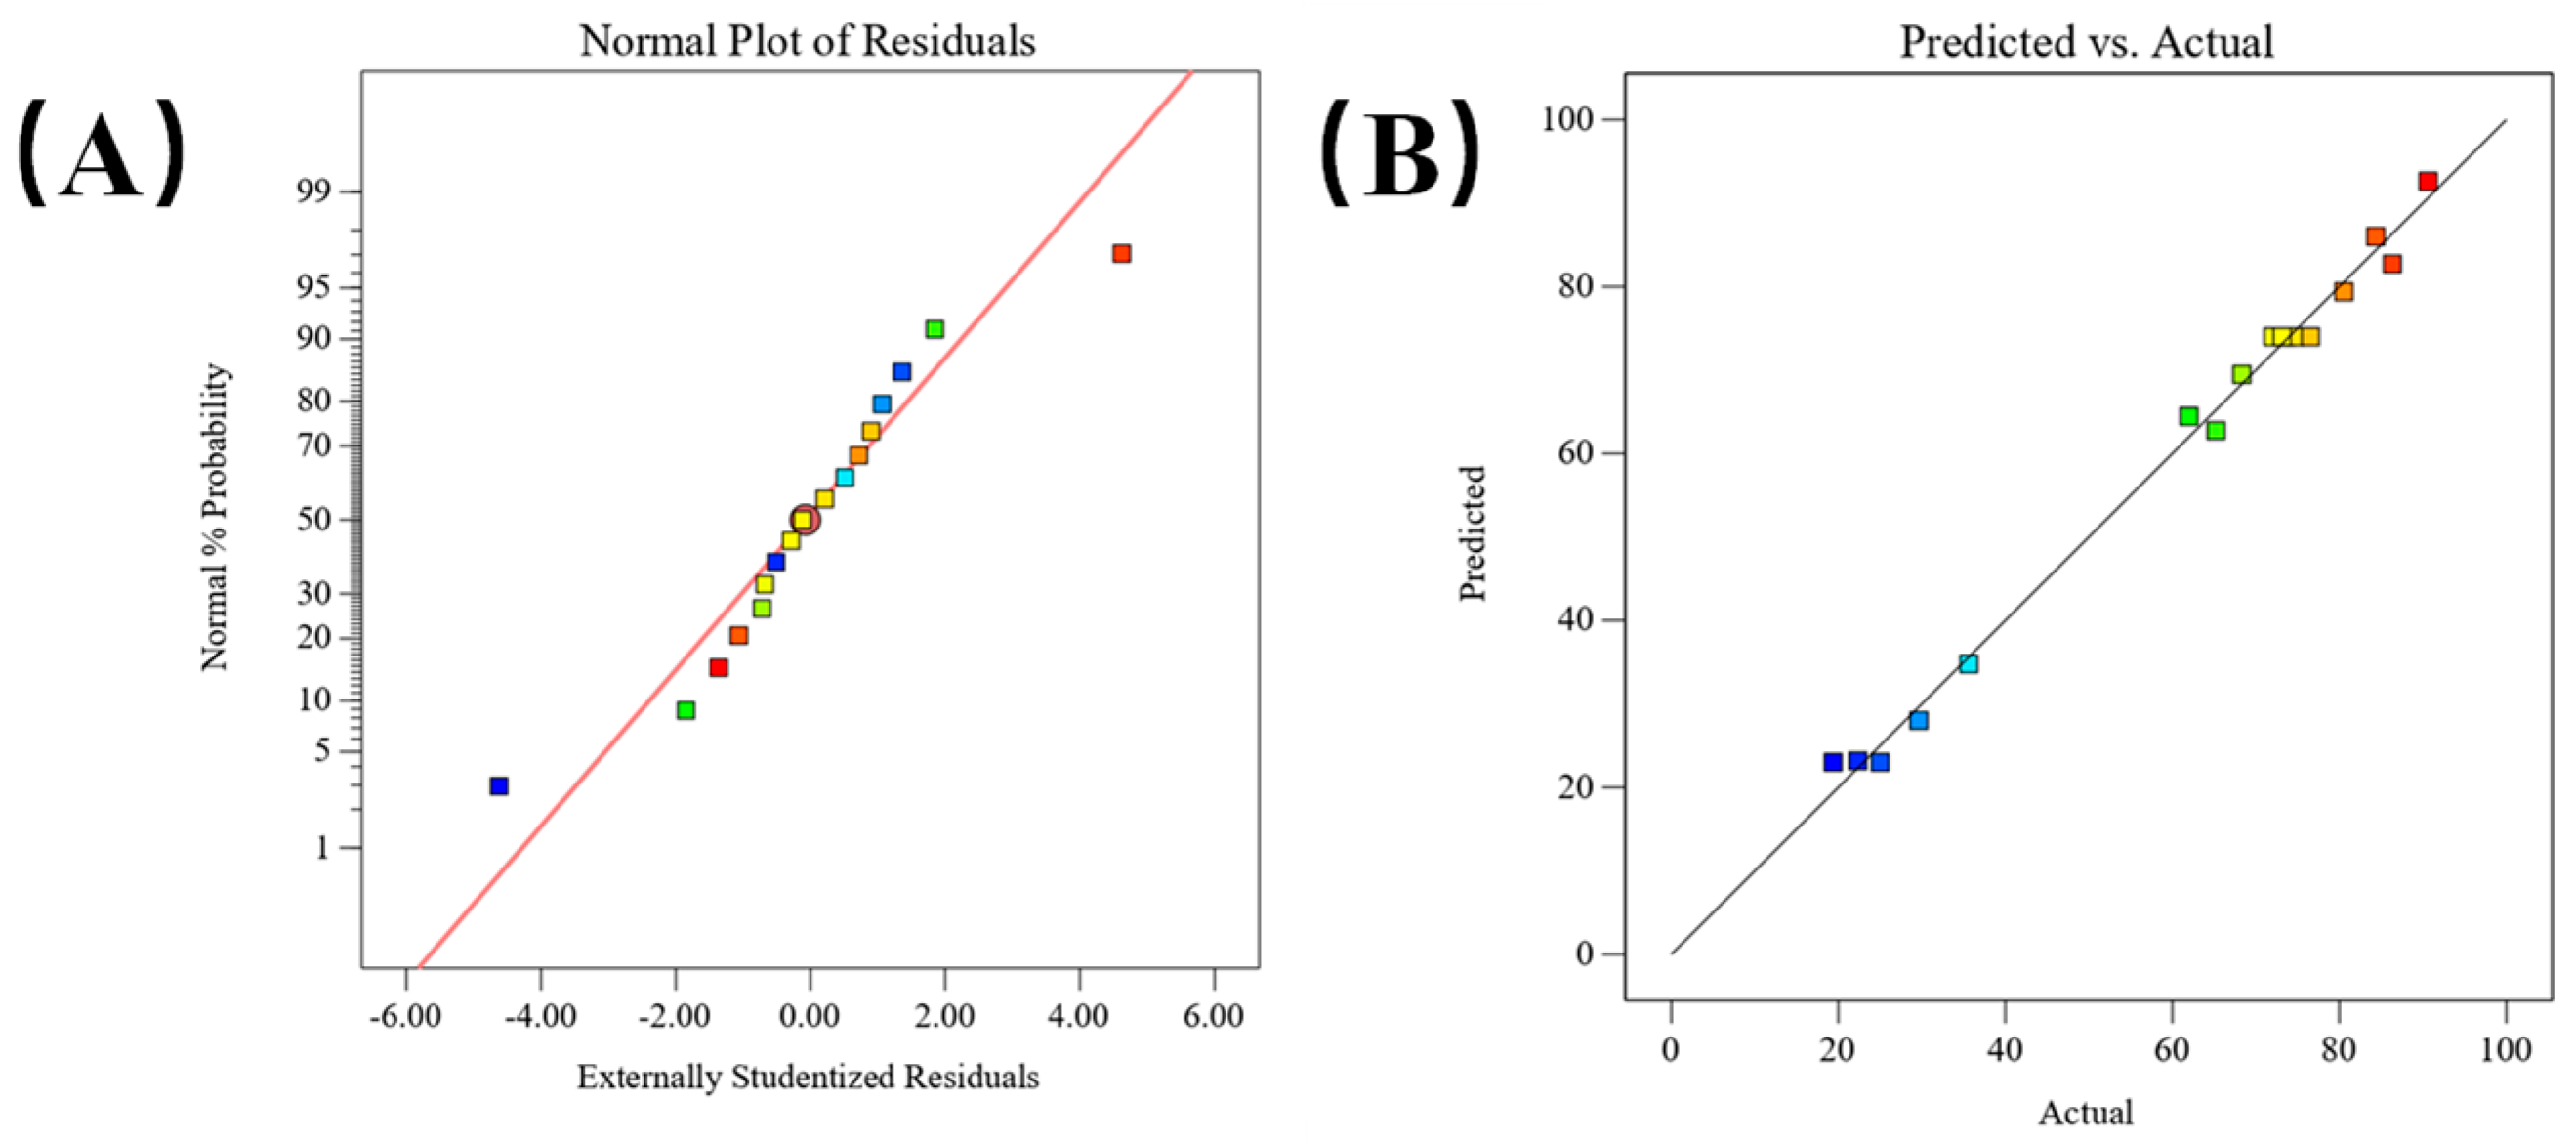
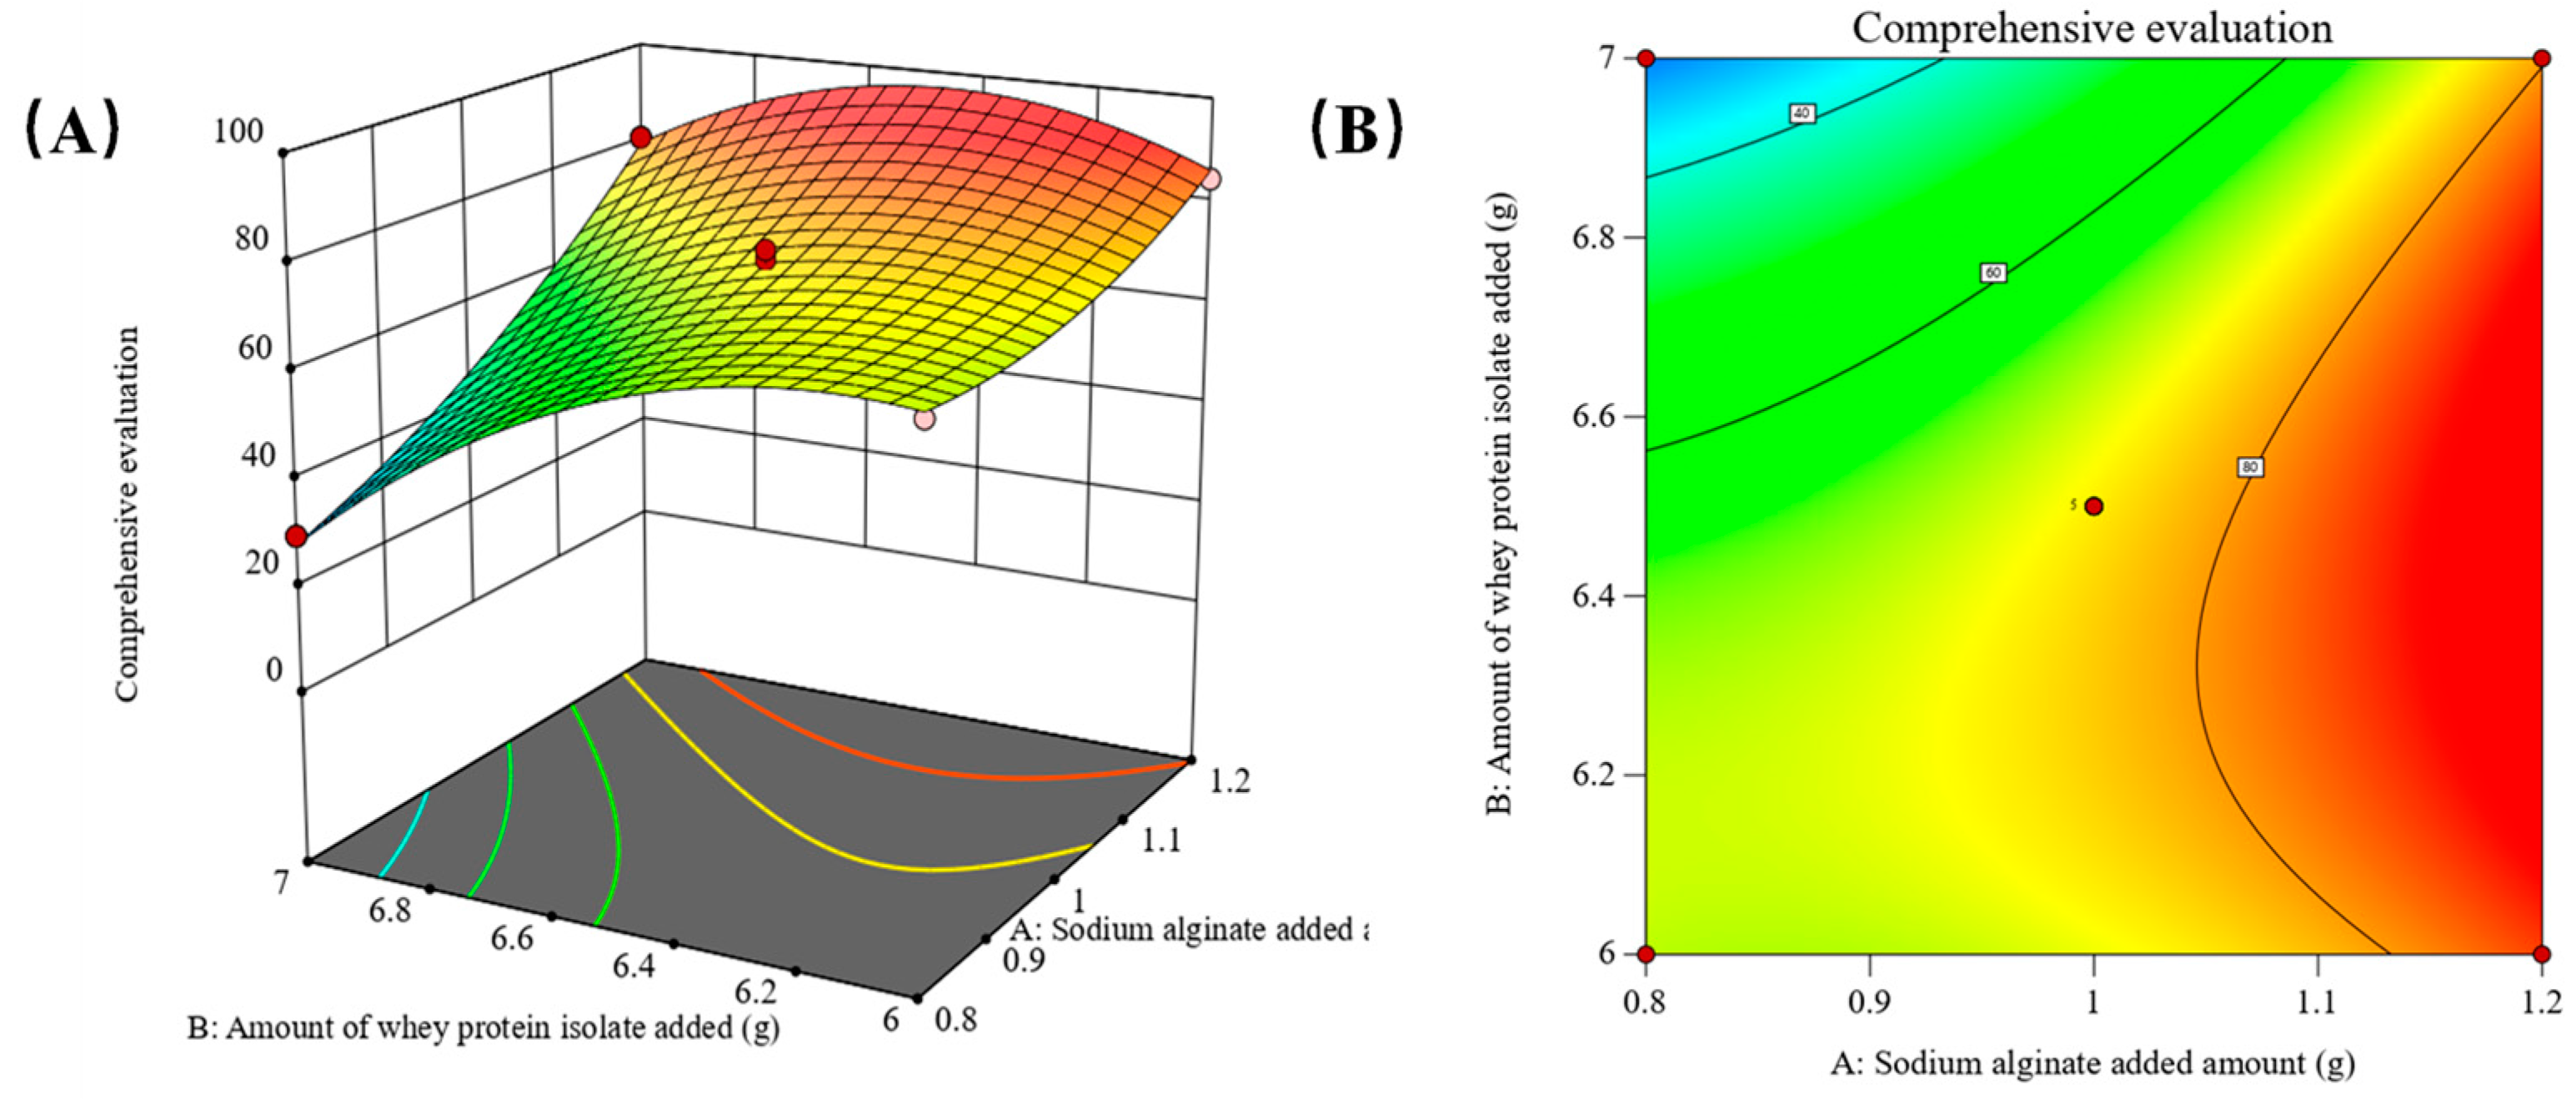
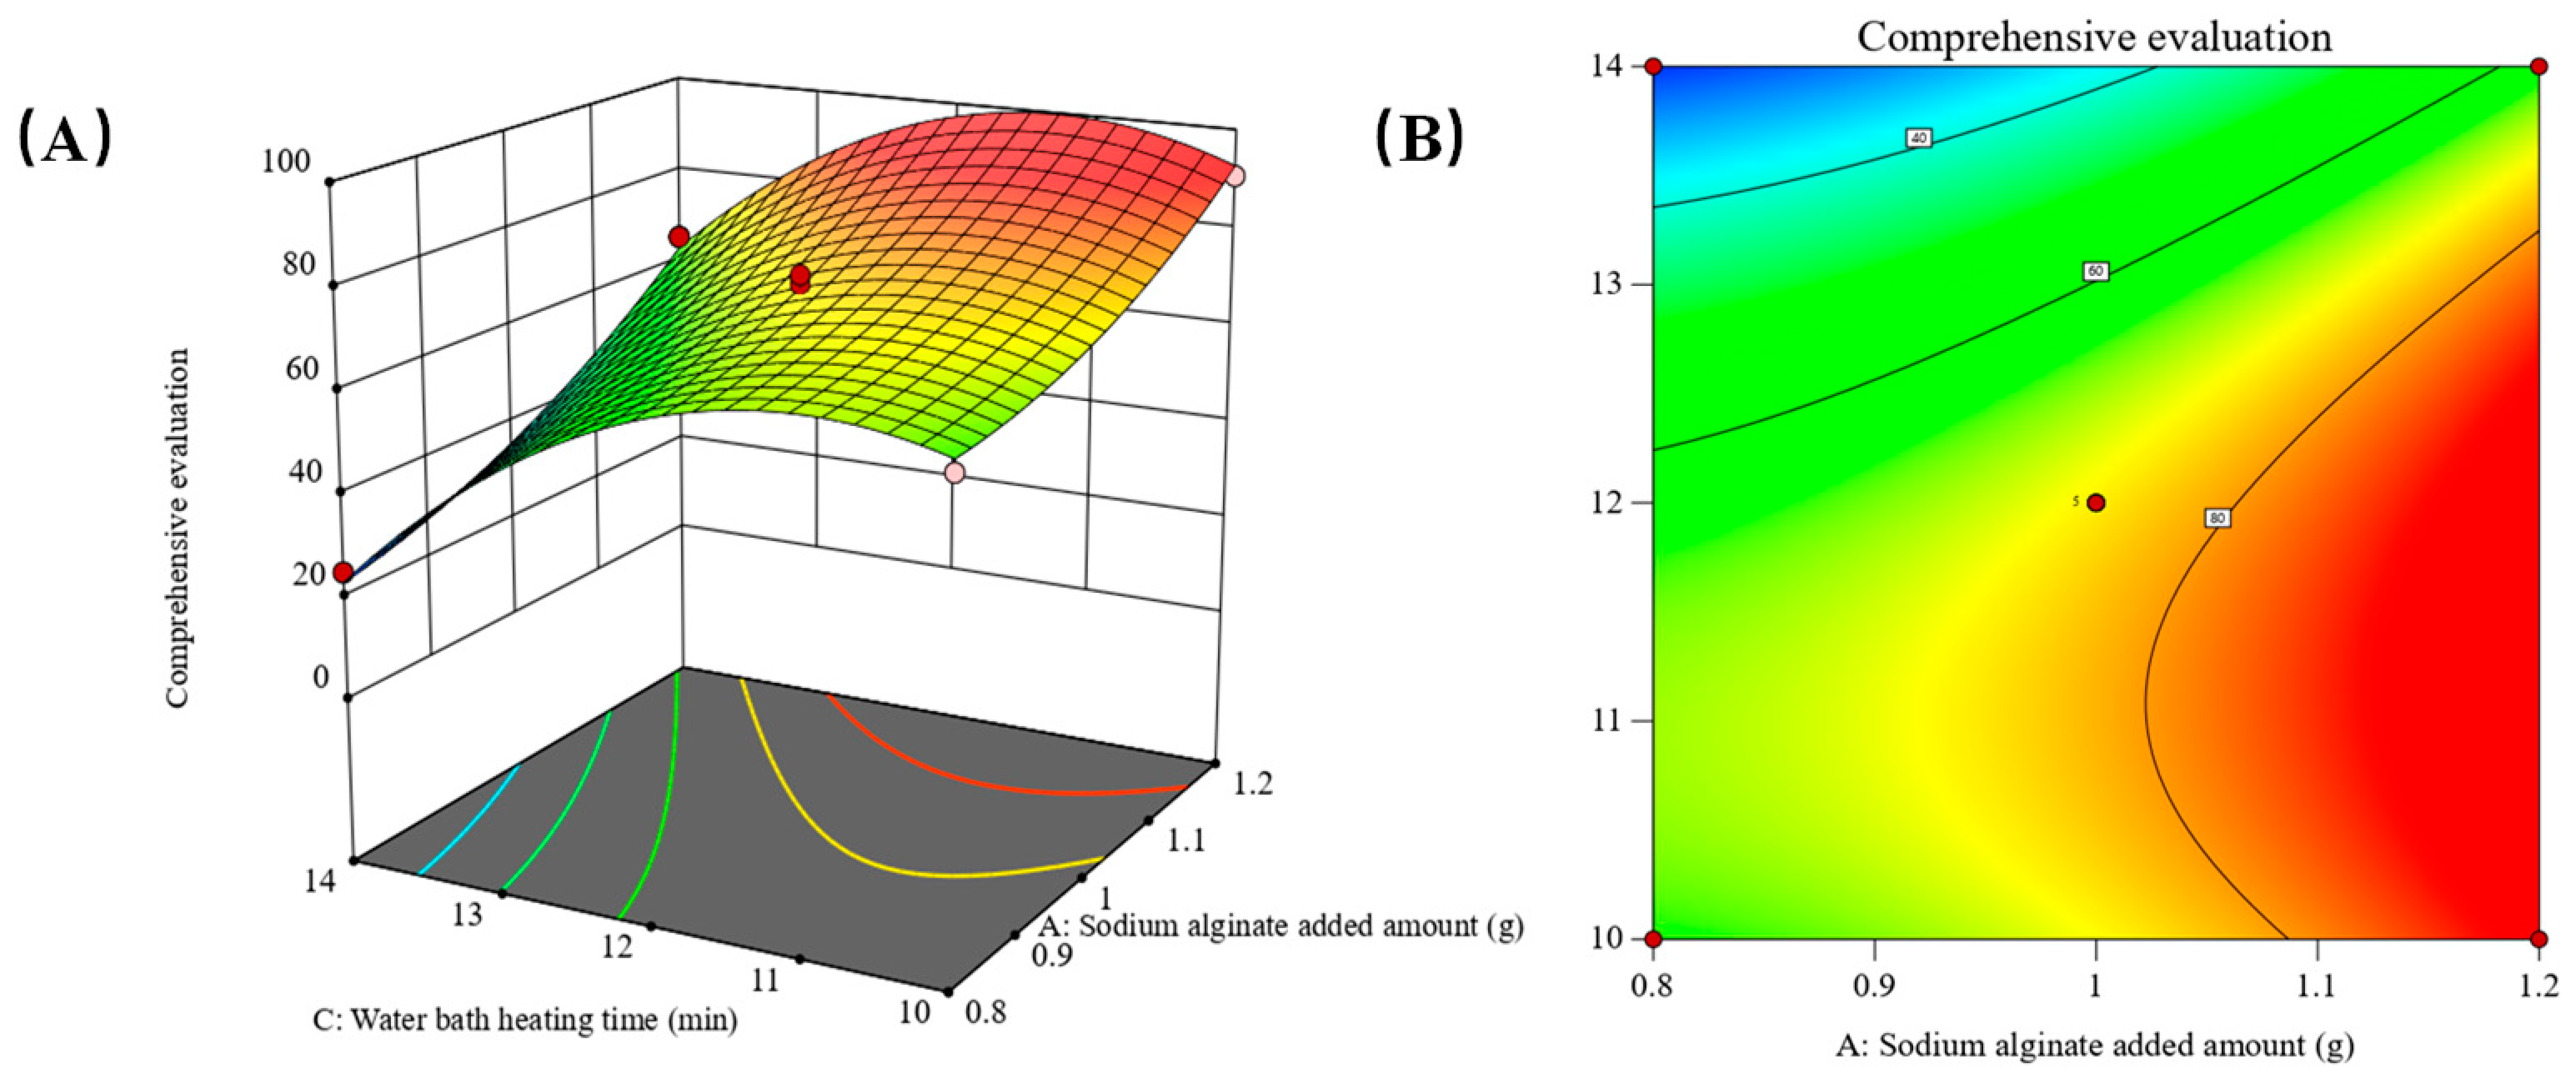
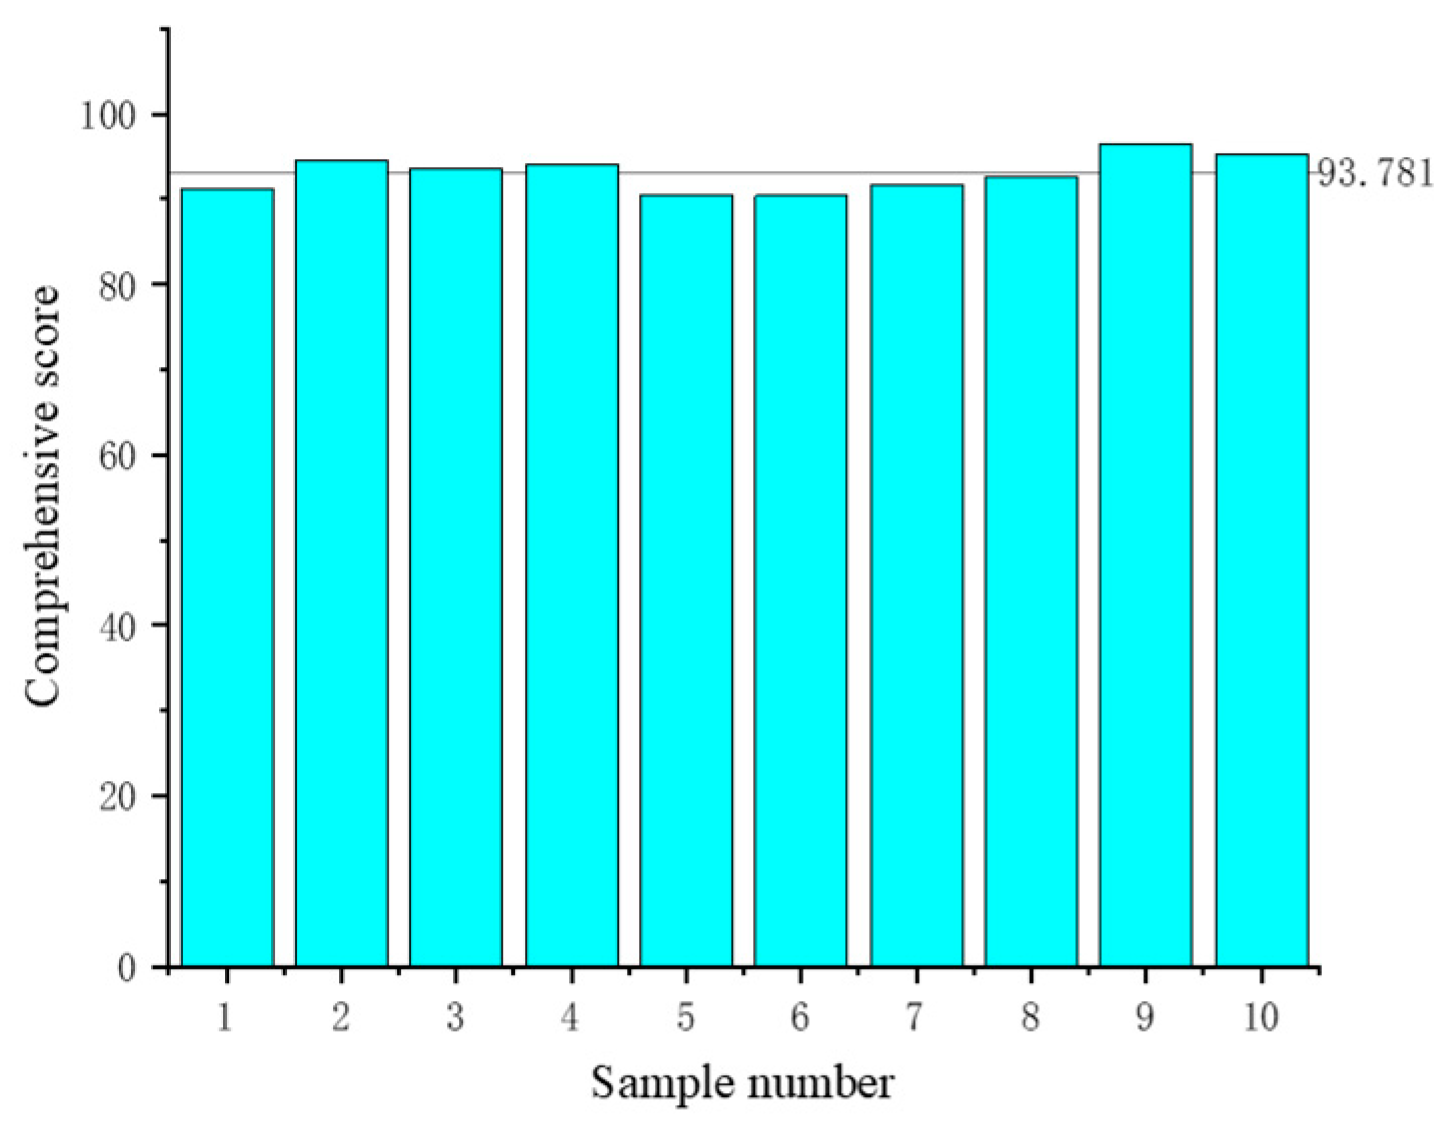
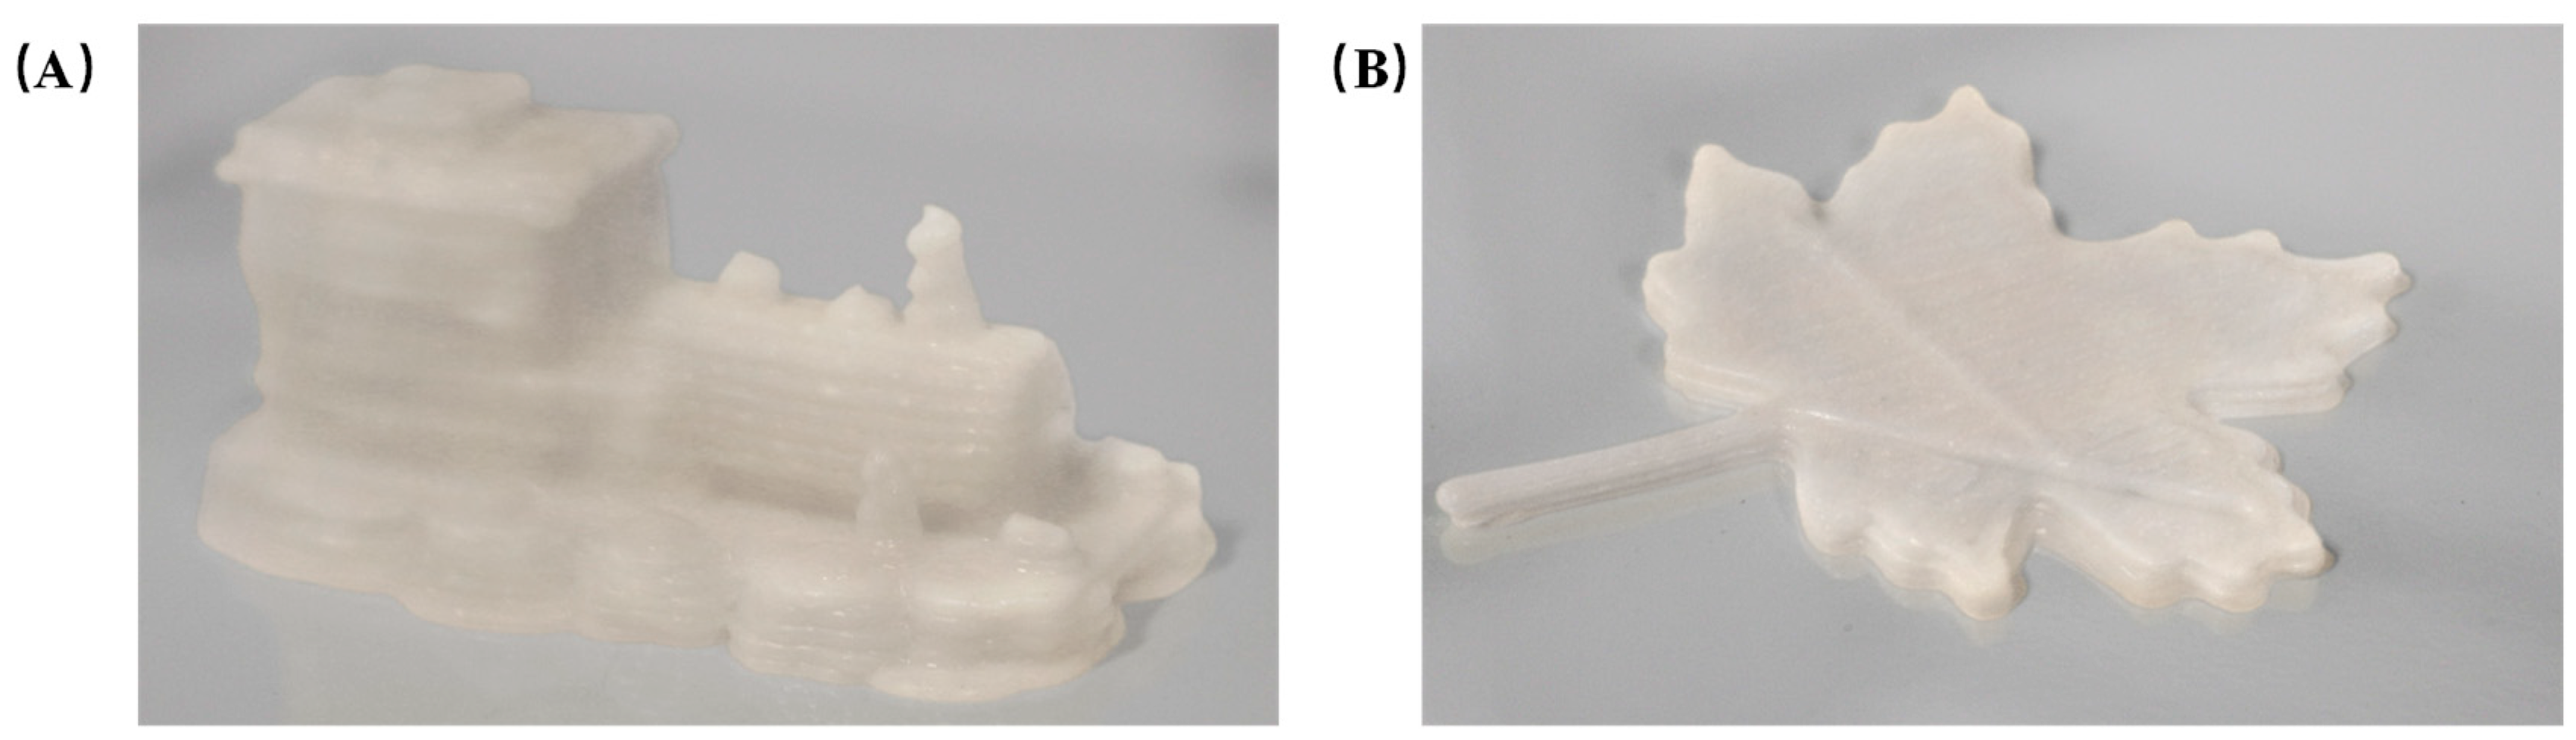
2.2. Parameter Optimization
2.3. Textural Properties
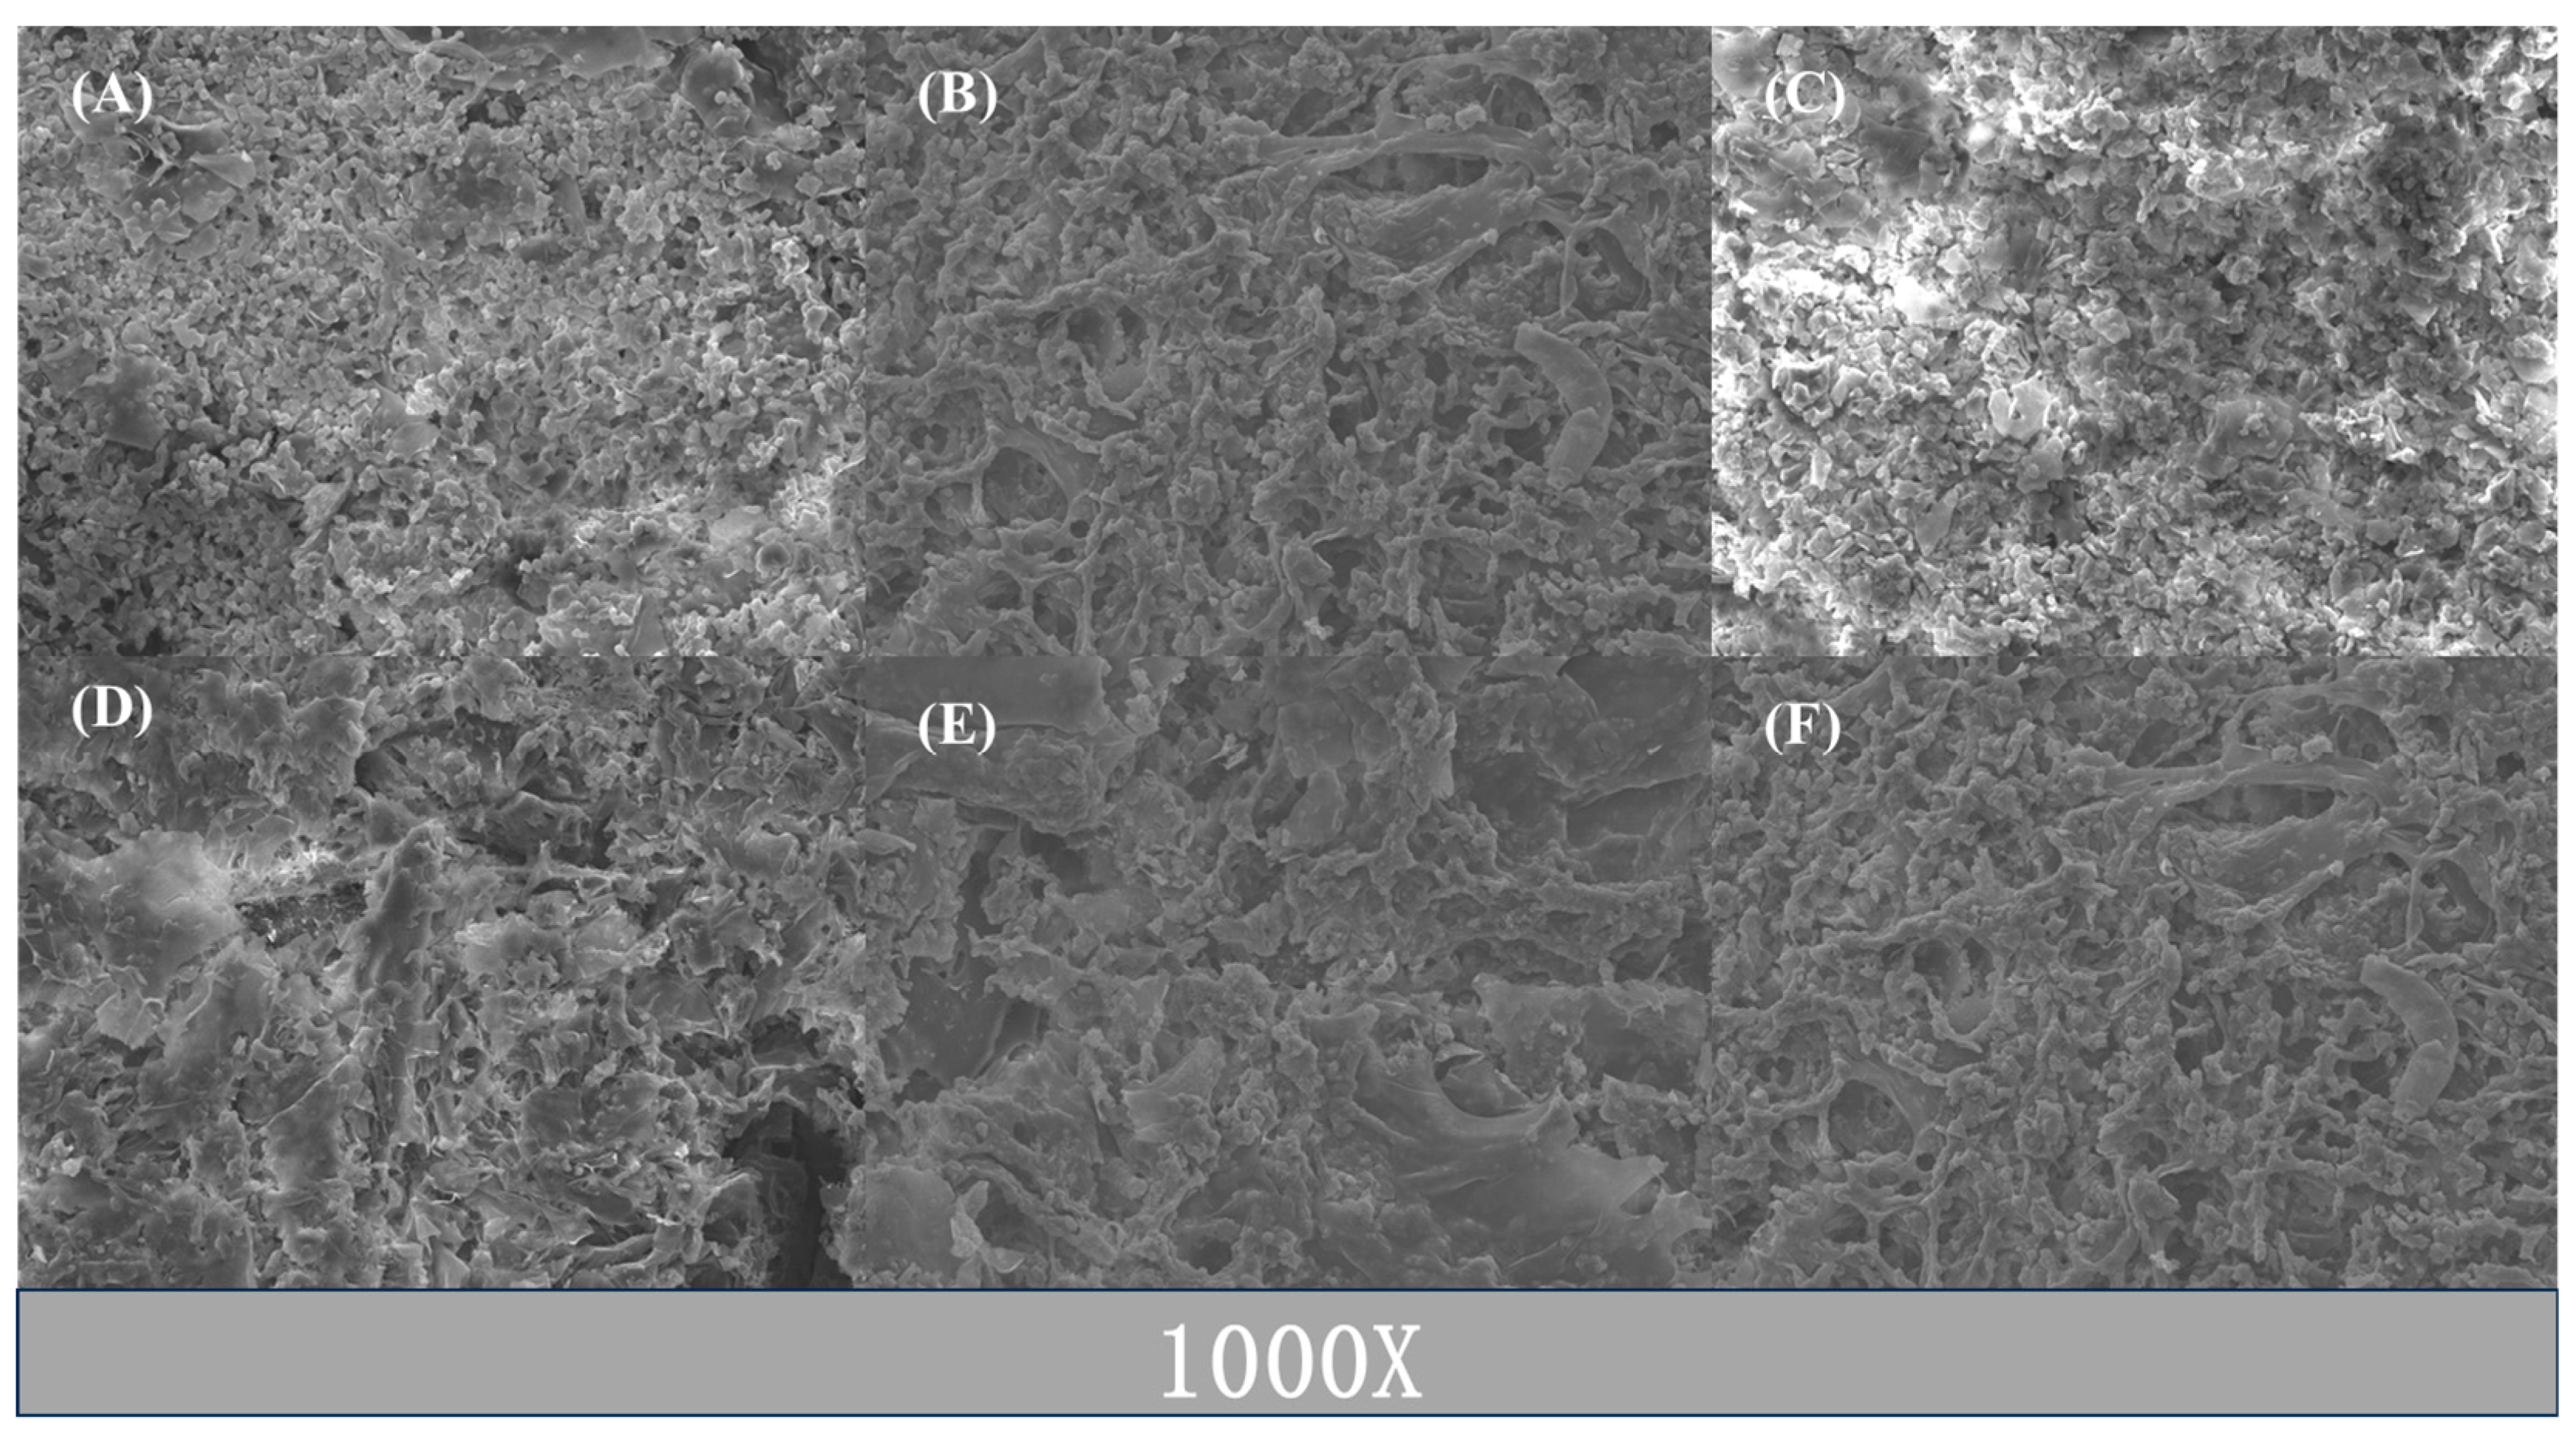
2.4. SEM Analysis
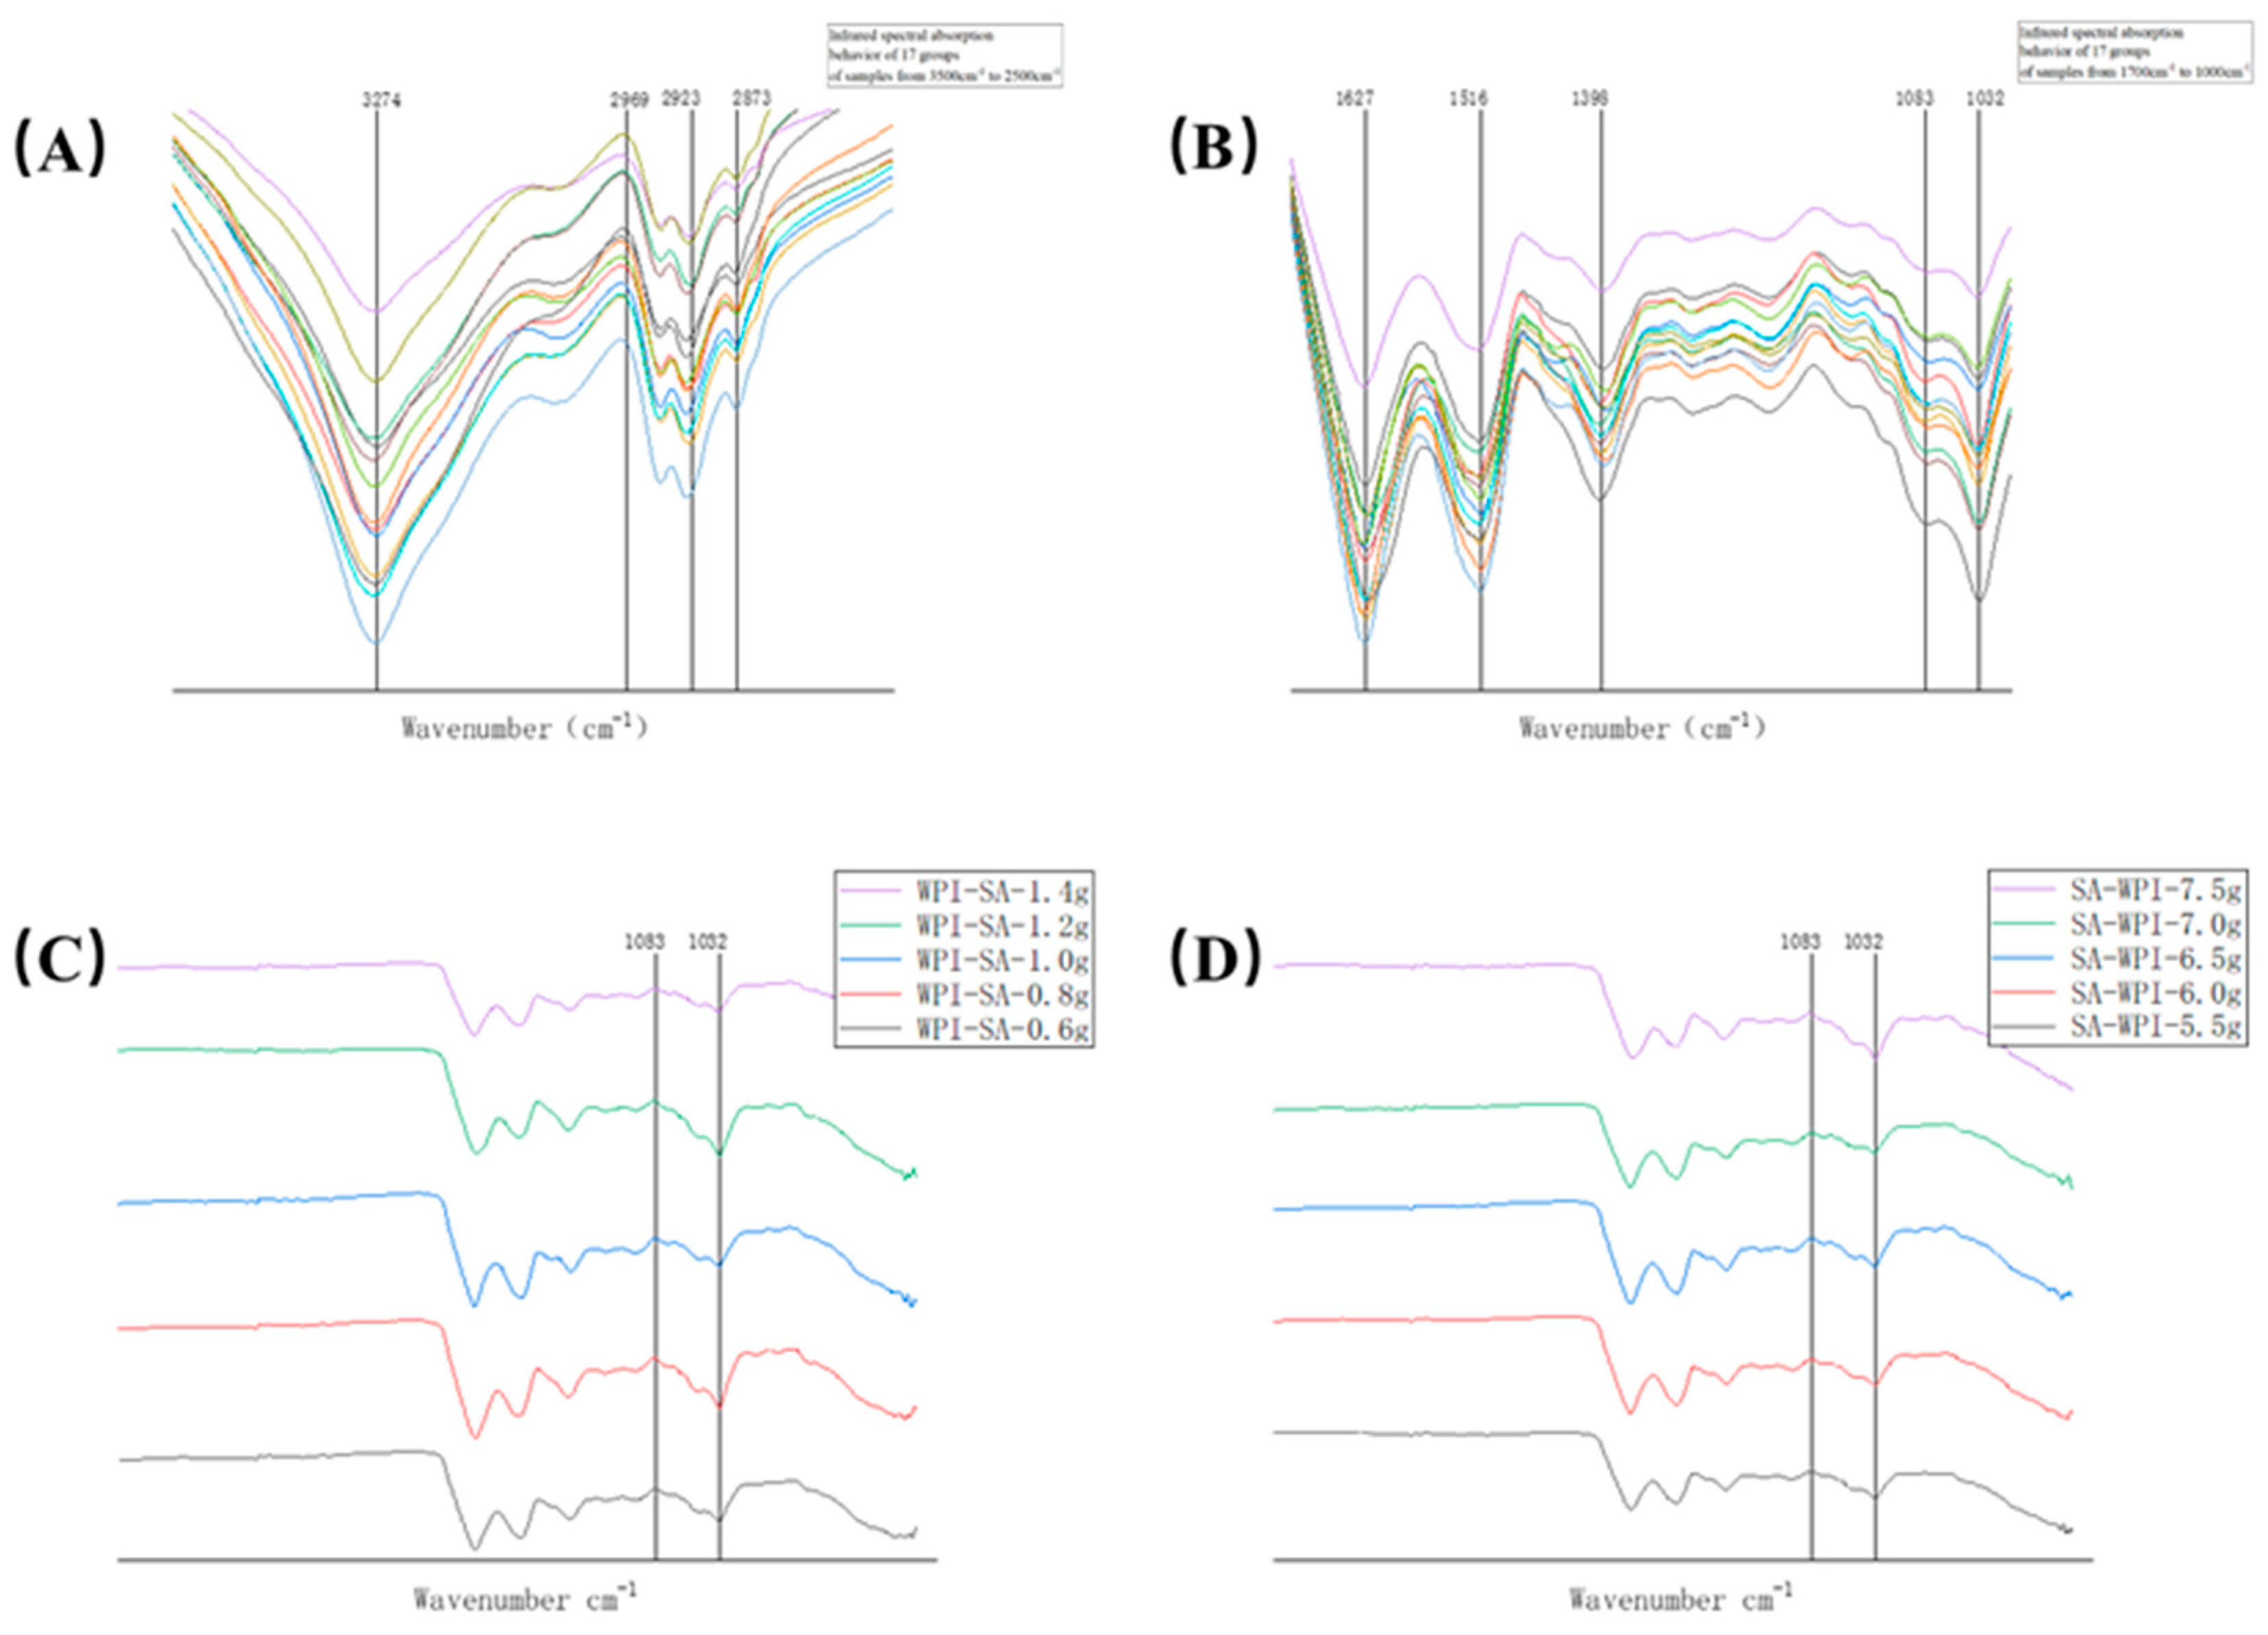
2.5. FTIR Analysis
3. Conclusions
4. Materials and Methods
4.1. Materials
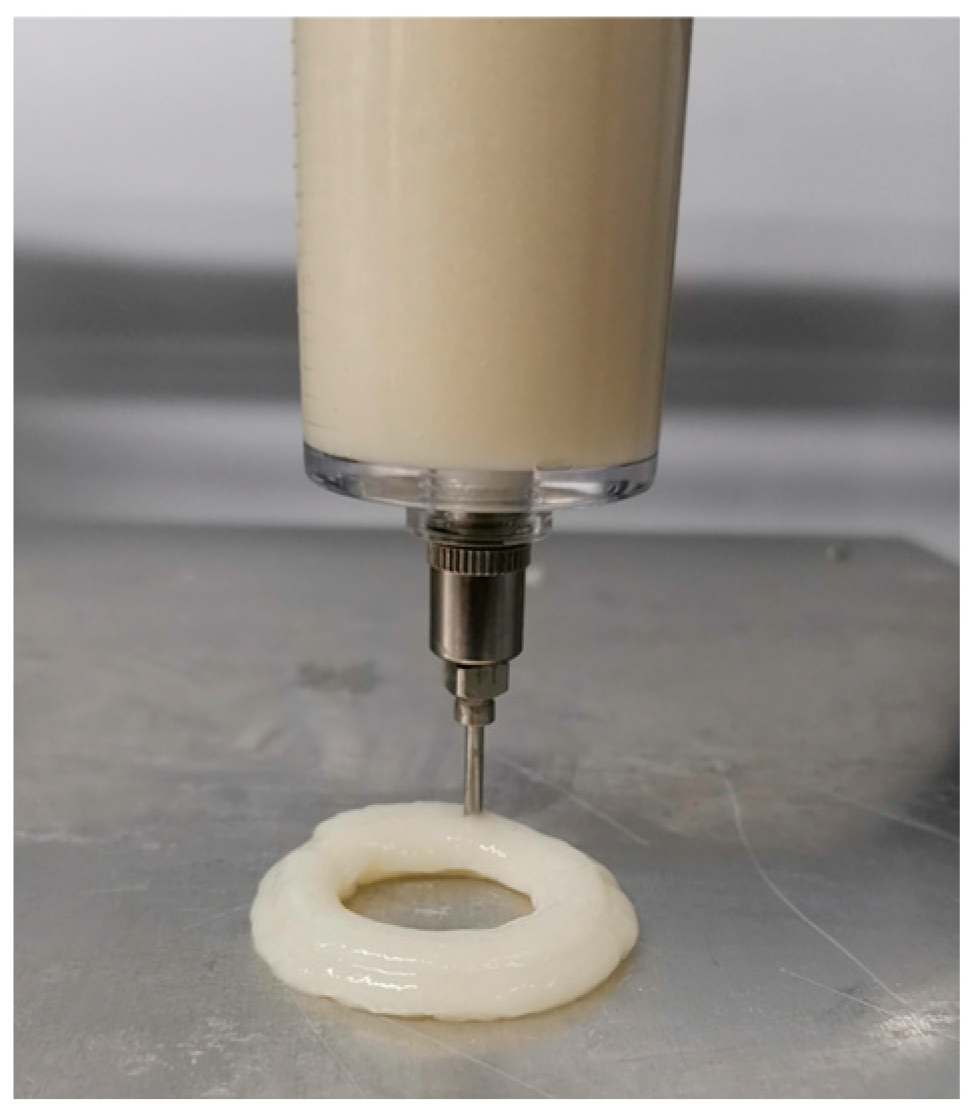
4.2. Preparation of WPI–SA Gel for 3D Printing
4.3. Model Design
4.4. Rheology Characterization
4.5. Parameter Optimization
4.5.1. Determination of the Range of Independent Variables through One-Way Experiments
4.5.2. Comprehensive Score of Printing Reduction Degree
4.5.3. Response Surface Method
4.6. Textural Analysis of Gels
4.7. Scanning Electron Microscope (SEM)
4.8. Fourier Infrared Spectroscopy
4.9. Statistical Analysis
Author Contributions
Funding
Institutional Review Board Statement
Informed Consent Statement
Data Availability Statement
Conflicts of Interest
References
- Mamo, H.B.; Adamiak, M.; Kunwar, A. 3D printed biomedical devices and their applications: A review on state-of-the-art technologies, existing challenges, and future perspectives. J. Mech. Behav. Biomed. Mater. 2023, 143, 105930. [Google Scholar] [CrossRef]
- Liu, Z.; Chen, X.; Dai, Q.; Xu, D.; Hu, L.; Li, H.; Hati, S.; Chitrakar, B.; Yao, L.; Mo, H. Pea protein-xanthan gum interaction driving the development of 3D printed dysphagia diet. Food Hydrocoll. 2023, 139, 108497. [Google Scholar] [CrossRef]
- Froes, F. 19—Combining additive manufacturing with conventional casting and reduced density materials to greatly reduce the weight of airplane components such as passenger seat frames. In Additive Manufacturing for the Aerospace Industry; Froes, F., Boyer, R., Eds.; Elsevier: Amsterdam, The Netherlands, 2019; pp. 419–425. [Google Scholar]
- Molnar, F.; Rendeki, M.; Rendeki, S.; Nagy, B.; Bacher, V.; Bogar, P.; Schlegl, A.; Koltai, A.; Maroti, P.; Marovics, G. Validation of 3D printed MAYO tubes and stethoscope in simulated medical environment—Tools fabricated with additive manufacturing for emergency care. Heliyon 2023, 9, e20866. [Google Scholar] [CrossRef]
- Yang, F.; Zhang, M.; Prakash, S.; Liu, Y. Physical properties of 3D printed baking dough as affected by different compositions. Innov. Food Sci. Emerg. Technol. 2018, 49, 202–210. [Google Scholar] [CrossRef]
- Cao, F.; Chen, R.; Li, Y.; Han, R.; Li, F.; Shi, H.; Jiao, Y. Effects of NaCl and MTGase on printability and gelling properties of extrusion-based 3D printed white croaker (Argyrosomus argentatus) surimi. LWT 2022, 164, 113646. [Google Scholar] [CrossRef]
- Nida, S.; Moses, J.A.; Anandharamakrishnan, C. Converting fruit waste to 3D printed food package casings: The case of banana peel. Circ. Econ. 2023, 2, 100023. [Google Scholar] [CrossRef]
- Cheng, Z.; Qiu, Y.; Bian, M.; He, Y.; Xu, S.; Li, Y.; Ahmad, I.; Ding, Y.; Lyu, F. Effect of insoluble dietary fiber on printing properties and molecular interactions of 3D-printed soy protein isolate-wheat gluten plant-based meats. Int. J. Biol. Macromol. 2024, 258, 128803. [Google Scholar] [CrossRef]
- Karyappa, R.; Zhang, D.; Zhu, Q.; Ji, R.; Suwardi, A.; Liu, H. Newtonian liquid-assisted material extrusion 3D printing: Progress, challenges and future perspectives. Addit. Manuf. 2024, 79, 103903. [Google Scholar] [CrossRef]
- Li, G.; Wang, B.; Lv, W.; Mu, R.; Zhong, Y. Effect of induction mode on 3D printing characteristics of whey protein isolate emulsion gel. Food Hydrocoll. 2024, 146, 109255. [Google Scholar] [CrossRef]
- Zhu, F. Modifications of whey proteins for emulsion based applications: Current status, issues and prospectives. Food Res. Int. 2024, 178, 113935. [Google Scholar] [CrossRef] [PubMed]
- Liu, H.; Liu, C.; McClements, D.J.; Xu, X.; Bai, C.; Sun, Q.; Xu, F.; Dai, L. Reinforcement of heat-set whey protein gels using whey protein nanofibers: Impact of nanofiber morphology and pH values. Food Hydrocoll. 2024, 153, 109954. [Google Scholar] [CrossRef]
- Boutin, C.; Giroux, H.J.; Paquin, P.; Britten, M. Characterization and acid-induced gelation of butter oil emulsions produced from heated whey protein dispersions. Int. Dairy J. 2007, 17, 696–703. [Google Scholar] [CrossRef]
- Liang, B.; Feng, S.; Zhang, X.; Ye, Y.; Sun, C.; Ji, C.; Li, X. Physicochemical properties and in vitro digestion behavior of emulsion micro-gels stabilized by κ-carrageenan and whey protein: Effects of sodium alginate addition. Int. J. Biol. Macromol. 2024, 271, 132512. [Google Scholar] [CrossRef]
- Wei, Q.; Zhou, J.; An, Y.; Li, M.; Zhang, J.; Yang, S. Modification, 3D printing process and application of sodium alginate based hydrogels in soft tissue engineering: A review. Int. J. Biol. Macromol. 2023, 232, 123450. [Google Scholar] [CrossRef]
- Zahra, D.; Shokat, Z.; Ahmad, A.; Javaid, A.; Khurshid, M.; Ashfaq, U.A.; Nashwan, A.J. Exploring the recent developments of alginate silk fibroin material for hydrogel wound dressing: A review. Int. J. Biol. Macromol. 2023, 248, 125989. [Google Scholar] [CrossRef]
- Cui, Y.; Yang, F.; Wang, C.-s.; Blennow, A.; Li, C.; Liu, X. 3D Printing windows and rheological properties for normal maize starch/sodium alginate composite gels. Food Hydrocoll. 2024, 146, 109178. [Google Scholar] [CrossRef]
- Puyol, P.; Pérez, M.D.; Horne, D.S. Heat-induced gelation of whey protein isolates (WPI): Effect of NaCl and protein concentration. Food Hydrocoll. 2001, 15, 233–237. [Google Scholar] [CrossRef]
- Zhang, C.; Wang, C.-S.; Girard, M.; Therriault, D.; Heuzey, M.-C. 3D printed protein/polysaccharide food simulant for dysphagia diet: Impact of cellulose nanocrystals. Food Hydrocoll. 2024, 148, 109455. [Google Scholar] [CrossRef]
- Chow, C.Y.; Thybo, C.D.; Sager, V.F.; Riantiningtyas, R.R.; Bredie, W.L.P.; Ahrné, L. Printability, stability and sensory properties of protein-enriched 3D-printed lemon mousse for personalised in-between meals. Food Hydrocoll. 2021, 120, 106943. [Google Scholar] [CrossRef]
- Paswan, M.; Prajapati, V.; Dholakiya, B.Z. Optimization of biodegradable cross-linked guar-gum-PLA superabsorbent hydrogel formation employing response surface methodology. Int. J. Biol. Macromol. 2022, 223, 652–662. [Google Scholar] [CrossRef]
- Yang, G.; Tao, Y.; Wang, P.; Xu, X.; Zhu, X. Optimizing 3D printing of chicken meat by response surface methodology and genetic algorithm: Feasibility study of 3D printed chicken product. LWT 2022, 154, 112693. [Google Scholar] [CrossRef]
- Ji, S.; Xu, T.; Li, Y.; Li, H.; Zhong, Y.; Lu, B. Effect of starch molecular structure on precision and texture properties of 3D printed products. Food Hydrocoll. 2022, 125, 107387. [Google Scholar] [CrossRef]
- Zheng, L.-y.; Li, D.; Wang, L.-j.; Wang, Y. Tailoring 3D-printed high internal phase emulsion-rice starch gels: Role of amylose in rheology and bioactive stability. Carbohydr. Polym. 2024, 331, 121891. [Google Scholar] [CrossRef]
- Yin, Y.; Wang, Y.; Fang, Q.; Xiang, M.; Zhao, X.; Xu, X.; Li, C. Effects of pre-formulation and post-cooking method on the rheological and gelation properties of 3D printed chicken products. Food Chem. 2024, 446, 138857. [Google Scholar] [CrossRef]
- Li, M.; Liu, Z.; Yao Ho, J.; Neng Wong, T. Experimental investigation of fresh and time-dependent rheological properties of 3D-printed cementitious material. Therm. Sci. Eng. Prog. 2023, 45, 102089. [Google Scholar] [CrossRef]
- Hou, Y.; Sun, Y.; Zhang, P.; Wang, H.; Tan, M. Development and characterization of emulsion gels prepared via gliadin-based colloidal particles and gellan gum with tunable rheological properties for 3D printed dysphagia diet. Int. J. Biol. Macromol. 2023, 253, 126839. [Google Scholar] [CrossRef]
- Liu, Y.; Liang, X.; Saeed, A.; Lan, W.; Qin, W. Properties of 3D printed dough and optimization of printing parameters. Innov. Food Sci. Emerg. Technol. 2019, 54, 9–18. [Google Scholar] [CrossRef]
- Guénard-Lampron, V.; Liu, X.; Masson, M.; Blumenthal, D. Screening of different flours for 3D food printing: Optimization of thermomechanical process of soy and rye flour dough. Innov. Food Sci. Emerg. Technol. 2023, 87, 103394. [Google Scholar] [CrossRef]
- Li, Q.-H.; Li, S.-Y.; Yu, W.-K.; Xiao, J.-X.; Huang, G.-Q. Comparison of the 3D printability of high internal phase Pickering emulsions stabilized by protein—Polysaccharide complexes and process optimization. J. Food Eng. 2023, 353, 111548. [Google Scholar] [CrossRef]
- Shyam, R.; Palaniappan, A. Development and optimization of starch-based biomaterial inks and the effect of infill patterns on the mechanical, physicochemical, and biological properties of 3D printed scaffolds for tissue engineering. Int. J. Biol. Macromol. 2024, 258, 128986. [Google Scholar] [CrossRef] [PubMed]
- Chirico Scheele, S.; Binks, M.; Christopher, G.; Maleky, F.; Egan, P.F. Printability, texture, and sensory trade-offs for 3D printed potato with added proteins and lipids. J. Food Eng. 2023, 351, 111517. [Google Scholar] [CrossRef]
- Qiu, L.; Zhang, M.; Adhikari, B.; Lin, J.; Luo, Z. Preparation and characterization of 3D printed texture-modified food for the elderly using mung bean protein, rose powder, and flaxseed gum. J. Food Eng. 2024, 361, 111750. [Google Scholar] [CrossRef]
- Huang, P.-H.; Chiu, C.-S.; Chan, Y.-J.; Chen, S.-J.; Lu, W.-C.; Li, P.-H. Response Surface Analysis and Process Optimisation of adzuki bean (Vigna angularis) food paste production. J. Agric. Food Res. 2023, 14, 100855. [Google Scholar] [CrossRef]
- Feng, M.; Zhang, M.; Mujumdar, A.S.; Guo, Z. Influence of components interaction in recombined food gels on 3D printing: A comprehensive review. Food Hydrocoll. 2024, 151, 109782. [Google Scholar] [CrossRef]
- Chao, C.; Park, H.J.; Kim, H.W. Effect of l-cysteine on functional properties and fibrous structure formation of 3D-printed meat analogs from plant-based proteins. Food Chem. 2024, 439, 137972. [Google Scholar] [CrossRef]


| SA | WPI | Heating Time | |||||||||||||
|---|---|---|---|---|---|---|---|---|---|---|---|---|---|---|---|
| 0.6–1.4 g | 5.5–7.5 g | 8–16 min | |||||||||||||
| τ (Pa) | 25.75 | 44.13 | 65.74 | 127.91 | 197.55 | 35.26 | 57.22 | 65.74 | 139.37 | 192.34 | 49.660 | 55.340 | 65.740 | 141.671 | 157.340 |
| K (Pa∗Sn) | 88.0 ± 1.7 | 93.6 ± 1.4 | 110.1 ± 1.5 | 151.9 ± 2.1 | 187.8 ± 0.00 | 97.3 ± 1.3 | 101.3 ± 0.5 | 115.9 ± 2.5 | 154.5 ± 3.0 | 201.3 ± 3.7 | 59.200 ± 1.500 | 63.5 ± 1.6 | 113.400 ± 2.000 | 148.4 ± 3.2 | 204.5 ± 3.2 |
| n | 0.367 ± 0.007 | 0.450 ± 0.008 | 0.530 ± 0.013 | 0.593 ± 0.011 | 0.381 ± 0.006 | 0.447 ± 0.012 | 0.504 ± 0.011 | 0.567 ± 0.008 | 0.412 ± 0.008 | 0.430 ± 0.010 | 0.396 ± 0.008 | 0.379 ± 0.006 | 0.427 ± 0.010 | 0.425 ± 0.018 | 0.376 ± 0.004 |
| R2 | 0.99 | 1 | 1 | 1 | 0.99 | 0.99 | 1 | 0.99 | 1 | 0.99 | 0.99 | 1 | 0.99 | 0.99 | 0.99 |
| Source of Variance | Square Sum | Degrees of Freedom | Mean Square | F | p | Significance |
|---|---|---|---|---|---|---|
| Model | 9460.13 | 9 | 1051.13 | 108.55 | <0.0001 | ** |
| A | 2305.88 | 1 | 2305.88 | 238.14 | <0.0001 | ** |
| B | 1156.08 | 1 | 1156.08 | 119.39 | <0.0001 | ** |
| C | 2543.63 | 1 | 2543.63 | 262.69 | <0.0001 | ** |
| AB | 303.98 | 1 | 303.98 | 31.39 | 0.0008 | ** |
| AC | 33.47 | 1 | 33.47 | 3.46 | 0.1054 | |
| BC | 570.25 | 1 | 570.25 | 58.89 | 0.0001 | ** |
| A2 | 139.45 | 1 | 139.45 | 14.40 | 0.0068 | ** |
| B2 | 829.69 | 1 | 829.69 | 85.69 | <0.0001 | ** |
| C2 | 1526.81 | 1 | 1526.81 | 157.68 | <0.0001 | ** |
| Residual | 67.78 | 7 | 9.68 | |||
| Lost proposal | 56.21 | 3 | 18.74 | 6.48 | 0.0514 | |
| Pure error | 11.57 | 4 | 2.89 | |||
| Total variation | 9527.91 | 16 | ||||
| R2 | 0.9929 | |||||
| R2Adj | 0.9837 | |||||
| R2pre | 0.9037 | |||||
| Adeq Precision | 29.1717 | |||||
| C.V. % | 5.09 |
| Variant | Level of Factors | |||
|---|---|---|---|---|
| (Factors) | Unit | −1 | 0 | 1 |
| A Addition of sodium alginate | g | 0.8 | 1 | 1.2 |
| B Whey protein isolate addition | g | 6 | 6.5 | 7 |
| C Water-bath heating time | min | 10 | 12 | 14 |
Disclaimer/Publisher’s Note: The statements, opinions and data contained in all publications are solely those of the individual author(s) and contributor(s) and not of MDPI and/or the editor(s). MDPI and/or the editor(s) disclaim responsibility for any injury to people or property resulting from any ideas, methods, instructions or products referred to in the content. |
© 2024 by the authors. Licensee MDPI, Basel, Switzerland. This article is an open access article distributed under the terms and conditions of the Creative Commons Attribution (CC BY) license (https://creativecommons.org/licenses/by/4.0/).
Share and Cite
Li, Z.; Wang, S.; Qin, Z.; Fang, W.; Guo, Z.; Zou, X. 3D Printing Properties of Heat-Induced Sodium Alginate–Whey Protein Isolate Edible Gel. Gels 2024, 10, 425. https://doi.org/10.3390/gels10070425
Li Z, Wang S, Qin Z, Fang W, Guo Z, Zou X. 3D Printing Properties of Heat-Induced Sodium Alginate–Whey Protein Isolate Edible Gel. Gels. 2024; 10(7):425. https://doi.org/10.3390/gels10070425
Chicago/Turabian StyleLi, Zhihua, Siwen Wang, Zhou Qin, Wenbing Fang, Ziang Guo, and Xiaobo Zou. 2024. "3D Printing Properties of Heat-Induced Sodium Alginate–Whey Protein Isolate Edible Gel" Gels 10, no. 7: 425. https://doi.org/10.3390/gels10070425
APA StyleLi, Z., Wang, S., Qin, Z., Fang, W., Guo, Z., & Zou, X. (2024). 3D Printing Properties of Heat-Induced Sodium Alginate–Whey Protein Isolate Edible Gel. Gels, 10(7), 425. https://doi.org/10.3390/gels10070425