
Intensification of Droplet Disintegration for Liquid–Liquid Systems in a Pulsating Flow Type Apparatus by Adding an Inert Gas

Abstract
:1. Introduction
2. Theoretical Part
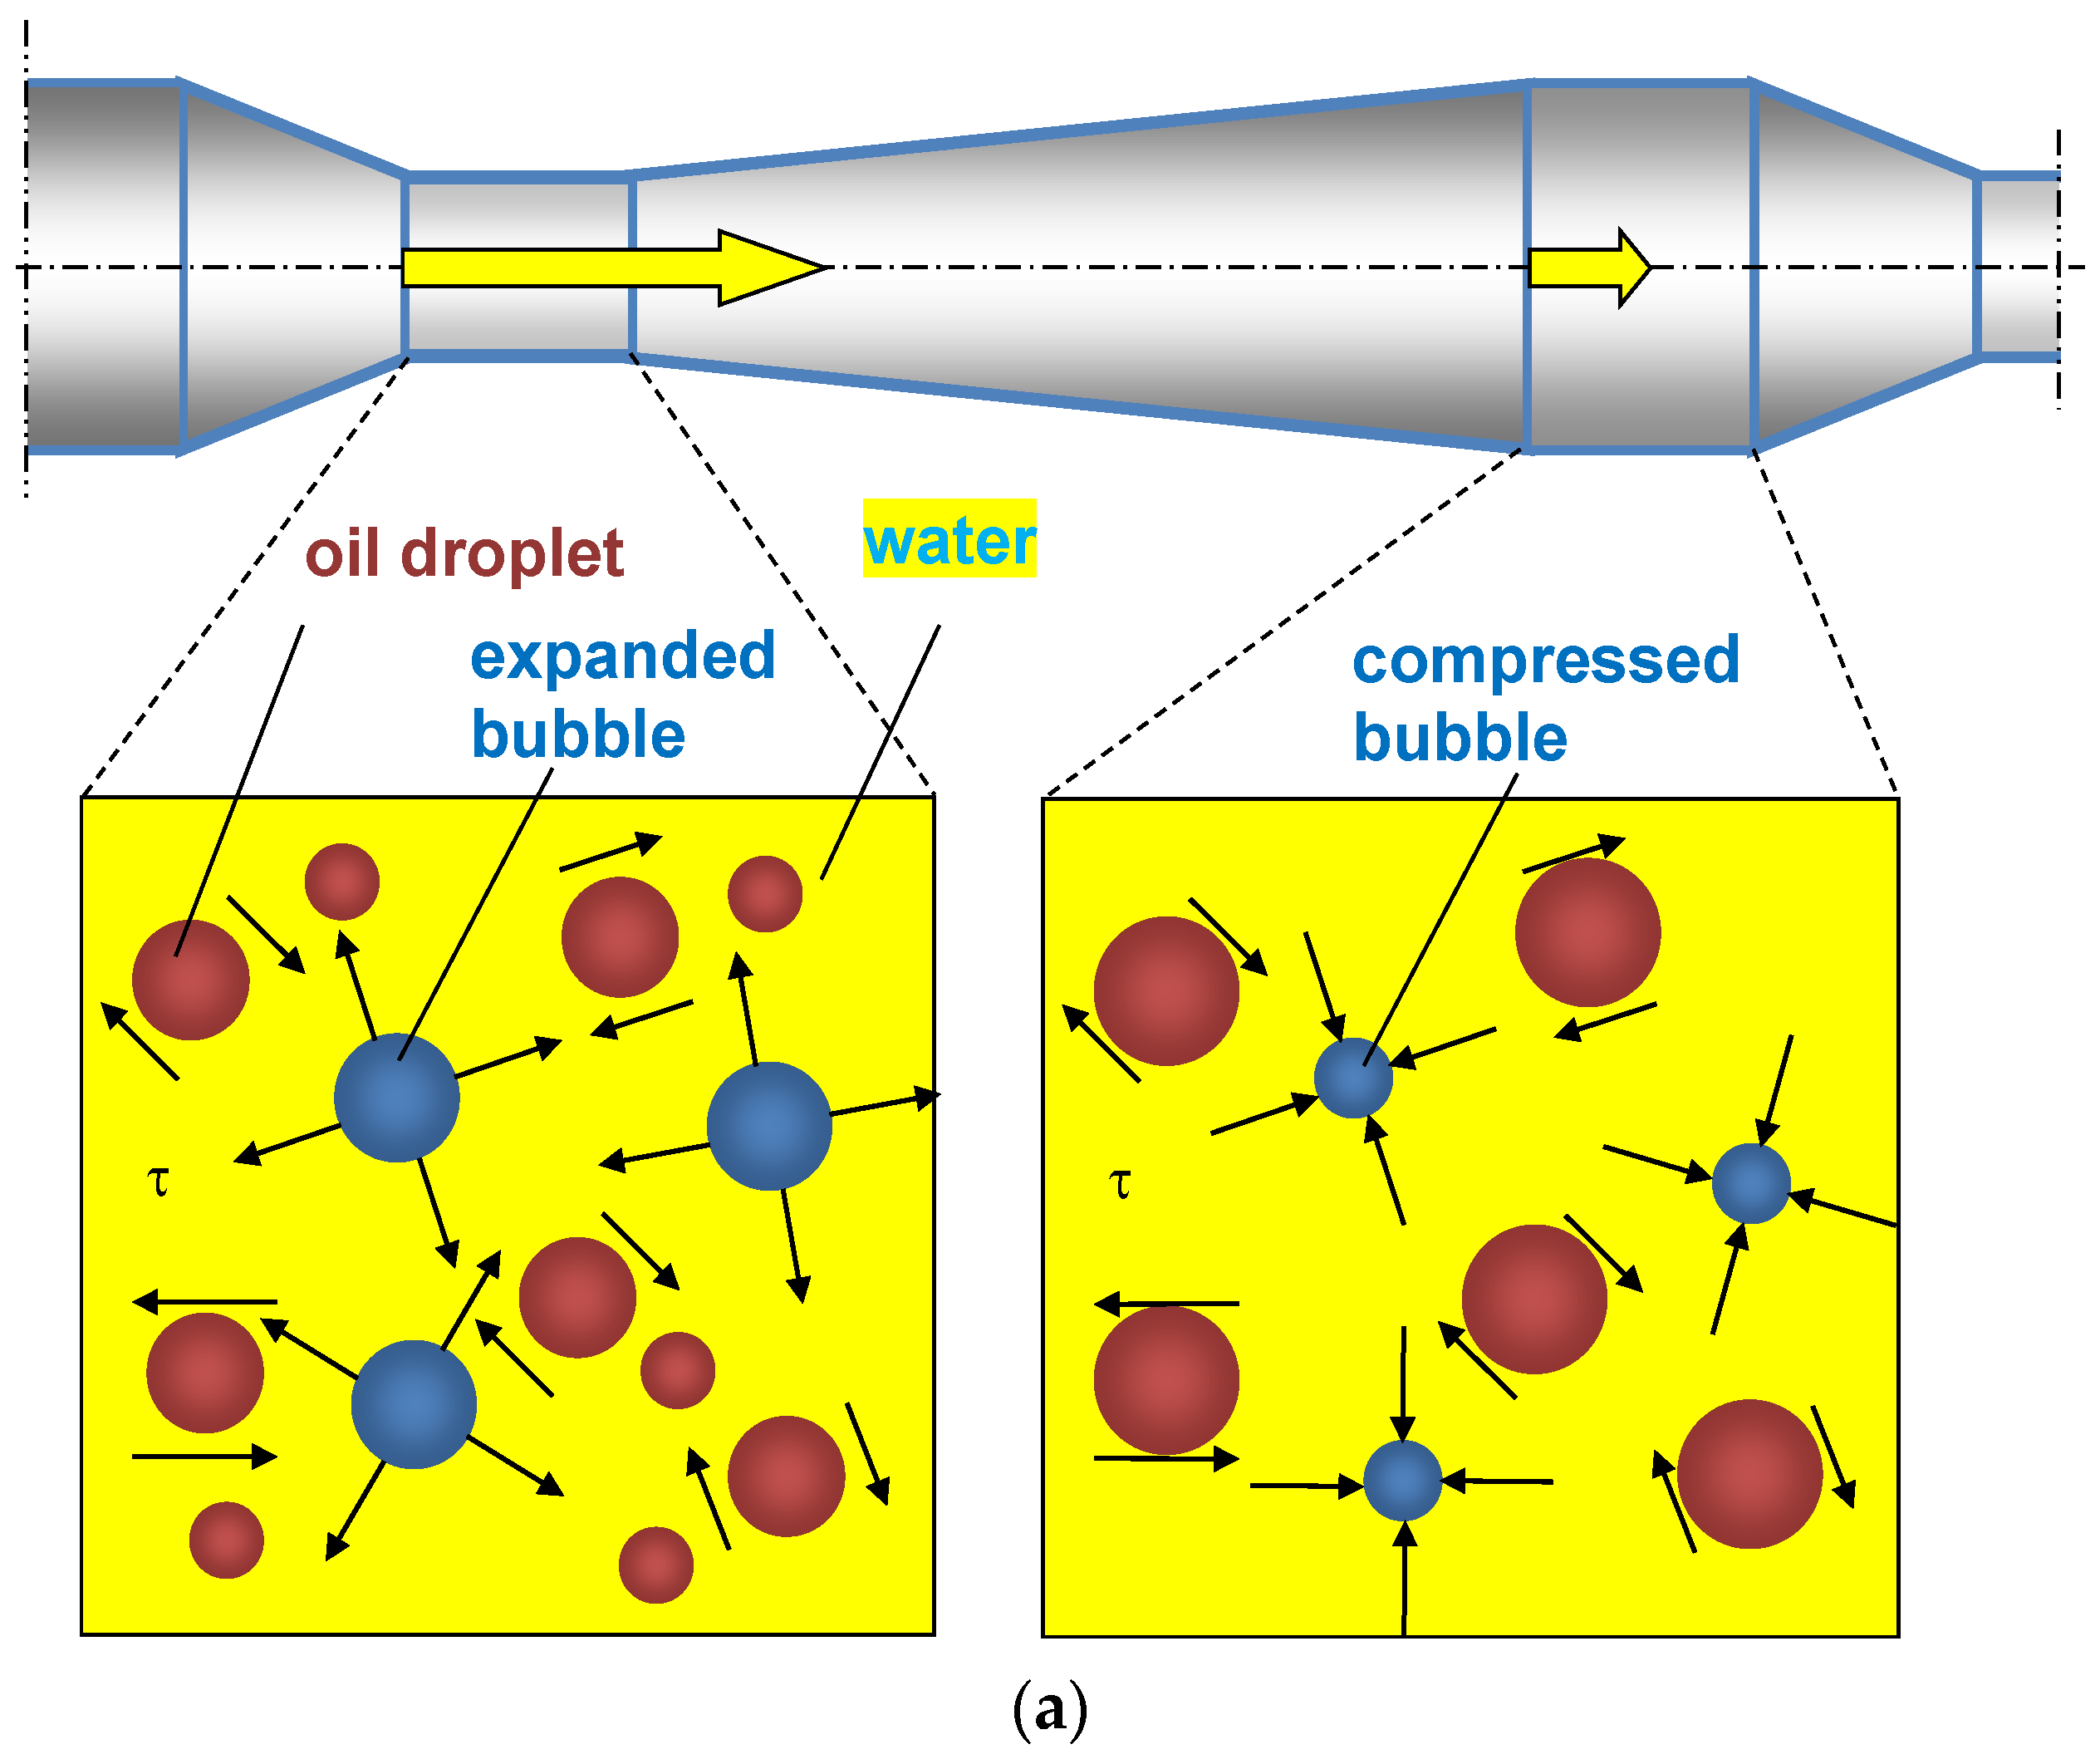
- The oscillations of bubbles cause additional shear stresses and local flows.
- The reduced rigidity of the gas–liquid mixture leads to an increase in the amplitude of droplet oscillations thanks to a decrease in acoustic impedance.
- Bubbles redistribute energy between particles.
- Gas bubbles act as pseudocavitation bubbles, where collapsed bubbles break up droplets.
- Gas bubbles expand along the axial coordinate of each PFA element, resulting in additional acceleration of the liquid.
3. Experimental Part
3.1. Materials and Methods
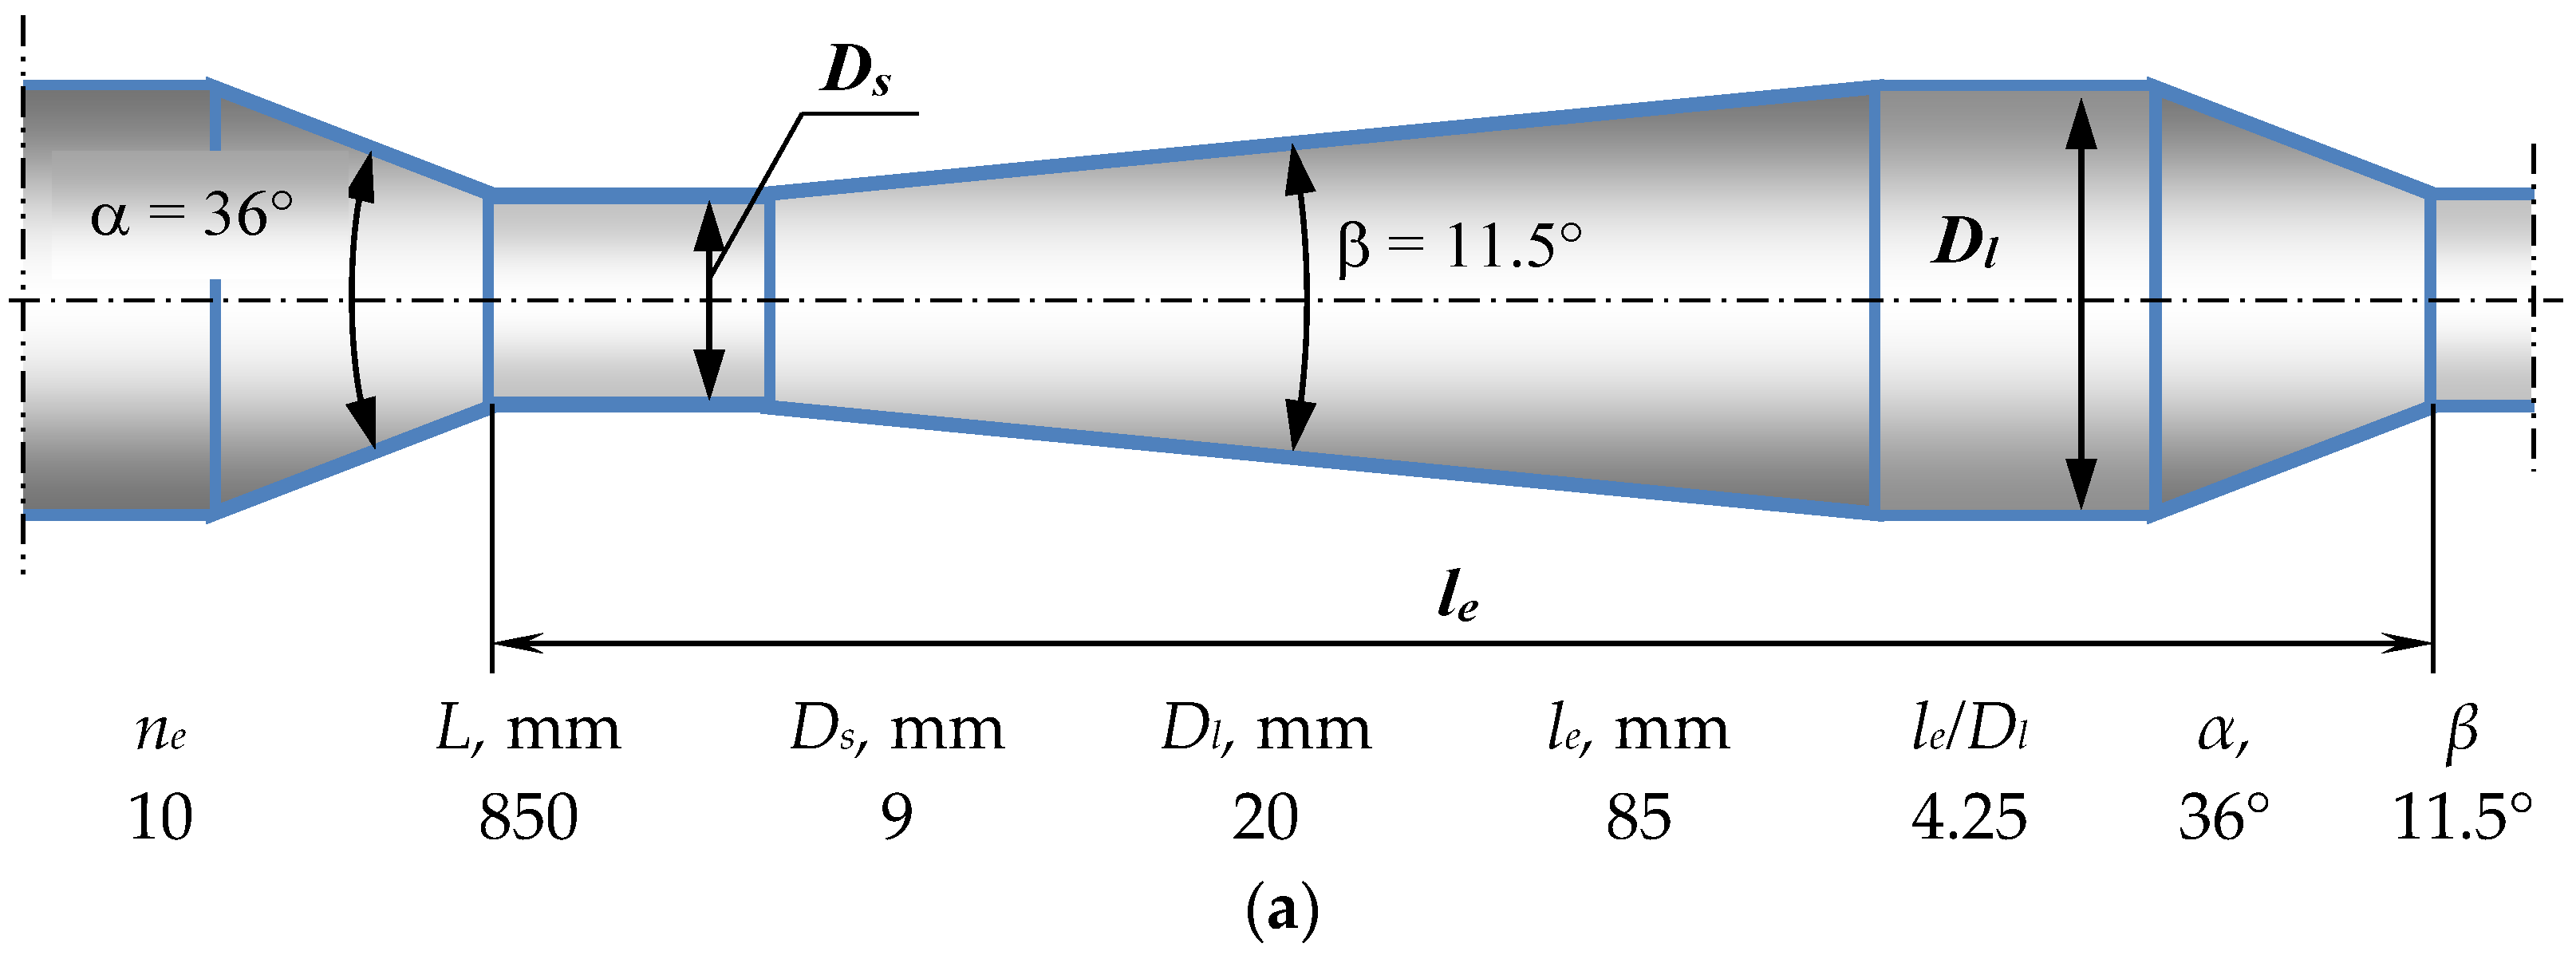
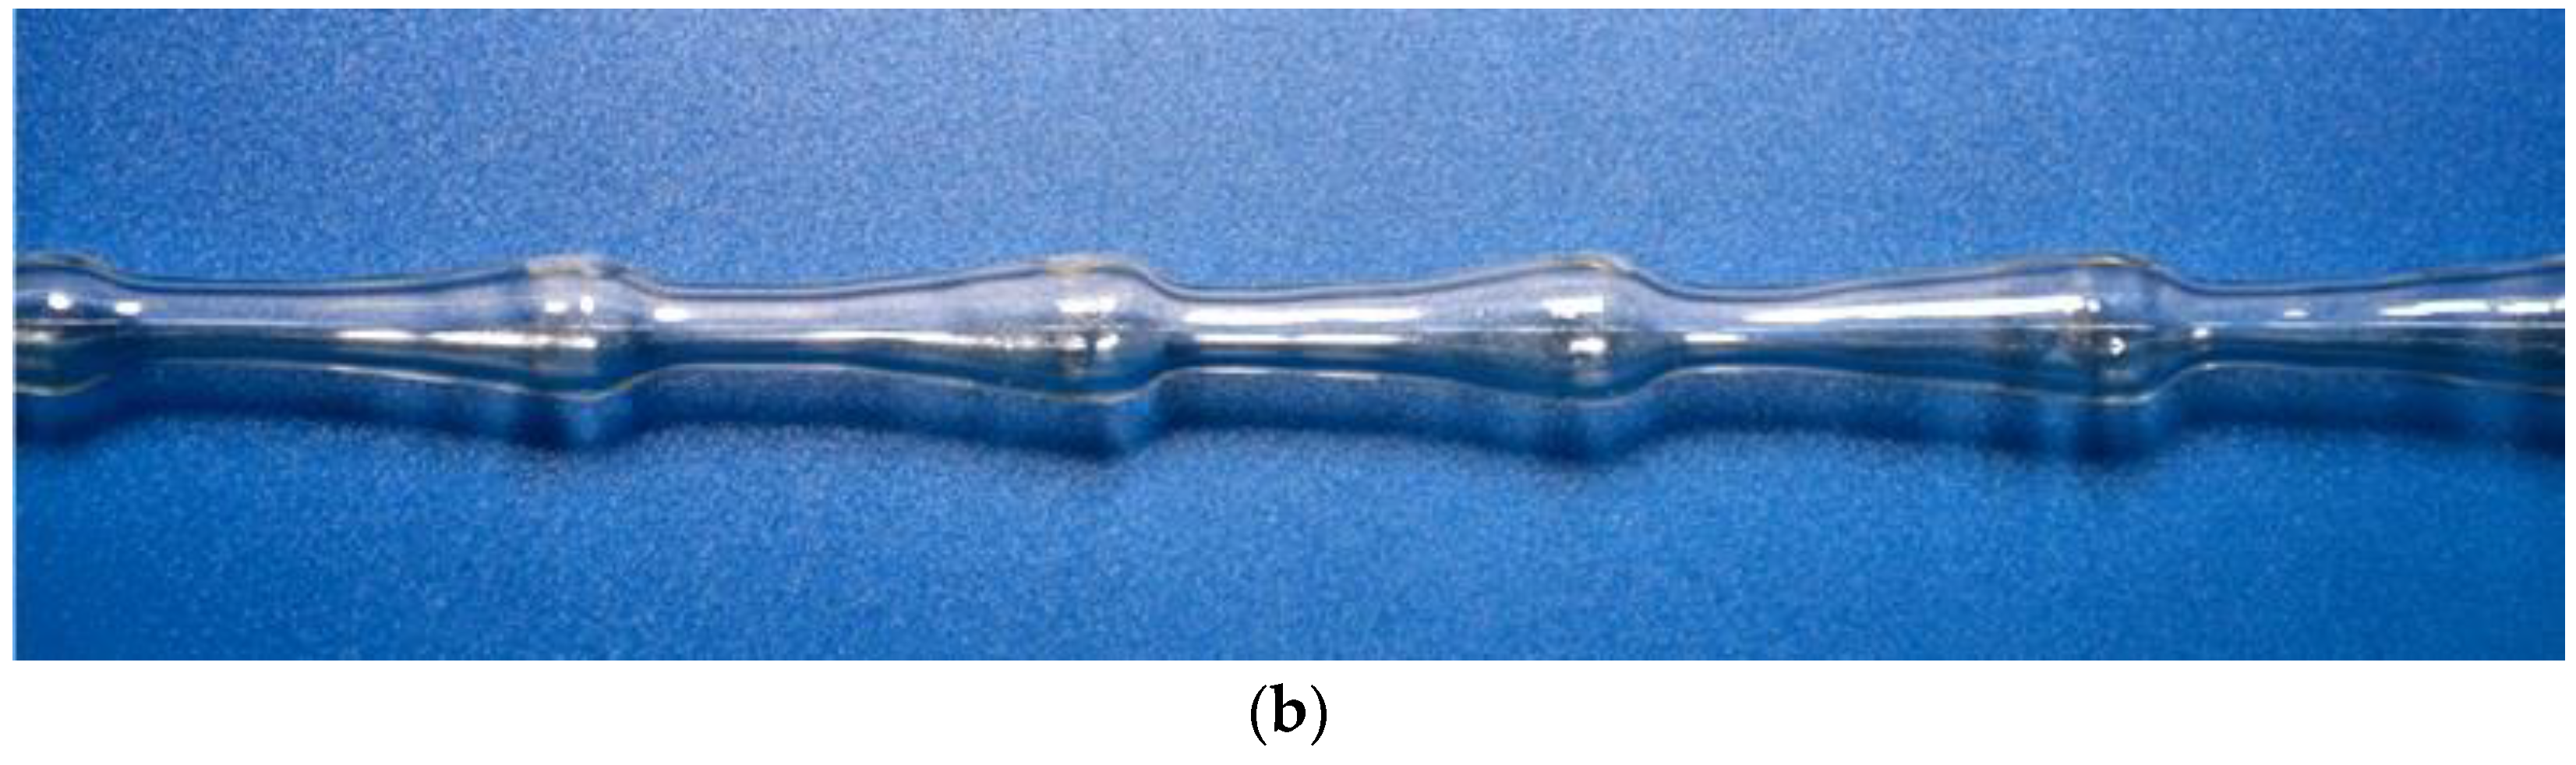
3.2. Design and Operating Principle of Pulsating Flow Type Apparatus
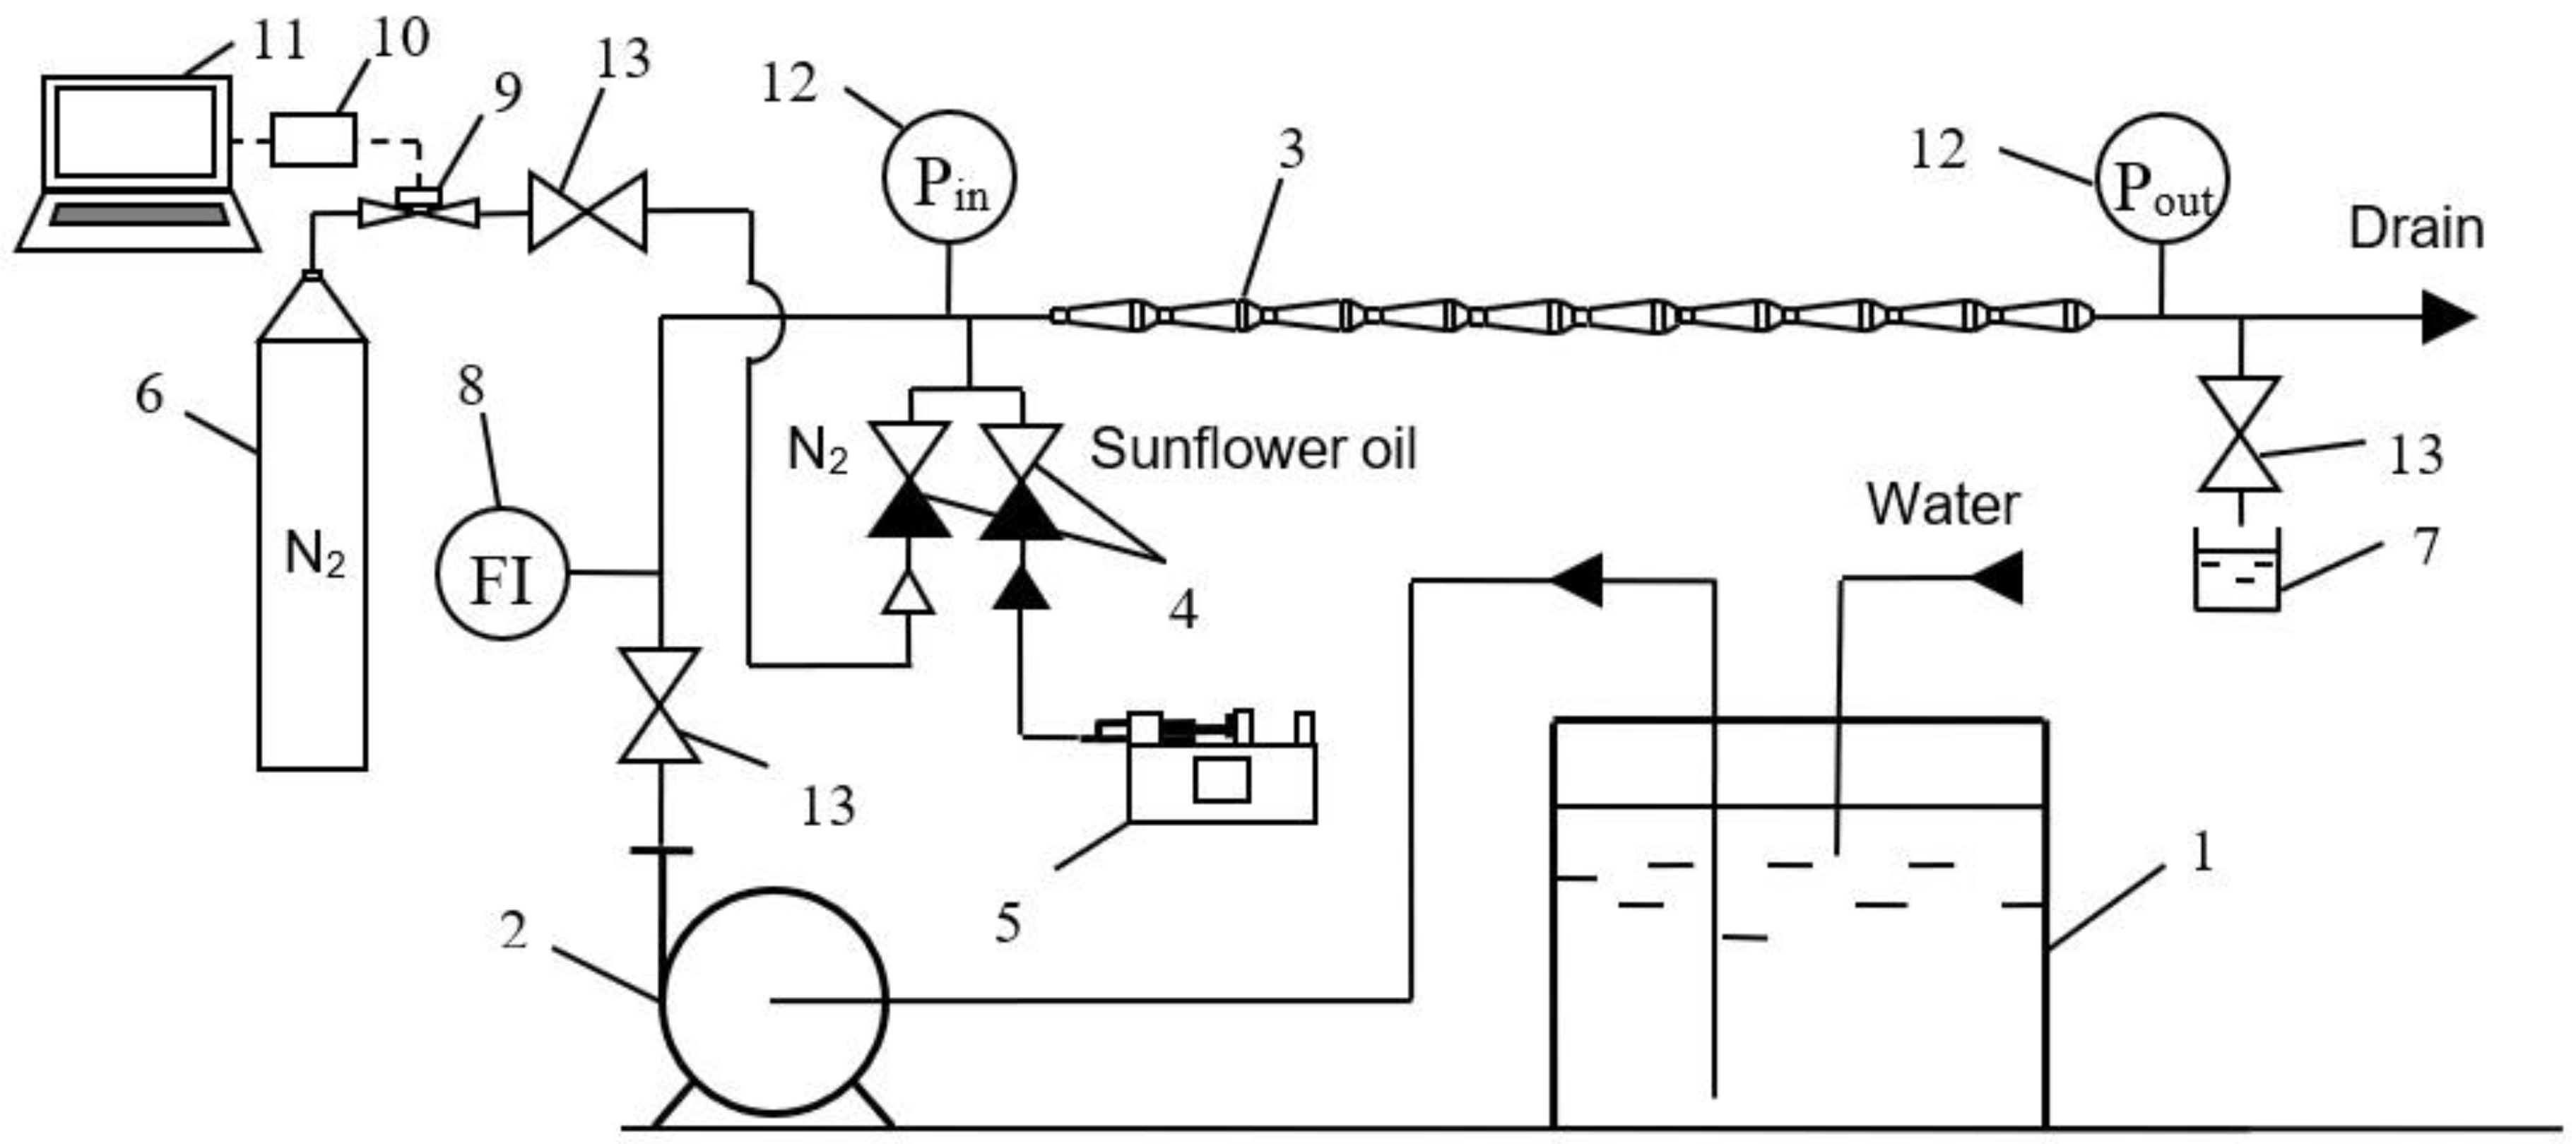
3.3. Experimental Rig
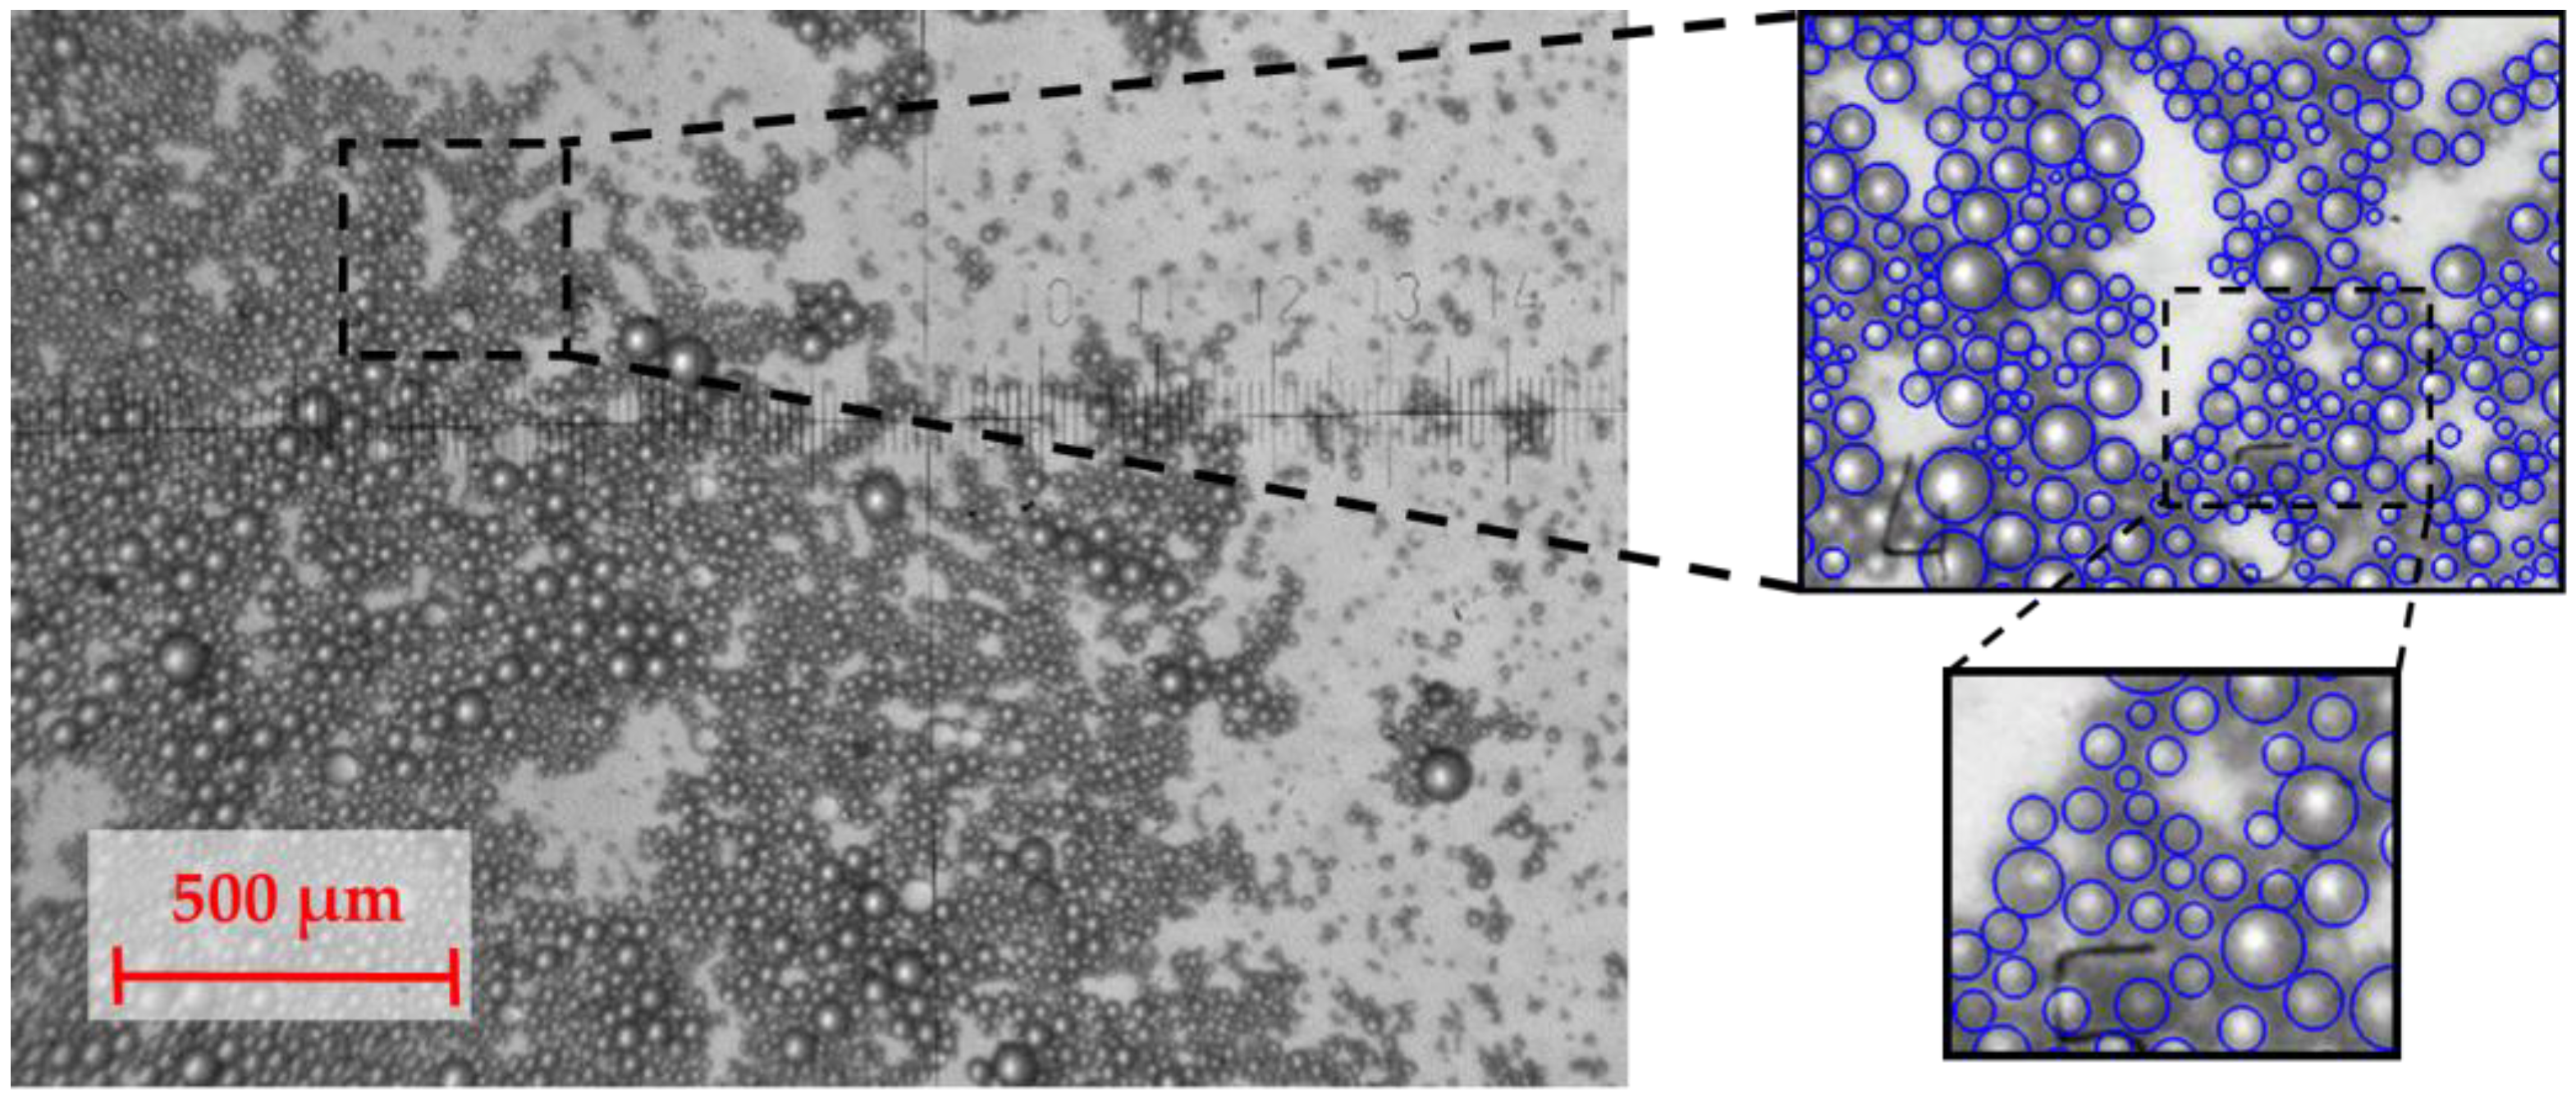
3.4. Droplets Diameters Measurements
4. Results and Discussion
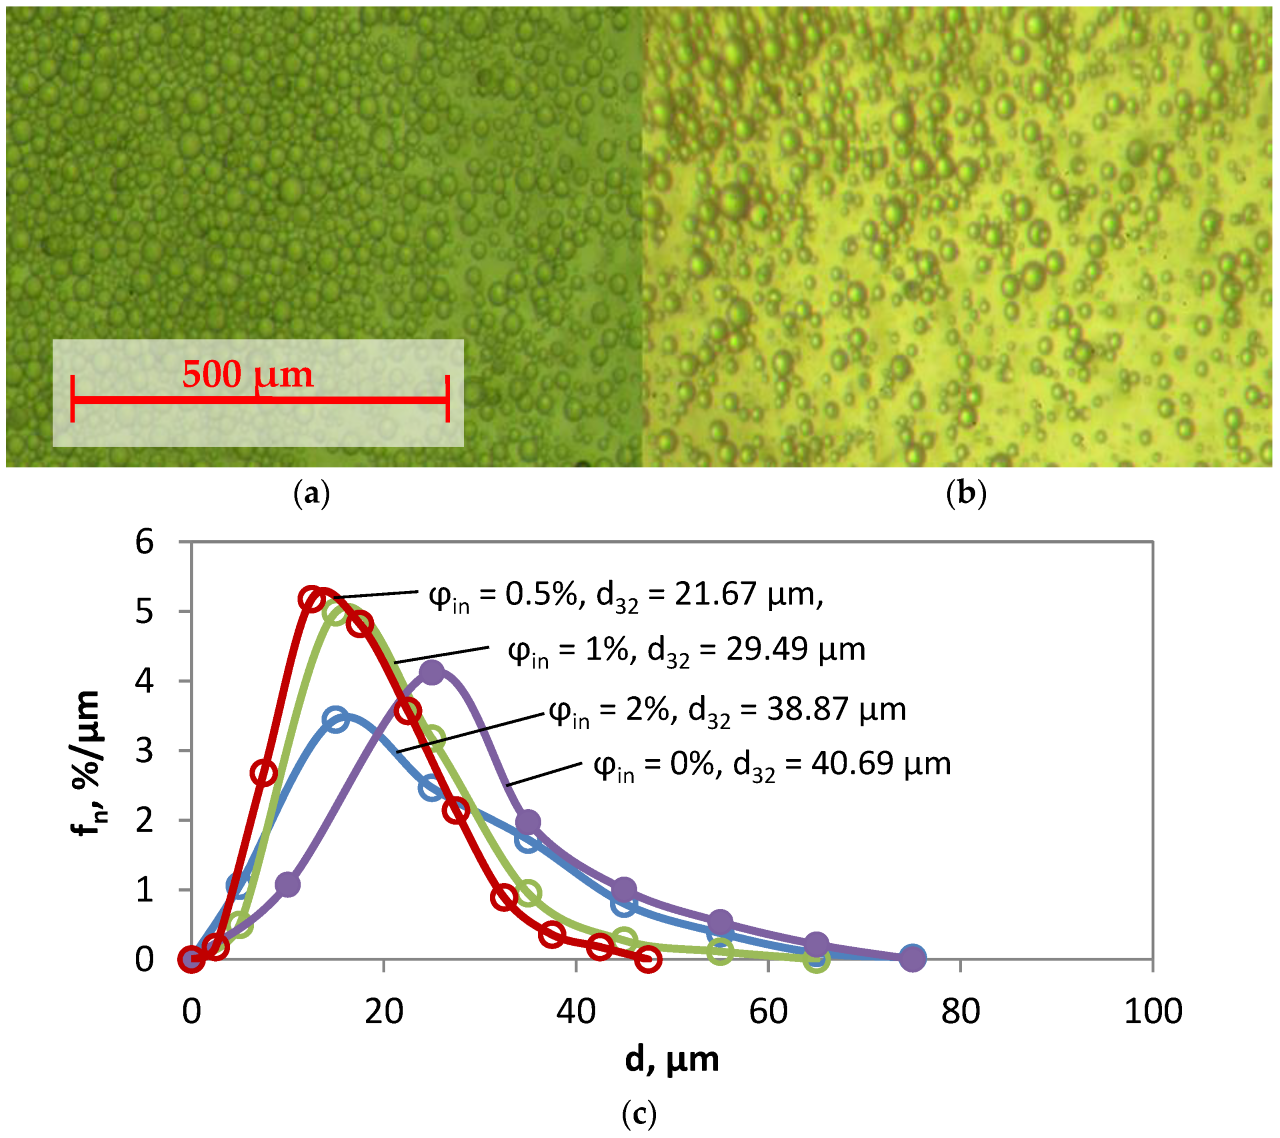
4.1. Estimation of Droplet-Size Distribution and the Mean Droplet Size for Various Gas Hold-Up Values
4.2. Mechanisms Explaining the Role of Gas Bubbles in the Intensified Emulsification in PFA
5. Conclusions
Author Contributions
Funding
Data Availability Statement
Conflicts of Interest
Appendix A. Local and Average Gas Flow Rates and Average Gas Hold-Up
References
- Etchells, A.W.; Meyer, C.F. Mixing in Pipelines. In Handbook of Industrial Mixing; John Wiley & Sons, Inc.: Hoboken, NJ, USA, 2004. [Google Scholar] [CrossRef]
- Babick, F. Suspensions of Colloidal Particles and Aggregates; Springer: Berlin/Heidelberg, Germany, 2016; Volume 20. [Google Scholar]
- Dietzel, A. Microsystems for Pharmatechnology: Manipulation of Fluids, Particles, Droplets, and Cells; Springer: Berlin/Heidelberg, Germany, 2016. [Google Scholar]
- Oyewunmi, O.A.; Kirmse, C.J.W.; Pantaleo, A.M.; Markides, C.N. Performance of working-fluid mixtures in ORC-CHP systems for different heat-demand segments and heat-recovery temperature levels. Energy Convers. Manag. 2017, 148, 1508–1524. [Google Scholar] [CrossRef]
- Dolinsky, A.A.; Ivanitsky, G.K. Theoretical substantiation of the principle of the discrete-pulse energy input. II. The study of the behavior of an ensemble of vapour bubbles. Heat Transf. Res. 1996, 27, 431–448. [Google Scholar]
- Dolinsky, A.A.; Basok, B.I. Discrete-pulse energy transformation in an adiabatically boiling flow. Ind. Heat. Technol. 2001, 23, 5–20. (In Russian) [Google Scholar]
- Dolinsky, A.A.; Pavlenko, A.M.; Basok, B.I. Thermophysical Processes in Emulsions; Naukova Dumka: Kiev, 2005. (In Russian) [Google Scholar]
- Berlin, A.A.; Dyumaev, K.M.; Minsker, K.S.; Khalafov, F.R.; Kolesov, S.V. Tubular turbulent reactors: The basis of energy-and resource-saving technologies. Russ. Chem. Ind. 1995, 27, 84–91. [Google Scholar]
- Bian, Y.N.; Li, C.L. Effect of geometric parameters on mass transfer characteristics for pulsatile flow in wavy-walled tubes. Appl. Mech. Mat. 2014, 575, 414–418. [Google Scholar] [CrossRef]
- Ni, X.; Mackley, M.R.; Harvey, A.P.; Stonestreet, P.; Baird, M.H.I.; Rama Rao, N.V. Mixing through oscillations and pulsations—A guide to achieving process enhancements in the chemical and process industries. Chem. Eng. Res. Des. 2003, 81, 373–383. [Google Scholar] [CrossRef]
- Harvey, A.P.; Mackley, M.R.; Reis, N.; Teixeira, J.A.; Vicente, A.A. The Fluid Mechanics Relating to a Novel Oscillatory Flow Micro Reactor. Eur. Congr. Chem. Eng. 2003.
- Thakur, R.K.; Vial, C.; Nigam, K.D.P.; Nauman, E.B.; Djelveh, G. Static mixers in the process industries—A review. Chem. Eng. Res. Des. 2003, 81, 787–826. [Google Scholar] [CrossRef]
- Bayer, T.; Himmler, K. Mixing and organic chemistry. Chem. Eng. Technol. 2005, 28, 285–289. [Google Scholar] [CrossRef]
- Brechtelsbauer, C.; Ricard, F. Reaction engineering evaluation and utilization of static mixer technology for the synthesis of pharmaceuticals. Org. Process. Res. Dev. 2001, 5, 646–651. [Google Scholar] [CrossRef]
- Valdés, J.P.; Kahouadji, L.; Matar, O.K. Current advances in liquid–liquid mixing in static mixers: A review. Chem. Eng. Res. Des. 2021, 177, 694–731. [Google Scholar] [CrossRef]
- Abiev, R.S. Method of intensification of the reactive and mass-exchange processes in the heterogeneous systems and the apparatus for its realization. Russian Patent 2264847 B01F5/00, B01J19/10, 10 July 2005. [Google Scholar]
- Abiev, R.S. Investigations of flow of gas-fluid system in pipe with periodically variable cross section. Khimicheskaya Promyshlennost 2003, 12, 10–18. [Google Scholar]
- Abiev, R.S. Flow of homogeneous incompressible liquid in a tube with periodically changing section. Khimicheskoe I Neftegazov. Mashinostroenie 2003, 1, 6–10. [Google Scholar]
- Vasilev, M.P.; Abiev, R.S. Intensity and efficiency of droplet dispersion: Pulsating flow type apparatus vs. static mixers. Chem. Eng. Res. Des. 2018, 137, 329–349. [Google Scholar] [CrossRef]
- Abiev, R.S.; Galushko, A.S. Hydrodynamics of pulsating flow type apparatus: Simulation and experiments. Chem. Eng. J. 2013, 229, 285–295. [Google Scholar] [CrossRef]
- Abiev, R.S.; Galushko, A.S. Bubbles size and mass transfer in a pulsating flow type apparatus with gas-liquid mixture. J. Flow Chem. 2021, 11, 369–391. [Google Scholar] [CrossRef]
- Abiev, R.S.; Vasilev, M.P. Pulsating flow type apparatus: Energy dissipation rate and droplets dispersion. Chem. Eng. Res. Des. 2016, 108, 101–108. [Google Scholar] [CrossRef]
- Vasilev, M.P.; Abiev, R.S. Turbulent droplets dispersion in a pulsating flow type apparatus—New type of static disperser. Chem. Eng. J. 2018, 349, 646–661. [Google Scholar] [CrossRef]
- Dolinsky, A.A.; Ivanitsky, G.K. Principles of development of new energy-resource-saving technologies and equipment based on methods of discrete-pulse energy input. Ind. Heat. Technol. 1997, 19, 24–32. (In Russian) [Google Scholar]
- Ivanitsky, G.K. Destruction of emulsion droplets in adiabatically boiling flows. Heat Process Eng. 1999, 21, 10–15. (In Russian) [Google Scholar]
- Coulaloglou, C.A.; Tavlarides, L.L. Description of interaction processes in agitated liquid-liquid dispersions. Chem. Eng. Sci. 1977, 32, 1289–1297. [Google Scholar] [CrossRef]
- Azizi, F.; Al Taweel, A.M. Population balance simulation of gas-liquid contacting. Chem. Eng. Sci. 2007, 62, 7436–7445. [Google Scholar] [CrossRef]
- Cullen, P.J.; Romañach, R.J.; Abatzoglou, N.; Rielly, C.D. Pharmaceutical Blending and Mixing, Pharmaceutical Blending and Mixing; John Wiley & Sons, Inc.: Hoboken, NJ, USA, 2015. [Google Scholar] [CrossRef]
- Leng, D.E.; Calabrese, R.V. Immiscible Liquid–Liquid Systems. In Handbook of Industrial Mixing; John Wiley & Sons, Inc.: Hoboken, NJ, USA, 2004. [Google Scholar] [CrossRef]
- Kolmogorov, A.N. On the disintegration of drops by turbulent flows. Dokl. Akad. Nauk SSSR 1949, 66, 825–828. (In Russian) [Google Scholar]
- Hinze, J.O. Fundamentals of the hydrodynamic mechanism of splitting in dispersion processes. AIChE J. 1955, 1, 289–295. [Google Scholar] [CrossRef]
- Nigmatulin, R.I.; Friedly, J.C. Dynamics of Multiphase Media; CRC Press: Boca Raton, FL, USA, 1990; Volume 2. [Google Scholar]
- Kardashev, G.A. Physical Methods for Intensification of the Processes of Chemical Technology; Chemistry: Moscow, 1990. (In Russian) [Google Scholar]
- Lighthill, S.J. Acoustic streaming. J. Sound Vib. 1978, 61, 391–418. [Google Scholar] [CrossRef]
- Suslick, K.S. Sonochemistry. Science 1990, 247, 1439–1445. [Google Scholar] [CrossRef] [PubMed]
- Leong, T.S.H.; Manickam, S.; Martin, G.J.O.; Li, W.; Ashokkumar, M. Ultrasonic Production of Nano-Emulsions for Bioactive Delivery in Drug and Food Applications; Springer: Berlin/Heidelberg, Germany, 2018. [Google Scholar] [CrossRef]
- Mysels, K.J. The maximum bubble pressure method of measuring surface tension, revisited. Colloids Surf. 1990, 43, 241–262. [Google Scholar] [CrossRef]
- Esteban, B.; Riba, J.R.; Baquero, G.; Rius, A.; Puig, R. Temperature dependence of density and viscosity of vegetable oils. Biomass Bioenergy 2012, 42, 164–171. [Google Scholar] [CrossRef] [Green Version]
- Vasilev, M.P.; Abiev, R.S. Dispersion of carbon nanotubes clusters in pulsating and vortex in-line apparatuses. Chem. Eng. Sci. 2017, 171, 204–217. [Google Scholar] [CrossRef]
- Honeywell. Airflow Sensors High Flow Mass Airflow/Amplified AWM5000 Series. 2013. Available online: https://docs.rs-online.com/a136/0900766b80025add.pdf (accessed on 20 December 2022).
- Beddow, J.K. Particulate Science and Technology; Chemical Publishing, Co.: Gloucester, MA, USA, 1980. [Google Scholar]
- Lemenand, T.; Della Valle, D.; Zellouf, Y.; Peerhossaini, H. Droplets formation in turbulent mixing of two immiscible fluids in a new type of static mixer. Int. J. Multiph. Flow 2003, 29, 813–840. [Google Scholar] [CrossRef]


| Fluids | Density (ρ), kg/m3 | Dynamic Viscosity (μ), mPa·s | Interphase Tension (σ), mN/m |
|---|---|---|---|
| Dispersed phase: Sunflower oil | 920.3 | 56 | 20.6 |
| Continuous phase: Water | 998.2 | 1.0016 |
| 0 | 0.25 | 0.5 | 0.75 | 1 | 2 | 4 | |
|---|---|---|---|---|---|---|---|
| , % | 0 | 0.71 | 1.42 | 2.14 | 2.87 | 5.72 | 11.29 |
| , % | 0 | 0.40 | 0.80 | 1.20 | 1.59 | 3.13 | 6.04 |
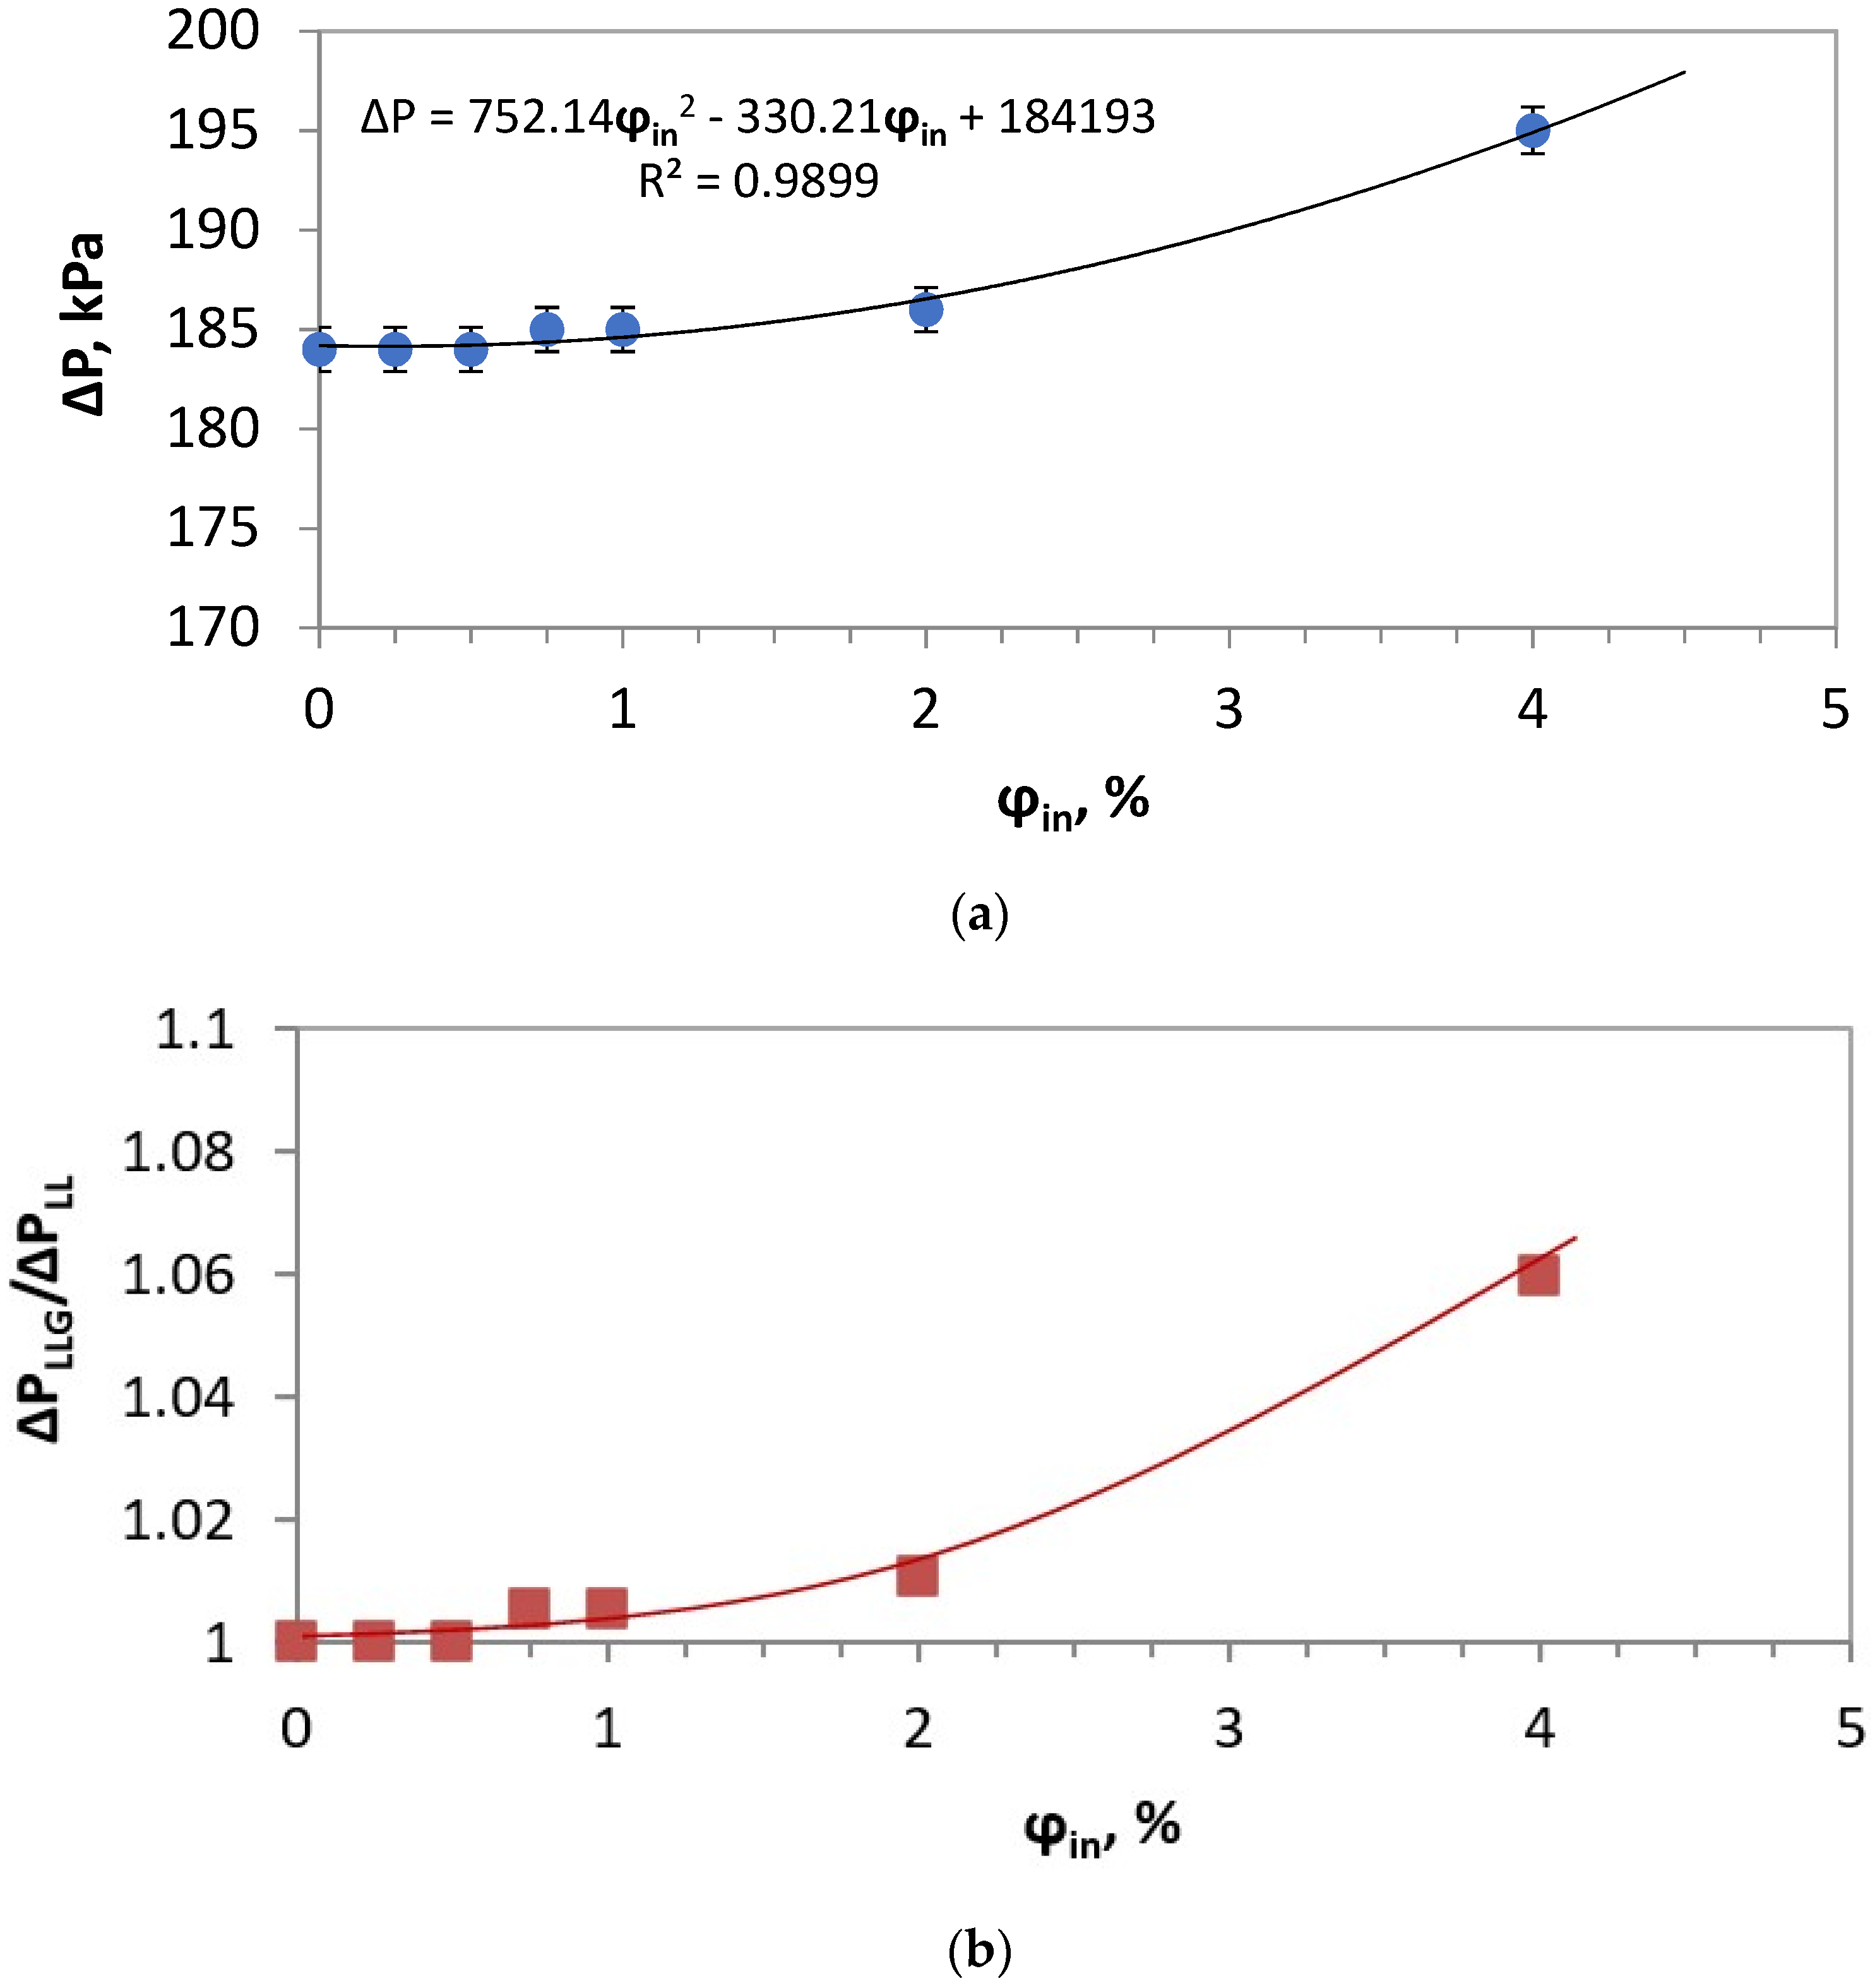
| ΔP, kPa | 184 | 184 | 184 | 185 | 184 | 185 | 195 |
| dmax, µm | 52 | 44.93 | 40.82 | 50.64 | 52.47 | 54.47 | 64.92 |
| d32, µm | 40.69 | 33.94 | 21.67 | 28.36 | 29.49 | 38.87 | 46.20 |
| 0.25 | 0.5 | 0.75 | 1.0 | |
|---|---|---|---|---|
| C, m/s | 338.1 | 239.3 | 195.7 | 169.7 |
| C/C0 | 0.228 | 0.161 | 0.132 | 0.114 |
Disclaimer/Publisher’s Note: The statements, opinions and data contained in all publications are solely those of the individual author(s) and contributor(s) and not of MDPI and/or the editor(s). MDPI and/or the editor(s) disclaim responsibility for any injury to people or property resulting from any ideas, methods, instructions or products referred to in the content. |
© 2023 by the authors. Licensee MDPI, Basel, Switzerland. This article is an open access article distributed under the terms and conditions of the Creative Commons Attribution (CC BY) license (https://creativecommons.org/licenses/by/4.0/).
Share and Cite
Vasilev, M.P.; Abiev, R.S. Intensification of Droplet Disintegration for Liquid–Liquid Systems in a Pulsating Flow Type Apparatus by Adding an Inert Gas. Fluids 2023, 8, 38. https://doi.org/10.3390/fluids8020038
Vasilev MP, Abiev RS. Intensification of Droplet Disintegration for Liquid–Liquid Systems in a Pulsating Flow Type Apparatus by Adding an Inert Gas. Fluids. 2023; 8(2):38. https://doi.org/10.3390/fluids8020038
Chicago/Turabian StyleVasilev, Maksim P., and Rufat Sh. Abiev. 2023. "Intensification of Droplet Disintegration for Liquid–Liquid Systems in a Pulsating Flow Type Apparatus by Adding an Inert Gas" Fluids 8, no. 2: 38. https://doi.org/10.3390/fluids8020038