Abstract
High-flow nasal cannula (HFNC) is becoming the gold standard to treat respiratory distress at any age since it potentially provides several significant clinical advantages. An obstacle to the diffusion of this simple and effective system of oxygen therapy is the impossibility to know the optimal flow rate leading to such advantages that allows the reduction in the respiratory effort without causing hyperinflation. To assist clinicians during HFNC treatment in setting the optimal flow rate and in determining the most relevant parameters related to respiratory mechanics and the effort of the patient, we developed a new programmable data monitoring, acquisition, and elaborating system (Pro_HFNC). The application of Pro_HFNC is fully compatible with HFNC as it is interfaced with patient through a facial mask and two specific catheters. The unavoidable and unpredictable loss of air flow occurring around the contour of the mask is evaluated and compensated by a specific algorithm implemented by Pro_HFNC. Our preliminary clinical trials on pediatric patients treated with HFNC show that Pro_HFNC is actually capable to detect for any specific patient both the lower threshold of the delivered flow beyond which the benefits of HFNC application are reached and all the parameters useful for a complete evaluation of the respiratory profile. Pro_HFNC can really help physicians in setting the optimal flow rate during HFNC treatment, thus allowing for the most effective HFNC performance.
1. Introduction
Nasal cannulas (NCs) have been commonly used to deliver supplemental oxygen to patients with hypoxemic respiratory failure. Over the last twenty years, several studies have shown that if supplemental oxygen is delivered at high flow rate through NC, a positive distending pressure is generated in the oropharynx similarly to that provided using nasal continuous positive airway pressure (NCPAP) modalities. This new modality of delivering oxygen therapy is presently known as high-flow nasal cannula oxygen therapy (HFNC). HFNC delivers to patients a high flow of a warmed and humidified known air/oxygen mixture via NC, which exceeds the patient’s peak inspiratory flow (PIF). Thus, because the nasopharyngeal dead space is continuously purged by a high flow, the ratio of alveolar ventilation to minute ventilation increases, and a significant level of pharyngeal pressure is generated.
There are now several commercially available systems which combine the use of HFNC systems with a variety of different methods to condition breathing gases, high-flow oxygen being cold and dry and poorly tolerated [1].
The application of positive distending pressure at oropharynx via HFNC is an attractive option to intensive care physicians because of its relative ease of use, cost effectiveness, and patient tolerability [2,3]. Patients ranging in age from preterm newborns to adults receive flow rates from 2 to 60 L/min to support breathing through a variety of clinical conditions. For example, in neonatal practice, where respiratory illnesses are a major cause of morbidity and mortality, HFNC is often used as an alternative to NCPAP. In addition, HFNC devices are increasingly being used for a range of applications in pediatric patients with respiratory distress from infectious causes, such as viral bronchiolitis or bacterial pneumonia, to reactive airway diseases that might have otherwise required intubation or more uncomfortable techniques of non-invasive ventilation [4]. In adults, HFNC is used in a variety of clinical settings where increased flow rates are believed to benefit the patient, such as pulmonary edema, chronic obstructive pulmonary disease, or respiratory distress post-extubation.
In conventional NCPAP therapy, the patient breathes from a pressurized circuit, in which the pressure is controlled via an expiratory valve. Contrarily to NCPAP, with HFNC devices, the entire flow is continuously directed through the NC into the nasopharynx. In this case, the only flow escape routes are the leaks around the NC and via the mouth. In addition, there is no control device for delivery pressure. Therefore, if NC fits snugly into the patient’s nose, and the mouth is closed, the pharyngeal pressure (Pph) will depend entirely on the HFNC flow values. HFNC could thereby inadvertently generate dangerously high levels of Pph that may lead to excessive lung overexpansion and worsening respiratory distress [5]. Therefore, the flow setting and systematic control of the Pph are of critical importance to avoid excessively high intrathoracic pressures. Optimal flow setting is also important to satisfy the patient’s flow requirement during inspiration. This point is crucial for the performance of HFNC. In fact, while using HFNC, when the inspired gas flow exceeds the patient’s PIF, the nasopharyngeal cavity is continuously purged during the entire respiratory cycle. This purging of anatomical dead space removes expiratory gas that is high in CO2 and relatively depleted of O2 and creates an anatomical reservoir of the delivered air/oxygen mixture. Under these conditions, during subsequent breaths the patient will rebreathe less CO2 and more O2. The new alveolar gas equilibrium supports alveolar ventilation with higher alveolar partial pressure of oxygen (PaO2) and lower alveolar partial pressure of carbon dioxide (PaCO2). In addition, if the gas flow inspired through the NC exceeds the patient’s PIF there will be no entry of air from the environment and the concentration of inspired oxygen would be the same as the one set on the HFNC blender, known as fraction of inspired oxygen (FiO2) [1,4].
Although HFNC was developed as a procedure with no monitoring requirement, today’s expanded use requires extended physiologic studies to guide clinicians in setting HFNC flow rate [6,7,8,9,10].
The effectiveness of HFNC depends on flow setting, which is frequently determined by the patient’s weight at a rate of 1 to 2 L/min/kg. However, this empirical method may not be accurate and could result in treatment failure. To ensure accuracy, PIF should be measured before initiating HFNC. However, even with this information, it would be unknown what effects HFNC therapy has on patients’ PIF, and whether the set HFNC flow becomes inadequate or excessively high after HFNC begins. Thus, we wondered whether evaluating PIF only once before HFNC therapy and then using this PIF value to set HFNC without further verification would be the right way to match patients and HFNC flow. An empirically consistent scenario is that PIF will change once HFNC therapy begins. Indeed, breathing frequency slows during HFNC, and longer times flatten the flow tracings, thus reducing PIF. Equally important, because HFNC therapy reduces esophageal pressure swings, PIF values will likely diminish. Thus, after HFNC starts, reduced PIF values might meet at different HFNC flow rate thresholds.
For this purpose, based on our previous experience [11], we specifically designed a new programmable data monitoring, acquisition, and elaboration system (Pro_HFNC) and tested its effectiveness on a series of young infants hospitalized in the Pediatric Intensive Care Unit (PICU) at Sapienza University of Rome (Italy) with mild to moderate acute respiratory failure treated with HFNC.
2. Materials and Methods
In order to test the functional features of Pro_HFNC, we enrolled five infants less than 6 months of age with mild to moderate acute respiratory failure. The infants were studied once they were deemed stable by the clinical team and informed consent was obtained from the parents or guardians. The study was conducted in the 10-bed Pediatric Intensive Care Unit at Sapienza University of Rome’s Policlinico Umberto I teaching hospital. The study protocol received approval from the Policlinico Umberto I Review Board.
2.1. HFNC Delivery
To deliver HFNC (Fisher & Paikel Healthcare, Auckland, New Zealand), the infants were fitted with the appropriate-sized NC (Optiflow Junior NC, Fisher and Paykel, Auckland, New Zealand). Flow rate was set using a flow meter connected with a ventilation circuit (VC) (Optiflow Junior RT330, Fisher and Paykel, Auckland, New Zealand) which included a MR850 heater humidifier (Fisher and Paykel, Auckland, New Zealand) set at 37 °C. The outer diameter of NC did not exceed 80% of the infants’ nostril diameter to allow for adequate air leak.
2.2. Pph Monitoring
Pph was measured using a 6 Fr feeding catheter with 3 holes at the distal extremity. The catheter was inserted through the mouth in the pharynx (the tip just above the glottis) and connected to a differential pressure transducer (DPT) to measure Pph (DPT_4, Figure 1). To avoid occlusion of the catheter by secretions, a 20 mL/h airflow produced by a microinfusor was applied at the inlet of the catheter.
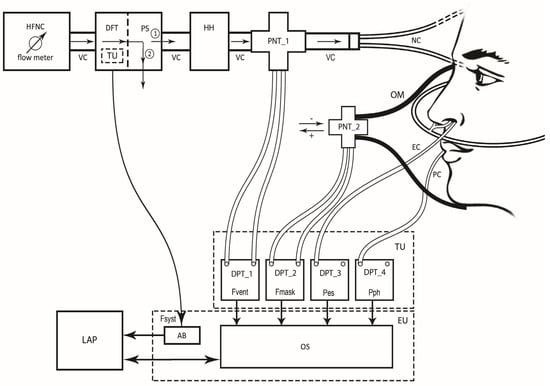
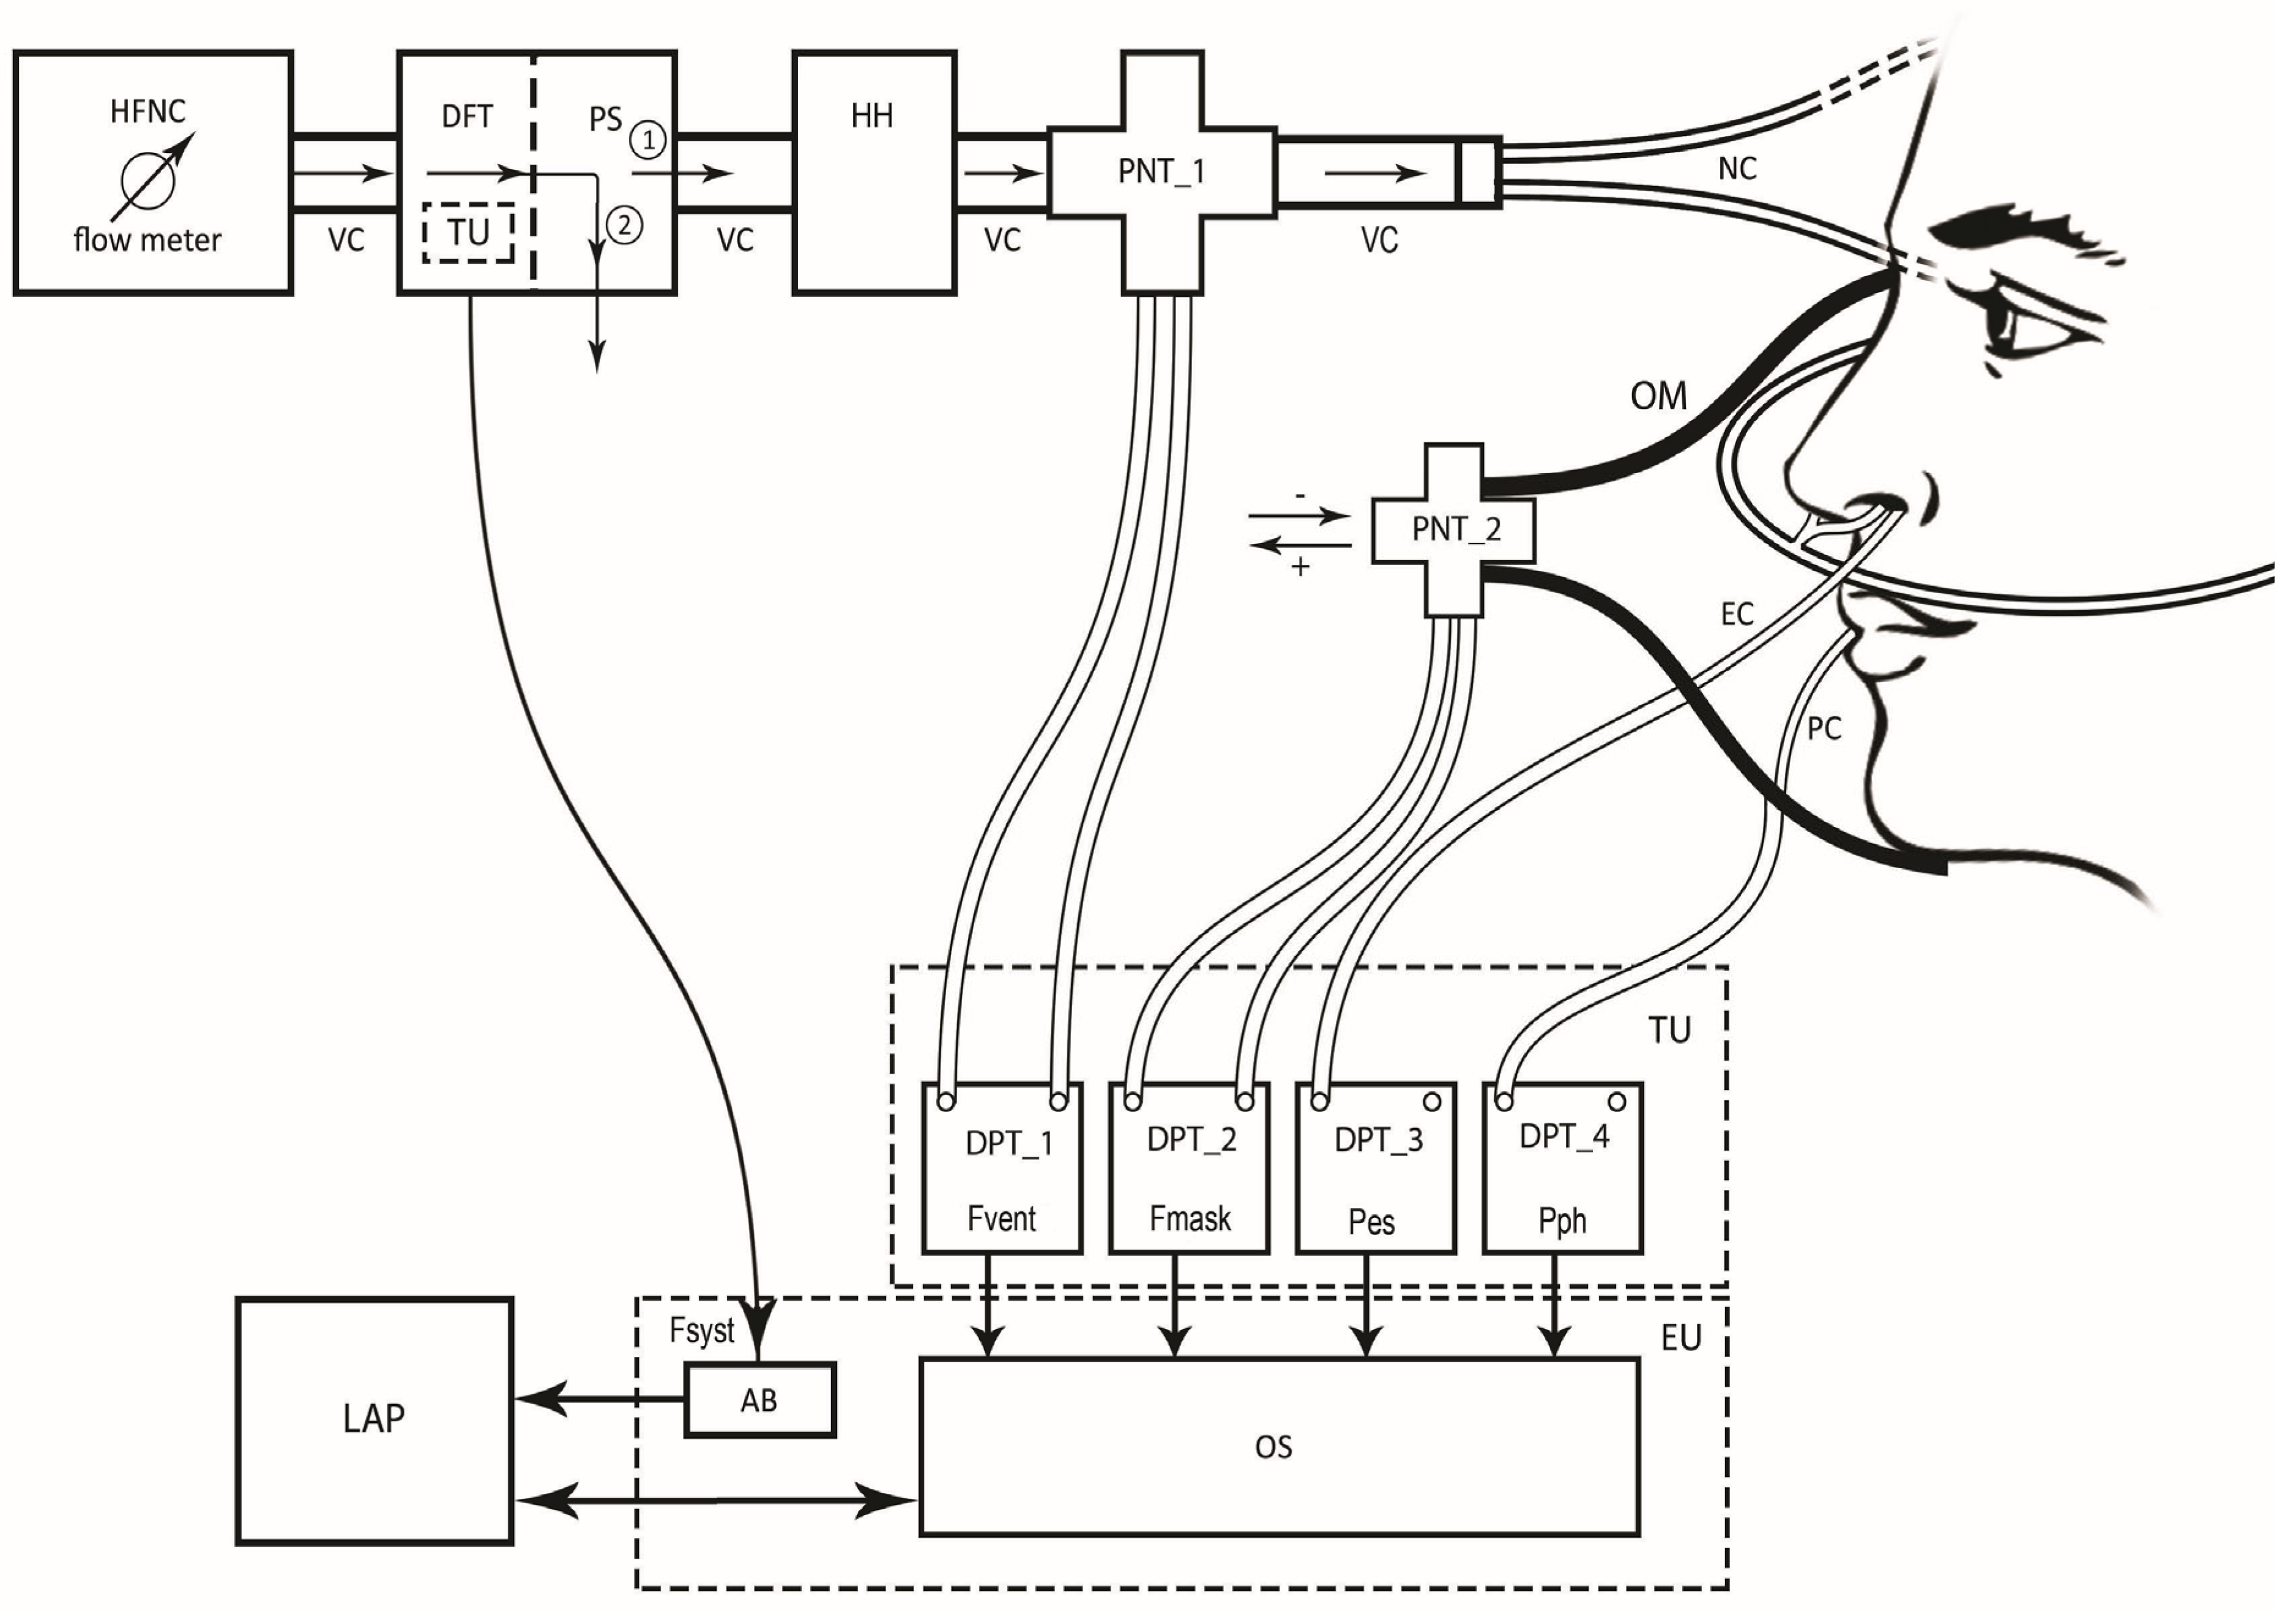
Figure 1.
The Pro_HFNC setup showing high-flow nasal cannula (HFNC) flow meter, the ventilation circuit (VC), the digital flow transducer (DFT) coupled with a pneumatic switch (PS) and connected to Arduino board (AB), the heater humidifier (HH) device, the first pneumotachograph (PNT_1) coupled with differential pressure transducer (DPT_1) and the nasal cannulas (NC) connected to the patient having an esophageal catheter (EC), and a pharyngeal catheter (PC) in place connected to the DPT_3 and DPT_4, respectively. The circled number 1 indicates that the patient is connected to the HFNC. The circled number 2 indicates that the patient has been disconnected from the HFNC. Placed on the patient’s face is an oronasal mask (OM) on the main opening of which the second pneumotachograph (PNT_2) is inserted. The PNT_2 is coupled with DPT_2. The output signals from DPTs are connected to the respective input channels of an advanced oscilloscope (OS). The DFT and the four DPTs coupled with the four respective PNTs belonging to the Transducer Unit (TU), while AB and OS to the Electronic Unit (EU). Both OS and AB are then connected to a laptop computer (LAP) where the monitoring and elaboration software runs. Fsyst: flow delivered by HFNC (without patient); Fvent: Fsyst when the patient is connected to the HFNC; Fmask: flow intercepted by the OM; Pes: esophageal pressure; Pph: pharyngeal pressure. As shown by the arrows, Fvent is always directed from HFNC flow meter to NC, while Fmask from the inside to the outside of the OM being considered as positive, or the vice versa being considered as negative.
2.3. Pes Monitoring
Pes was measured using an air-filled catheter with a thin-walled balloon over its distal end (AVEA smartcath esophageal pressure monitoring tube set 6 Fr pediatric, Carefusion, Yorba Linda, CA, USA). The balloon prevents occlusion of the catheter from fluid in the esophagus. When the volume of gas within the balloon is below its unstressed volume (i.e., its transmural pressure is zero), the pressure sensed within the balloon equals the pressure in the esophagus. Because the filled balloon will also distend the esophagus, keeping the gas volume to a minimum (typically 0.5 mL) will avoid producing a positive transmural pressure in the esophagus. The distal catheter segment contained within the balloon has 6 side-holes to assure continuity of gas flow between the balloon and catheter lumen. Balloons of approximately 5 cm in length offer stable measurements over a range of gas volumes and a firm position within the esophagus. The balloon catheter was firmly attached to a 6 Fr gauge catheter, which was connected to a DPT (DPT_3, Figure 1). The catheter was inserted through the nostril into the stomach (the position was checked by gentle manual pressure on the patient’s abdomen to observe gastric pressure fluctuation). Then, the catheter was slowly pulled up until it remained in the middle portion of the esophagus. This position was confirmed by an oscillating signal with clear negative deflection simultaneous to inspiration on the monitor. In case of doubt, when a diagnostic chest X-ray film was performed on the infant, the balloon was left in place to confirm the position. The Pes measurement was validated by the dynamic occlusion test [12]. It consisted of measuring the ratio of change in Pes to that of airway pressure (Paw) (∆Pes/∆Paw ratio) during three to five spontaneous respiratory efforts against a closed airway. An OM with a special material and shape, which allowed for a good pneumatic seal with no air leaking, whose opening could be blocked and whose internal pressure measured, was used for the purpose. The acceptable range of ∆Pes/∆Paw ratio during the occlusion test was 10–20% (i.e., from 0.8 to 1.2). Paw and Pes were recorded simultaneously.
2.4. Flow Detection
The flow delivered by HFNC without patient (Fsyst) was measured using a digital flow transducer (DFT) inserted in series into the VC between the flow meter and the HH (Figure 1 and Figure 2). To accurately detect Fsyst, a pneumatic switch (PS) coupled with the DFT allowed for the temporary (less than 2 s) disconnection of the patient from VC (position 2), so as to avoid the interference of the patient’s spontaneous respiratory activity on the Fsyst signal. This maneuver was only required once at the beginning of the monitoring. The digital output of DFT was connected to the input of Arduino board (AB) for signal conversion (Figure 1).

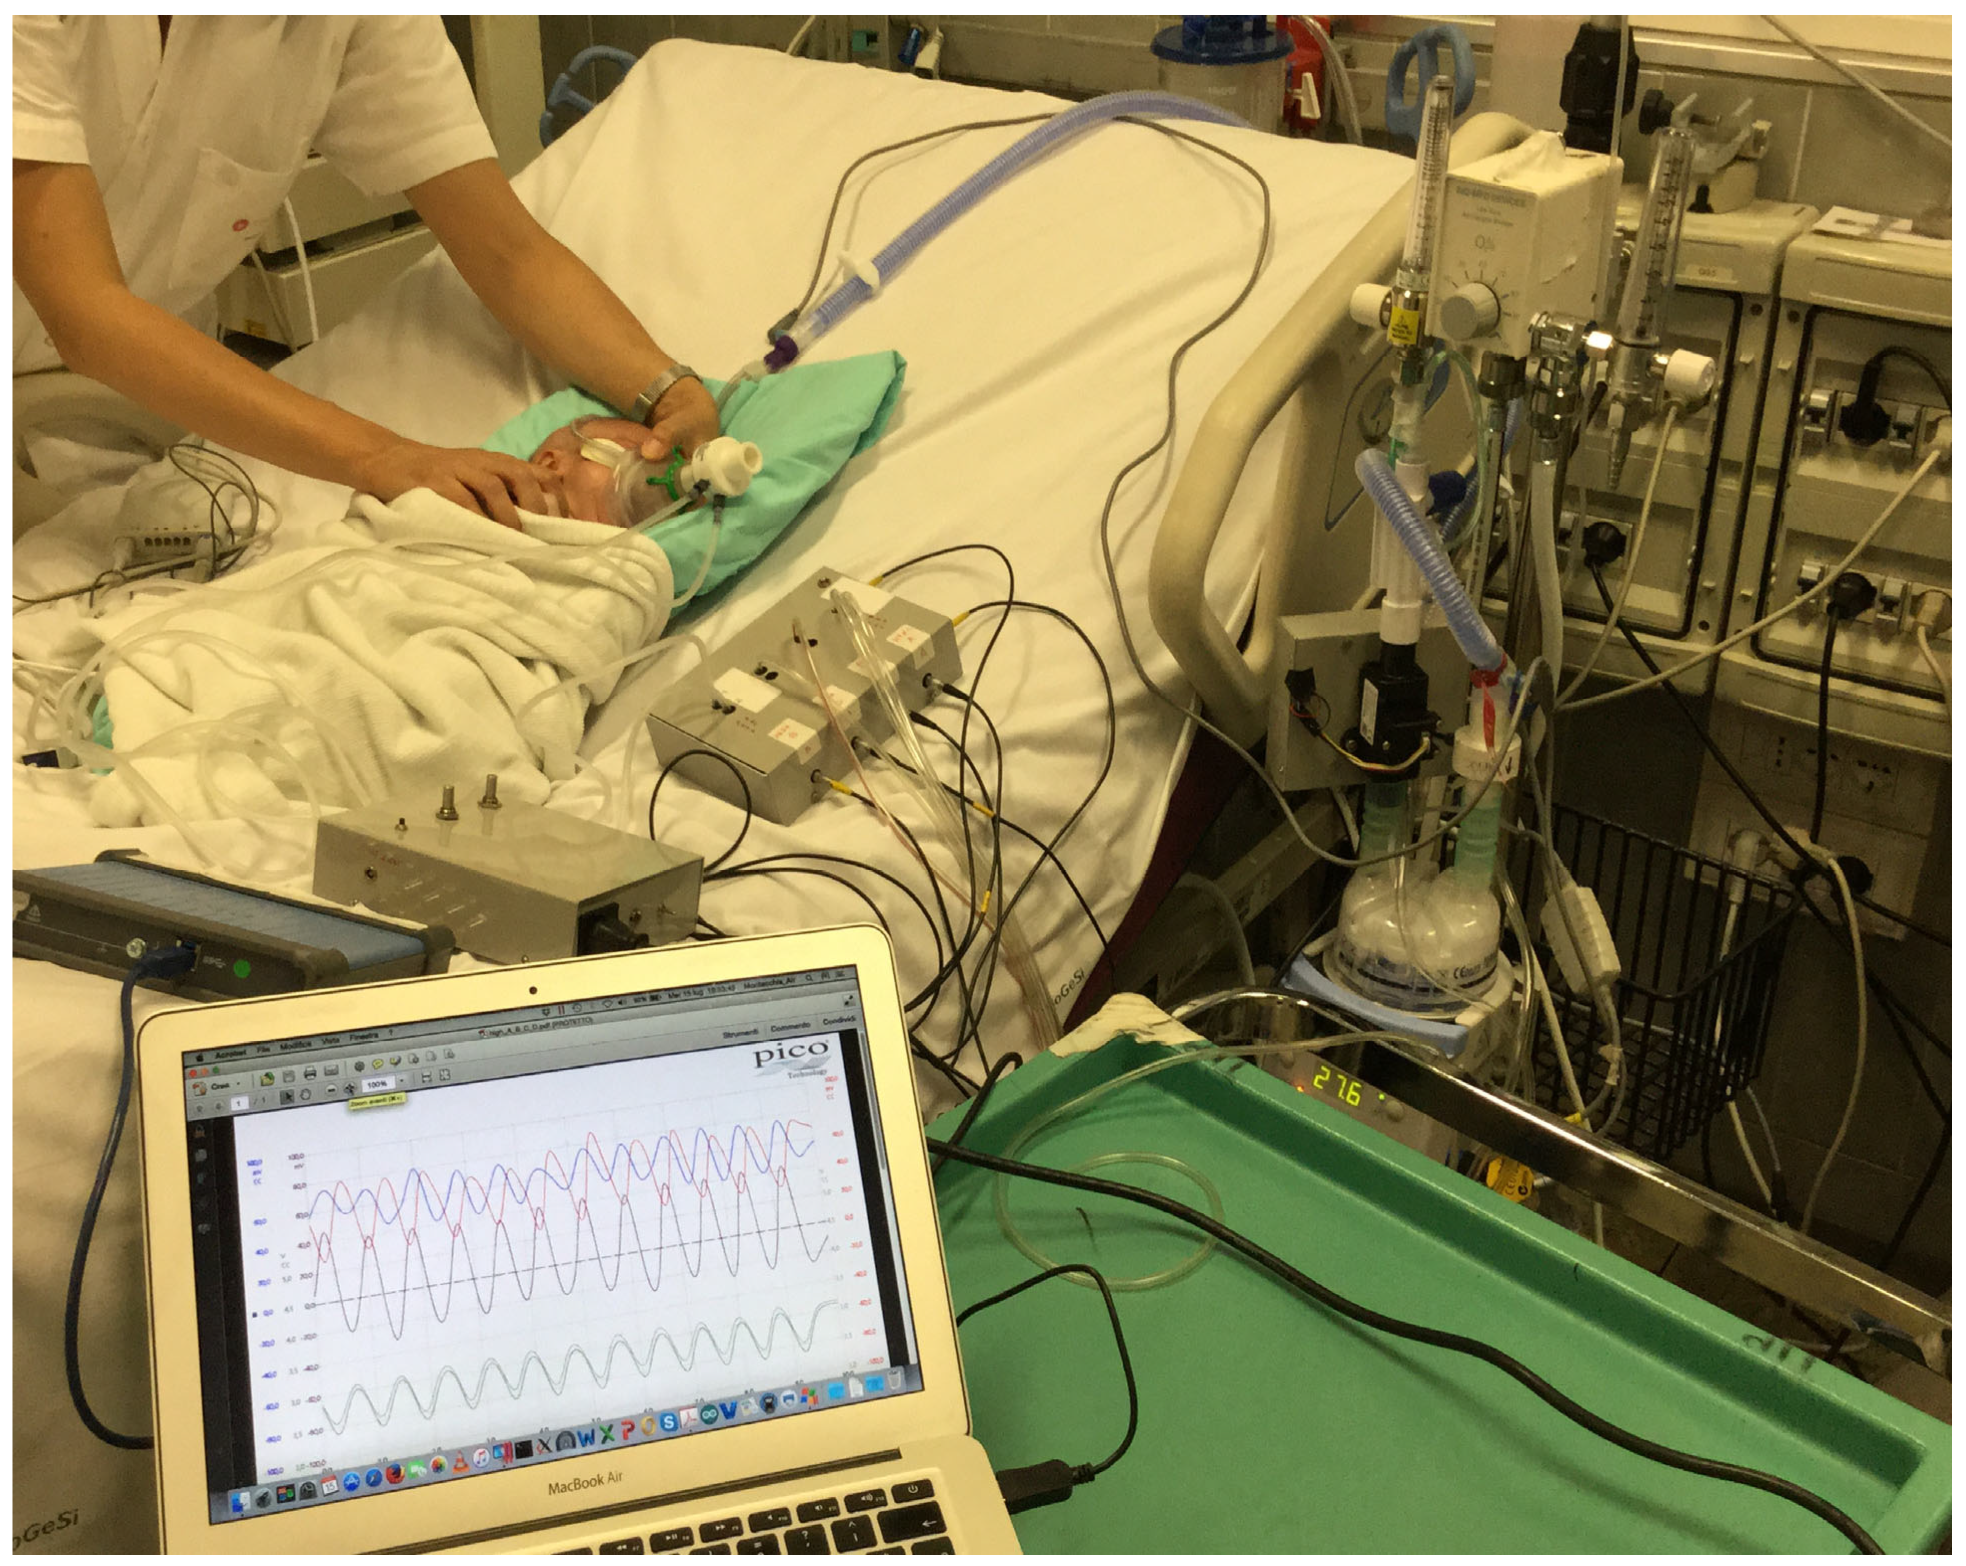
Figure 2.
The picture shows the application of Pro_HFNC on a representative patient.
For advanced flow detection and optimal HFNC setting, two pneumotachographs (PNT: PNT_1 and PNT_2) were assembled in the Pro_HFNC (Figure 1, Figure 2 and Figure 3). PNT_1 was inserted in the VC between the HH and the NC for online monitoring of the HFNC flow when the patient is connected to the HFNC (Fvent). PNT_2 was connected to the opening of an OM temporarily placed on the patient’s face for online monitoring of the flow intercepted by the OM (Fmask). Both PNTs (PNT_1 and PNT_2) were coupled to the respective DPTs (DPT_1 and DPT_2) whose analogic outputs were connected to the respective input channels of an advanced oscilloscope (OS) (Figure 1).
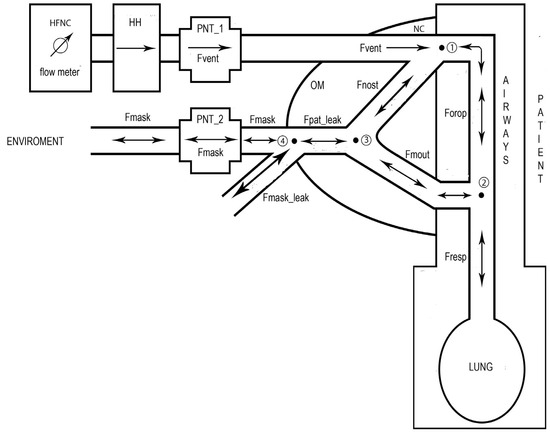
Figure 3.
Schematic representation of the model employed to calculate the respiratory flow (Fresp). A first pneumotachograph (PNT_1) is inserted in the ventilation circuit to detect the flow delivered by the HFNC to the patient (Fvent). A second PNT_2 is inserted in the main opening of an oronasal mask (OM) to detect the flow intercepted by the OM (Fmask). The circled numbers 1,2,3 and 4 indicate the four nodes where the continuity law was applied. Fnost, Forop, and Fmout are the flow around the nasal cannula (NC), the flow passing by the oropharynx, and the flow crossing the mouth, respectively. Fpat_leak is the sum of Fnost with Fmout which represents the difference between Fvent and Fresp. Fpat_leak is also the sum of Fmask with the flow leak along the OM edge (Fmask_leak). Fmask_leak is computed by the flow-based version of a specific algorithm [13]. In this figure are also shown the four nodes where the continuity law was applied (see Section 2.5: Equations (1), (2), (5), and (7)). The arrows indicate the direction of each specific flow which can be unidirectional (single arrows) or bidirectional (double arrow).
2.5. Respiratory Flow and Tidal Volume Calculation
The respiratory flow (Fresp) waveform was calculated considering the model whose scheme is shown in Figure 3. The model incorporates the HFNC system and the VC, including the NC, the OM, and the patient.
The arrows shown in Figure 3 indicate the direction of each specific flow which can be unidirectional (single arrow) or bidirectional (double arrow). Considering as positive flows those directed toward the node and as negative those directed outward the node, the application of the continuity law (currently Kirchoff’s law) to the nodes 1 and 2 gives the following equations:
where Fnost is the flow around the NC, Forop is the flow passing by the oropharynx, and Fmout is the flow crossing the mouth. By inserting Equation (2) in Equation (1), the following equations can be obtained:
Fvent = Fnost + Forop
Forop = Fmout + Fresp
Fvent − Fnost = Fmout + Fresp
Fresp = Fvent − (Fnost + Fmout)
Applying the continuity law to the node 3, the following equation can be written:
where Fpat_leak is the total amount of air leak occurring at patient external airways. By inserting Equation (5) in Equation (4), the following equation can be obtained:
Fnost + Fmout = Fpat_leak
Fresp = Fvent − Fpat_leak
Applying the continuity law to the node 4, the following equation can be written:
where Fmask_leak is the flow leak along the OM edge. Finally, by inserting Equation (7) in Equation (6) the following equation can be obtained:
Fpat_leak = Fmask + Fmask_leak
Fresp = Fvent − Fmask − Fmask_leak
From Equation (8) it is clear that in order to compute the waveform of Fresp it is necessary to monitor the waveform of three flows, two of which, Fvent and Fmask, are directly available by PNT_1 and PNT_2, respectively. The third, i.e., Fmask_leak, was calculated by the flow-based version of a specific flow-leak correction algorithm, implemented online in the functional features of Pro_HFNC, which has already proven its effectiveness in advanced experimental test and in the clinical setting of HFNC [13]. Such version of the algorithm requires inputs from the monitoring of both Fvent and Fmask [13].
Once Fresp waveform was computed, the waveform associated with the change in inspiratory tidal volume (VTi) was calculated by Fresp integration over inspiratory time.
2.6. Experimentals
2.6.1. Setup
The Pro_HFNC consisted of the following functional units (Figure 1 and Figure 2): HFNC flow meter; DFT, which allowed for monitoring Fsyst signal; HH; PNT_1, which allowed for monitoring Fvent signal; VC; OM; Transducer Unit (TU); Electronic Unit (EU); and laptop personal computer (LAP).
The Pro_HFNC was connected to the patient by esophageal (EC) and pharyngeal (PC) catheters for relative pressure measurements (Pes, Pph), and by an OM equipped with PNT_2, which allowed for the monitoring of Fmask signal (Figure 1, Figure 2 and Figure 3). Each patient studied was monitored by a cardiomonitor (Siemens, SC 9000 XL, Munich, Germany) for peripheral oxygen saturation (SpO2), heart rate, and respiratory rate. Before connecting Pro_HFNC to the patient, HFNC was commenced empirically at 1 L/min/kg and increased to 2 L/min/kg by the attending physician according to blood gases and clinical signs of respiratory distress. After the patient was deemed stable, EC and PC were positioned (an IV bolus of 0.1 mg/kg midazolam was given to the patient to limit discomfort). Each catheter was connected to the TU (Figure 1). Baseline measurements were made during spontaneous breathing in low flow oxygen, then with HFNC. At each step, we respected a stabilization period of 10 min before any measurement. Recordings were made during a 5 min additional period. All recordings were performed in a semi-recumbent position.
2.6.2. Transducer Unit (TU)
The TU comprised a DFT, two PNTs, and an array of four DPTs, two of which were coupled with two PNTs, and the other two were connected with both EC and PC. The DFT is the Zephyr Digital HAF series − High Accuracy: full scale = 100 L/min (Honeywell, Charlotte, NC, USA). The PNTs are the PNT series 3700 not heated, Pediatrics flow range 0–160 L/min (Hans Rudolph, Shawnee, OK, USA). The DPTs coupled with the two PNTs are two SensorTechnics 144LU01D-PCB: full scale = ±2.54 cmH2O (SensorTechnics, Inc., Mansfield, CA, USA), whereas those coupled with EC and PC are two SensorTechnics 144LU10D-PCB: full scale = ±25.4 cmH2O.
2.6.3. Electronic Unit (EU)
The EU included two components: the PicoScope 4824 portable oscilloscope, Pico Technology, St Neots, UK (OS), and the Arduino Input/Output board (AB). The OS has several functions: (1) monitoring the DPTs output voltage signals, (2) converting them into the appropriate physical units, (3) filtering the signals, and (4) sampling and acquiring data for online and offline analysis and elaboration. The OS presents the following functional features: 8 independent input channels, 20 MHz bandwidth, 80 MS/s sampling rate, and 12-bit vertical resolution. The AB was used to convert the DFT digital output signal into the appropriate physical unit.
2.6.4. Laptop Personal Computer Unit (LAP)
The LAP supported an in-house-developed software to control AB, OS for the monitoring of all the signals, and the MATLAB (R2020a) platform employed for the analysis and the elaboration of all the monitored signals including the flow-based version of flow-leak correction algorithm [13].
2.7. Procedures
2.7.1. Measurements and Errors
In this work, all the data imported by MATLAB routines (Section 2.7.2) are relative to the following respiratory signals acquired by the AB or OS of TU (Figure 1):
- (1)
- Fsyst, obtained from the DFT;
- (2)
- Fvent, obtained from the DPT_1 coupled with the PNT_1;
- (3)
- Fmask, obtained from the DPT_2 coupled with the PNT_2;
- (4)
- Pes, obtained from the DPT_3;
- (5)
- Pph, obtained from the DPT_4.
Accuracy is the maximum deviation in output from nominal value over the entire calibrated flow/pressure range at 25 °C. Accuracy errors include offset, full-scale span, linearity, flow/pressure hysteresis, and repeatability. Total error includes accuracy errors, temperature span, and thermal hysteresis. The typical uncertainty (error) of measurement was 0.20 L/min (±0.10 L/min) for Fsyst, 0.25 L/min (±0.13 L/min) for Fvent and Fmask, and 0.10 cmH2O (±0.05 cmH2O) for Pes and Pph. All these measurement errors are compatible with the accuracy and precision required for processing Fsyst, Fvent, Fmask, Pes, and Pph signals; for determining the optimal Fvent; for the computation of the flow-based version of the correction algorithm; and for calculating all the parameters of the patient’s respiratory profile.
Considering that the maximum expected breathing frequency is 120 acts per minute, corresponding to 2 Hz, the acquisition of the Fvent, Fmask, Pes, and Pph signals was performed by setting OS with the following parameters:
- (1)
- A time window of 10 s;
- (2)
- A sampling rate of 1500 samples/s, producing a total number of 15,000;
- (3)
- A low pass filter, with a cut-off frequency of 5 Hz, to reject any kind of noise affecting the data.
The time window was selected in order to monitor about 10 respiratory cycles, while the sampling rate was selected in order to fit the scan speed of the time window with the maximum breathing frequency. As low pass filter, the OS uses a digital moving average filter for low cut-off frequencies. The OS adjusts the length of the filter to obtain the selected cut-off frequency, defined as the first minimum in the frequency response. There is a significant loss of signal above the cut-off frequency. This filter changes a front vertical descent into a linear one. This kind of filter does not introduce any artifact in the signals, so it does the selected cut-off frequency, which is considerably greater than the maximum expected breathing frequency.
2.7.2. MATLAB Routines
The ALGOLEAK routine implements the flow-based version of a proper and specific algorithm [13] that computes the waveform of Fpat_leak from Fvent and Fmask monitoring and then of Fresp from Equation (8).
The MONITOR routine plots any combination of synchronized Fvent, Fpat_leak, Fresp, VTi, Pph, and Pes signals within the selected time window, and also enables the calculation of the number of respiratory cycles. Statistical analysis, including mean, standard deviation, and standard error of the mean, has been applied to the total number of respiratory cycles for all the variables studied.
The TIME routine calculates the time of onset (Tins_O) and end (Tins_E) of inspiration and from them, the inspiratory time (Tins), expiratory time (Texp), and respiratory frequency (RR).
Once VTi signal has been calculated as the integration of Fresp over inspiratory time, the FLOW_VOLUME routine computes the total tidal volume (VT) as the difference between VTi at Tins_E and VTi at Tins_O. The FLOW_VOLUME routine also gives the peak inspiratory flow (PIF) as the maximum value of Fresp during inspiration, minute volume (MV) as the product between VT and RR, the ratio between VT and Tins (VT/Tins) or Texp (VT/Texp), and the ratio between RR and VT (RR/VT).
The PRESSURE routine implements the algorithm that defines the beginning of the inspiratory effort, i.e., beginning of negative Pes drop (Tdrop_0), and computes the interval between Tdrop_0 and Tins_O (i.e., Tdelay). The PRESSURE routine also computes the intrinsic positive end expiratory pressure (PEEPi), total change in Pes across inpiration (∆Pesi), transpulmonary pressure at end of inspiration (Ptpei), dynamic lung compliance (CLdyn), and total lung resistance (RLtot). PEEPi was determined as the difference between Pes at Tdrop_0 and Pes at Tins_O, ∆Pesi as the difference between Pes at Tins_O and Pes at Tins_E, whereas Ptpei as Pes value at Tins_E. CLdyn was determined as the ratio of VT to ∆Pesi, while RLtot as the mean difference between total and static Pes values divided by the mean Fresp, both evaluated considering Tins interval. The inspiratory static Pes curve (Pesst) was extrapolated by dividing VTi by CLdyn. In addition, the peak-to-peak variation in Pes swing (∆Pes_sw) was calculated.
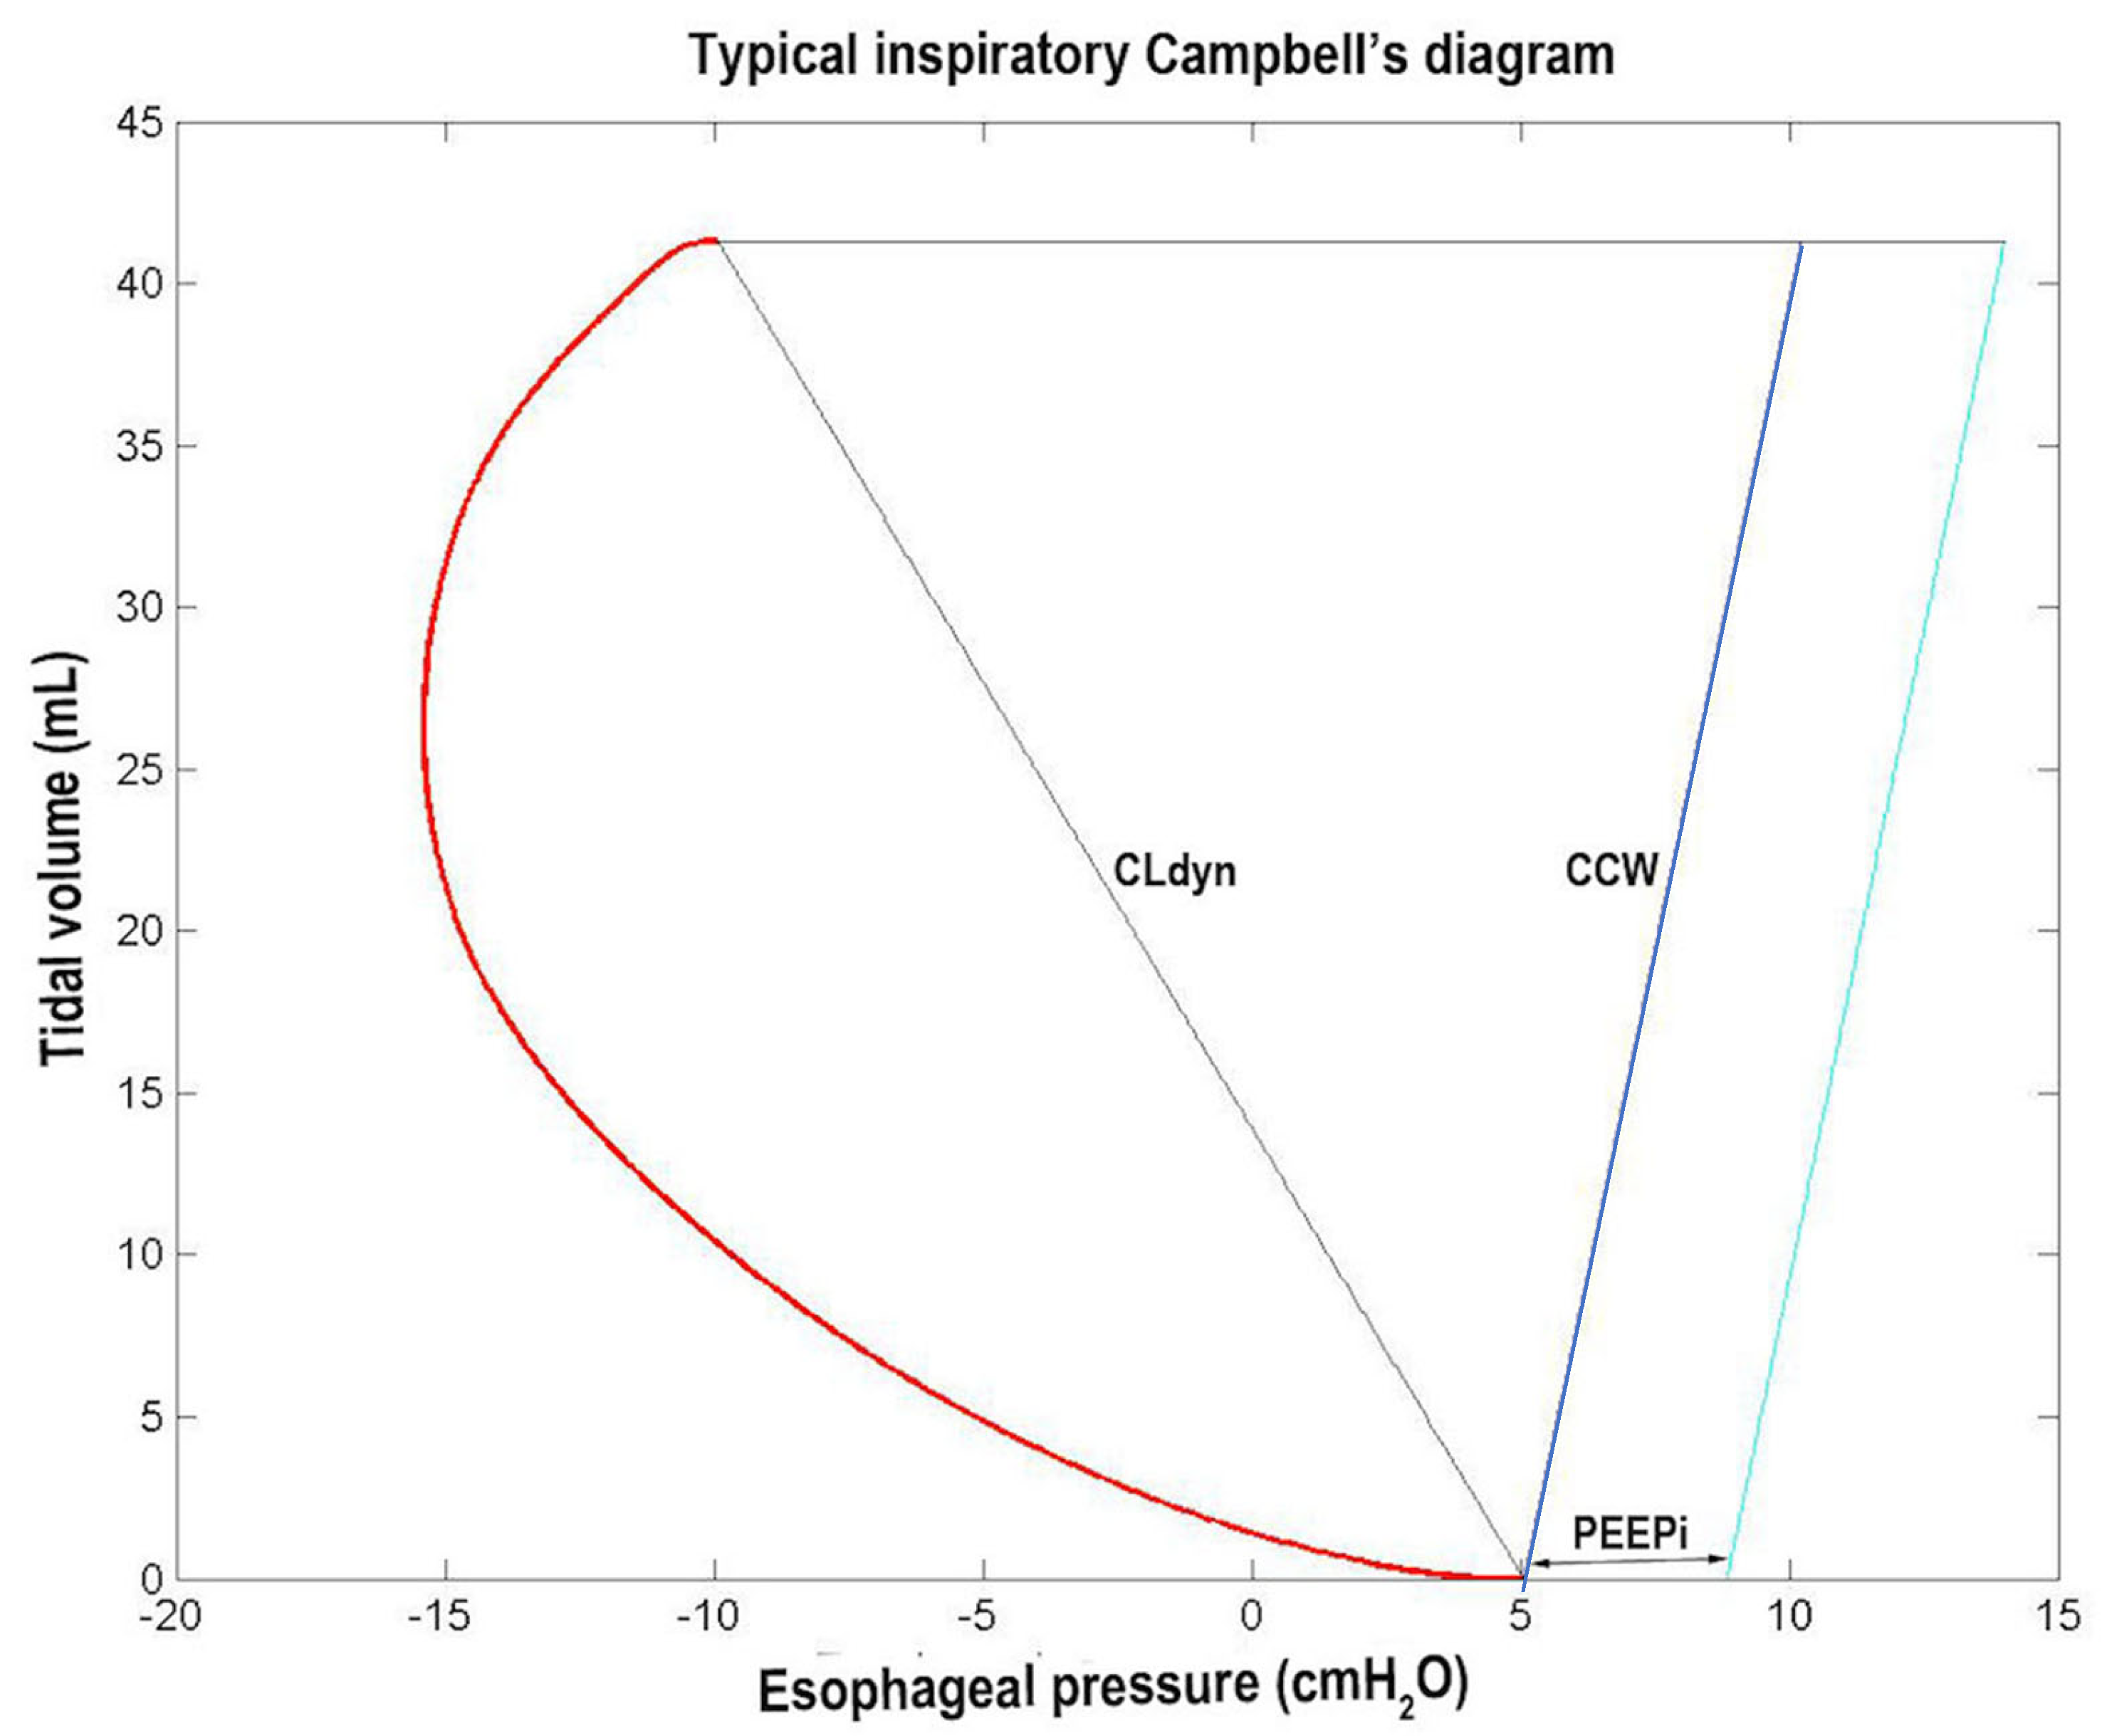
The CAMPBELL routine plots the inspiratory Campbell diagram with VTi on the Y axis and Pes on the X axis. The diagram shows the inspiratory Pes curve and the lines of Pesst, extrapolated line of chest wall static recoil pressure (Pstcwr), and Pstcwr increased by PEEPi value. Pstcwr has been extrapolated dividing VTi by the static compliance of the chest wall (CCW), which has been estimated as 4% of the theoretical inspiratory vital capacity divided by 1 cmH2O.
From the Campbell diagram, the WORK routine computes the different components of inspiratory WOB, which are as follows:
- (1)
- Inspiratory resistive work (WOBres) is calculated as the area delimited by the Pes curve and the Pesst line;
- (2)
- Inspiratory elastic work related to lung expansion (WOBelas_lung) is calculated as the triangular area delimited by the Pesst lines and the horizontal line corresponding to the value that Pes assumes at Tins_O;
- (3)
- Inspiratory elastic work related to chest expansion (WOBelas_chest) is calculated as the triangular area delimited by the Pstcwr lines and the horizontal line corresponding to the value that Pes assumes at Tins_O;
- (4)
- Additional elastic work done by the patient if PEEPi occurs (WOB_PEEPi) is calculated as the area between the two Pstcwr lines spaced by PEEPi.
The total elastic work (WOBelas_tot) was calculated as the sum of WOBelas_lung, WOBelas_chest, and WOB_PEEPi. The total inspiratory WOB (WOBtot) was computed as the sum of WOBelas_tot and WOBres components, while WOBtot per minute (WOBtot_min) and WOBtot per liter (WOBtot_lit) as the product of WOBtot and RR and the ratio of WOBtot to VT. The units employed for WOB were cmH2Oliters or joule.
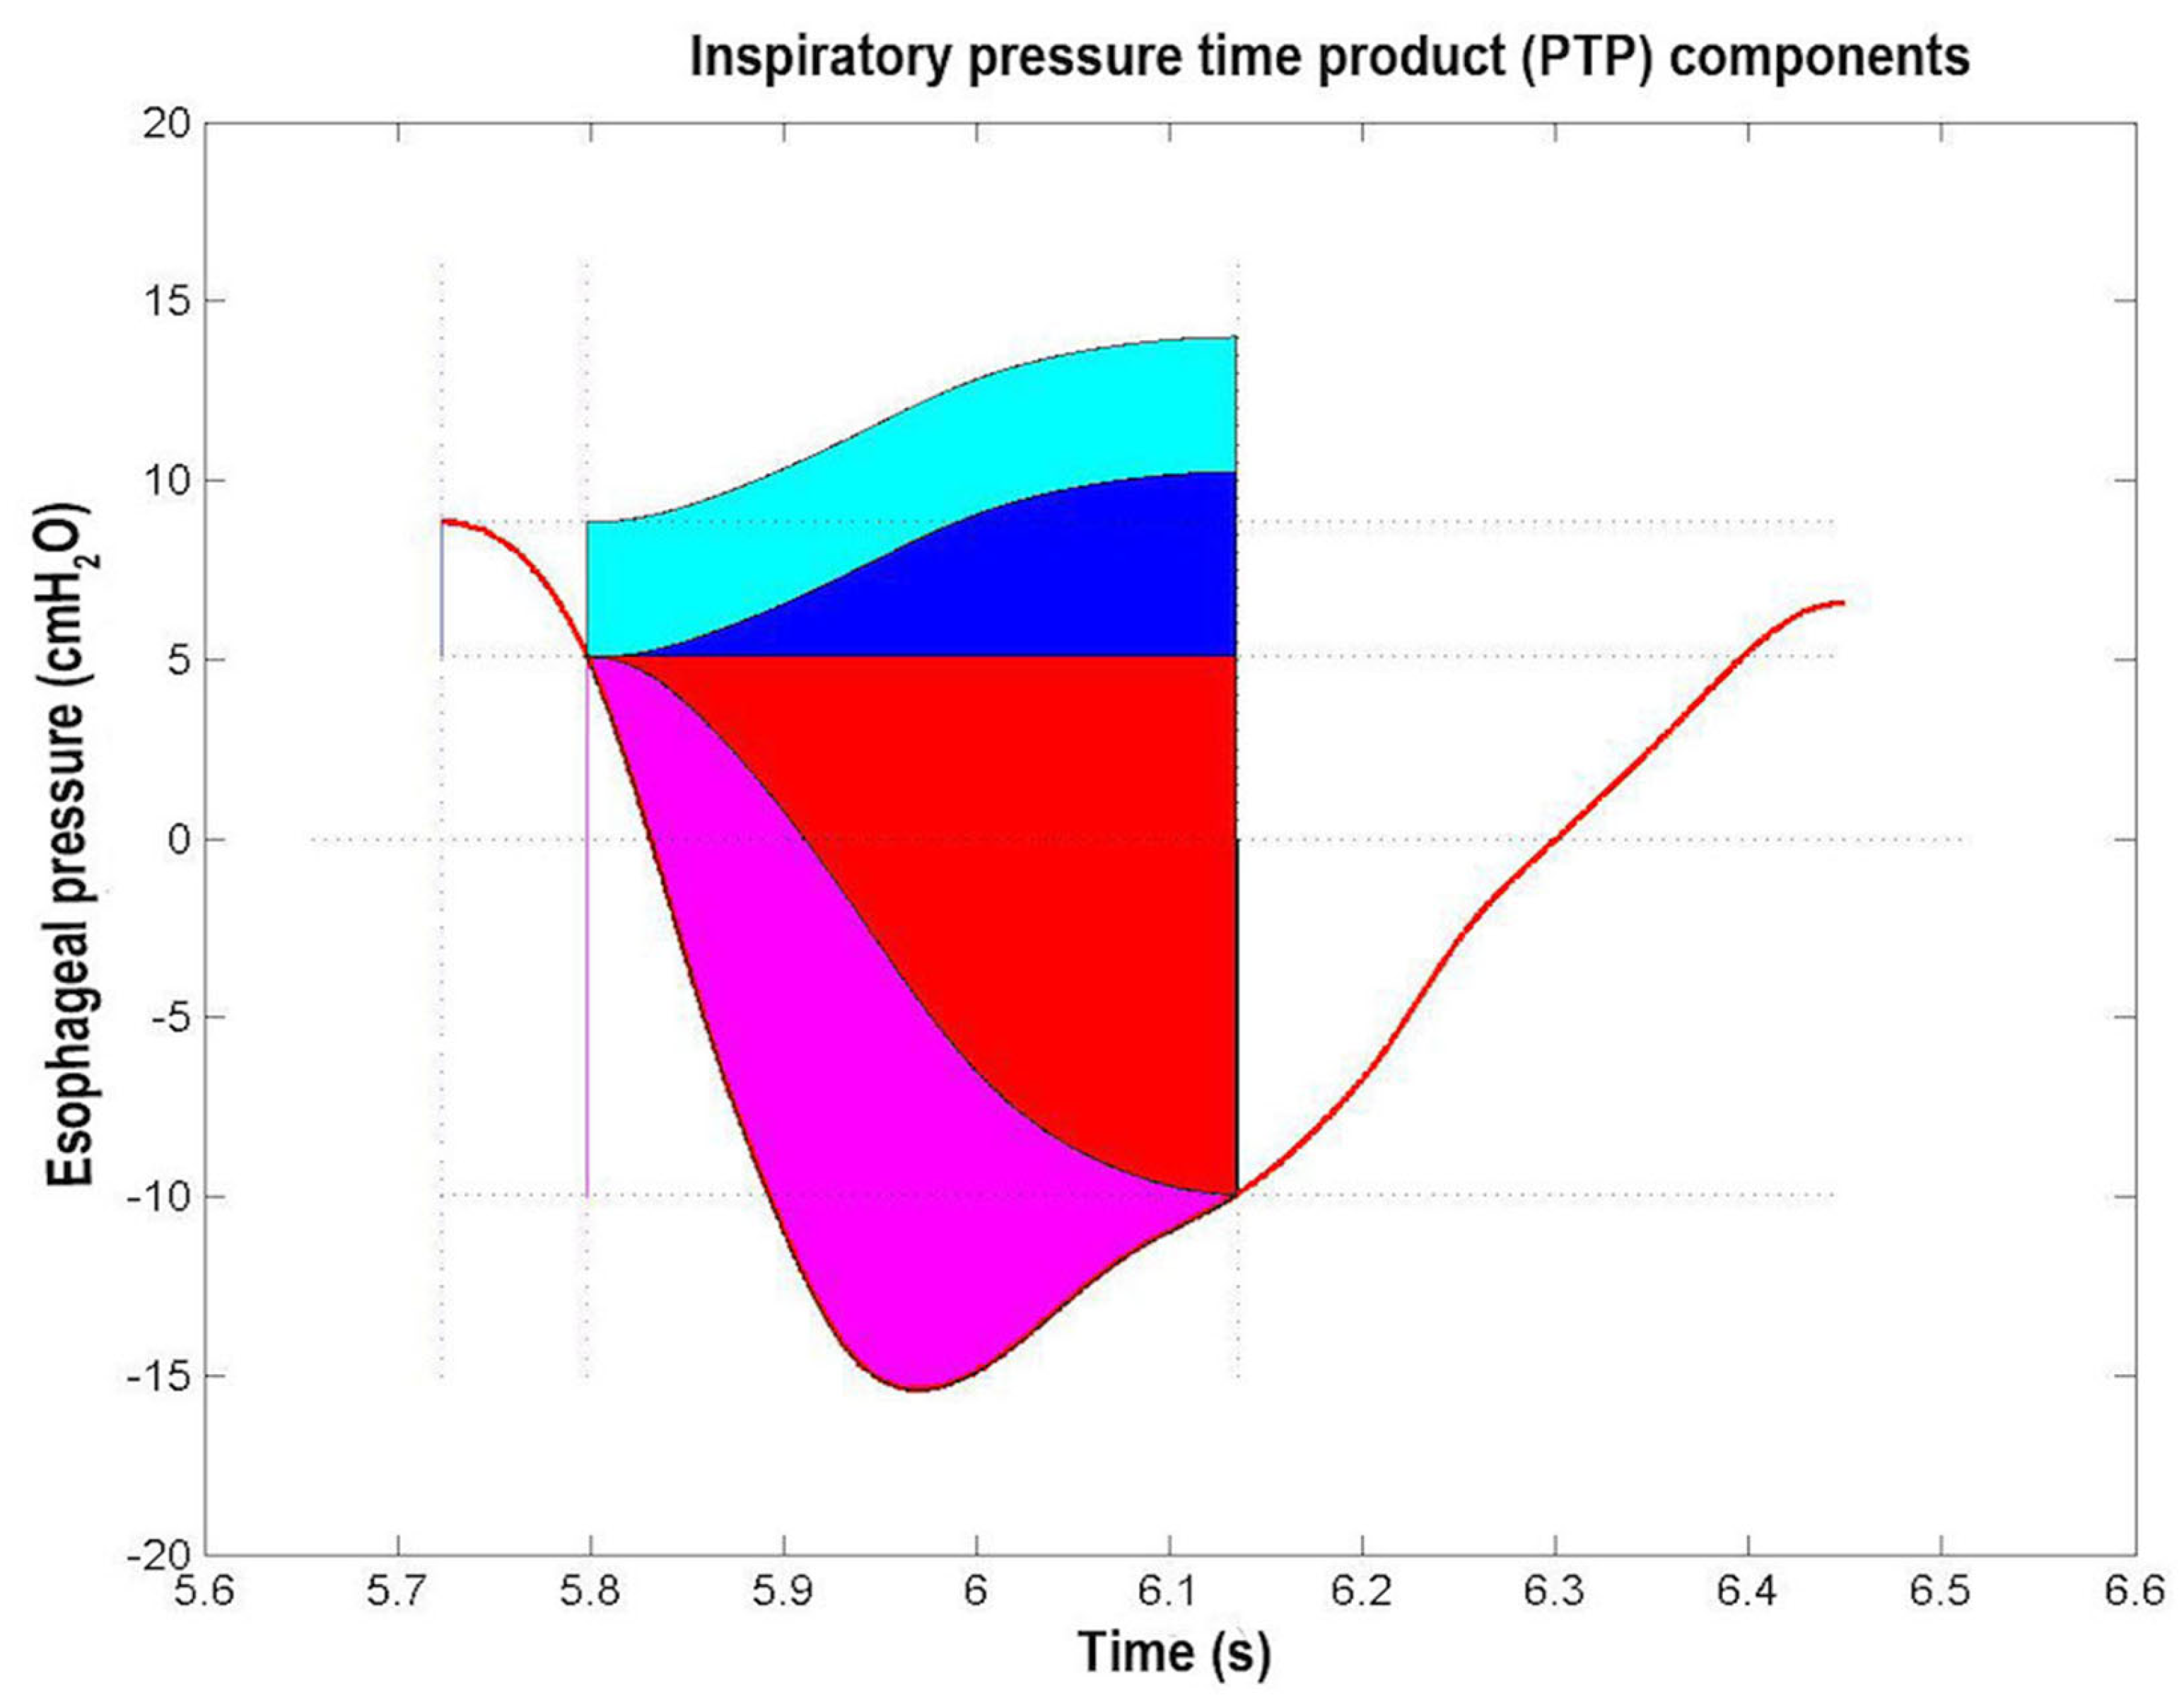
The PTP routine computes the different components of inspiratory PTP from Pes, Pesst and Pstcwr curves as follows:
- (1)
- Inspiratory resistive PTP (PTPres) is calculated as the area delimited by the Pes and the Pesst curves;
- (2)
- Inspiratory elastic PTP related to lung expansion (PTPelas_lung) is calculated as the area delimited by the Pesst curve and the horizontal line corresponding to the value that Pes assumes at Tins_O;
- (3)
- Inspiratory elastic PTP related to chest expansion (PTPelas_chest) is calculated as the area delimited by the Pstcwr curve and the horizontal line corresponding to the value that Pes assumes at Tins_O;
- (4)
- The additional elastic PTP done by the patient if PEEPi occurs (PTP_PEEPi) is calculated as the area between the two Pstcwr curves spaced by PEEPi.
The total elastic PTP (PTPelas_tot) was calculated as the sum of PTP_PEEPi, PTPelas_lung, and PTPelas_chest. The total inspiratory PTP (PTPtot) was computed as the sum of PTPelas_tot and PTPres components, while PTPtot per minute (PTPtot_min) as the product of PTPtot and RR. The units employed for PTP were cmH2Os.
2.7.3. Mathematical Model
The mathematical model employed here is based on linear respiratory mechanics applied for determining the different components of resistance and compliance related to lung and chest expansion/recoil dynamics [14,15,16]. The model takes into account quasi-static variations of such respiratory parameters inside each single spontaneous breath. The effects of non-linearity on respiratory mechanics and, in particular, on WOB and PTP, had been evaluated and considered negligible [17].
2.8. Application of Pro_HFNC to Set HFNC Optimal Flow
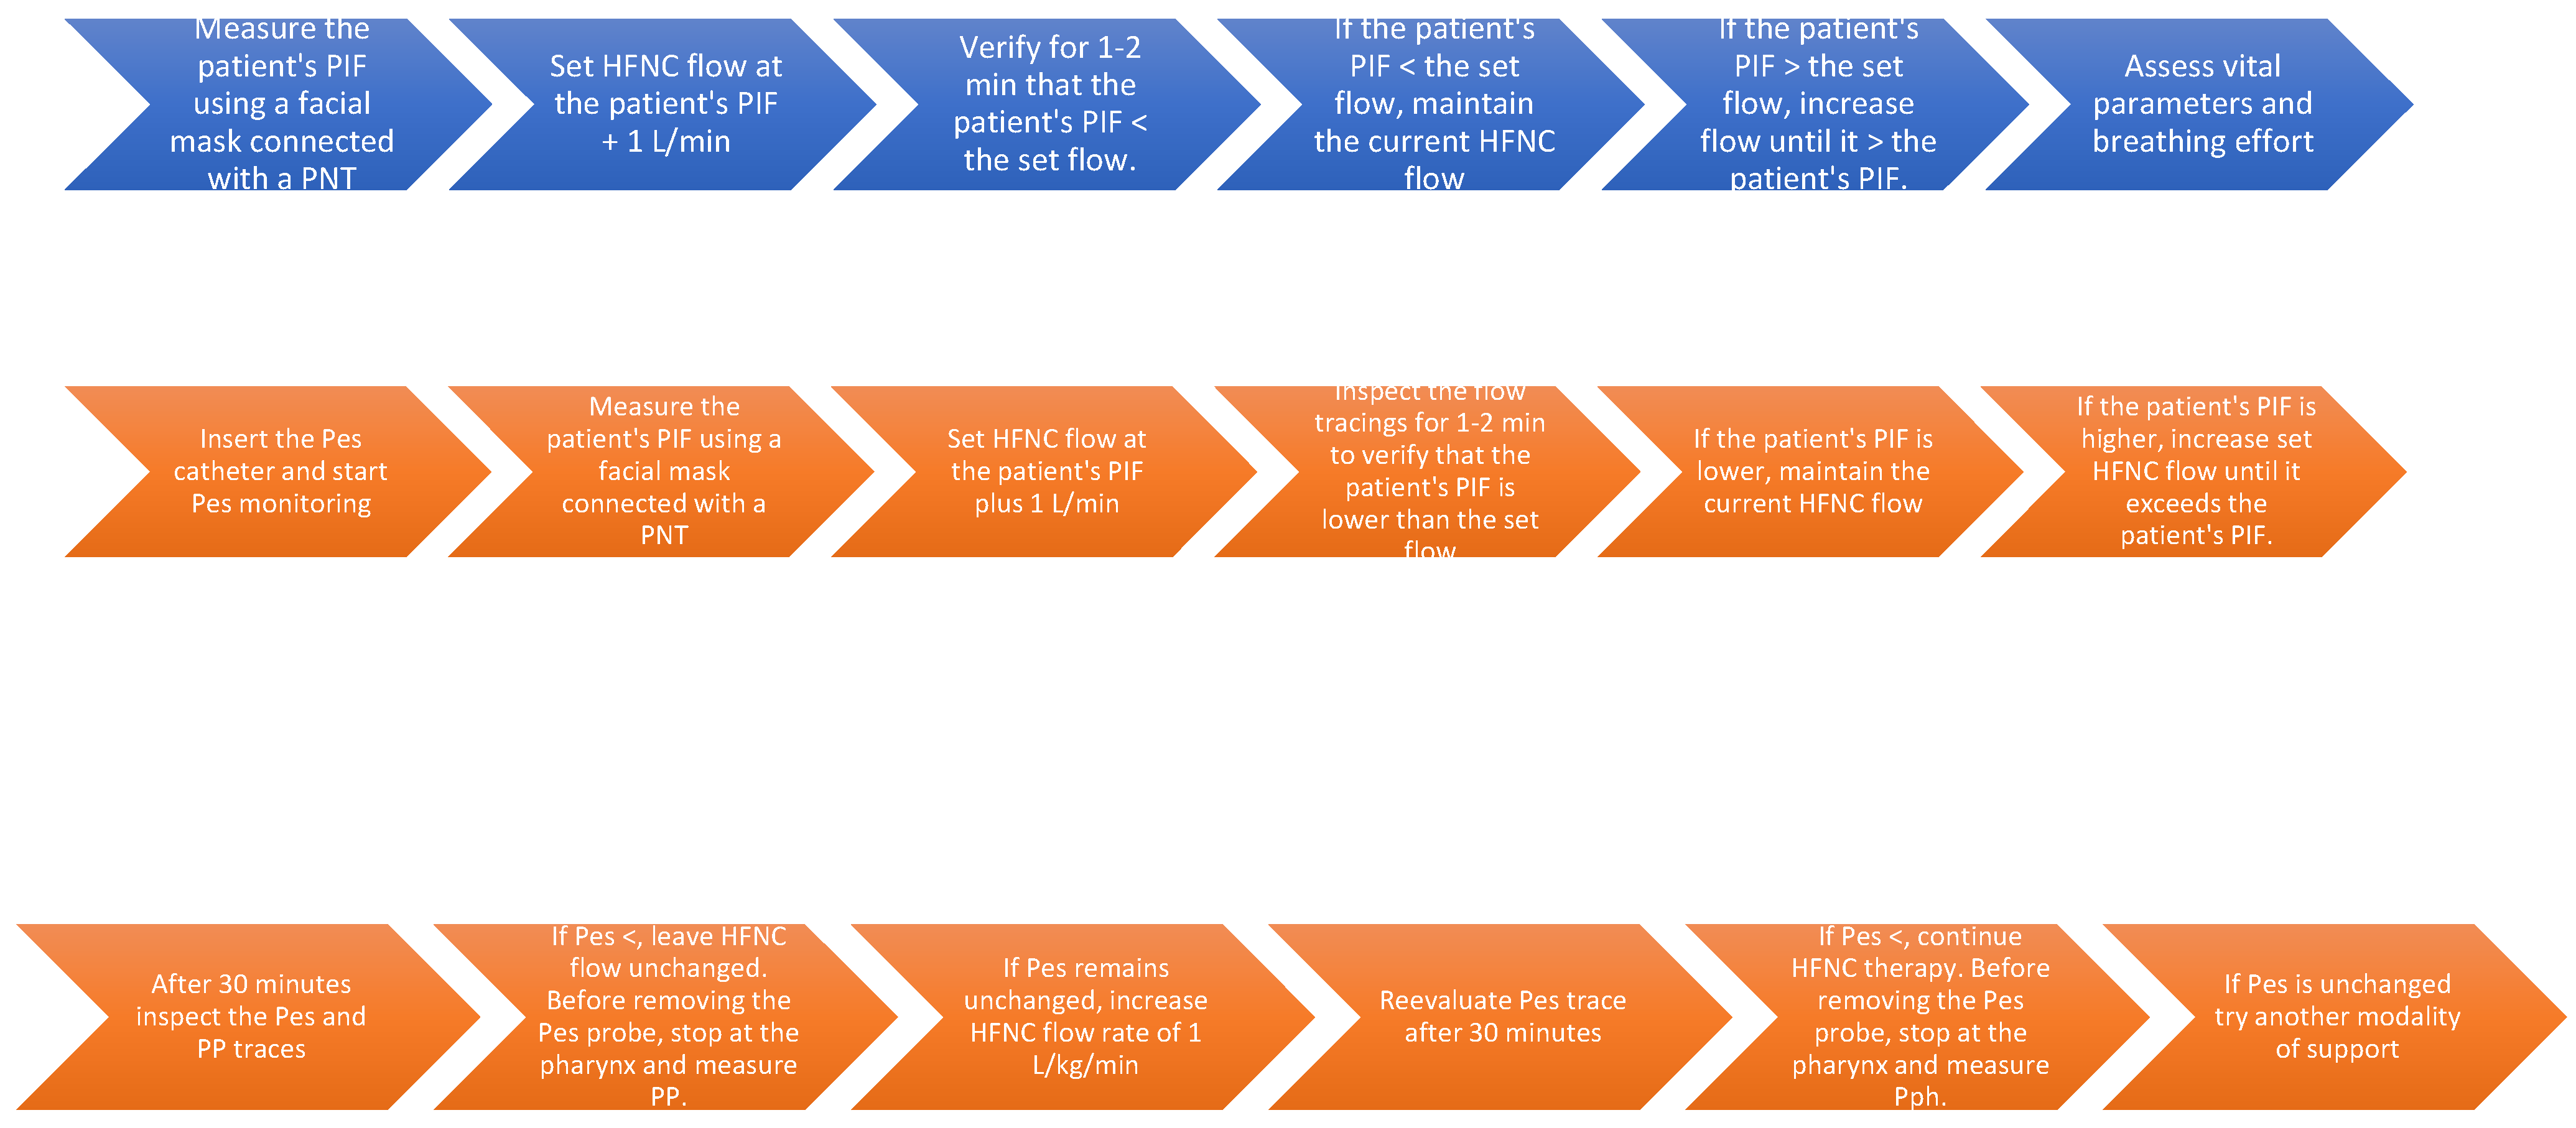
The Pro_HFNC was clinically tested on five infants under six months of age who were treated with HFNC for mild to moderate respiratory distress. The clinical protocol is shown in Figure 4 in two flowcharts (blue and orange background). Pes measurement may or may not be included. Prior to commencing the HFNC, an esophageal catheter was inserted to measure Pes and a ventilatory mask connected to a PNT (PNT_2) was applied on the infant’s face to measure PIF. The first 20 s of monitoring were discarded due to the potential effect on the flow signal of the trigeminal reflex elicited by the mask’s contact with the face. When the flow signal was stable and the breathing was regular, we assumed that the PIF measurement was accurate. At this point, the HFNC flow rate was set 1 L/min higher than the infant’s PIF. After HFNC was initiated, we measured the infant’s PIF while the facial mask was applied to the infant’s face without moving the nasal cannula. Once again, the first page was discarded, and the flow signal was recorded for 60 s (3 monitor pages). All signals were analyzed offline.
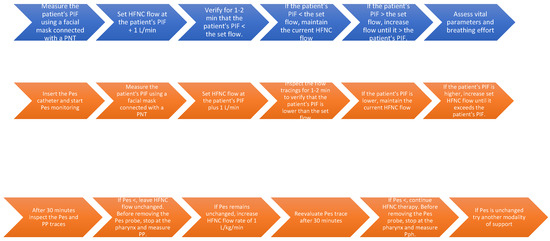
Figure 4.
The flow chart in blue illustrates the protocol for using the monitoring system with only flow measurement, while the chart in orange displays the protocol based on both flow and pressure measurements.
3. Results
3.1. Optimal Flow Detection
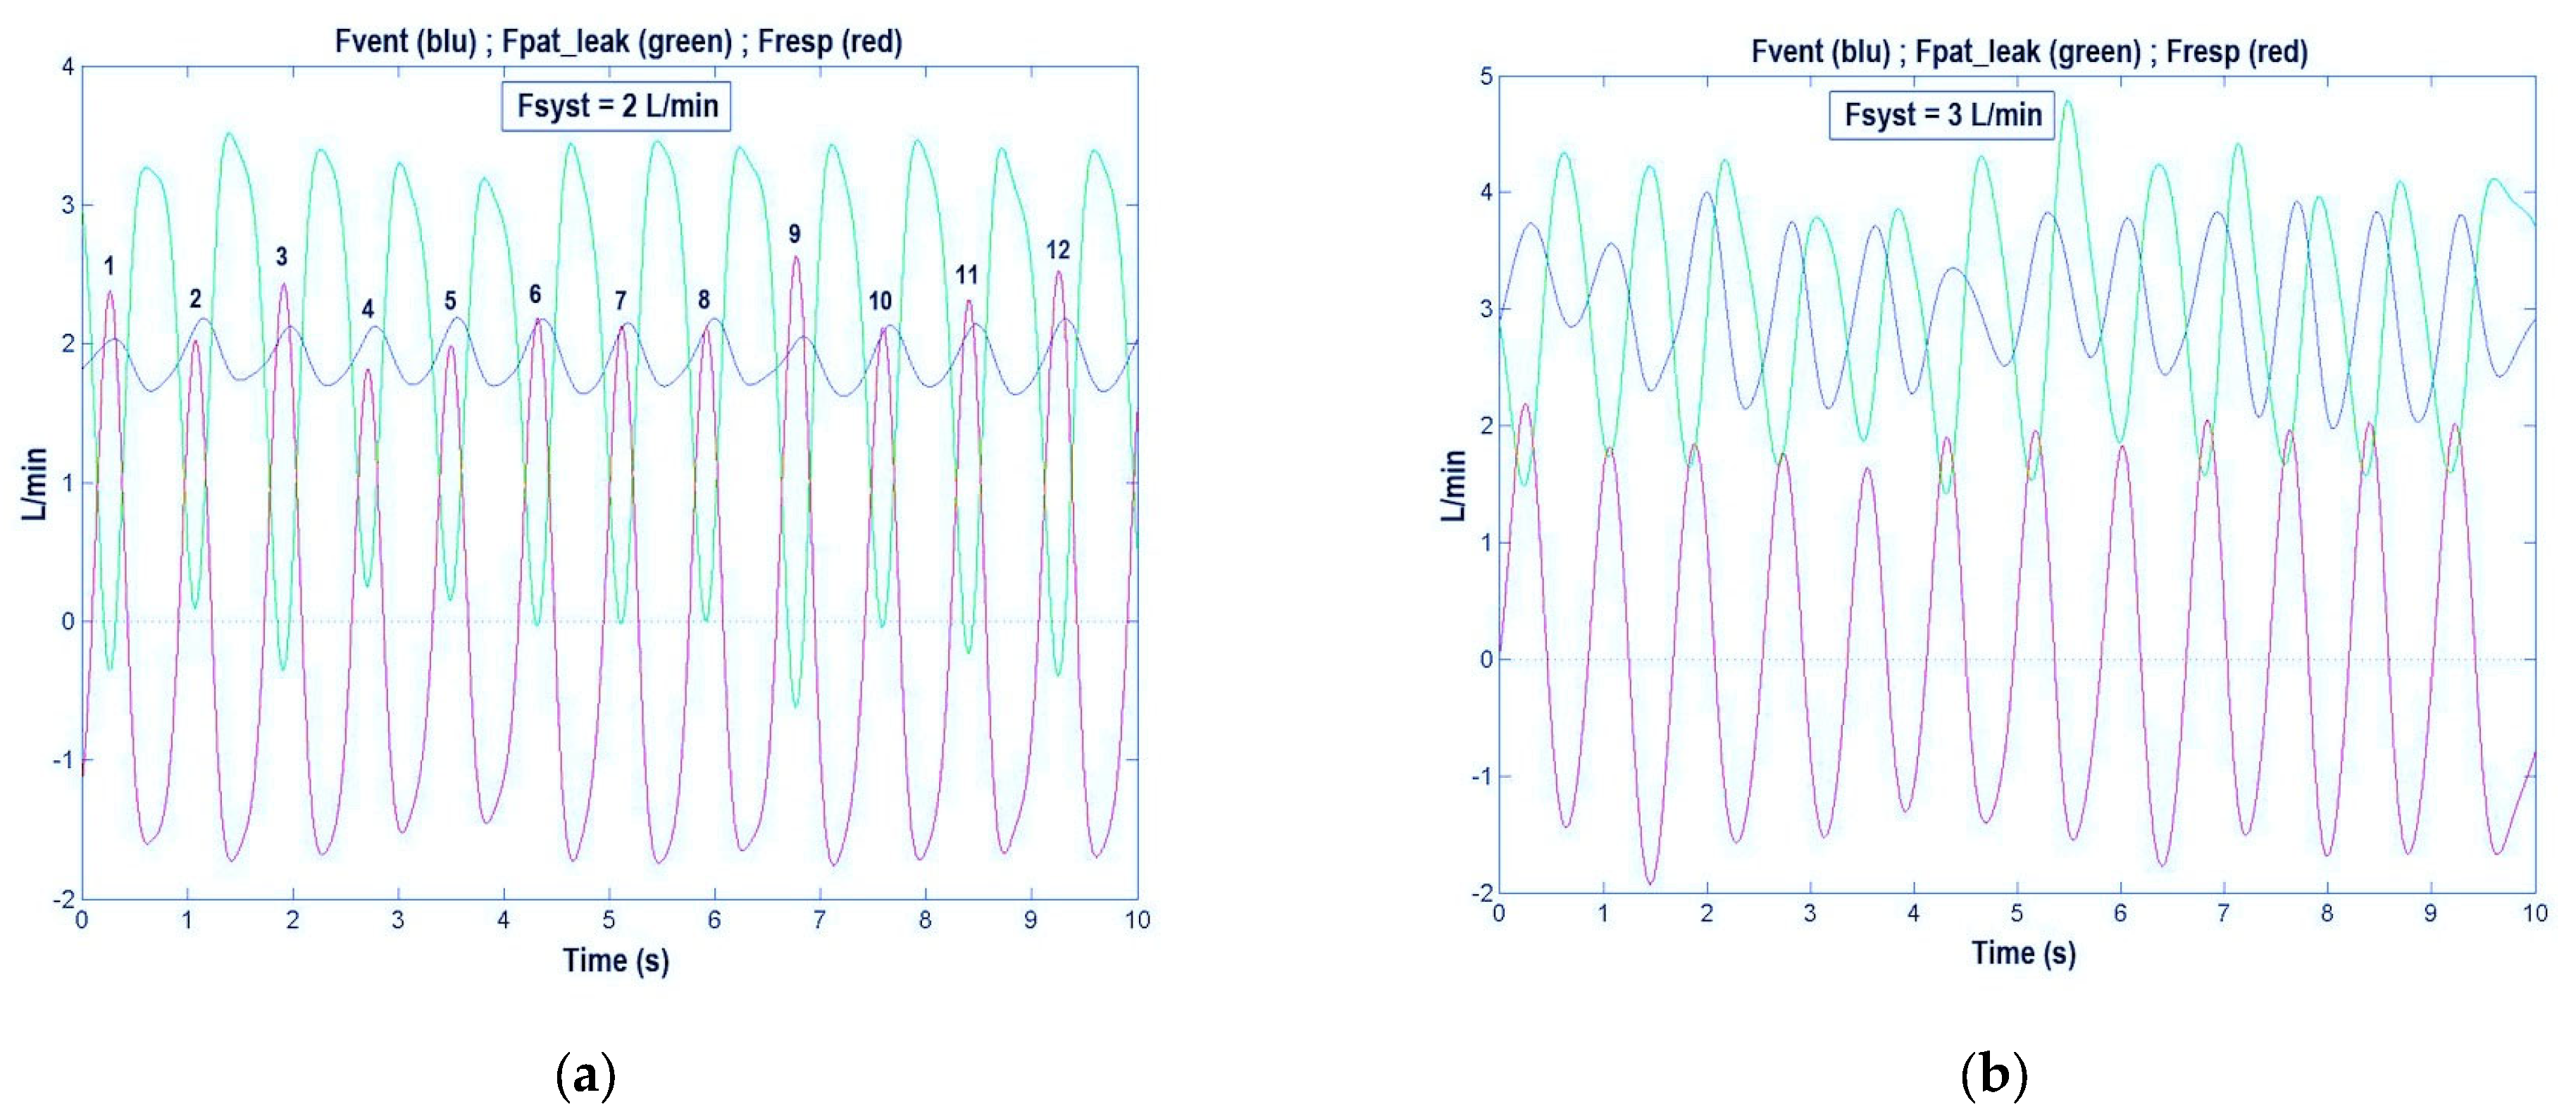
In Figure 5a are shown Fvent (blue trace), Fpat_leak (green trace), and Fresp (red trace), as they appeared on the LAP’s monitor when the Pro_HFNC was connected to a 2.3 kg infant with bronchiolitis treated with the HFNC set at 2 L/min. As expected, we found that the Fvent signal was not constant but sinusoidal in shape according to the patient’s breathing effort. The sinusoidal shape of the Fvent signal makes it more difficult to understand which flow was set on the HFNC by the flow meter, and whether the resulting Fvent was high enough to meet the patient’s flow demands. By turning the PS coupled with DFT on the position 2 (i.e., patient’s disconnection from the VC, Figure 1) we found that Fsyst value was slightly lower than the flow meter estimated value, confirming the inappropriateness of the flow meter to indicate exact Fsyst value.
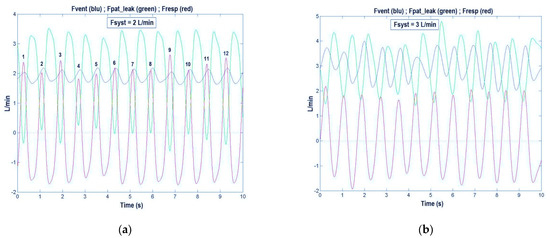
Figure 5.
The blue trace shows the high-flow nasal cannula (HFNC) flow delivered to the patient (Fvent) and the green trace shows the total flow leak from patient (Fpat_leak), which represents the difference between Fvent and the respiratory flow (Fresp, red trace). The three traces permit us to verify if the Fvent meets the patient’s inspiratory flow demands, i.e., if the condition Fvent > Fresp is always true or, alternatively, if the condition Fpat_leak > 0 is always true. (a) Fsyst = 2 L/min: Fvent is insufficient in several breaths: 1, 3, 6, 7, 9, 10, 11, and 12. (b) Fsyst = 3 L/min: Fvent always meets the patient’s flow demands (Fvent is always higher than Fresp) (see Section 3.1).
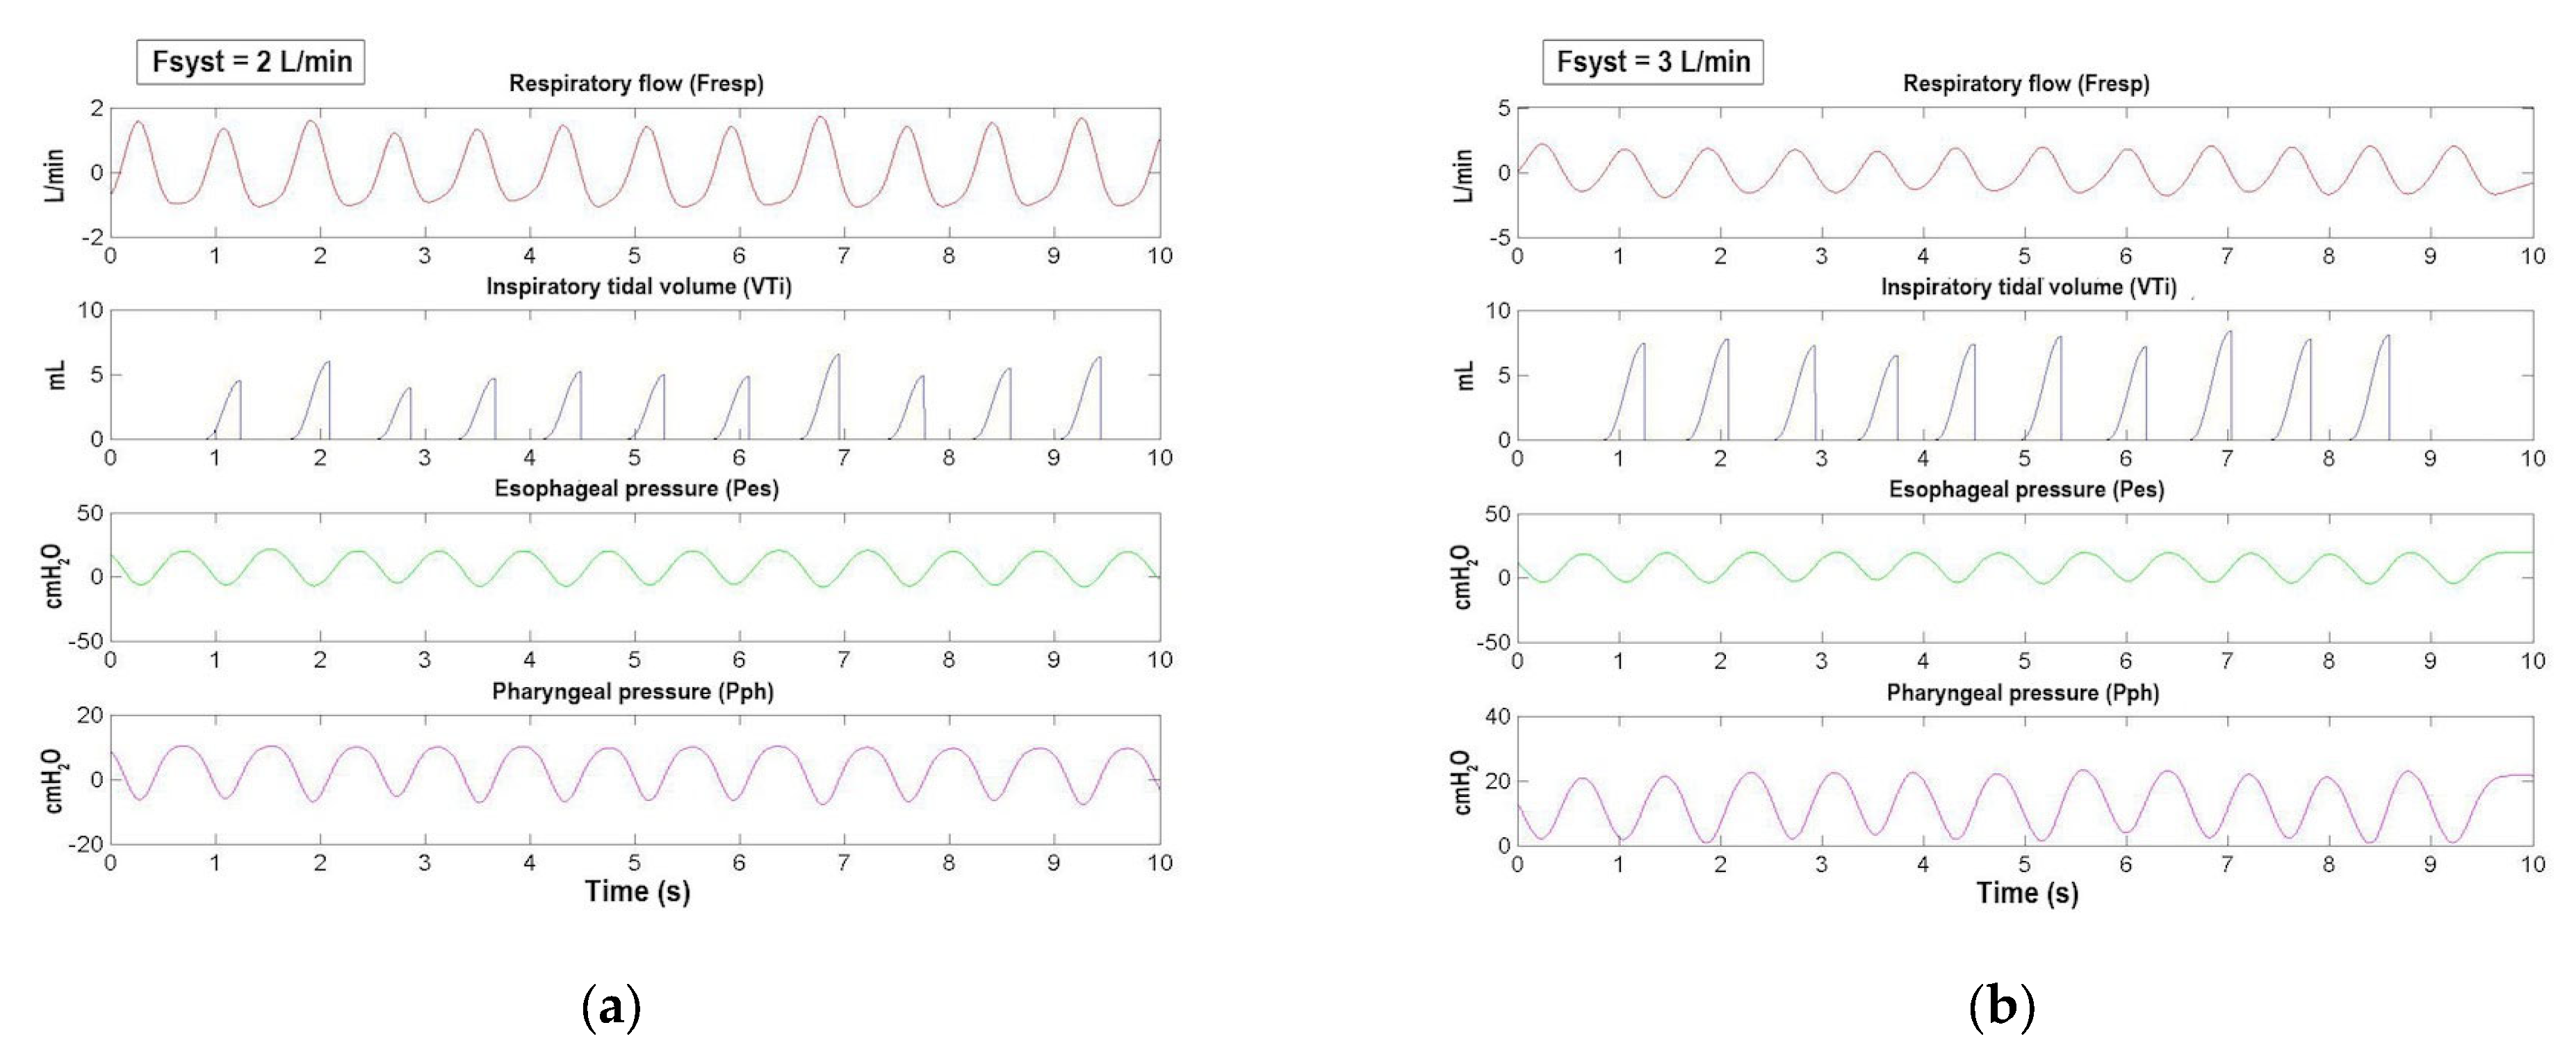
To verify on the LAP’s monitor the condition of optimal flow rate in every instance of breath (Fvent > Fresp), while the patient was receiving the HFNC treatment, we looked at Fvent, Fresp, and Fpat_leak signals, following the subsequent reasoning: if Fvent is higher than Fresp at any time of inspiration, no air from the environment should be drawn into the OM. As a result, Fpat_leak signal should always be positive, i.e., no gas flow is entering the OM from the environment. Differently, if at any time Fpat_leak signal becomes negative during inspiration that will indicate that some air from the environment is entering the OM and, thus, the patient’s airway. This condition is undesirable when using HFNC because it hampers its mechanisms of action. Thus, by observing the green line (Fpat_leak signal), it is possible to find the breaths in which the Fpat_leak troughs are below the zero line (Figure 5a). In this case, by increasing Fsyst it will be possible to re-establish the condition by which Fpat_leak is always above the zero line (Figure 5b). Another way to look at the appropriateness of HFNC flow rate is based on the control of the blue trace (Fvent), i.e., whether it is above or below the red trace (Fresp). If HFNC is working properly, the peaks of the blue trace (Fvent signal) should always be above the peaks of the red trace (Fresp signal). In Figure 5a, it can be noted that the patient’s breaths 1, 3, 6, 7, 9, 10, 11, and 12 did not meet the requirements for the appropriateness of Fsyst (Fpat_leak below the zero line), while, in Figure 5b, increasing Fsyst from 2 to 3 L/min, Fpat_leak troughs became always positive and, accordingly, the peaks of Fvent (blue trace) were always higher than those of Fresp (red trace). Finally, in Figure 6a, where Fvent does not meet Fresp (Fsyst = 2 L/min), it can be noted that the Pph troughs were always below the zero line, whereas in Figure 6b, where F_vent is always higher than F_resp (Fsyst = 3 L/min), all troughs of Pph trace were positive.
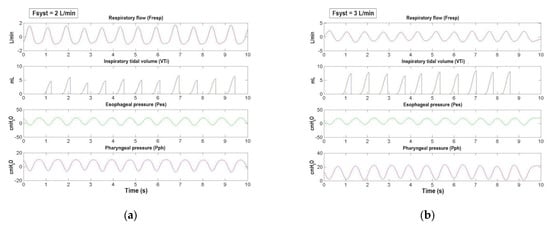
Figure 6.
From top to bottom are shown the synchronized signals of respiratory flow (Fresp, red race), inspiratory tidal volume (VTi, dark gray trace), esophageal pressure (Pes, green trace), and pharyngeal pressure (Pph, magenta trace) of a representative infant as a function of time. (a) As we showed in Figure 5a by using Fvent, Fpat_leak, and Fresp signals, in this figure (Fsyst = 2 L/min) we confirmed how Fvent was insufficient to meet Fresp by using the Pph signal, whose troughs are always negative. (b) Differently from (a), in this figure (Fsyst = 3 L/min), Fvent is increased to meet Fresp. This condition is confirmed by the troughs of the pharyngeal pressure, which are always positive (see Section 3.1). From these signals it was possible to calculate the most significant parameters of the patient’s respiratory profile (see Section 3.2).
To calculate the amount of volume drawn from the environment into OM (i.e., when Fvent is lower than Fresp and Fpat_leak is negative) we calculated the area (integral over time) of the green curve (Fpat_leak) part below the zero line and subtracted this value from the area of the red curve (Fresp) (Figure 5a).
3.2. Respiratory Profile Evaluation
To calculate any parameter relative to patient’s respiratory profile, we needed first to detect for every breath Tins_O and Tins_E, i.e., the timing of inspiration. The timing of inspiration is crucial for the identification of the onset and the end of inspiration on the Pes and Pph signals. We accomplished this task by looking at the Fresp signal: whenever Fresp crossed the zero line, we were in the presence of either Tins_O or Tins_E. The MATLAB TIME routine was used to differentiate Tins_O from Tins_E. Specifically, if the TIME routine finds a Fresp value corresponding to zero, it checks the algebraic sign of the next value. If the next value is positive then we are in the presence of Tins_O, if negative of Tins_E. Then, by integrating over time the inspiratory tract of the F_resp waveform, we obtain the VTi signal, and therefore VT, as the difference between VTi at Tins_E and VTi at Tins_O. Afterwards, by synchronizing the waveforms of Fresp, VTi, Pes, and Pph (Figure 6a,b shows the signals of a representative infant treated with HFNC therapy), it is possible to calculate the most significant parameters of patient’s respiratory profile (Table 1).

Table 1.
Most significant parameters of patient’s respiratory profile evaluated by Pro_HFNC 1.
To calculate all the parameters listed in Table 1, we have recorded Pes curve synchronized with the Fresp signal.
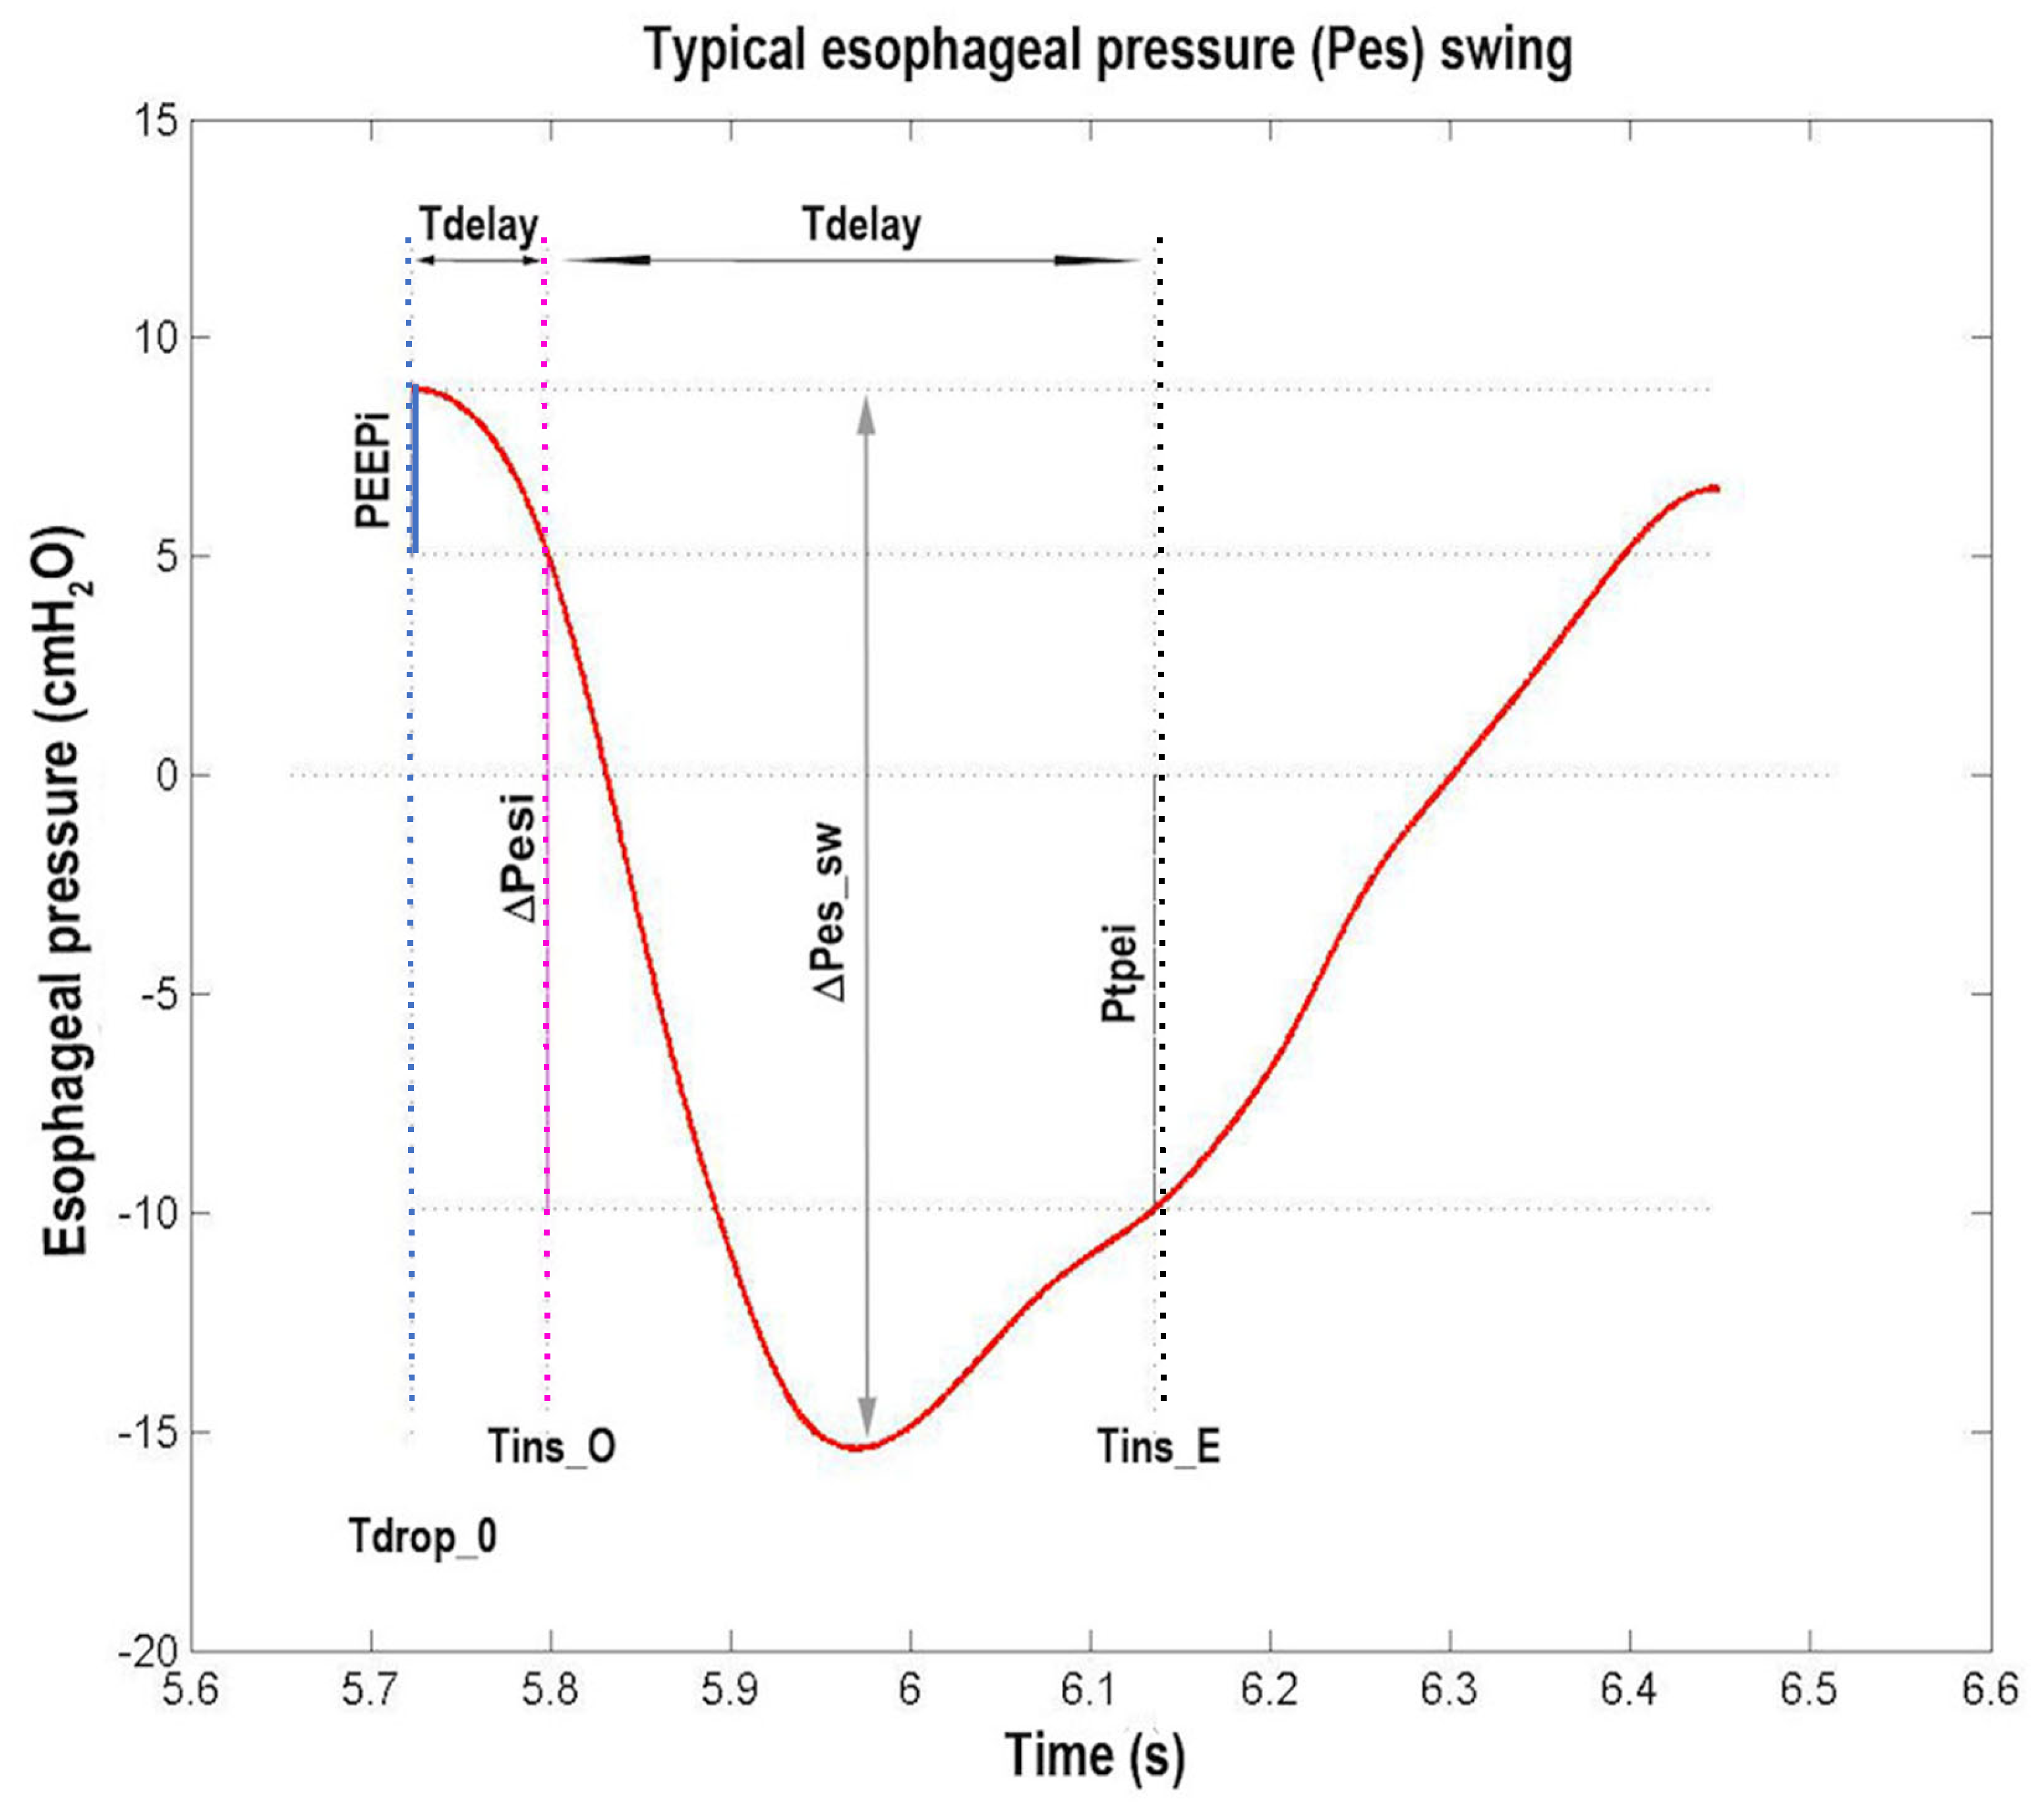
Figure 7 shows how PEEPi, ∆Pesi, ∆Pes_sw and Ptpei were determined on a Pes swing of a representative patient. Figure 8 shows the different areas corresponding to the different inspiratory PTP components and how they were computed (see Section 2.7.2).
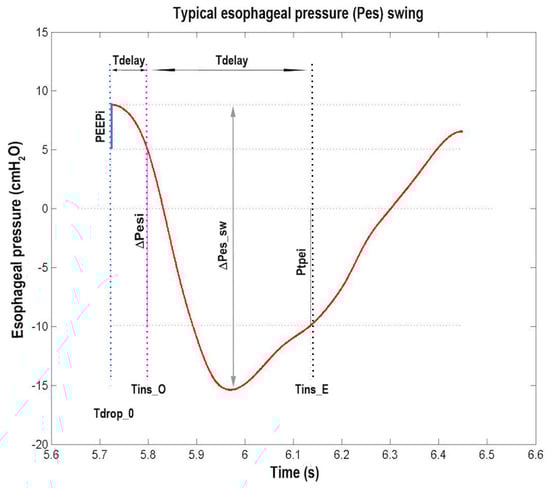
Figure 7.
Typical esophageal pressure (Pes) swing (red trace) of a representative patient as a function of time. The dotted vertical lines are drawn (from left to right) at the beginning of inspiratory effort (Tdrop_0, blue line), at the beginning of inspiration (Tins_O, magenta line), and at the end of inspiration (Tins_E, black line), respectively. The dotted horizontal lines are drawn (from top to bottom) in correspondence to the Pes value at Tdrop_0, at Tins_O, at zero pressure, and at Tins_E. The size of the three continuous vertical segments (from left to right) defines the values of intrinsic positive end expiratory pressure (PEEPi, blue segment), total inspiratory Pes variation (∆Pesi, magenta segment), and transpulmonary pressure at end of inspiration (Ptpei, black segment). The size of the continuous vertical double arrow defines the value of peak-to-peak Pes variation (∆Pes_sw). From left to right, the size of the two continuous horizontal double arrows defines the value of the interval between Tdrop_0 and Tins_O (Tdelay) and of the inspiratory time (Tins), respectively (see Section 2.7.2 and Section 3.2 and Table 1).
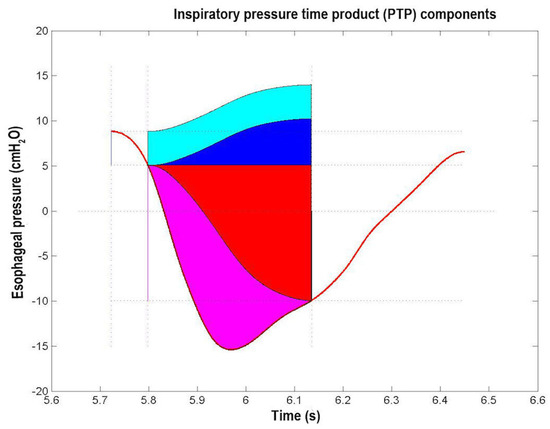
Figure 8.
Inspiratory Pressure Time Product (PTP) of a typical esophageal pressure (Pes) swing (red trace) of a representative patient. The blu segment indicates intrinsic positive end expiratory pressure (PEEPi) value, the magenta segment indicates change in Pes value during inspiration, the black segment indicates the Pes value at the end of inspiration. The areas correspond to the various PTP components, i.e., PEEPi, PTP (PTP_PEEPi, cyan area), chest wall elastic PTP (PTPelas_chest, blue area), lung elastic PTP (PTPelas_lung, red area), and resistive PTP (PTPres, magenta area) (see Section 2.7.2 and Section 3.2 and Table 1).
Finally, Figure 9 shows the curve and lines (CLdyn, CCW) composing Campbell’s diagram, while Figure 10, the different areas corresponding to the different inspiratory WOB components and how they were computed (see Section 2.7.2).
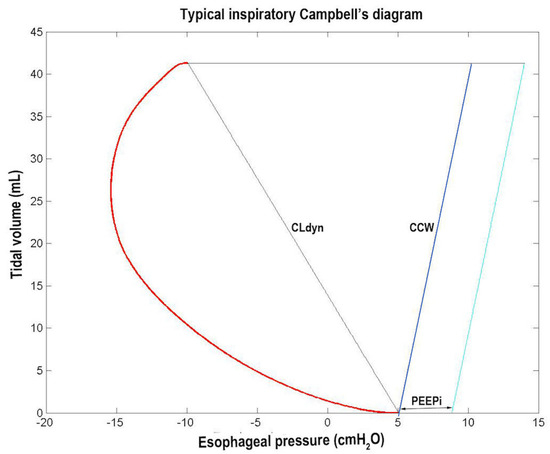
Figure 9.
Typical inspiratory Campbell’s diagram. The red curve represents the esophageal pressure (Pes) swing, while the black, blue, and cyan lines represent the variations during inspiration of the static Pes (Pesst), the extrapolated chest wall static recoil pressure (Pstcwr), and the Pstcwr increased by PEEPi value, respectively (see Section 2.7.2 and Section 3.2 and Table 1).
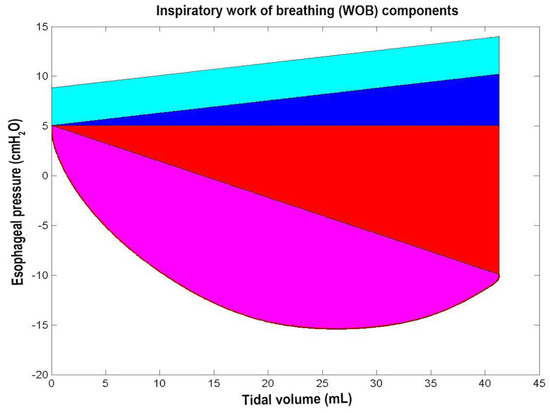
Figure 10.
Inspiratory work of breathing (WOB). The cyan, blue, red, and magenta areas correspond to the following four WOB components: the intrinsic positive end expiratoty pressure (PEEPi) WOB (WOB_PEEPi, cyan area), chest wall elastic WOB (WOBelas_chest, blue area), lung elastic WOB (WOBelas_lung, red area), and resistive WOB (WOBres, magenta area) (see Section 2.7.2 and Section 3.2 and Table 1).
Table 2 shows the application of the clinical protocol as presented in the second flow chart. The difference between the empirical flow and the PIF-based flow is evident, as well as the impact on Pes. If the non-invasive flow chart were used, tidal volume data could be obtained instead of Pes, providing information on the efficacy of ventilation.
Table 2.
Effects of high-flow nasal cannula (HFNC) flow settings (Fven) based on the patient’s body weight (Fven_kg) or patient’s peak inspiratory flow (Fven_PIF) on changes in esophageal pressure swing (ΔPes_sw) and PIF.
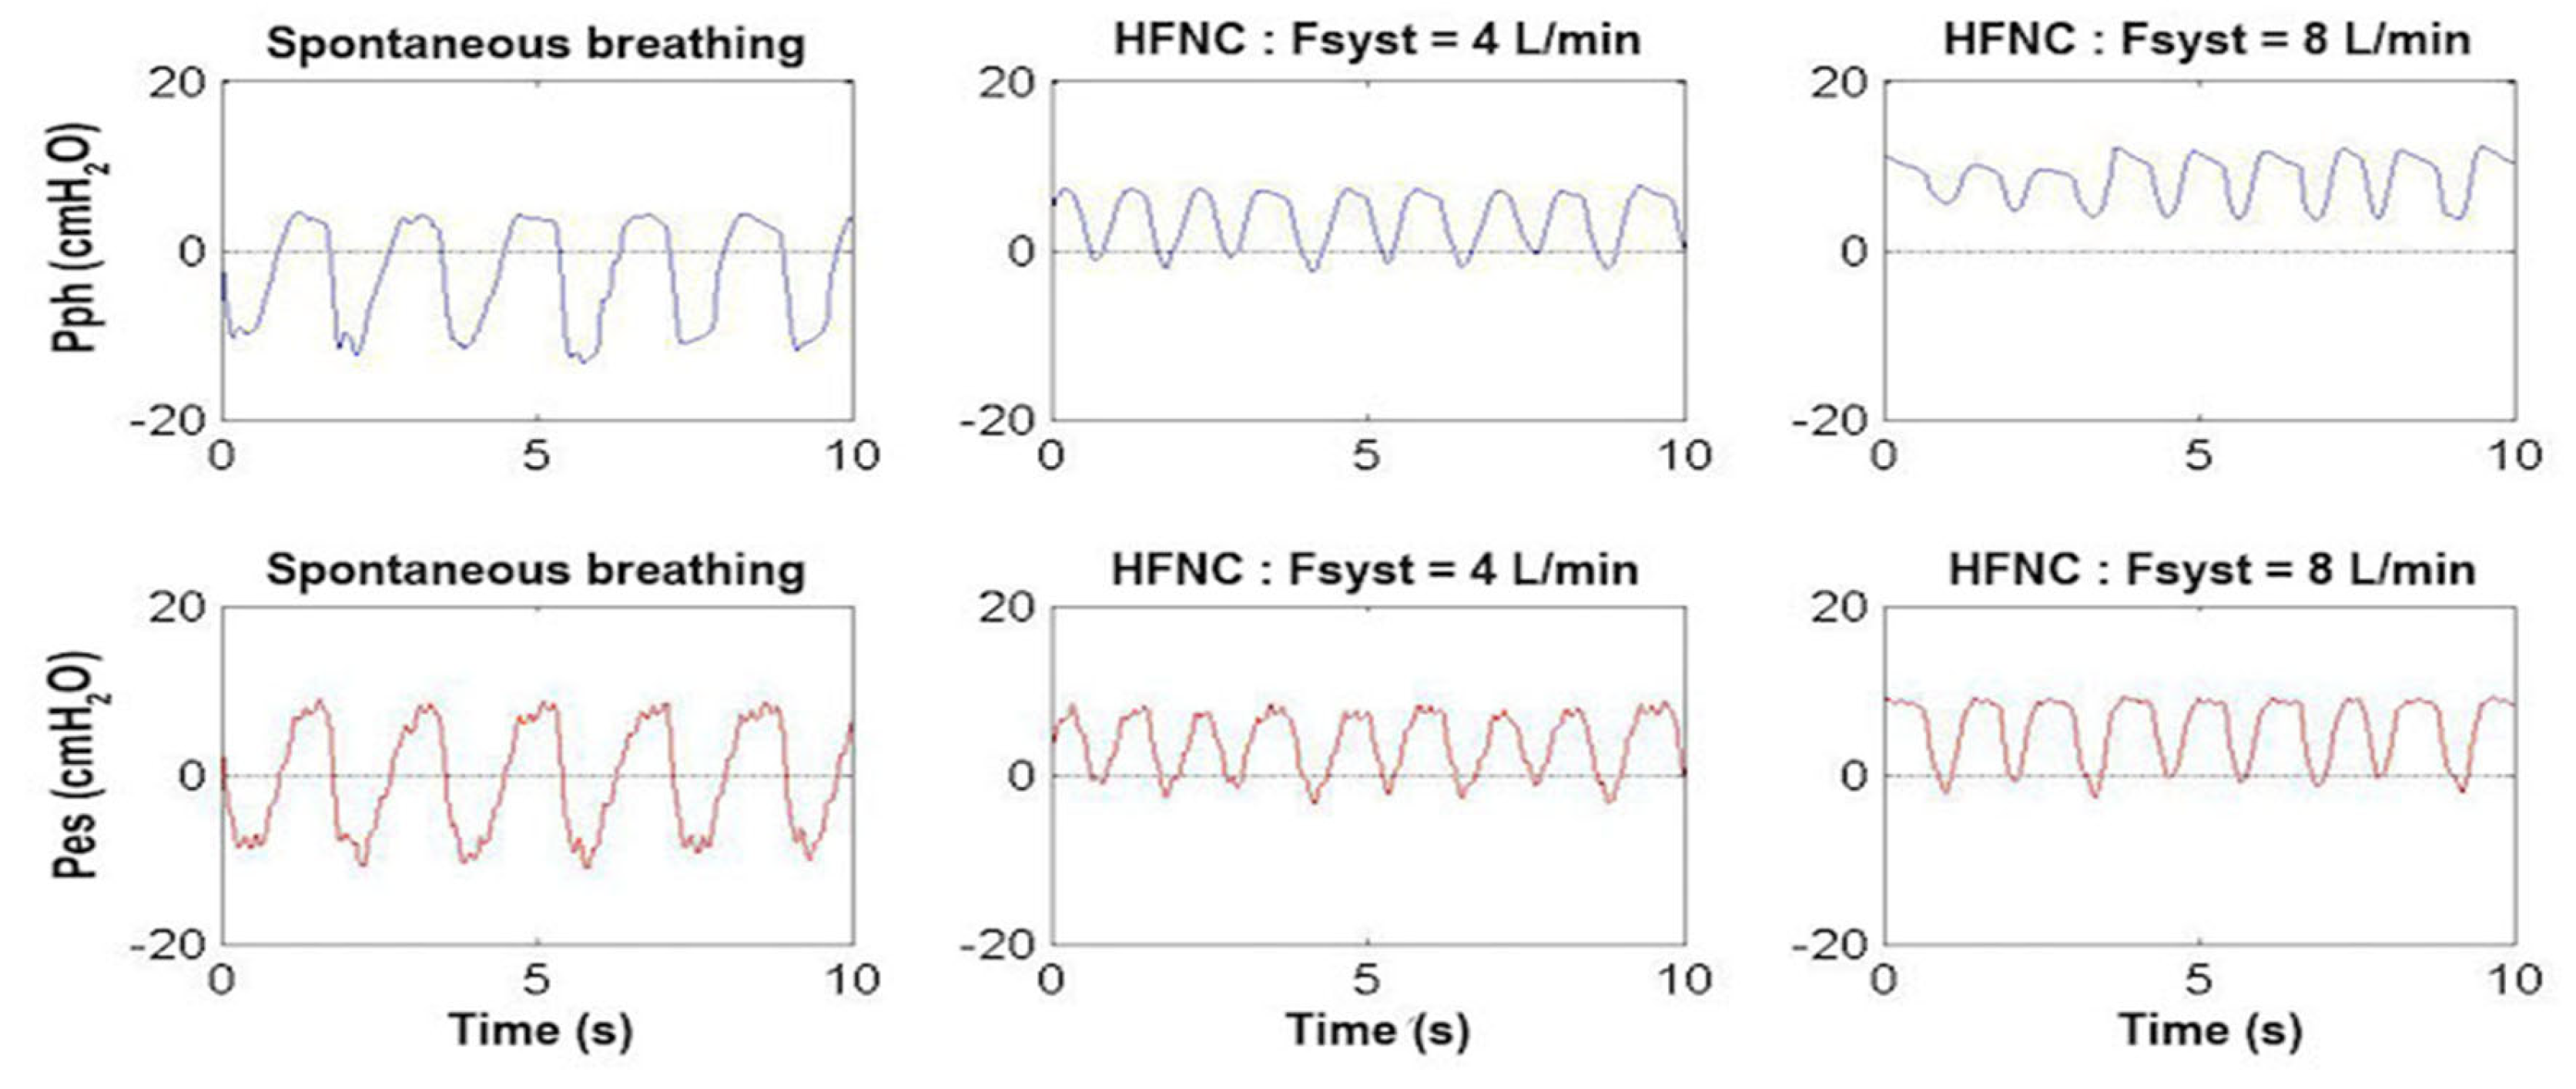
Using the system as in the second flow chart of Figure 4 with the associated use of Pph catheter, Figure 11 shows the tracings of the Pph and Pes of an infant with mild respiratory distress during spontaneous breathing in oxygen, on HFNC at 4 L/min (1 L/kg/min) and on HFNC at 8 L/min (2 L/kg/min). In this infant, Pph oscillates from −10 cmH2O to +4 cmH2O during spontaneous breathing (mean value −3 cmH2O), from −1 cmH2O to +7 cmH2O during HFNC at 4 L/min (mean value +3 cmH2O), and from +5 cmH2O to +11 cmH2O at 8 L/min (mean value +8 cmH2O). The Pes oscillates from −10 cmH2O to +10 cmH2O during spontaneous breathing and from −1 cmH2O to +8 cmH2O at 4 L/min. With respect to the lower flow rate of 4 L/min, the higher flow rate of 8 L/min, while increasing the mean Pph value (+8 cmH2O instead of +4 cmH2O), did not have any further effect on Pes swings (from −1 cmH2O to +8 cmH2O), indicating that there was no further effect of flow on the respiratory effort.
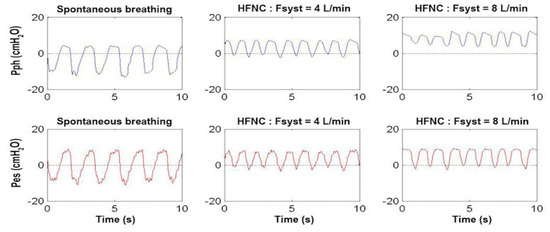
Figure 11.
Pharyngeal pressure (Pph, upper panels, blue traces) and esophageal pressure (Pes, lower panels, red traces) waveform as a function of time in a representative patient weighing 4 kg with mild respiratory distress during spontaneous breathing (left panels), on high-flow nasal cannula (HFNC) with Fsyst at 4 L/min (middle panels) and at 8 L/min (right panels). Note that the Pes swings were quite similar between HFNC 4 and 8 L/min indicating that there was no further effect of flow on the respiratory effort (see Section 3.2).
4. Discussion
HFNC is commonly used to treat mild to moderate respiratory distress in patients of different ages. This technique is based on the assumption that a warmed, humidified air/oxygen mixture, delivered through NC at a flow exceeding the patient’s PIF, meets entirely the patient’s flow demand and ensures no entrapment of air from the environment. As a result, the FiO2 set on the HFNC equals the patient’s FiO2. In addition, the excess of the flow delivered by the HFNC continuously purges the nasopharyngeal dead space, thus eliminating dead space CO2 and improving ventilation [1]. The high flow delivery by the HFNC also generates clinically significant intrapharyngeal pressure without the complications associated with traditional NCPAP (e.g., septal erosion, difficulties of maintaining device position, and discomfort). Nevertheless, the flow needed to generate significant and sufficient CPAP is presently unknown, which is why the use of HFNC as a replacement for CPAP is not without controversy [1,18]. The absence of a monitoring device makes HFNC flow optimization empirical. In adults, several researchers have attempted to optimize HFNC flow by measuring the patient’s PIF through spirometry before commencing HFNC treatment. However, as we have shown, the patient’s PIF can change after HFNC therapy, making these measurements unhelpful during treatment.
In this paper, we showed a simple way to set the optimal flow rate in infants receiving HFNC treatment based on the detection of several flow signals either from the HFNC (i.e., Fsyst and Fvent), or from the patient (i.e., Fmask). This method is quick and easy to use because it is based on the insertion in a commercially available HFNC of a DFT (to detect Fsyst) and two PNTs coupled with two DPTs (to detect Fvent and Fmask). The interface between the Pro_HFNC device and the patient is an OM which is applied during the procedures of PIF measurements, on the patient’s face, and during HFNC treatment over the mouth and NC. Because this system requires a mask to be placed on the infant’s face, it is difficult to use for continuous monitoring, either because of the infant’s distress caused by the mask over time or because of the operator’s need to maintain the mask on the infant’s face, which is not practical in the clinical setting for long periods of time. Although in this study we tested the use of our monitoring system in a small group of infants, there is no reason why it cannot be tested in older age groups. With children, a HFNC monitoring system which can measure Pph is more important than with adults. One significant difference between infants and adults is the way they position their mouth during respiratory distress, especially when receiving mild sedation. Infants usually keep their mouths closed with their tongue attached to the palate. This may increase the risk of pulmonary overdistension because of increased Pph with increasing inspiratory flow. In adults, the mouth is usually slightly open, which reduces Pph and increases the safety of high flow rates.
The application of Pro_HFNC on a few infants demonstrated that Fsyst set either by Sreenan formula (Flow (L/min) = 0.92 + 0.68 × weight in kg) [18], or empirically based on the values suggested by the manufacturer (1 L/kg/min + 1) does not always satisfy the patient’s needs. In fact, we have shown in Figure 5a how in several breaths Fvent did not meet the patient’s flow demand (Fresp). Although there are no guidelines on the use of HFNC in the adult or pediatric population, it is suggested to increase flow rate when the clinical condition of a patient treated with HFNC is not improving before other actions are implemented. Despite the fact that this approach often gives satisfying clinical results, we believe that having an objective device to set the optimal flow rate would make the physician’s decision making easier and would allow for less complications arising from excessive flow delivery, such as lung hyperinflation, PEEPi, and increased WOB.
In addition to optimal flow setting, another measure that guides the ventilatory treatment is the patient’s respiratory profile characterization. This is easy to accomplish when the patient is on invasive ventilation because there is no gas leakage. Obviously, the evaluation of respiratory profile is not as easy in patients on non-invasive respiratory support because of the gas leakages from around the interface. Several methods have been developed to obtain objective indexes of respiratory mechanics in patients undergoing non-invasive ventilation. A number of techniques are now available, such as electric impedance plethysmography (EIP), respiratory inductive plethysmography (RIP), magnetometers/strain gauge sensors, and piezoresistive materials displacement sensor. Compared with other techniques, RIP has the advantages of greater accuracy, better sensitivity, and higher safety for patients, and has been used widely in clinical and research settings. However, even if RIP is considered reliable for determining lung volume changes and thoraco-abdominal asynchrony indexes, the accuracy of the calibration coefficients require the HFNC suspension with the consequence of losing the benefits of this treatment. In addition, the asynchrony indexes, which are the most important respiratory mechanical parameters obtained using RIP, are merely nonspecific indicators of abnormal breathing. The real-time implementation of flow-leak algorithm [13] offered by the functional features of Pro_HFNC, in addition to optimal flow detection and HFNC setting, allows the simultaneous monitoring of Fresp, VTi, Pes, and PP signals and therefore also the determination of the most relevant parameters of patient’s respiratory profile (Table 1) without suspending HFNC treatment. To the best of our knowledge, this is the first study that measures all these variables in patients treated with HFNC. At any age, respiratory distress can be associated with some degree of bronchial obstruction because of bronchial secretions or edema of the bronchial wall, which can lead in association with the high respiratory rate to increased breathing effort secondary to dynamic hyperinflation and PEEPi [19]. Therefore, part of the supportive effect of non-invasive respiratory assistance helps relieving the effort to overcome PEEPi. To set the adequate HFNC flow rate, which determines a Pph level required to overcome PEEPi, it is therefore paramount for those who work in intensive care units or in respiratory units to monitor in real time the patient’s respiratory profile. In this study we were able to measure PEEPi as well as the relevant measures of respiratory effort including the inspiratory resistive PTP (PTPres), PTPelas_lung, PTPelas_chest, PTP_PEEPi, and PTPtot. We also calculated the WOBres, WOBelas_lung, WOBelas_chest, WOB_PEEPi, and WOBtot. Although these parameters are useful for adjusting flow settings, they require the insertion of an esophageal catheter, making this system more invasive and difficult to use. It is likely that the parameters requiring pressure measurements will be used for research purposes or in highly trained clinical centers.
Another interesting clinical point we made in our study comes from the unexpected effect of increasing flow rate on effort of breathing (Figure 11). While 1 L/kg/min reduced Pes swings in an infant with mild respiratory distress, higher flow rate (2 L/kg/min) did not further decrease breathing effort. Instead, it increased Pph mean values, potentially causing a detrimental effect on the patient by increasing pulmonary air trapping. These data further highlight the need for a bedside tool to monitor lung mechanics in infants treated with HFNC.
A strength of the system is that during flow optimization, the system is completely non-invasive and the mask on the infant’s face does not interfere with HFNC treatment. Unlike spirometry, it does not add dead space. This monitoring system enables real-time visualization of the HFNC and patient flow and volume traces, allowing for adjustments to the delivered flow rate and immediate re-evaluation. In the non-invasive version, the only disposable part is the ventilation mask, whereas the pneumotachographs are reusable after disinfection.
Our system has limitations. Firstly, monitoring can only occur for specific periods of time and not continuously. Secondly, the system was only tested on infants, so it is uncertain whether it would be as useful in an adult population as it is in young infants.
5. Conclusions
In conclusion, in this paper we have shown a new system (Pro_HFNC) that permits us to set in real time the optimal flow rate and to evaluate respiratory profile in patients with respiratory distress treated with HFNC. With Pro_HFNC, the determination of optimal flow rate is simple to perform, it does not necessitate particular skills, and, most importantly, it does not require HFNC interruption. Pro_HFNC also allows for Fsyst control during treatment. Finally, if connected to Pph and Pes catheters, Pro_HFNC allows for the calculation of numerous parameters of patient’s respiratory profile that may be useful to continue or interrupt HFNC treatment.
We believe that for a better control of respiratory parameters, the application of HFNC combined with the Pro_HFNC will grow further and with it the opportunities it offers.
Author Contributions
Conceptualization, F.M. and P.P.; methodology, F.M. and P.P.; software, F.M.; validation, F.M. and P.P.; formal analysis, F.M. and P.P.; investigation, F.M. and P.P.; data curation, F.M. and P.P.; writing—original draft preparation, F.M. and P.P.; writing—review and editing, F.M. and P.P.; visualization, F.M. and P.P.; supervision, F.M. and P.P. All authors have read and agreed to the published version of the manuscript.
Funding
This research received no external funding.
Institutional Review Board Statement
The study was conducted in accordance with the Declaration of Helsinki, and approved by the Ethics Committee of Policlinico Umberto I of Rome, Italy, (protocol code 3471 and 11/23/16).
Informed Consent Statement
Informed consent was obtained from all infants’ parents involved in the study.
Data Availability Statement
Data are contained within the article. Further data that support the findings of this study are available upon request from the corresponding author. The data are not publicly available due to privacy or ethical restrictions.
Conflicts of Interest
The authors declare no conflicts of interest.
References
- Dysart, K.; Miller, T.L.; Wolfson, M.R.; Shaffer, T.H. Research in high flow therapy: Mechanisms of action. Respir. Med. 2009, 103, 1400–1405. [Google Scholar] [CrossRef] [PubMed]
- Lee, J.H.; Rehder, K.J.; Williford, L.; Cheifetz, I.M.; Turner, D.A. Use of high flow nasal cannula in critically ill infants, children, and adults: A critical review of the literature. Intensive Care Med. 2013, 39, 247–257. [Google Scholar] [CrossRef] [PubMed]
- Rubin, S.; Ghuman, A.; Deakers, T.; Khemani, R.; Ross, P.; Newth, C.J. Effort of breathing in children receiving high-flow nasal cannula. Pediatr. Crit. Care Med. 2014, 15, 1–6. [Google Scholar] [CrossRef]
- Papoff, P.; Caresta, E.; Luciani, S.; Pierangeli, A.; Scagnolari, C.; Giannini, L.; Midulla, F.; Montecchia, F. The starting rate for high-flow nasal cannula oxygen therapy in infants with bronchiolitis: Is clinical judgment enough? Pediatr. Pulmonol. 2021, 56, 2611–2620. [Google Scholar] [CrossRef] [PubMed]
- Hasan, R.A.; Habib, R.H. Effects of flow rate and airleak at the nares and mouth opening on positive distending pressure delivery using commercially available high-flow nasal cannula systems: A lung model study. Pediatr. Crit. Care Med. 2011, 12, e29–e33. [Google Scholar] [CrossRef]
- Milési, C.; Requirand, A.; Douillard, A.; Baleine, J.; Nogué, E.; Matecki, S.; Amedro, P.; Pons-Odena, M.; Cambonie, G. Assessment of Peak Inspiratory Flow in Young Infants with Acute Viral Bronchiolitis: Physiological Basis for Initial Flow Setting in Patients Supported with High-Flow Nasal Cannula. J. Pediatr. 2021, 231, 239–245.e1. [Google Scholar] [CrossRef] [PubMed]
- Li, J.; Deng, N.; He, W.J.A.; Yang, C.; Liu, P.; Albuainain, F.A.; Ring, B.J.; Miller, A.G.; Rotta, A.T.; Guglielmo, R.D.; et al. The effects of flow settings during high-flow nasal cannula oxygen therapy for neonates and young children. Eur. Respir. Rev. 2024, 33, 230223. [Google Scholar] [CrossRef] [PubMed]
- Armarego, M.; Forde, H.; Wills, K.; Beggs, S.A. High-flow nasal cannula therapy for infants with bronchiolitis. Cochrane Database Syst. Rev. 2024, 3, CD009609. [Google Scholar] [CrossRef] [PubMed]
- Nielsen, K.R.; Ellington, L.E.; Gray, A.J.; Stanberry, L.I.; Smith, L.S.; DiBlasi, R.M. Effect of High-Flow Nasal Cannula on Expiratory Pressure and Ventilation in Infant, Pediatric, and Adult Models. Respir. Care 2018, 63, 147–157. [Google Scholar] [CrossRef] [PubMed]
- Gray, A.J.; Nielsen, K.R.; Ellington, L.E.; Earley, M.; Johnson, K.; Smith, L.S.; DiBlasi, R.M. Tracheal pressure generated by high-flow nasal cannula in 3D-Printed pediatric airway models. Int. J. Pediatr. Otorhinolaryngol. 2021, 145, 110719. [Google Scholar] [CrossRef] [PubMed]
- Montecchia, F.; Luciani, S.; Cicchetti, R.; Grossi, R.; Midulla, F.; Moretti, C.; Papoff, P. Pharyngeal and esophageal pressure measurements to evaluate respiratory mechanics in infants on high flow nasal cannula: A feasibility study. In Proceedings of the IEEE International Symposium on Medical Measurements and Applications (MeMeA), Turin, Italy, 7–9 May 2015; pp. 234–239. [Google Scholar] [CrossRef]
- Simbruner, G.; Coradello, H.; Lubec, G.; Pollak, A.; Salzer, H. Respiratory compliance of newborns after birth and its prognostic value for the course and outcome of respiratory disease. Respiration 1982, 43, 414–423. [Google Scholar] [CrossRef] [PubMed]
- Montecchia, F.; Midulla, F.; Papoff, P. A flow-leak correction algorithm for pneumotachographic work-of-breathing measurement during high-flow nasal cannula oxygen therapy. Med. Eng. Phys. 2018, 54, 32–43. [Google Scholar] [CrossRef] [PubMed]
- Mayaud, L.; Lejaille, M.; Prigent, H.; Louis, B.; Fauroux, B.; Lofaso, F. An open-source software for automatic calculation of respiratory parameters based on esophageal pressure. Respir. Physiol. Neurobiol. 2014, 192, 1–6. [Google Scholar] [CrossRef] [PubMed]
- Koumoundouros, E.; Santamaria, J.; Patterson, J. The comparison of work of breathing methodologies on a patient model. In Proceedings of the International Conference of the IEEE Engineering in Medicine and Biology Society (EMBS), Istanbul, Turkey, 25–28 October 2001. [Google Scholar] [CrossRef]
- Silberberg, A.R.; Sanberg, K. Direct measurements of airways pressure in ventilated very low birth weight infants. In Proceedings of the International Conference of the IEEE Engineering in Medicine and Biology Society (EMBS), New York, NY, USA, 30 August–3 September 2006; pp. 2868–2870. [Google Scholar] [CrossRef]
- Athanasiades, A.; Ghorbel, F.; Clark, J.W.; Niranjan, S.C.; Liu, C.H.; Zwischenberger, J.B.; Bidani, A. The work of breathing in nonlinear model of respiratory mechanics. In Proceedings of the International Conference of the IEEE Engineering in Medicine and Biology Society (EMBS), Chicago, IL, USA, 30 October–2 November 1997; pp. 2161–2164. [Google Scholar]
- Sreenan, C.; Lemke, R.P.; Hudson-Mason, A.; Osiovich, H. High-flow nasal cannulae in the management of apnea of prematurity: A comparison with conventional nasal continuous positive airway pressure. Pediatrics 2001, 107, 1081–1083. [Google Scholar] [CrossRef] [PubMed]
- Pepe, P.E.; Marini, J.J. Occult positive end-expiratory pressure in mechanically ventilated patients with airflow obstruction: The auto-PEEP effect. Am. Rev. Respir. Dis. 1982, 126, 166–170. [Google Scholar] [CrossRef] [PubMed]


Disclaimer/Publisher’s Note: The statements, opinions and data contained in all publications are solely those of the individual author(s) and contributor(s) and not of MDPI and/or the editor(s). MDPI and/or the editor(s) disclaim responsibility for any injury to people or property resulting from any ideas, methods, instructions or products referred to in the content. |
© 2024 by the authors. Licensee MDPI, Basel, Switzerland. This article is an open access article distributed under the terms and conditions of the Creative Commons Attribution (CC BY) license (https://creativecommons.org/licenses/by/4.0/).