
Topographic Distribution of miRNAs (miR-30a, miR-223, miR-let-7a, miR-let-7f, miR-451, and miR-486) in the Plasma Extracellular Vesicles
 , , , ,
  ,
,
Abstract
:
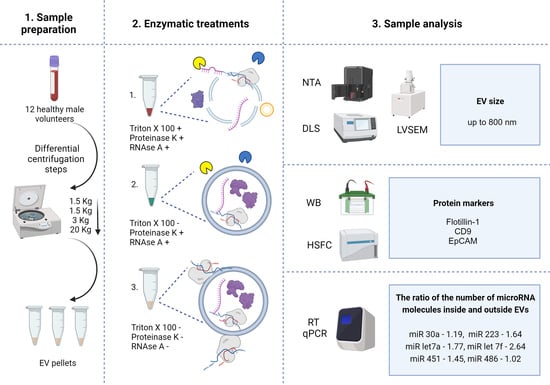
1. Introduction
2. Results
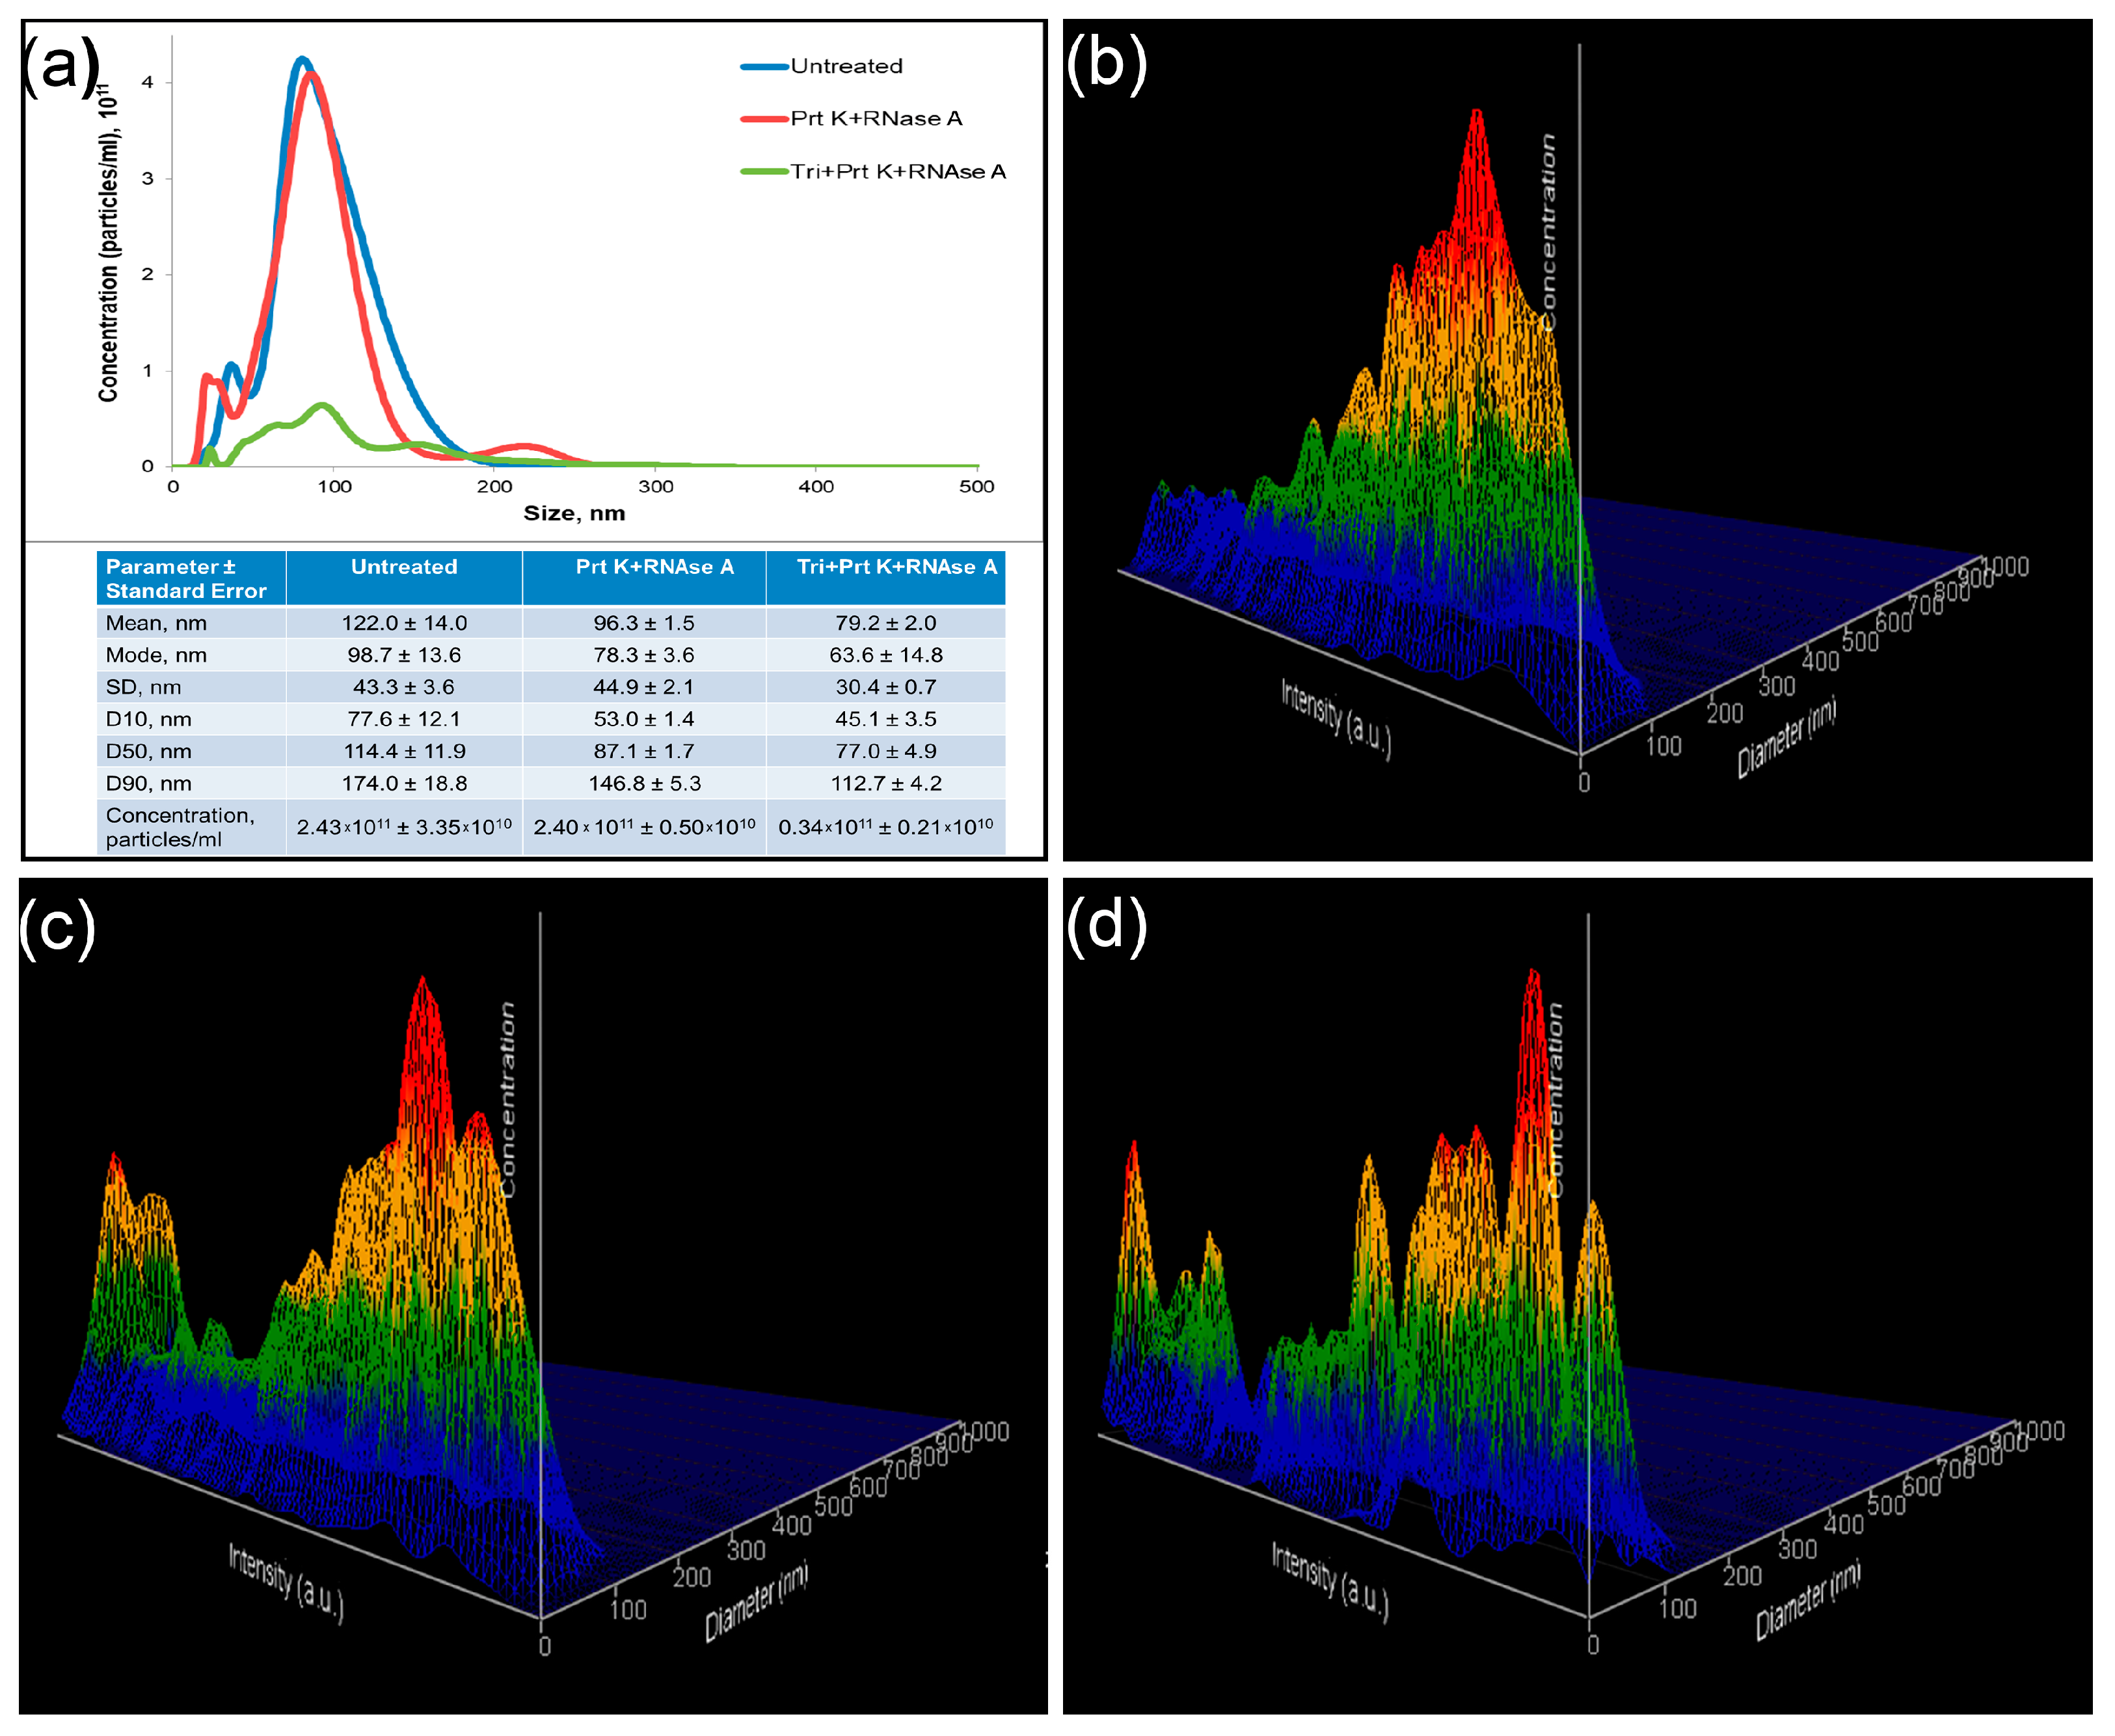
2.1. Characteristics of MV Concentrates of Healthy Volunteers’ Blood Plasma
2.2. Enzymatic Treatments
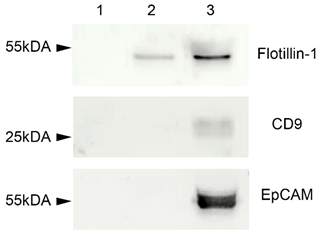
2.3. Western Blot
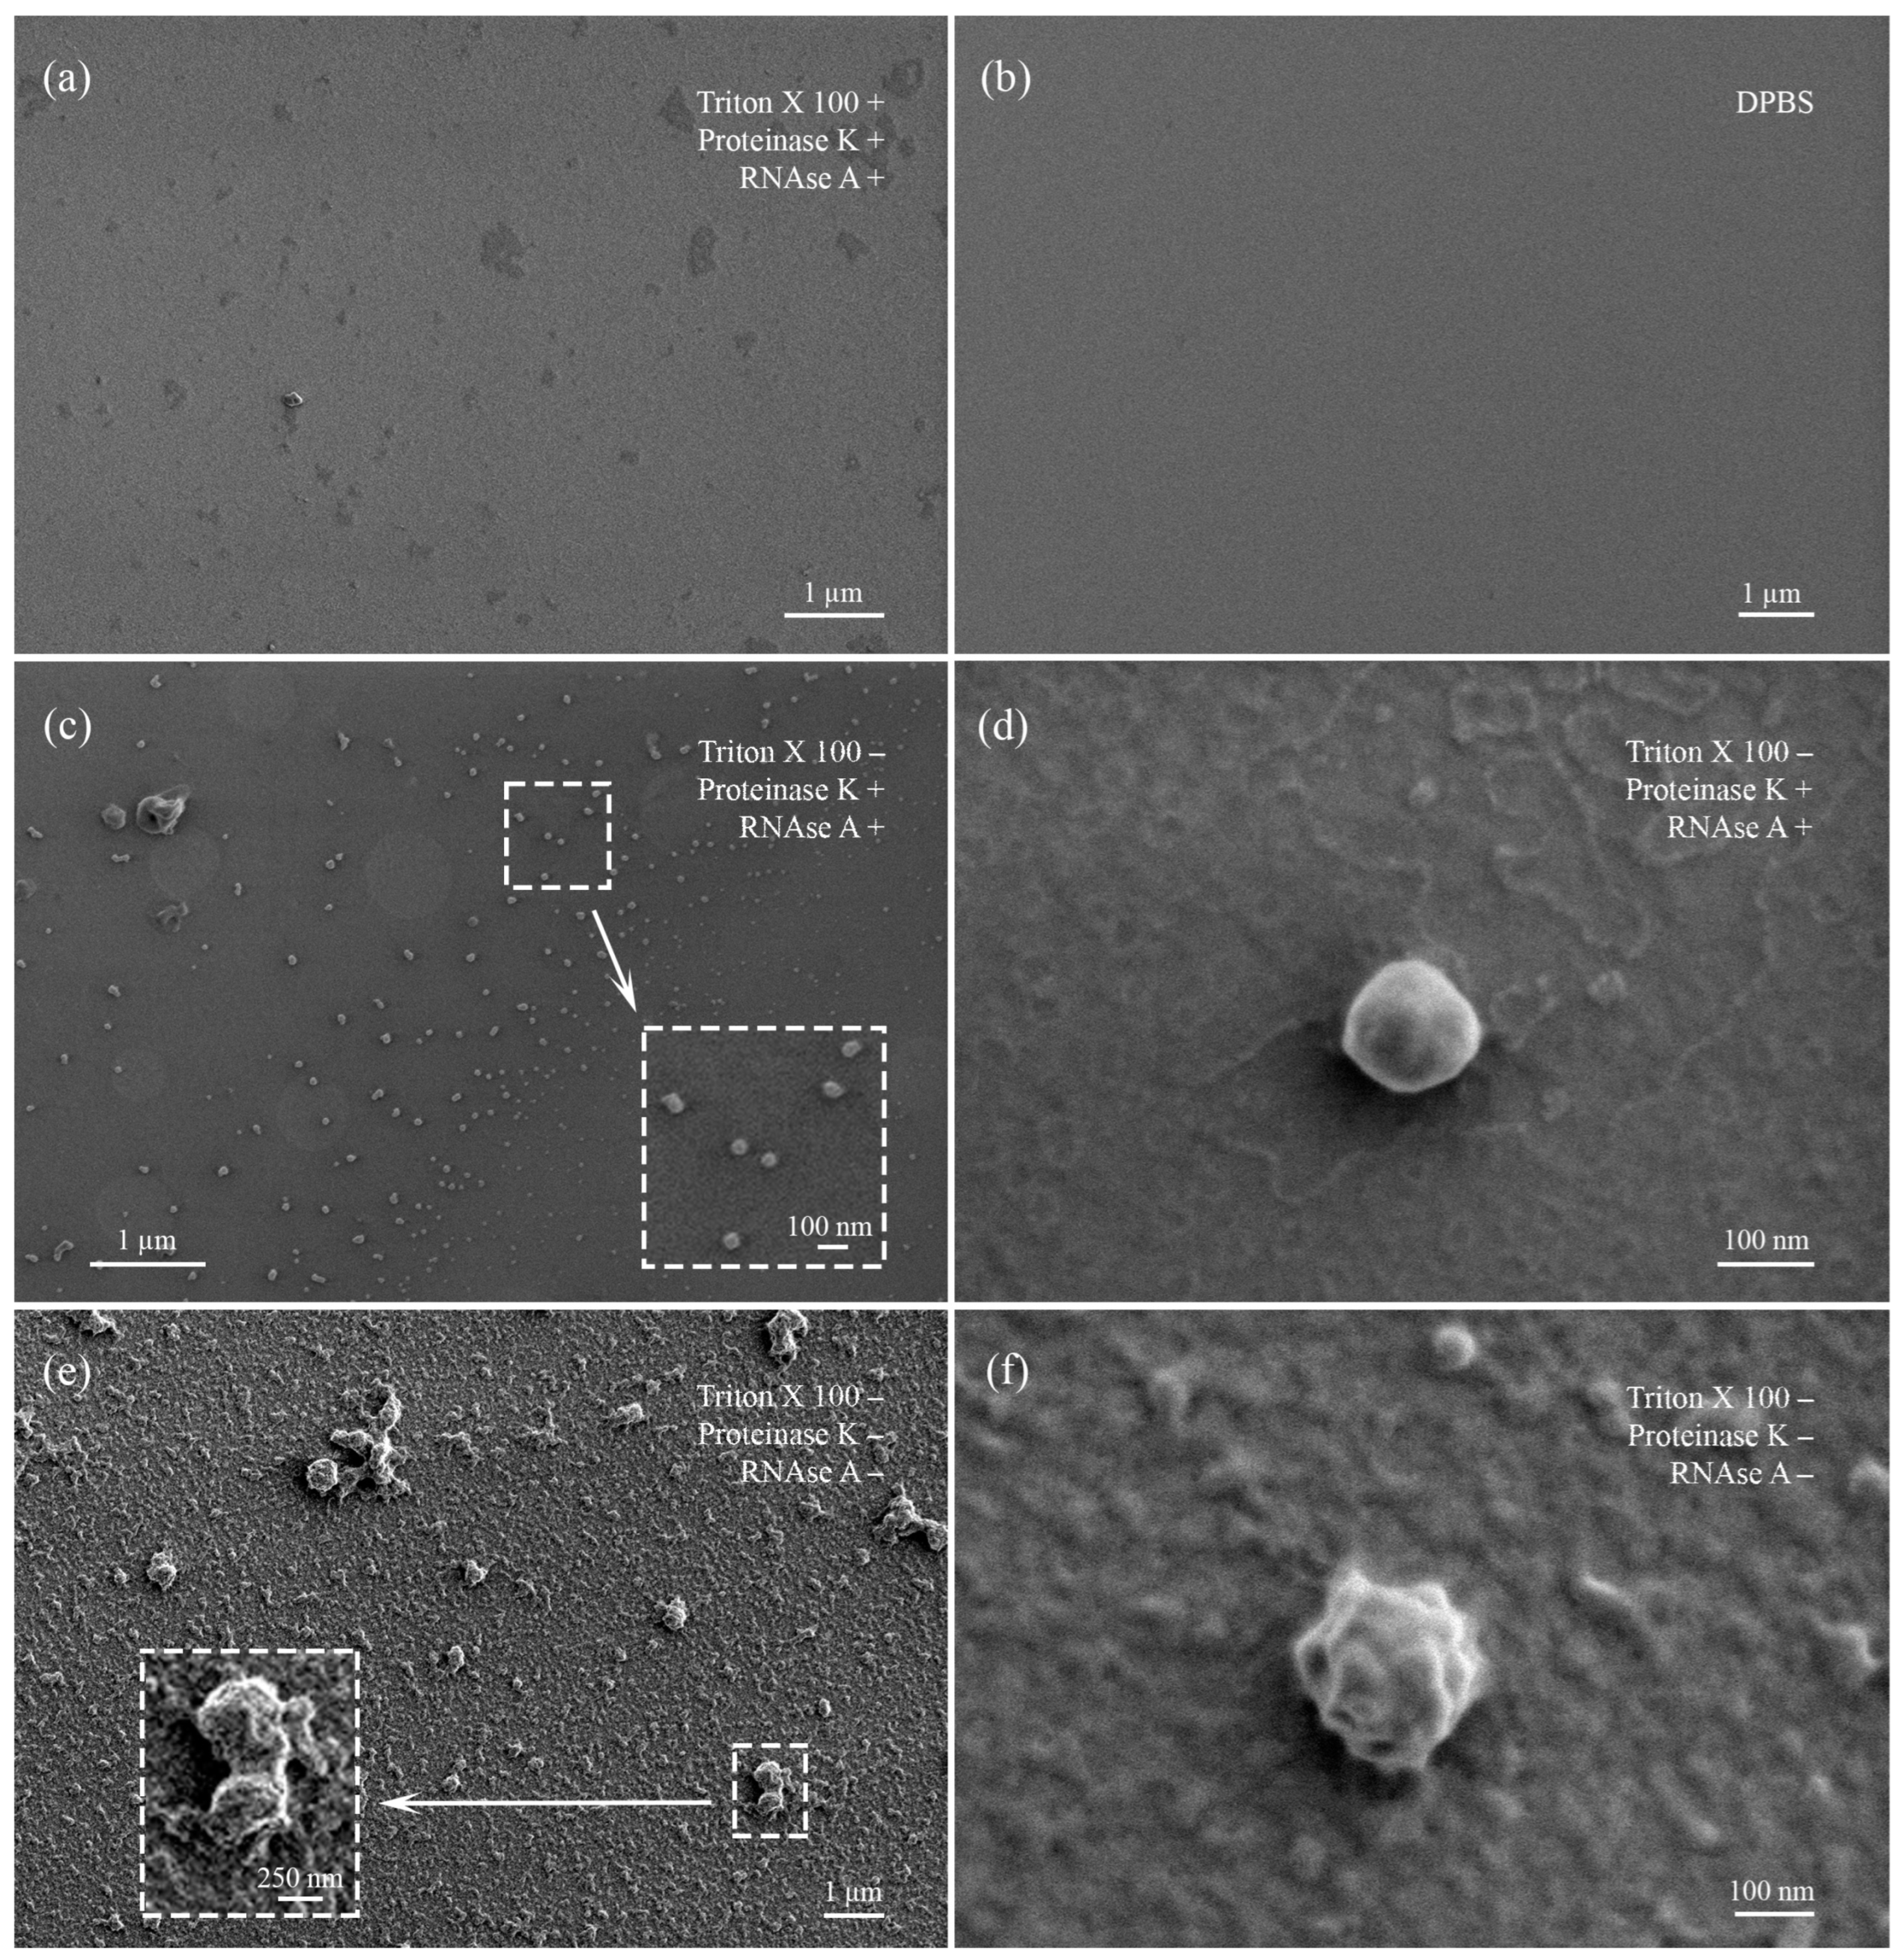
2.4. Low-Voltage Scanning Electron Microscopy
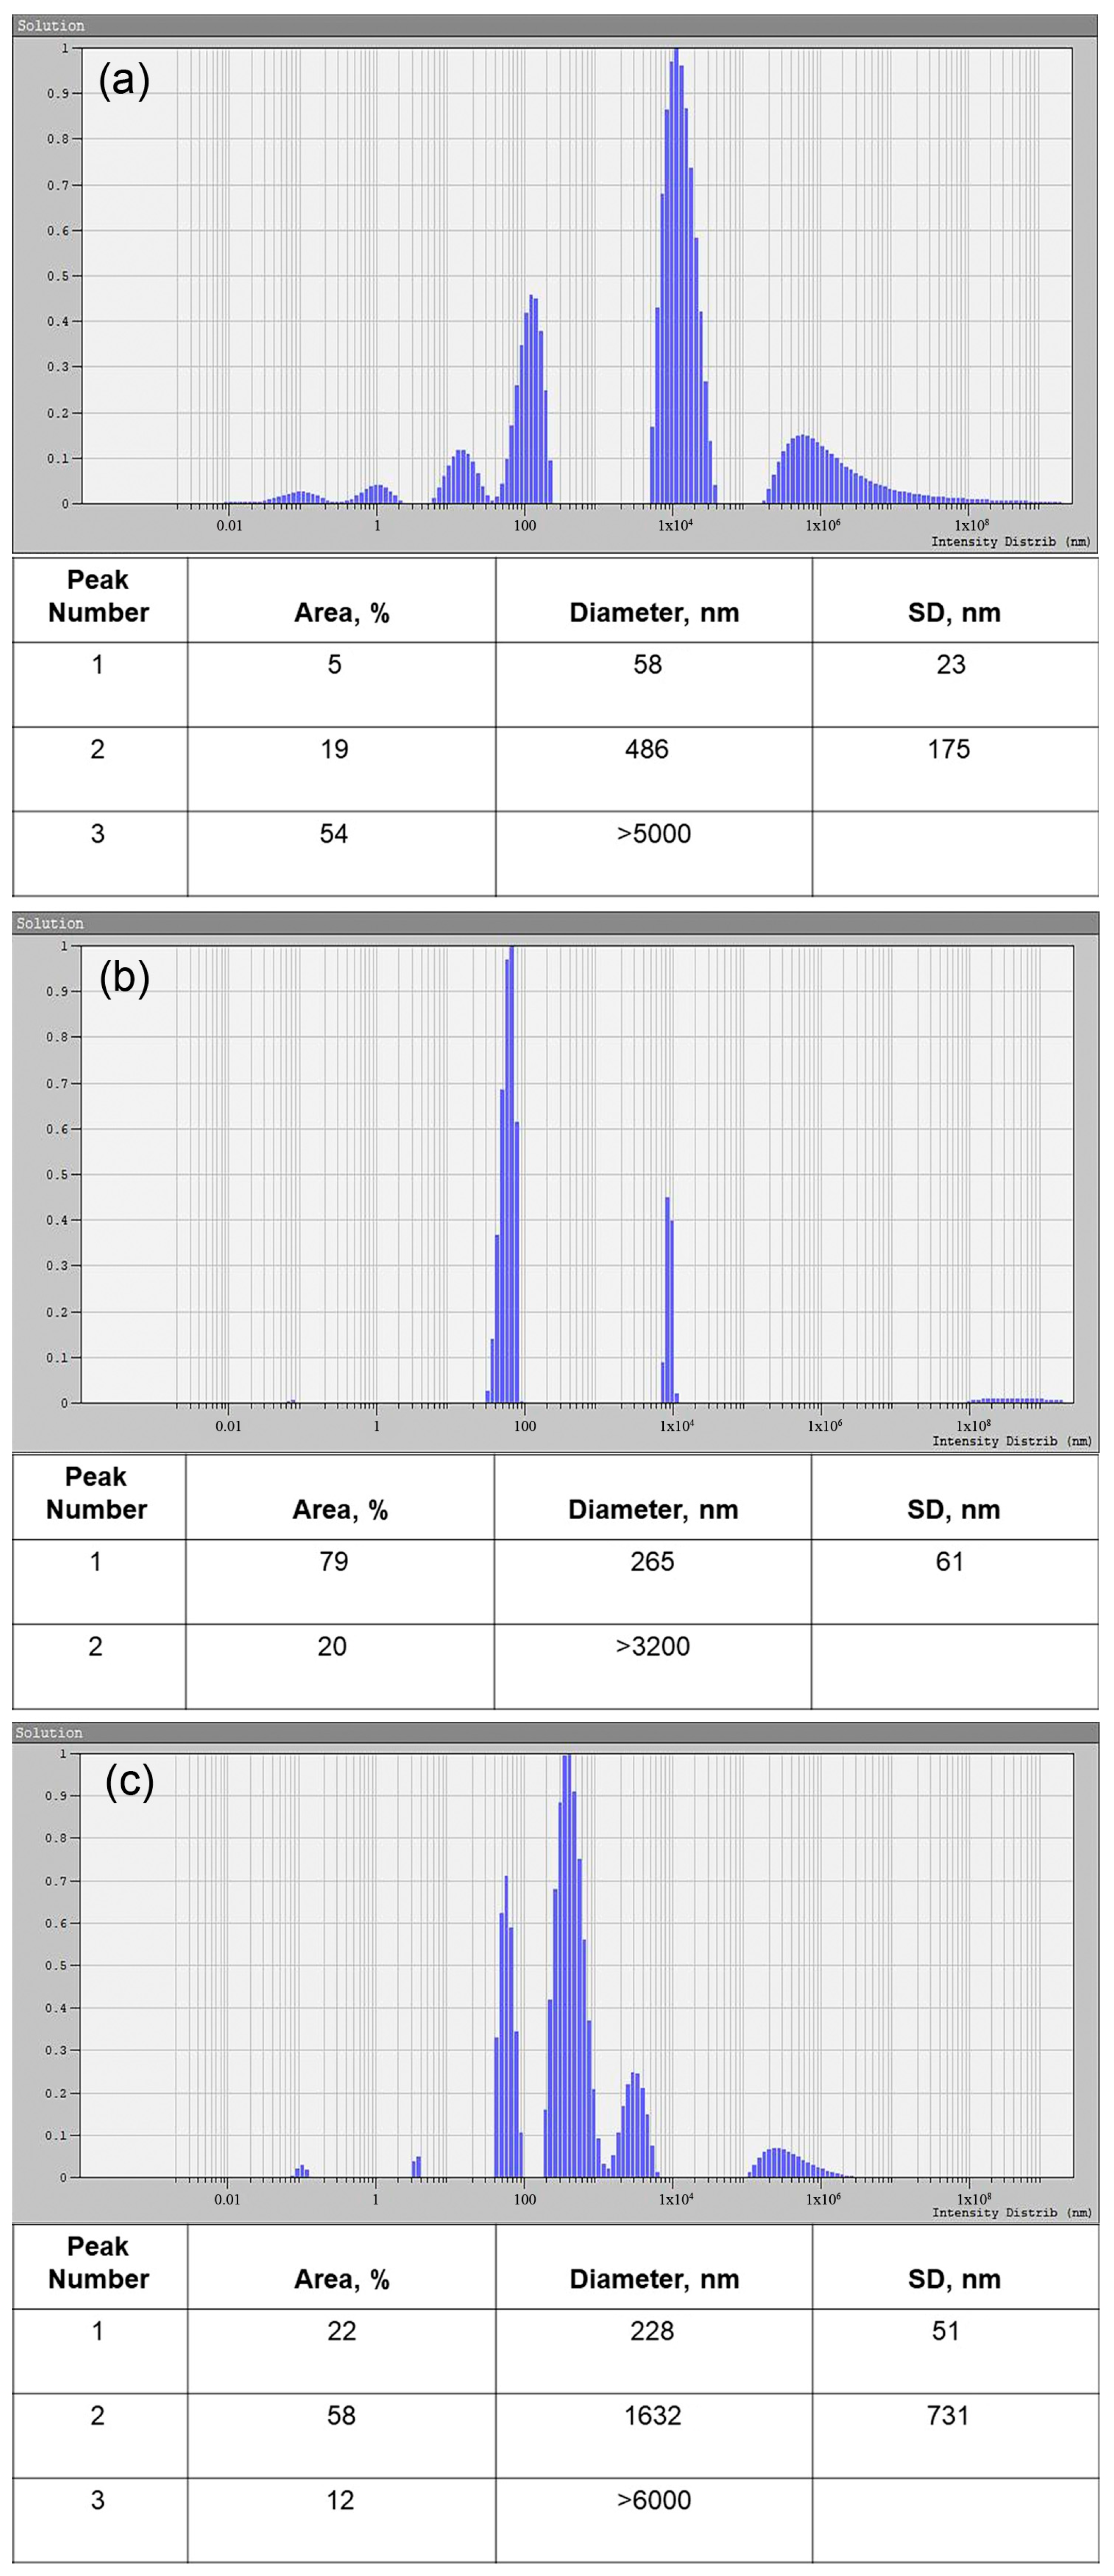
2.5. Dynamic Light Scattering
2.6. Nanoparticle Tracking Analysis
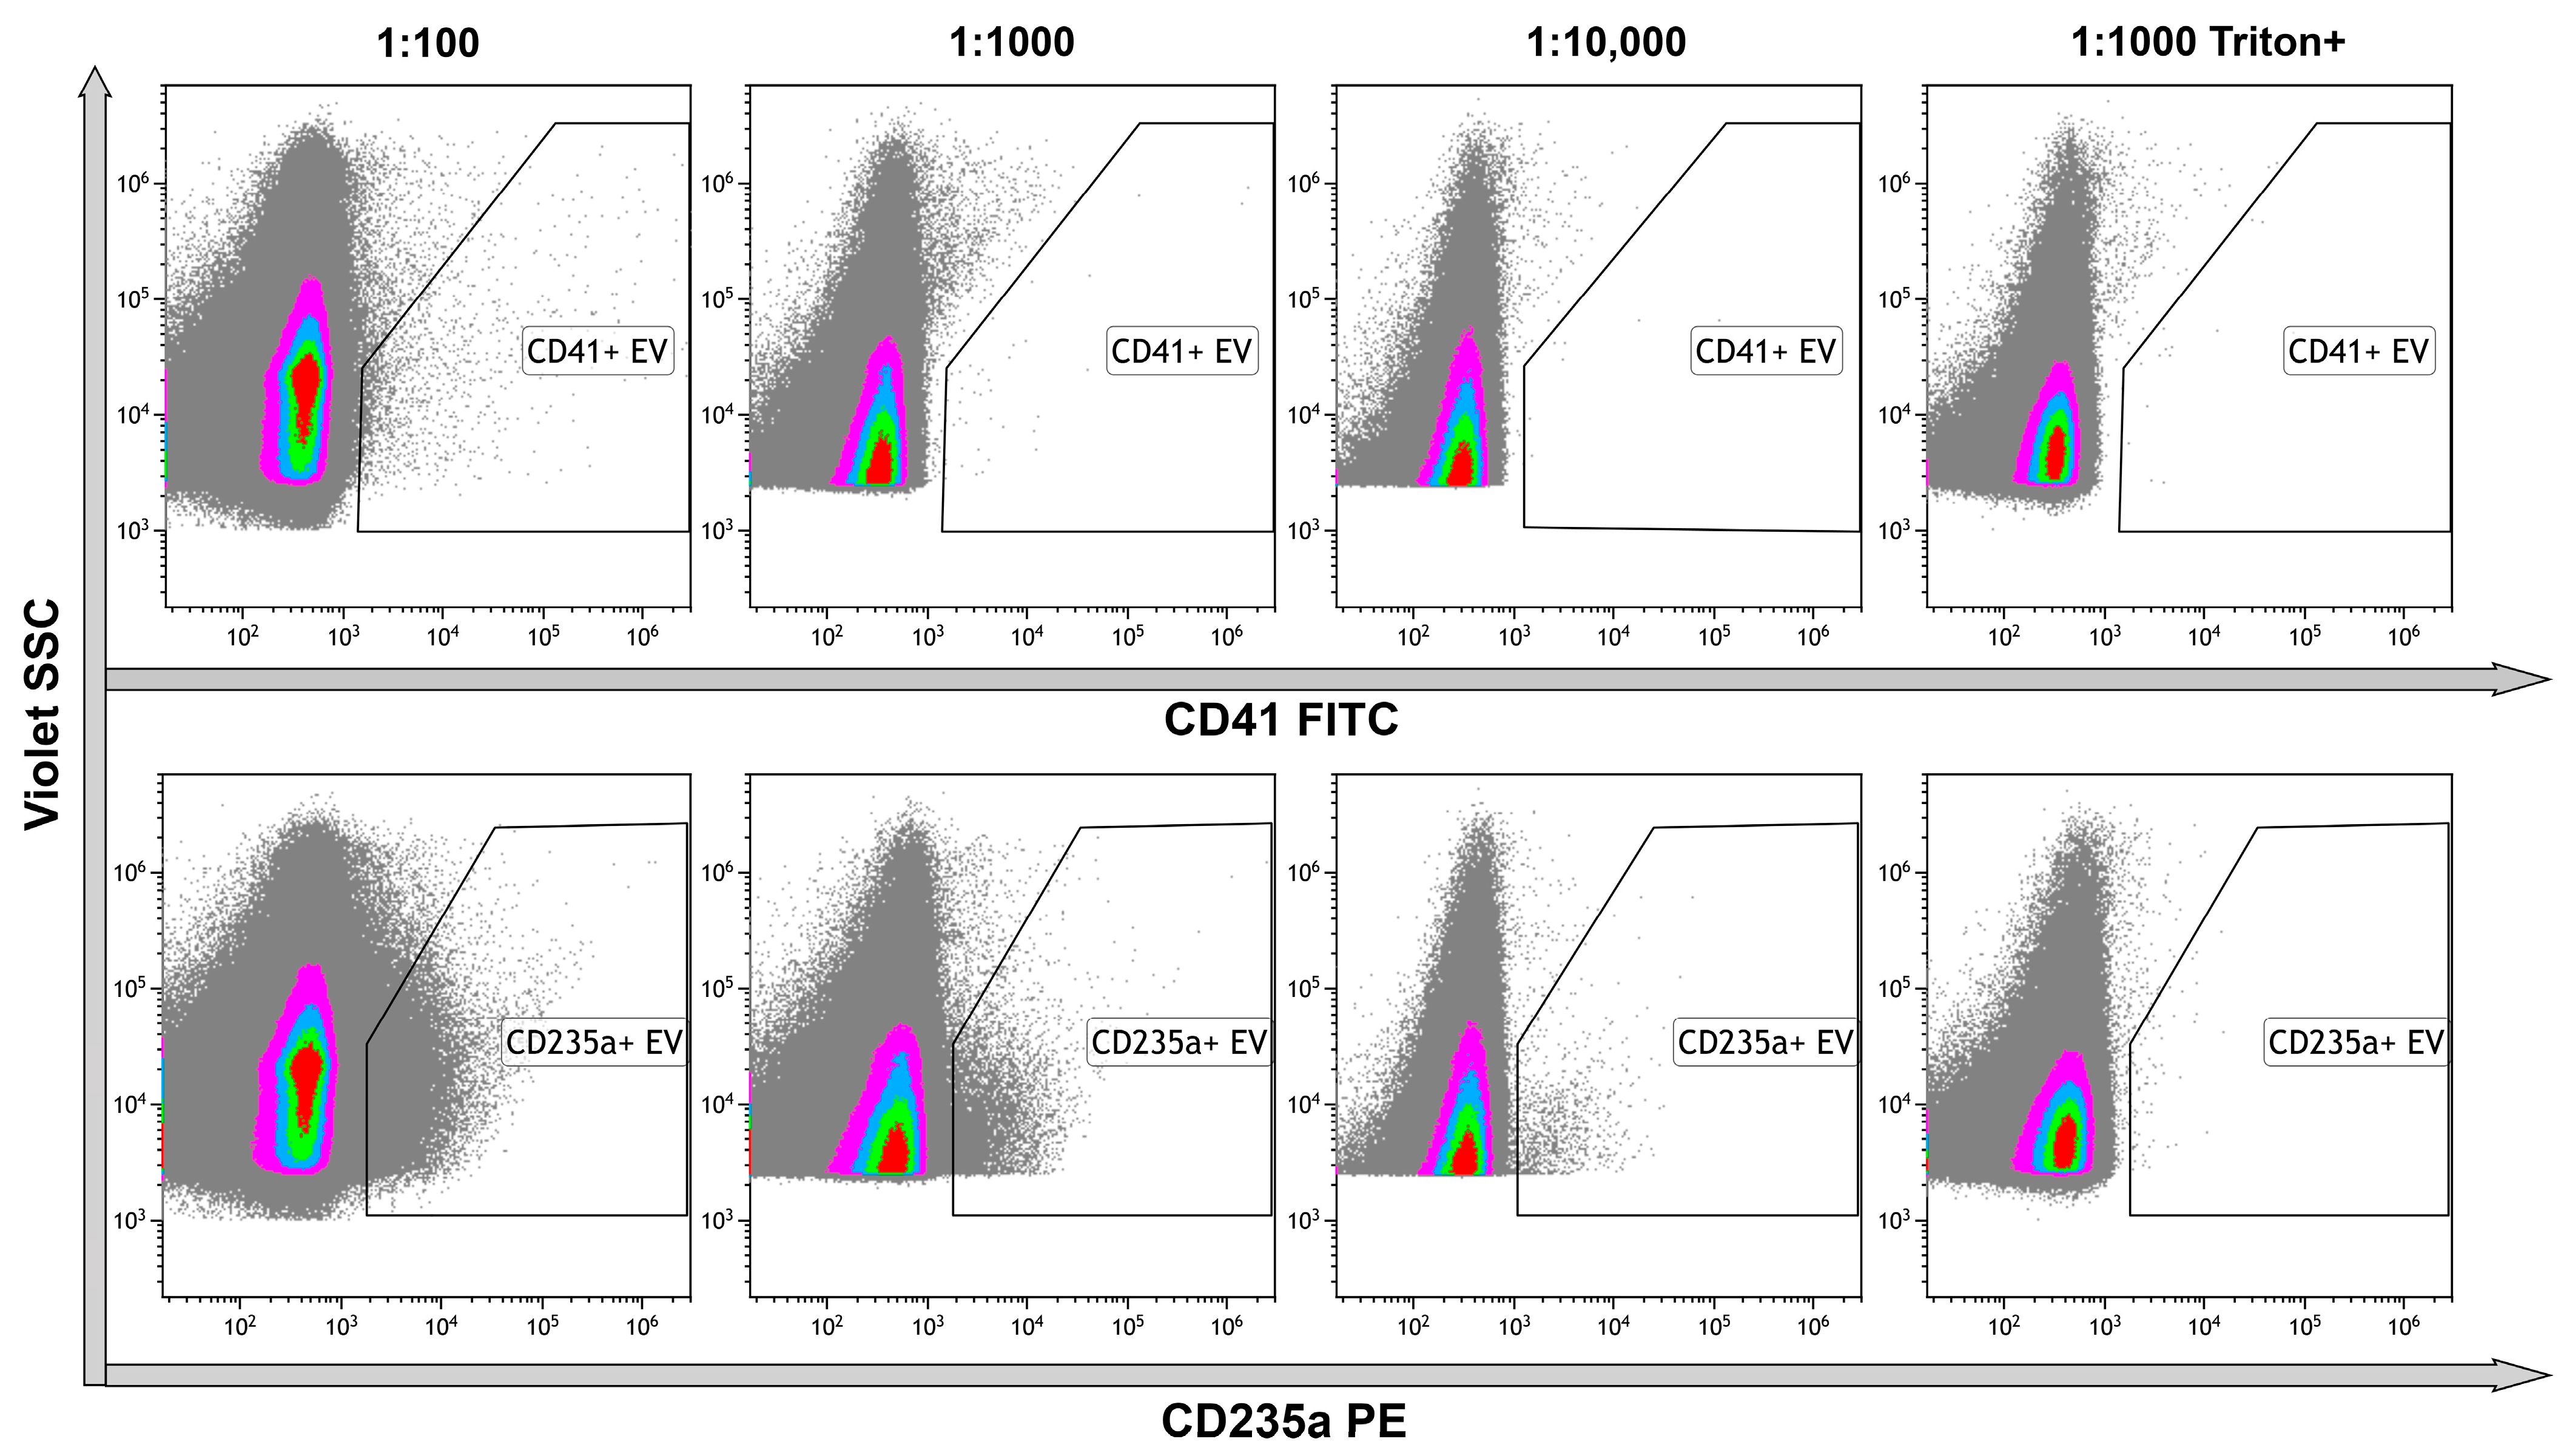
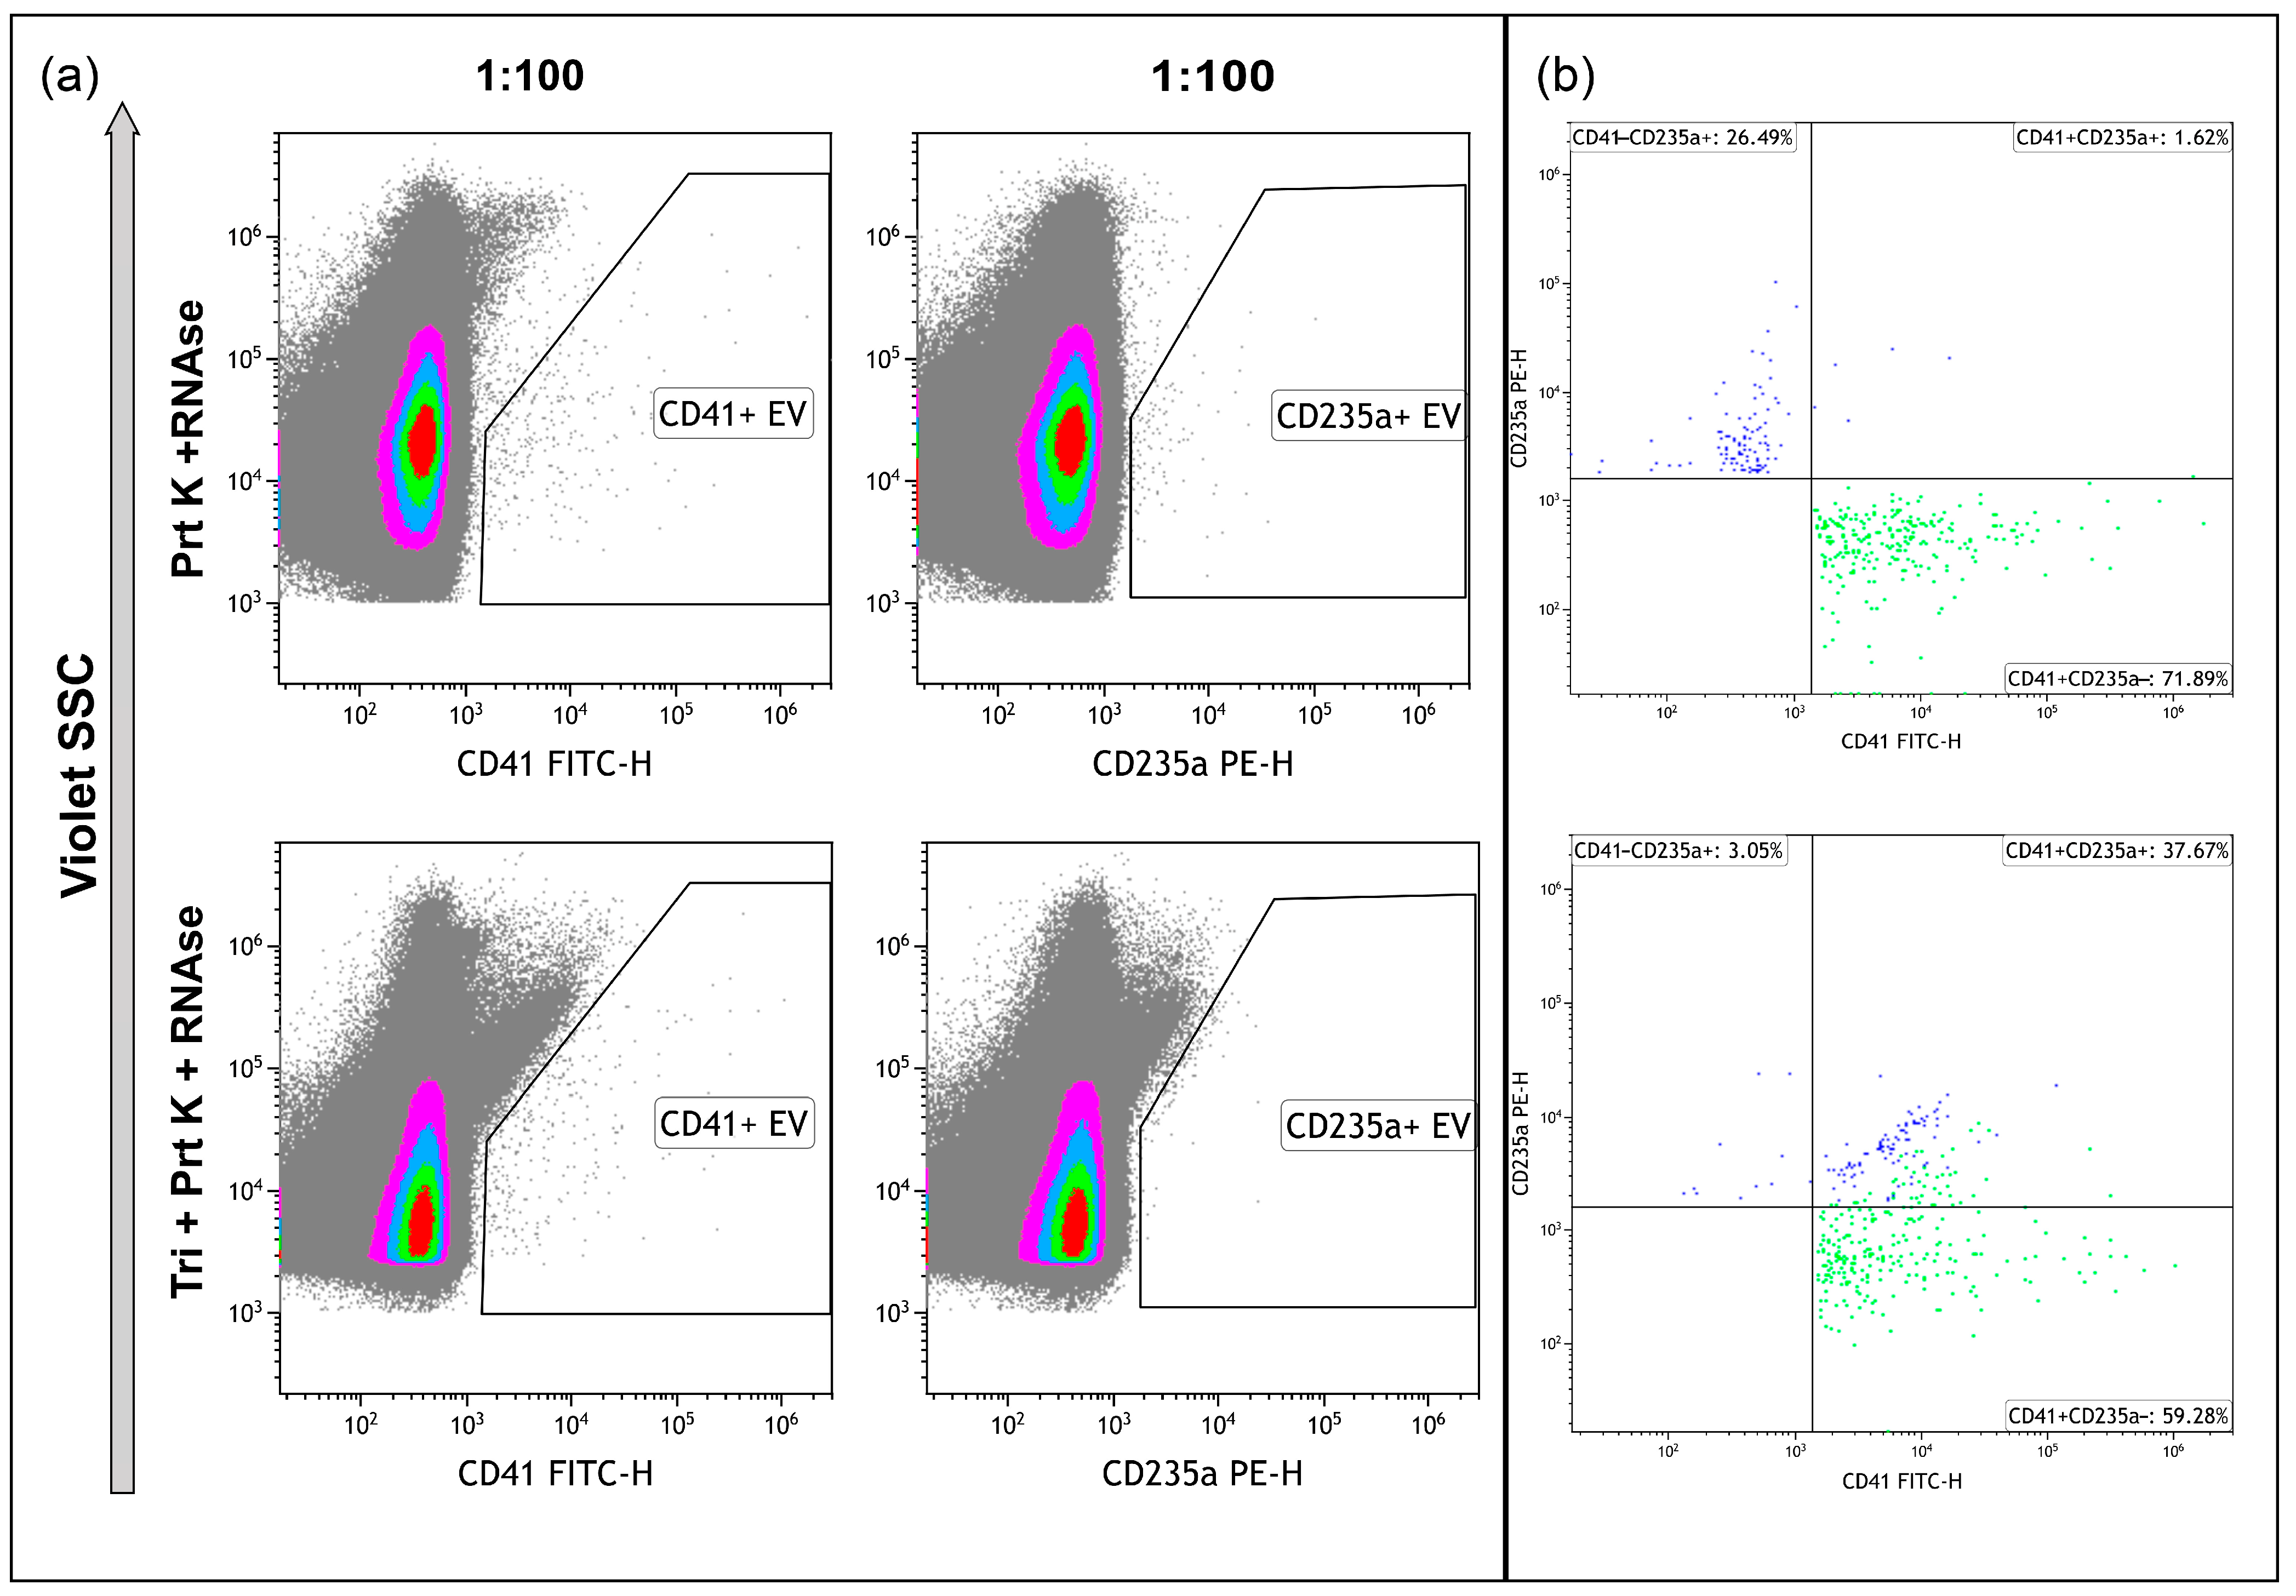
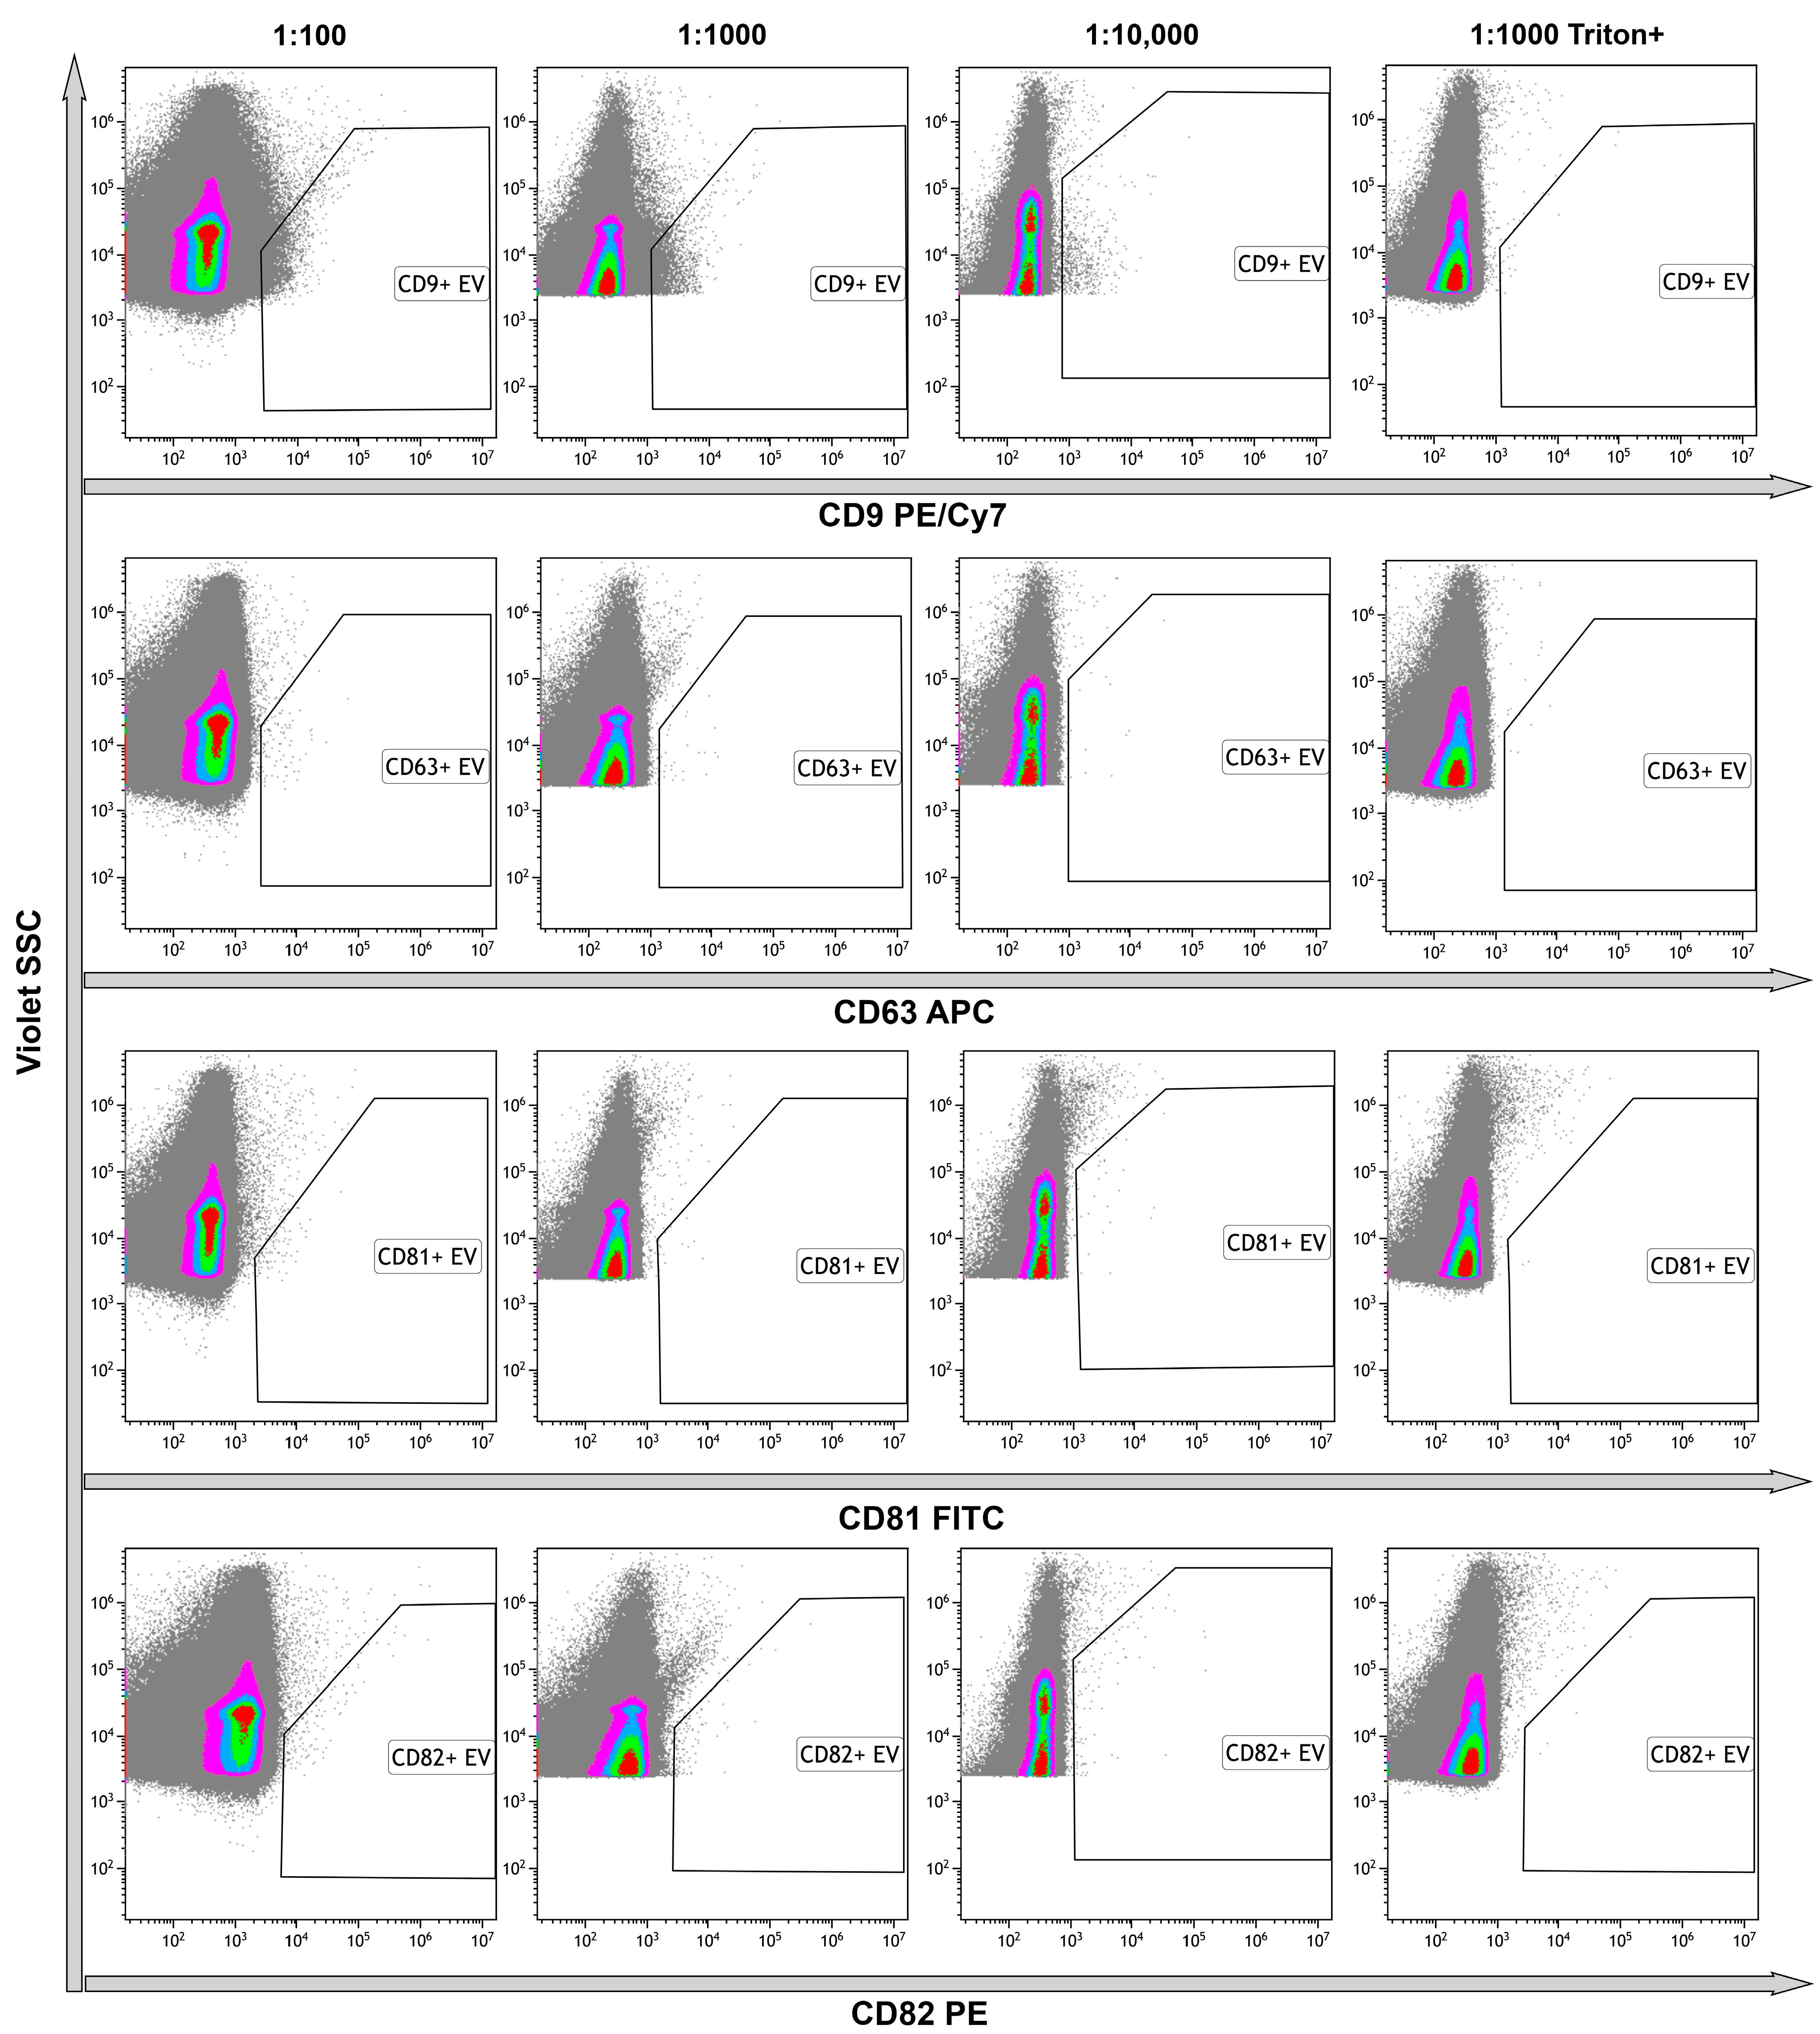
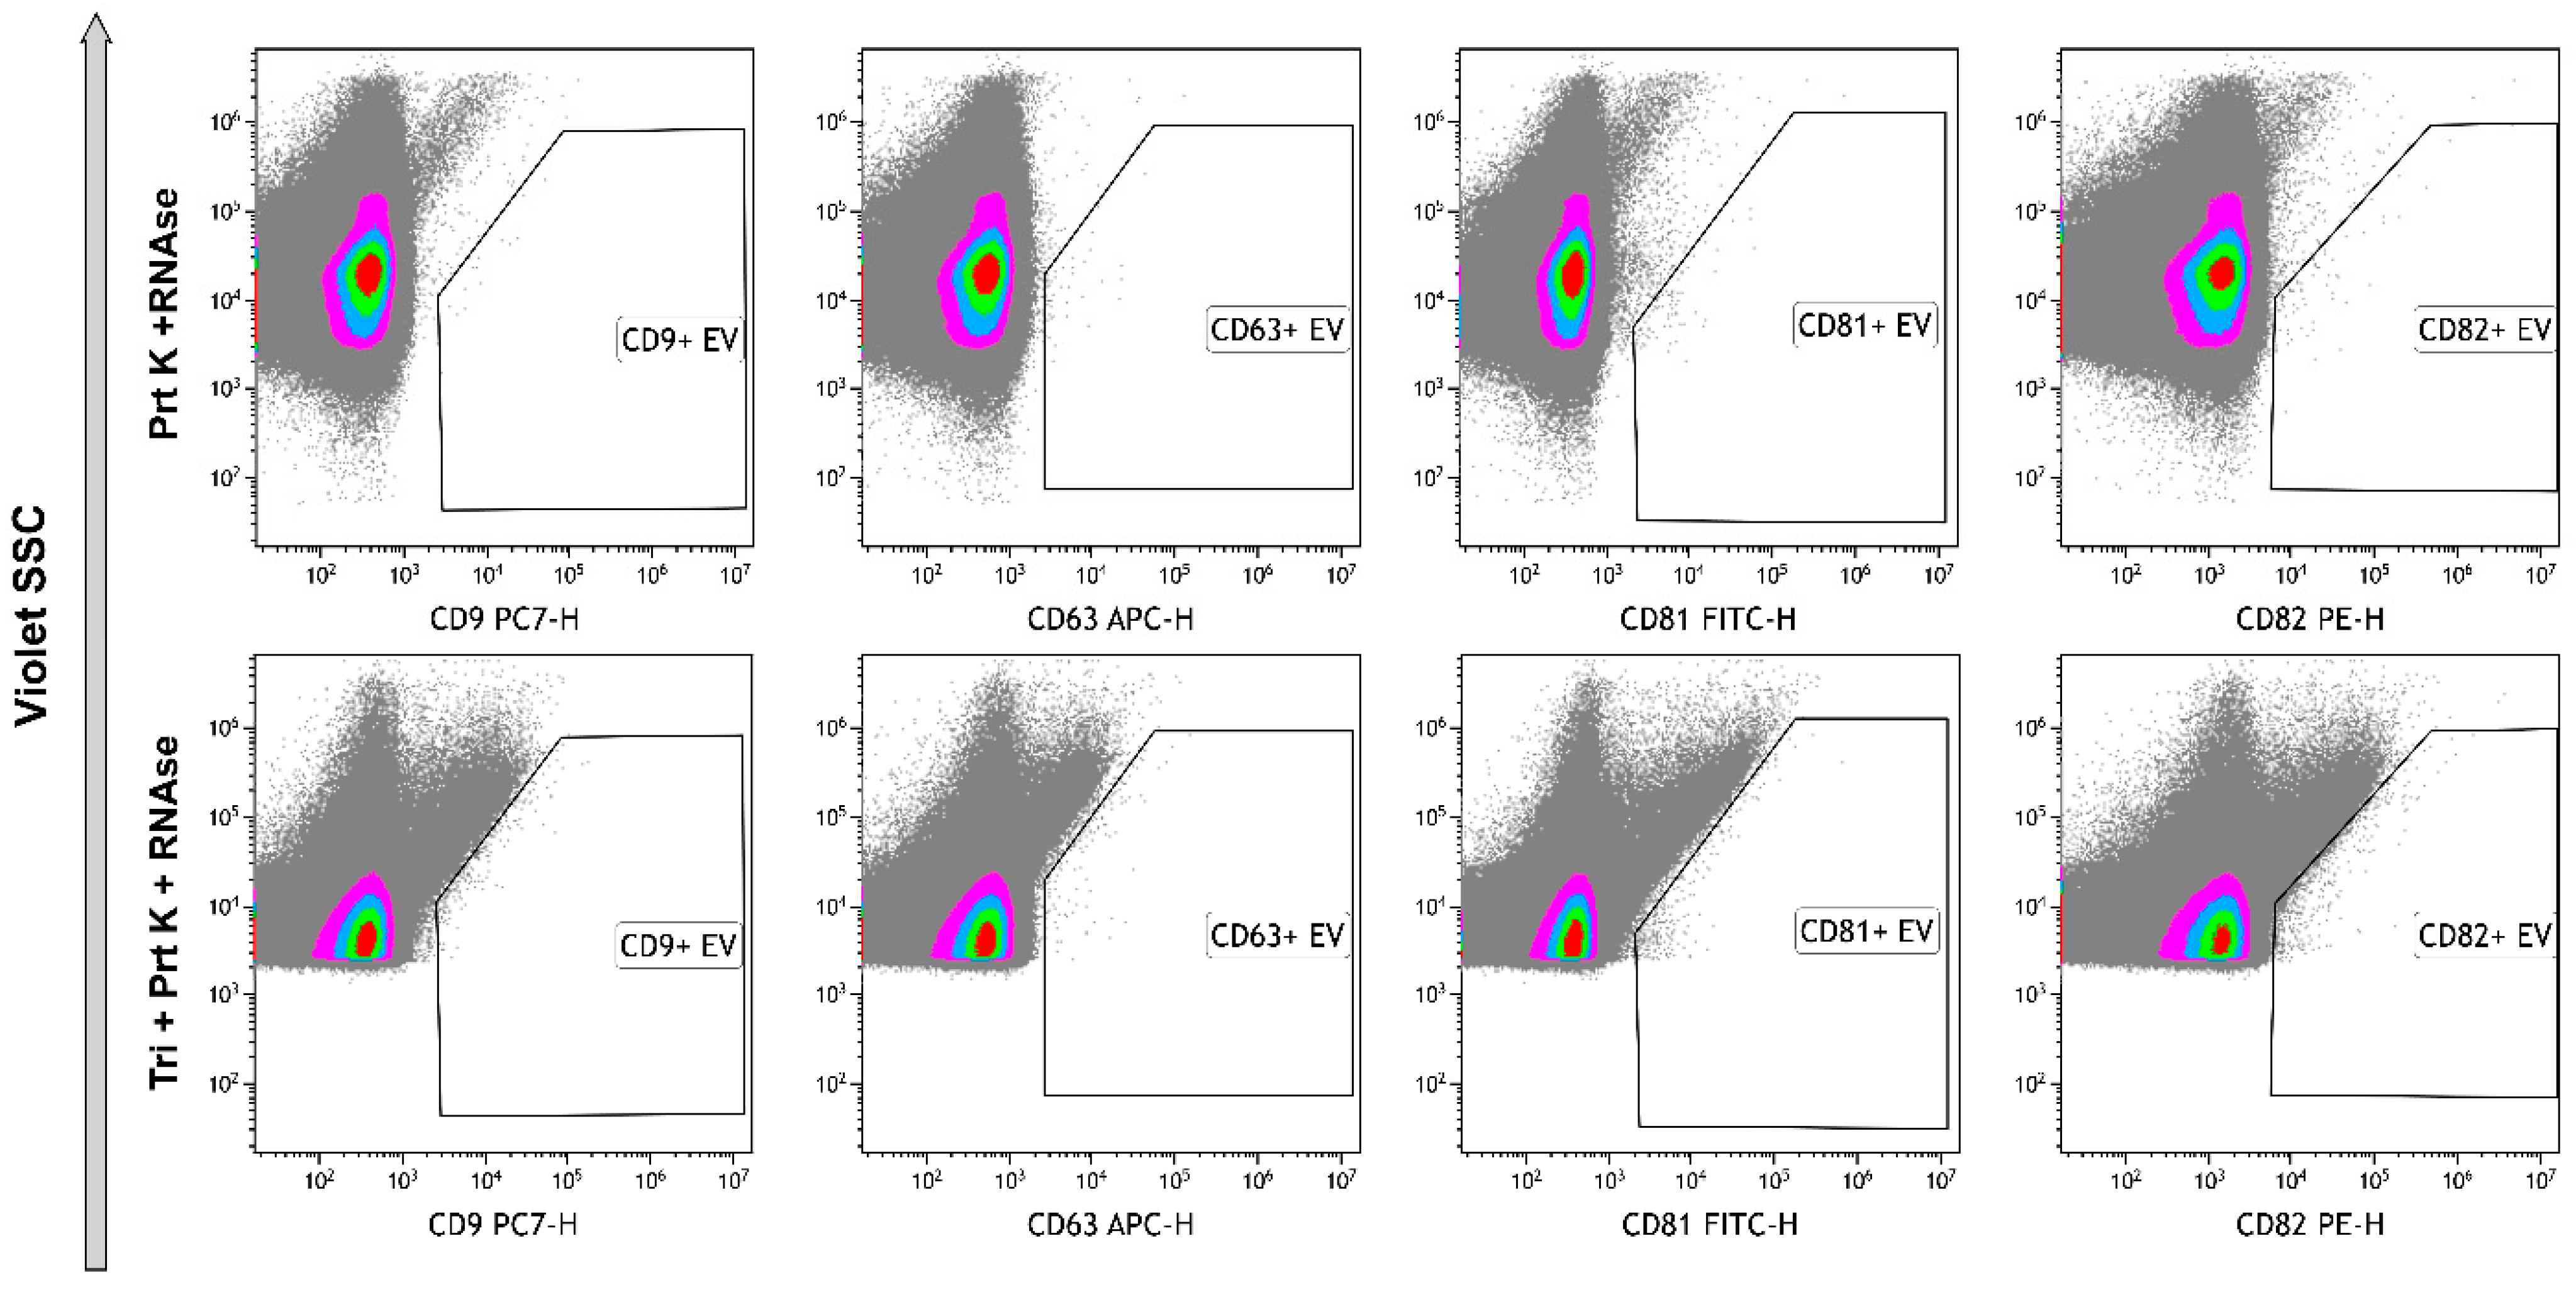
2.7. High-Sensitivity Flow Cytometry
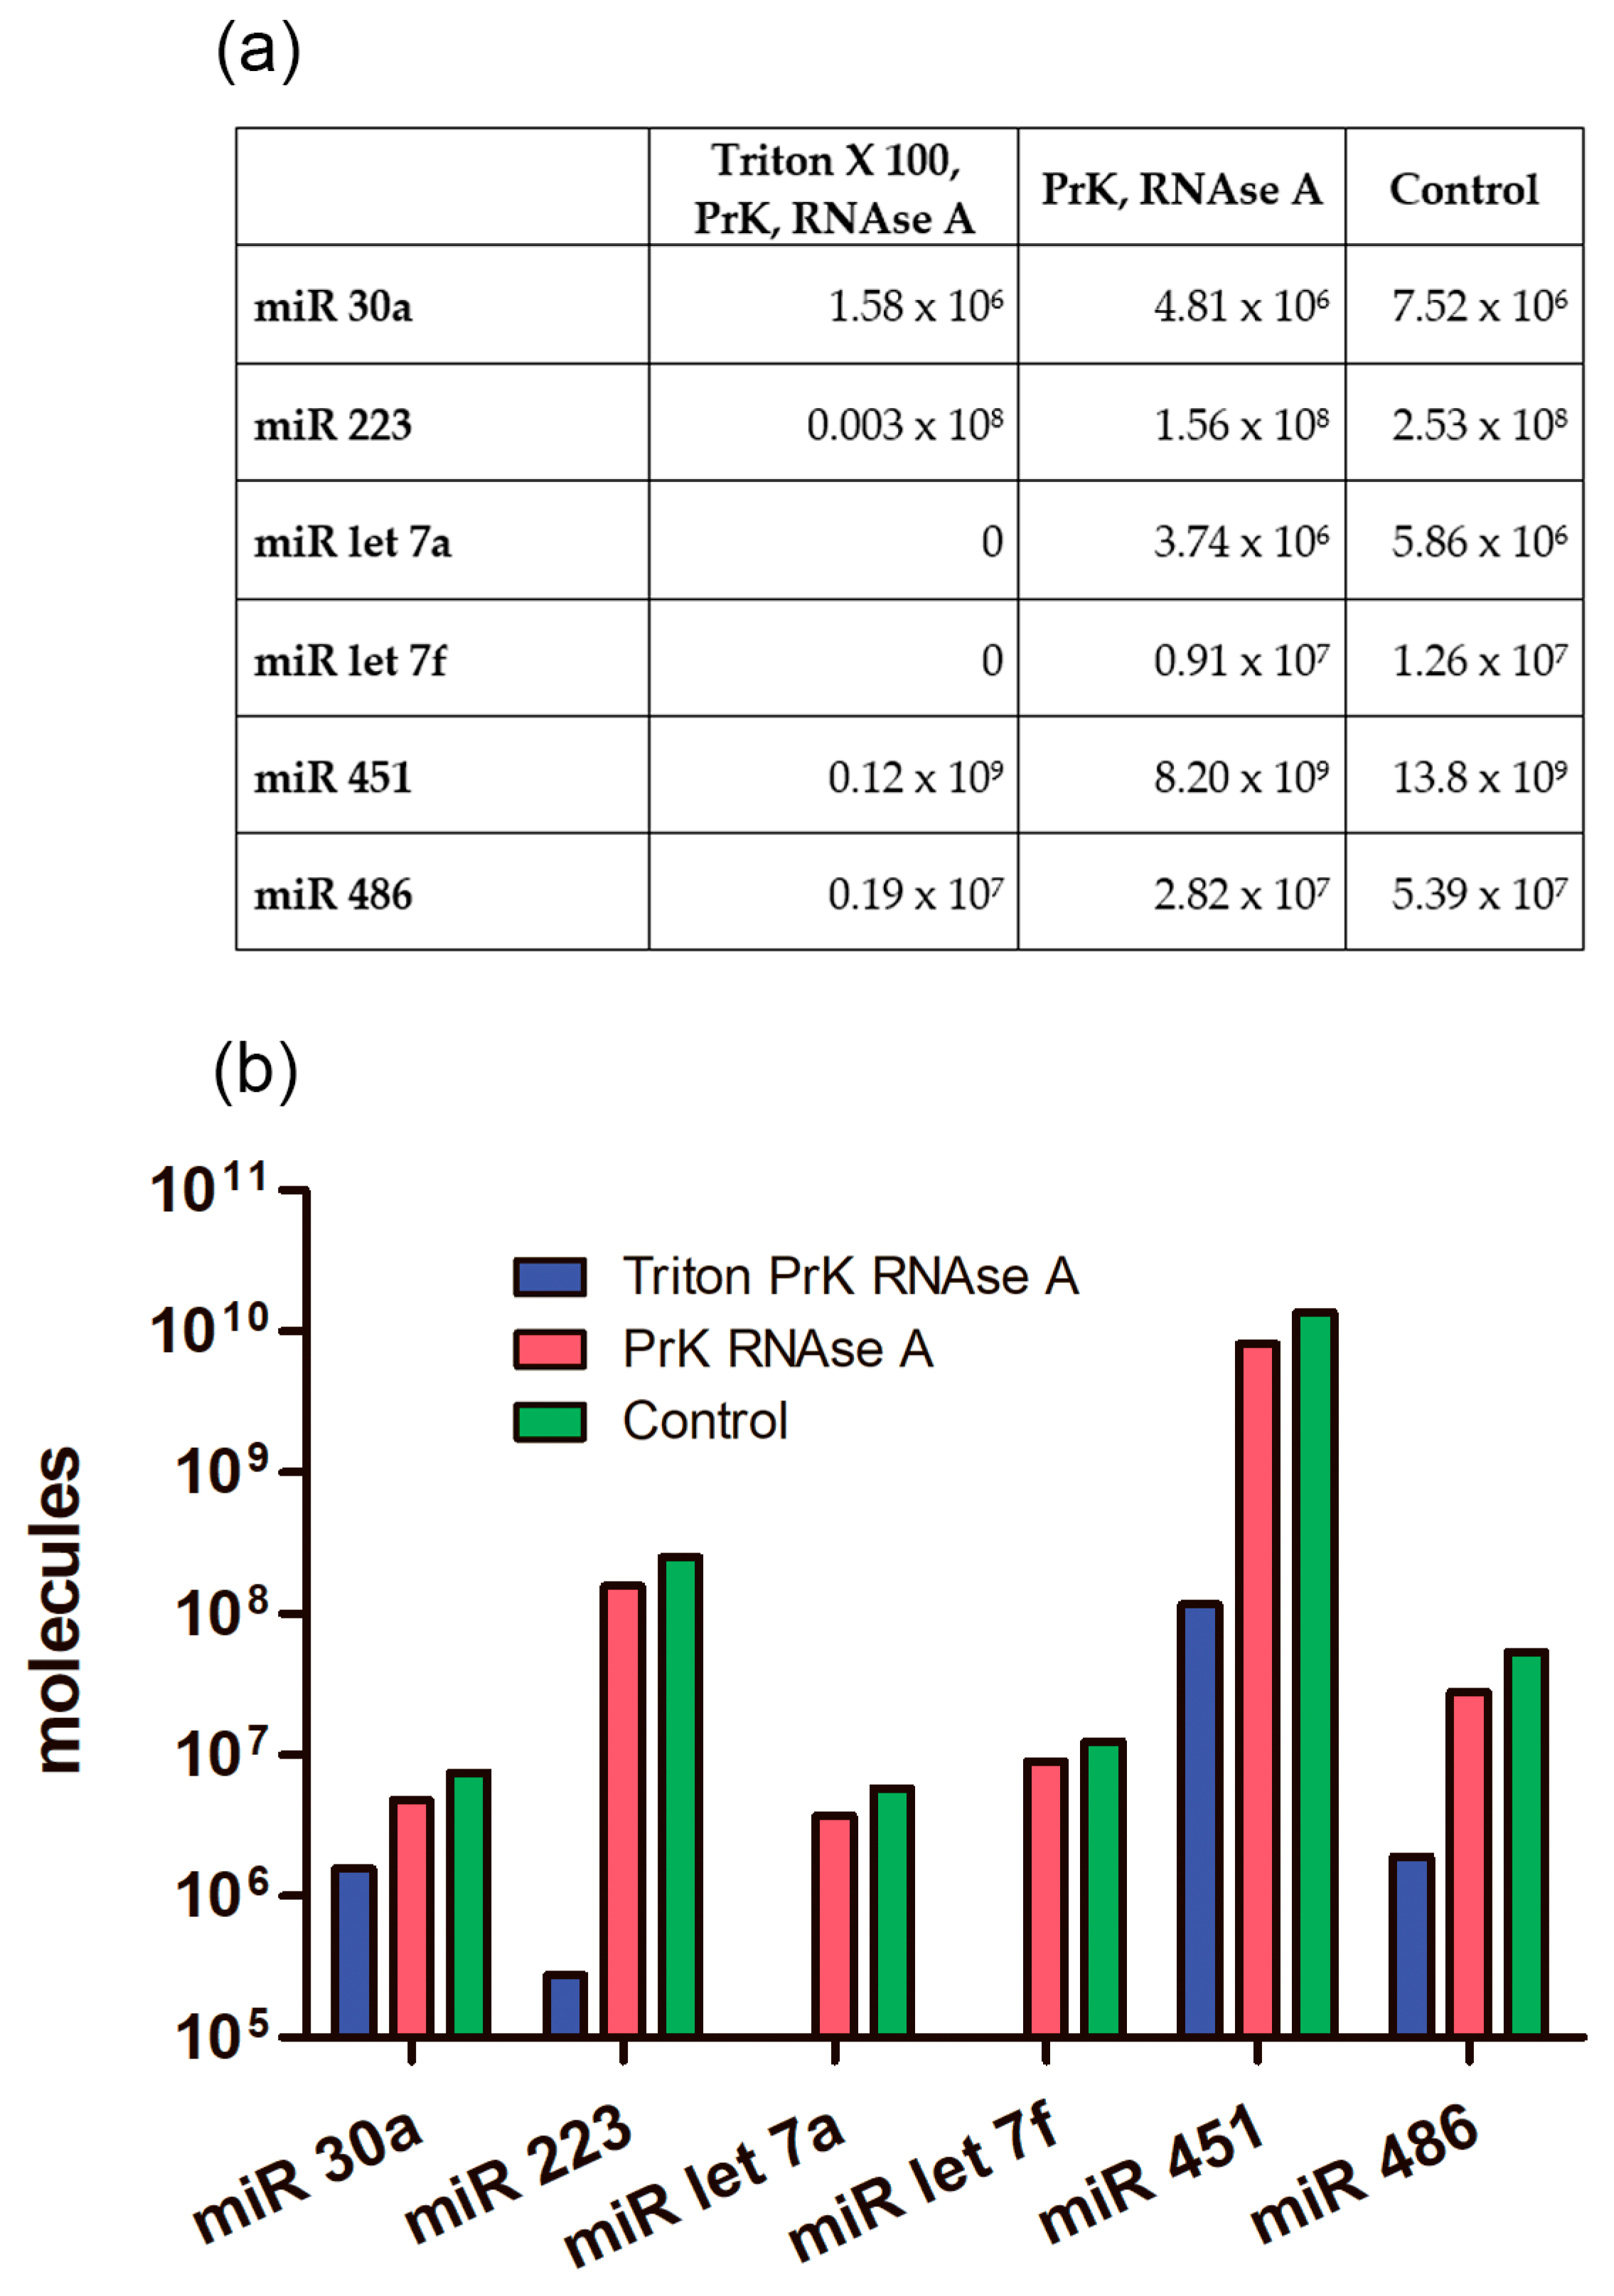
2.8. The Absolute Number of miRNA Molecules in the EVs Samples Obtained from 1 mL of Plasma after Enzymatic Treatments
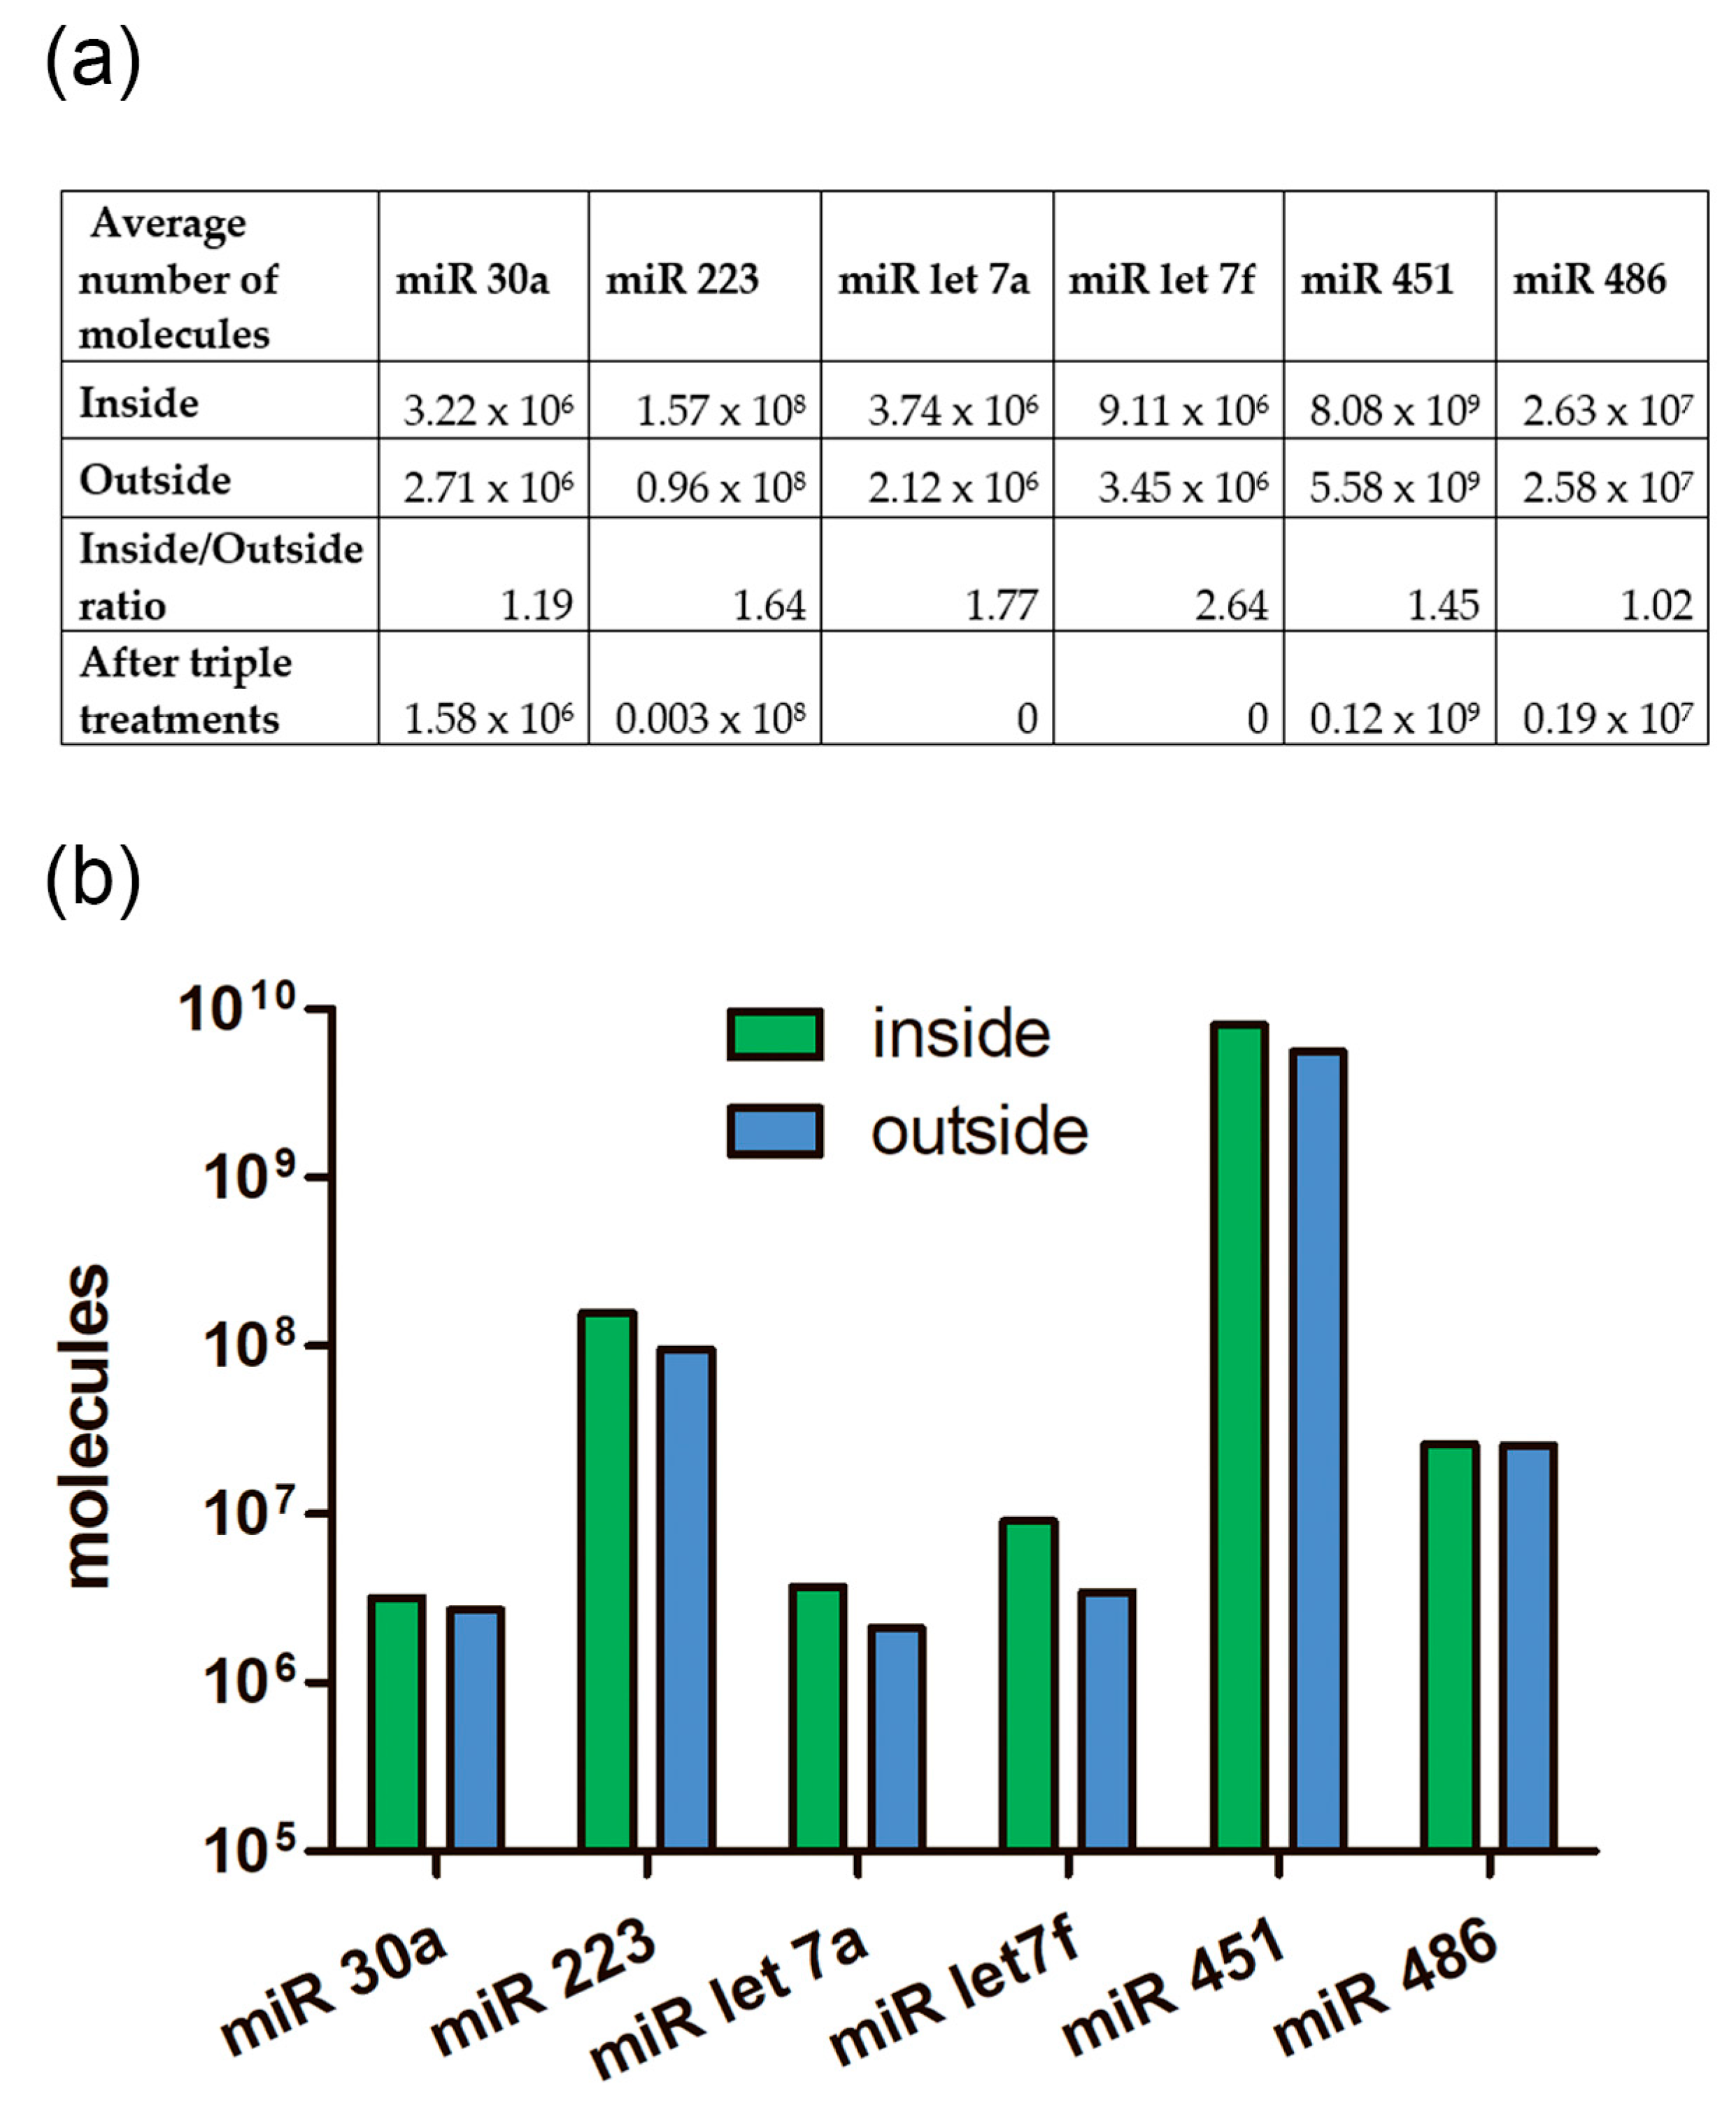
2.9. The Absolute Number of miRNA Molecules in the EVs Samples and Adhered Outside the EVs
3. Discussion
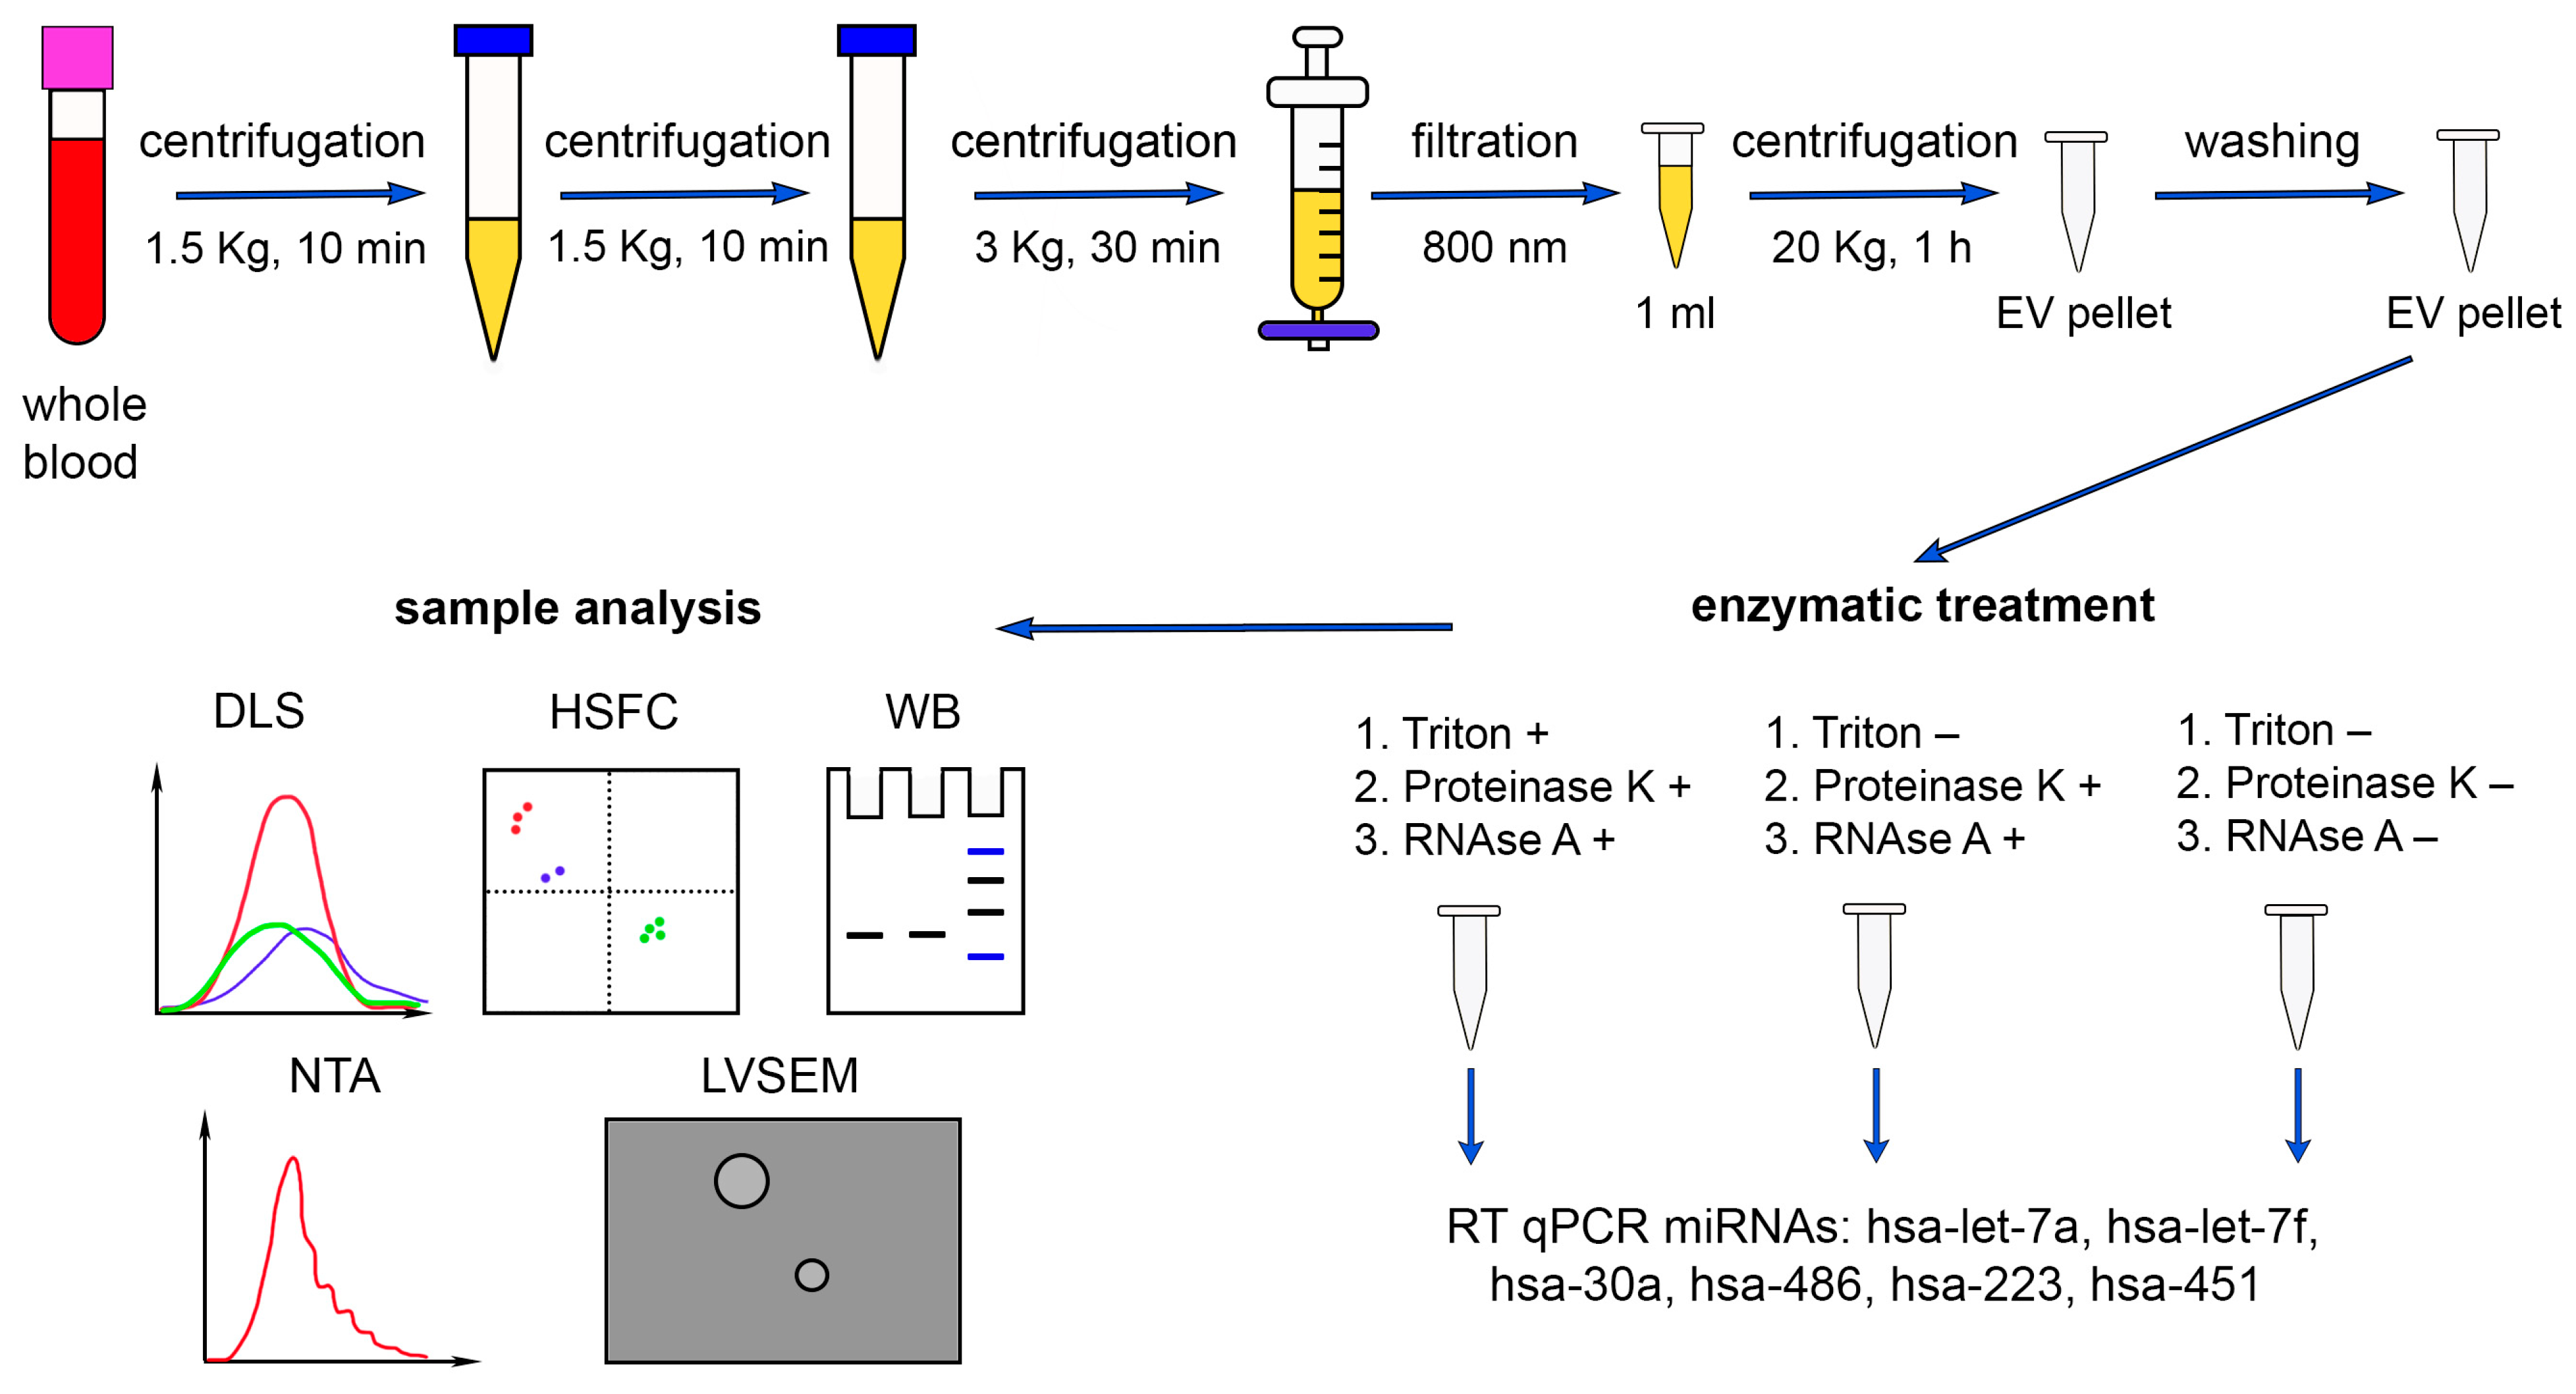
4. Materials and Methods
4.1. Study Population
4.2. Sample Collection and Preparation
4.3. Enzymatic Treatment
4.4. Western Blot Analysis
4.5. Low-Voltage Scanning Electron Microscopy
4.6. Dynamic Light Scattering
4.7. Nanoparticle Tracking Analysis
4.8. High-Sensitivity Flow Cytometry
4.9. Isolation of Total RNA
4.10. Reverse Transcription and Real-Time Polymerase Chain Reaction
Standard Curve
4.11. RT-qPCR Data Analysis
EV-TRACK
Author Contributions
Funding
Institutional Review Board Statement
Informed Consent Statement
Data Availability Statement
Acknowledgments
Conflicts of Interest
References
- Deatheragea, B.L.; Cooksona, B.T. Membrane vesicle release in bacteria, eukaryotes, and archaea: A conserved yet underappreciated aspect of microbial life. Infect. Immun. 2012, 80, 1948–1957. [Google Scholar] [CrossRef]
- Théry, C.; Zitvogel, L.; Amigorena, S. Exosomes: Composition, biogenesis and function. Nat. Rev. Immunol. 2002, 2, 569–579. [Google Scholar] [CrossRef]
- Yáñez-Mó, M.; Siljander, P.R.M.; Andreu, Z.; Zavec, A.B.; Borràs, F.E.; Buzas, E.I.; Buzas, K.; Casal, E.; Cappello, F.; Carvalho, J.; et al. Biological properties of extracellular vesicles and their physiological functions. J. Extracell. Vesicles 2015, 4, 27066. [Google Scholar] [CrossRef]
- Mathivanan, S.; Ji, H.; Simpson, R.J. Exosomes: Extracellular organelles important in intercellular communication. J. Proteom. 2010, 73, 1907–1920. [Google Scholar] [CrossRef]
- Colombo, M.; Raposo, G.; Théry, C. Biogenesis, secretion, and intercellular interactions of exosomes and other extracellular vesicles. Annu. Rev. Cell Dev. Biol. 2014, 30, 255–289. [Google Scholar] [CrossRef]
- Raposo, G.; Stoorvogel, W. Extracellular vesicles: Exosomes, microvesicles, and friends. J. Cell Biol. 2013, 200, 373–383. [Google Scholar] [CrossRef]
- Théry, C.; Witwer, K.W.; Aikawa, E.; Alcaraz, M.J.; Anderson, J.D.; Andriantsitohaina, R.; Antoniou, A.; Arab, T.; Archer, F.; Atkin-Smith, G.K.; et al. Minimal information for studies of extracellular vesicles 2018 (MISEV2018): A position statement of the International Society for Extracellular Vesicles and update of the MISEV2014 guidelines. J. Extracell. Vesicles 2018, 7, 1535750. [Google Scholar] [CrossRef] [PubMed]
- Nolte-’t Hoen, E.N.M.; Buermans, H.P.J.; Waasdorp, M.; Stoorvogel, W.; Wauben, M.H.M.; ’t Hoen, P.A.C. Deep sequencing of RNA from immune cell-derived vesicles uncovers the selective incorporation of small non-coding RNA biotypes with potential regulatory functions. Nucleic Acids Res. 2012, 40, 9272–9285. [Google Scholar] [CrossRef] [PubMed]
- Mittelbrunn, M.; Gutiérrez-Vázquez, C.; Villarroya-Beltri, C.; González, S.; Sánchez-Cabo, F.; González, M.Á.; Bernad, A.; Sánchez-Madrid, F. Unidirectional transfer of microRNA-loaded exosomes from T cells to antigen-presenting cells. Nat. Commun. 2011, 2, 282. [Google Scholar] [CrossRef]
- Balaj, L.; Lessard, R.; Dai, L.; Cho, Y.J.; Pomeroy, S.L.; Breakefield, X.O.; Skog, J. Tumour microvesicles contain retrotransposon elements and amplified oncogene sequences. Nat. Commun. 2011, 2, 180. [Google Scholar] [CrossRef]
- Chen, X.; Ba, Y.; Ma, L.; Cai, X.; Yin, Y.; Wang, K.; Guo, J.; Zhang, Y.; Chen, J.; Guo, X.; et al. Characterization of microRNAs in serum: A novel class of biomarkers for diagnosis of cancer and other diseases. Cell Res. 2008, 18, 997–1006. [Google Scholar] [CrossRef]
- García-Romero, N.; Carrión-Navarro, J.; Esteban-Rubio, S.; Lázaro-Ibáñez, E.; Peris-Celda, M.; Alonso, M.M.; Guzmán-De-Villoria, J.; Fernández-Carballal, C.; de Mendivil, A.O.; García-Duque, S.; et al. DNA sequences within glioma-derived extracellular vesicles can cross the intact blood-brain barrier and be detected in peripheral blood of patients. Oncotarget 2017, 8, 1416–1428. [Google Scholar] [CrossRef]
- Kudryavtsev, I.; Kalinina, O.; Bezrukikh, V.; Melnik, O.; Golovkin, A. The significance of phenotyping and quantification of plasma extracellular vesicles levels using high-sensitivity flow cytometry during COVID-19 treatment. Viruses 2021, 13, 767. [Google Scholar] [CrossRef]
- Baj-Krzyworzeka, M.; Szatanek, R.; Węglarczyk, K.; Baran, J.; Urbanowicz, B.; Brański, P.; Ratajczak, M.Z.; Zembala, M. Tumour-derived microvesicles carry several surface determinants and mRNA of tumour cells and transfer some of these determinants to monocytes. Cancer Immunol. Immunother. 2006, 55, 808–818. [Google Scholar] [CrossRef] [PubMed]
- Crescitelli, R.; Lässer, C.; Szabó, T.G.; Kittel, A.; Eldh, M.; Dianzani, I.; Buzás, E.I.; Lötvall, J. Distinct RNA profiles in subpopulations of extracellular vesicles: Apoptotic bodies, microvesicles and exosomes. J. Extracell. Vesicles 2013, 2, 20677. [Google Scholar] [CrossRef] [PubMed]
- Huang, X.; Yuan, T.; Tschannen, M.; Sun, Z.; Jacob, H.; Du, M.; Liang, M.; Dittmar, R.L.; Liu, Y.; Liang, M.; et al. Characterization of human plasma-derived exosomal RNAs by deep sequencing. BMC Genom. 2013, 14, 319. [Google Scholar] [CrossRef] [PubMed]
- Kalinina, O.V.; Khudiakov, A.A.; Panshin, D.D.; Nikitin, Y.V.; Ivanov, A.M.; Kostareva, A.A.; Golovkin, A.S. Small Non-Coding RNA Profiles of Sorted Plasma Extracellular Vesicles: Technical Approach. J. Evol. Biochem. Physiol. 2022, 58, 1847–1864. [Google Scholar] [CrossRef]
- Kondratov, K.; Nikitin, Y.; Fedorov, A.; Kostareva, A.; Mikhailovskii, V.; Isakov, D.; Ivanov, A.; Golovkin, A. Heterogeneity of the nucleic acid repertoire of plasma extracellular vesicles demonstrated using high-sensitivity fluorescence-activated sorting. J. Extracell. Vesicles 2020, 9, 1743139. [Google Scholar] [CrossRef]
- Ratajczak, J.; Miekus, K.; Kucia, M.; Zhang, J.; Reca, R.; Dvorak, P.; Ratajczak, M.Z. Embryonic stem cell-derived microvesicles reprogram hematopoietic progenitors: Evidence for horizontal transfer of mRNA and protein delivery. Leukemia 2006, 20, 847–856. [Google Scholar] [CrossRef]
- Valadi, H.; Ekström, K.; Bossios, A.; Sjöstrand, M.; Lee, J.J.; Lötvall, J.O. Exosome-mediated transfer of mRNAs and microRNAs is a novel mechanism of genetic exchange between cells. Nat. Cell Biol. 2007, 9, 654–659. [Google Scholar] [CrossRef]
- Zhou, W.; Fong, M.Y.; Min, Y.; Somlo, G.; Liu, L.; Palomares, M.R.; Yu, Y.; Chow, A.; O’Connor, S.T.F.; Chin, A.R.; et al. Cancer-secreted miR-105 destroys vascular endothelial barriers to promote metastasis. Cancer Cell 2014, 25, 501–515. [Google Scholar] [CrossRef] [PubMed]
- Shemesh, R.; Laufer-Geva, S.; Gorzalczany, Y.; Anoze, A.; Sagi-Eisenberg, R.; Peled, N.; Roisman, L.C. The interaction of mast cells with membranes from lung cancer cells induces the release of extracellular vesicles with a unique miRNA signature. Sci. Rep. 2023, 13, 21544. [Google Scholar] [CrossRef]
- Ambros, V. The functions of animal microRNAs. Nature 2004, 431, 350–355. [Google Scholar] [CrossRef] [PubMed]
- Bartel, D.P. MicroRNAs: Genomics, Biogenesis, Mechanism, and Function. Cell 2004, 116, 281–297. [Google Scholar] [CrossRef]
- Flynt, A.S.; Lai, E.C. Biological principles of microRNA-mediated regulation: Shared themes amid diversity. Nat. Rev. Genet. 2008, 9, 831–842. [Google Scholar] [CrossRef]
- Pritchard, C.C.; Cheng, H.H.; Tewari, M. MicroRNA profiling: Approaches and considerations. Nat. Rev. Genet. 2012, 13, 358–369. [Google Scholar] [CrossRef]
- Stefani, G.; Slack, F.J. Small non-coding RNAs in animal development. Nat. Rev. Mol. Cell Biol. 2008, 9, 219–230. [Google Scholar] [CrossRef]
- Arroyo, J.D.; Chevillet, J.R.; Kroh, E.M.; Ruf, I.K.; Pritchard, C.C.; Gibson, D.F.; Mitchell, P.S.; Bennett, C.F.; Pogosova-Agadjanyan, E.L.; Stirewalt, D.L.; et al. Argonaute2 complexes carry a population of circulating microRNAs independent of vesicles in human plasma. Proc. Natl. Acad. Sci. USA 2011, 108, 5003–5008. [Google Scholar] [CrossRef]
- Panshin, D.D.; Kondratov, K.A. The Efficiency of Immunoprecipitation of microRNA/Ago2 Complexes from Human Blood Plasma Is Protocol Dependent. Mol. Biol. 2020, 54, 244–251. [Google Scholar] [CrossRef]
- Turchinovich, A.; Weiz, L.; Langheinz, A.; Burwinkel, B. Characterization of extracellular circulating microRNA. Nucleic Acids Res. 2011, 39, 7223–7233. [Google Scholar] [CrossRef]
- Vickers, K.C.; Palmisano, B.T.; Shoucri, B.M.; Shamburek, R.D.; Remaley, A.T. MicroRNAs are transported in plasma and delivered to recipient cells by high-density lipoproteins. Nat. Cell Biol. 2011, 13, 423–433. [Google Scholar] [CrossRef] [PubMed]
- Mitchell, P.S.; Parkin, R.K.; Kroh, E.M.; Fritz, B.R.; Wyman, S.K.; Pogosova-Agadjanyan, E.L.; Peterson, A.; Noteboom, J.; O’Briant, K.C.; Allen, A.; et al. Circulating microRNAs as stable blood-based markers for cancer detection. Proc. Natl. Acad. Sci. USA 2008, 105, 10513–10518. [Google Scholar] [CrossRef]
- Wang, K.; Zhang, S.; Weber, J.; Baxter, D.; Galas, D.J. Export of microRNAs and microRNA-protective protein by mammalian cells. Nucleic Acids Res. 2010, 38, 7248–7259. [Google Scholar] [CrossRef]
- Wagner, J.; Riwanto, M.; Besler, C.; Knau, A.; Fichtlscherer, S.; Röxe, T.; Zeiher, A.M.; Landmesser, U.; Dimmeler, S. Characterization of levels and cellular transfer of circulating lipoprotein-bound microRNAs. Arterioscler. Thromb. Vasc. Biol. 2013, 33, 1392–1400. [Google Scholar] [CrossRef] [PubMed]
- Zhang, Y.; Liu, D.; Chen, X.; Li, J.; Li, L.; Bian, Z.; Sun, F.; Lu, J.; Yin, Y.; Cai, X.; et al. Secreted Monocytic miR-150 Enhances Targeted Endothelial Cell Migration. Mol. Cell 2010, 39, 133–144. [Google Scholar] [CrossRef] [PubMed]
- Groot, M.; Lee, H. Sorting Mechanisms for MicroRNAs into Extracellular Vesicles and Their Associated Diseases. Cells 2020, 9, 1044. [Google Scholar] [CrossRef]
- Lee, H.; Groot, M.; Pinilla-Vera, M.; Fredenburgh, L.E.; Jin, Y. Identification of miRNA-rich vesicles in bronchoalveolar lavage fluid: Insights into the function and heterogeneity of extracellular vesicles. J. Control. Release 2019, 294, 43–52. [Google Scholar] [CrossRef]
- Villarroya-Beltri, C.; Baixauli, F.; Gutiérrez-Vázquez, C.; Sánchez-Madrid, F.; Mittelbrunn, M. Sorting it out: Regulation of exosome loading. Semin. Cancer Biol. 2014, 28, 3–13. [Google Scholar] [CrossRef]
- Chen, C.Z.; Li, L.; Lodish, H.F.; Bartel, D.P. MicroRNAs Modulate Hematopoietic Lineage Differentiation. Science 2004, 303, 83–86. [Google Scholar] [CrossRef]
- Bruchova, H.; Yoon, D.; Agarwal, A.M.; Mendell, J.; Prchal, J.T. Regulated expression of microRNAs in normal and polycythemia vera erythropoiesis. Exp. Hematol. 2007, 35, 1657–1667. [Google Scholar] [CrossRef]
- Small, E.M.; O’Rourke, J.R.; Moresi, V.; Sutherland, L.B.; McAnally, J.; Gerard, R.D.; Richardson, J.A.; Olson, E.N. Regulation of PI3-kinase/Akt signaling by muscle-enriched microRNA-486. Proc. Natl. Acad. Sci. USA 2010, 107, 4218–4223. [Google Scholar] [CrossRef]
- Yang, X.; Chen, Y.; Chen, L.; Wang, C.; Yang, X.; Chen, Y.; Chen, L. The versatile role of microRNA-30a in human cancer. Cell. Physiol. Biochem. 2017, 41, 1616–1632. [Google Scholar] [CrossRef]
- Torrisani, J.; Parmentier, L.; Buscail, L.; Cordelier, P. Enjoy the Silence: The Story of let-7 MicroRNA and Cancer. Curr. Genom. 2007, 8, 229–233. [Google Scholar] [CrossRef] [PubMed]
- Reinhart, B.J.; Slack, F.J.; Basson, M.; Pasquienelll, A.E.; Bettlnger, J.C.; Rougvle, A.E.; Horvitz, H.R.; Ruvkun, G. The 21-nucleotide let-7 RNA regulates developmental timing in Caenorhabditis elegans. Nature 2000, 403, 901–906. [Google Scholar] [CrossRef]
- Anderson, N.L.; Anderson, N.G. The human plasma proteome: History, character, and diagnostic prospects. Mol. Cell. Proteom. 2002, 1, 845–867. [Google Scholar] [CrossRef]
- Geyer, P.E.; Holdt, L.M.; Teupser, D.; Mann, M. Revisiting biomarker discovery by plasma proteomics. Mol. Syst. Biol. 2017, 13, 942. [Google Scholar] [CrossRef]
- Gyorgy, B.; Modos, K.; Pallinger, E.; Paloczi, K.; Pasztoi, M.; Misjak, P.; Deli, M.A.; Sipos, A.; Szalai, A.; Voszka, I.; et al. Detection and isolation of cell-derived microparticles are compromised by protein complexes resulting from shared biophysical parameters. Blood 2011, 117, e39–e48. [Google Scholar] [CrossRef]
- Li, L.; Zhu, D.; Huang, L.; Zhang, J.; Bian, Z.; Chen, X.; Liu, Y.; Zhang, C.Y.; Zen, K. Argonaute 2 Complexes Selectively Protect the Circulating MicroRNAs in Cell-Secreted Microvesicles. PLoS ONE 2012, 7, e46957. [Google Scholar] [CrossRef]
- Schmittgen, T.D.; Lee, E.J.; Jiang, J.; Sarkar, A.; Yang, L.; Elton, T.S.; Chen, C. Real-time PCR quantification of precursor and mature microRNA. Methods 2008, 44, 31–38. [Google Scholar] [CrossRef]
- Karttunen, J.; Heiskanen, M.; Navarro-Ferrandis, V.; Das Gupta, S.; Lipponen, A.; Puhakka, N.; Rilla, K.; Koistinen, A.; Pitkänen, A. Precipitation-based extracellular vesicle isolation from rat plasma co-precipitate vesicle-free microRNAs. J. Extracell. Vesicles 2019, 8, 1555410. [Google Scholar] [CrossRef] [PubMed]
- Lucien, F.; Gustafson, D.; Lenassi, M.; Li, B.; Teske, J.J.; Boilard, E.; von Hohenberg, K.C.; Falcón-Perez, J.M.; Gualerzi, A.; Reale, A.; et al. MIBlood-EV: Minimal information to enhance the quality and reproducibility of blood extracellular vesicle research. J. Extracell. Vesicles 2023, 12, 12385. [Google Scholar] [CrossRef]
- Aatonen, M.T.; Öhman, T.; Nyman, T.A.; Laitinen, S.; Grönholm, M.; Siljander, P.R.M. Isolation and characterization of platelet-derived extracellular vesicles. J. Extracell. Vesicles 2014, 3, 24692. [Google Scholar] [CrossRef]
- Prabhu, S.R.; Ware, A.P.; Saadi, A.V. Erythrocyte miRNA regulators and malarial pathophysiology. Infect. Genet. Evol. 2021, 93, 105000. [Google Scholar] [CrossRef]
- Sun, L.; Yu, Y.; Niu, B.; Wang, D. Red Blood Cells as Potential Repositories of MicroRNAs in the Circulatory System. Front. Genet. 2020, 11, 442. [Google Scholar] [CrossRef]
- Wang, H.; Cui, W.; Qiao, L.; Hu, G. Overexpression of mir-451a in sepsis and septic shock patients is involved in the regulation of sepsis-associated cardiac dysfunction and inflammation. Genet. Mol. Biol. 2020, 43, e20200009. [Google Scholar] [CrossRef]
- He, B.; Zhao, Z.; Cai, Q.; Zhang, Y.; Zhang, P.; Shi, S.; Xie, H.; Peng, X.; Yin, W.; Tao, Y.; et al. miRNA-based biomarkers, therapies, and resistance in Cancer. Int. J. Biol. Sci. 2020, 2020, 2628–2647. [Google Scholar] [CrossRef]
- Matsuzaki, J.; Ochiya, T. Extracellular microRNAs and oxidative stress in liver injury: A systematic mini review. J. Clin. Biochem. Nutr. 2018, 63, 6–11. [Google Scholar] [CrossRef]
- Laffont, B.; Corduan, A.; Pĺe, H.; Duchez, A.C.; Cloutier, N.; Boilard, E.; Provost, P. Activated platelets can deliver mRNA regulatory Ago2•microRNA complexes to endothelial cells via microparticles. Blood 2013, 122, 253–261. [Google Scholar] [CrossRef]
- Kalra, H.; Drummen, G.P.C.; Mathivanan, S. Focus on extracellular vesicles: Introducing the next small big thing. Int. J. Mol. Sci. 2016, 17, 170. [Google Scholar] [CrossRef]
- Finean, J.B.; Coleman, R.; Green, W.G.; Limbrick, A.R. Low-angle x-ray diffraction and electron-microscope studies of isolated cell membranes. J. Cell Sci. 1966, 1, 287–296. [Google Scholar] [CrossRef]
- Coxeter, H.S.M.; Conway, J.H.; Sloane, N.J.A. Sphere Packings, Lattices and Groups. In The American Mathematical Monthly; Grundlehren der Mathematischen Wissenschaften; Springer: New York, NY, USA, 1989; Volume 96. [Google Scholar] [CrossRef]
- Chevillet, J.R.; Kang, Q.; Ruf, I.K.; Briggs, H.A.; Vojtech, L.N.; Hughes, S.M.; Cheng, H.H.; Arroyo, J.D.; Meredith, E.K.; Gallichotte, E.N.; et al. Quantitative and stoichiometric analysis of the microRNA content of exosomes. Proc. Natl. Acad. Sci. USA 2014, 111, 14888–14893. [Google Scholar] [CrossRef]
- Juzenas, S.; Venkatesh, G.; Hübenthal, M.; Hoeppner, M.P.; Du, Z.G.; Paulsen, M.; Rosenstiel, P.; Senger, P.; Hofmann-Apitius, M.; Keller, A.; et al. A comprehensive, cell specific microRNA catalogue of human peripheral blood. Nucleic Acids Res. 2017, 45, 9290–9301. [Google Scholar] [CrossRef]
- Schindler, V.E.M.; Alhamdan, F.; Preußer, C.; Hintz, L.; Alhamwe, B.A.; Nist, A.; Stiewe, T.; von Strandmann, E.P.; Potaczek, D.P.; Thölken, C.; et al. Side-Directed Release of Differential Extracellular Vesicle-associated microRNA Profiles from Bronchial Epithelial Cells of Healthy and Asthmatic Subjects. Biomedicines 2022, 10, 622. [Google Scholar] [CrossRef]
- Tosar, J.P.; Witwer, K.; Cayota, A. Revisiting Extracellular RNA Release, Processing, and Function. Trends Biochem. Sci. 2021, 46, 438–445. [Google Scholar] [CrossRef]
- Nolan, J.P.; Jones, J.C. Detection of platelet vesicles by flow cytometry. Platelets 2017, 28, 256–262. [Google Scholar] [CrossRef] [PubMed]
- Welsh, J.A.; Van Der Pol, E.; Arkesteijn, G.J.A.; Bremer, M.; Brisson, A.; Coumans, F.; Dignat-George, F.; Duggan, E.; Ghiran, I.; Giebel, B.; et al. MIFlowCyt-EV: A framework for standardized reporting of extracellular vesicle flow cytometry experiments. J. Extracell. Vesicles 2020, 9, 1713526. [Google Scholar] [CrossRef]
- Lagos-Quintana, M.; Rauhut, R.; Lendeckel, W.; Tuschl, T. Identification of novel genes coding for small expressed RNAs. Science 2001, 294, 853–858. [Google Scholar] [CrossRef] [PubMed]
- Rodriguez, A.; Griffiths-Jones, S.; Ashurst, J.L.; Bradley, A. Identification of mammalian microRNA host genes and transcription units. Genome Res. 2004, 14, 1902–1910. [Google Scholar] [CrossRef] [PubMed]
- Landgraf, P.; Rusu, M.; Sheridan, R.; Sewer, A.; Iovino, N.; Aravin, A.; Pfeffer, S.; Rice, A.; Kamphorst, A.O.; Landthaler, M.; et al. A Mammalian microRNA Expression Atlas Based on Small RNA Library Sequencing. Cell 2007, 129, 1401–1414. [Google Scholar] [CrossRef]
- Fukao, T.; Fukuda, Y.; Kiga, K.; Sharif, J.; Hino, K.; Enomoto, Y.; Kawamura, A.; Nakamura, K.; Takeuchi, T.; Tanabe, M. An Evolutionarily Conserved Mechanism for MicroRNA-223 Expression Revealed by MicroRNA Gene Profiling. Cell 2007, 129, 617–631. [Google Scholar] [CrossRef]
- Haneklaus, M.; Gerlic, M.; O’Neill, L.A.J.; Masters, S.L. MiR-223: Infection, inflammation and cancer. J. Intern. Med. 2013, 274, 215–226. [Google Scholar] [CrossRef]
- Su, J.-L.; Chen, P.-S.; Johansson, G.; Kuo, M.-L. Function and Regulation of Let-7 Family microRNAs. MicroRNA 2012, 1, 34–39. [Google Scholar] [CrossRef]
- Roush, S.; Slack, F.J. The let-7 family of microRNAs. Trends Cell Biol. 2008, 18, 505–516. [Google Scholar] [CrossRef] [PubMed]
- Cifuentes, D.; Xue, H.; Taylor, D.W.; Patnode, H.; Mishima, Y.; Cheloufi, S.; Ma, E.; Mane, S.; Hannon, G.J.; Lawson, N.D.; et al. A novel miRNA processing pathway independent of dicer requires argonaute2 catalytic activity. Science 2010, 328, 1694–1698. [Google Scholar] [CrossRef]
- Yang, S.; Maurin, T.; Robine, N.; Rasmussen, K.D.; Jeffrey, K.L.; Chandwani, R.; Papapetrou, E.P.; Sadelain, M.; O’Carroll, D.; Lai, E.C. Conserved vertebrate mir-451 provides a platform for Dicer-independent, Ago2-mediated microRNA biogenesis. Proc. Natl. Acad. Sci. USA 2010, 107, 15163–15168. [Google Scholar] [CrossRef]
- Douvris, A.; Viñas, J.; Burns, K.D. miRNA-486-5p: Signaling targets and role in non-malignant disease. Cell. Mol. Life Sci. 2022, 79, 376. [Google Scholar] [CrossRef]
- Baglio, S.R.; Rooijers, K.; Koppers-Lalic, D.; Verweij, F.J.; Pérez Lanzón, M.; Zini, N.; Naaijkens, B.; Perut, F.; Niessen, H.W.M.; Baldini, N.; et al. Human bone marrow- and adipose-mesenchymal stem cells secrete exosomes enriched in distinctive miRNA and tRNA species. Stem Cell Res. Ther. 2015, 6, 127. [Google Scholar] [CrossRef]
- Jee, D.; Yang, J.S.; Park, S.M.; Farmer, D.T.; Wen, J.; Chou, T.; Chow, A.; McManus, M.T.; Kharas, M.G.; Lai, E.C. Dual Strategies for Argonaute2-Mediated Biogenesis of Erythroid miRNAs Underlie Conserved Requirements for Slicing in Mammals. Mol. Cell 2018, 69, 265–278.e6. [Google Scholar] [CrossRef]
- Li, M.; Zeringer, E.; Barta, T.; Schageman, J.; Cheng, A.; Vlassov, A.V. Analysis of the RNA content of the exosomes derived from blood serum and urine and its potential as biomarkers. Philos. Trans. R. Soc. B Biol. Sci. 2014, 369, 20130502. [Google Scholar] [CrossRef] [PubMed]
- El-Mogy, M.; Lam, B.; Haj-Ahmad, T.A.; McGowan, S.; Yu, D.; Nosal, L.; Rghei, N.; Roberts, P.; Haj-Ahmad, Y. Diversity and signature of small RNA in different bodily fluids using next generation sequencing. BMC Genom. 2018, 19, 408. [Google Scholar] [CrossRef]
- Tushuizen, M.E.; Diamant, M.; Sturk, A.; Nieuwland, R. Cell-Derived Microparticles in the Pathogenesis of Cardiovascular Disease. Arterioscler. Thromb. Vasc. Biol. 2011, 31, 4–9. [Google Scholar] [CrossRef] [PubMed]
- Teruel-Montoya, R.; Kong, X.; Abraham, S.; Ma, L.; Kunapuli, S.P.; Holinstat, M.; Shaw, C.A.; McKenzie, S.E.; Edelstein, L.C.; Bray, P.F. MicroRNA expression differences in human hematopoietic cell lineages enable regulated transgene expression. PLoS ONE 2014, 9, e102259. [Google Scholar] [CrossRef]
- Dahiya, N.; Sarachana, T.; Vu, L.; Becker, K.G.; Wood, W.H.; Zhang, Y.; Atreya, C.D. Platelet MicroRNAs: An Overview. Transfus. Med. Rev. 2015, 29, 215–219. [Google Scholar] [CrossRef] [PubMed]
- Shi, R.; Zhou, X.; Ji, W.J.; Zhang, Y.Y.; Ma, Y.Q.; Zhang, J.Q.; Li, Y.M. The Emerging Role of miR-223 in Platelet Reactivity: Implications in Antiplatelet Therapy. BioMed Res. Int. 2015, 2015, 981841. [Google Scholar] [CrossRef]
- Fedorov, A.; Kondratov, K.; Kishenko, V.; Mikhailovskii, V.; Kudryavtsev, I.; Belyakova, M.; Sidorkevich, S.; Vavilova, T.; Kostareva, A.; Sirotkina, O.; et al. Application of high-sensitivity flow cytometry in combination with low-voltage scanning electron microscopy for characterization of nanosized objects during platelet concentrate storage. Platelets 2020, 31, 226–235. [Google Scholar] [CrossRef]
- Kondratov, K.A.; Petrova, T.A.; Mikhailovskii, V.Y.; Ivanova, A.N.; Kostareva, A.A.; Fedorov, A.V. A study of extracellular vesicles isolated from blood plasma conducted by low-voltage scanning electron microscopy. Cell Tissue Biol. 2017, 11, 181–190. [Google Scholar] [CrossRef]
- Van Deun, J.; Mestdagh, P.; Agostinis, P.; Akay, Ö.; Anand, S.; Anckaert, J.; Martinez, Z.A.; Baetens, T.; Beghein, E.; Bertier, L.; et al. EV-TRACK: Transparent reporting and centralizing knowledge in extracellular vesicle research. Nat. Methods 2017, 14, 228–232. [Google Scholar] [CrossRef]


Disclaimer/Publisher’s Note: The statements, opinions and data contained in all publications are solely those of the individual author(s) and contributor(s) and not of MDPI and/or the editor(s). MDPI and/or the editor(s) disclaim responsibility for any injury to people or property resulting from any ideas, methods, instructions or products referred to in the content. |
© 2024 by the authors. Licensee MDPI, Basel, Switzerland. This article is an open access article distributed under the terms and conditions of the Creative Commons Attribution (CC BY) license (https://creativecommons.org/licenses/by/4.0/).
Share and Cite
Petrova, T.; Kalinina, O.; Aquino, A.; Grigoryev, E.; Dubashynskaya, N.V.; Zubkova, K.; Kostareva, A.; Golovkin, A. Topographic Distribution of miRNAs (miR-30a, miR-223, miR-let-7a, miR-let-7f, miR-451, and miR-486) in the Plasma Extracellular Vesicles. Non-Coding RNA 2024, 10, 15. https://doi.org/10.3390/ncrna10010015
Petrova T, Kalinina O, Aquino A, Grigoryev E, Dubashynskaya NV, Zubkova K, Kostareva A, Golovkin A. Topographic Distribution of miRNAs (miR-30a, miR-223, miR-let-7a, miR-let-7f, miR-451, and miR-486) in the Plasma Extracellular Vesicles. Non-Coding RNA. 2024; 10(1):15. https://doi.org/10.3390/ncrna10010015
Chicago/Turabian StylePetrova, Tatiana, Olga Kalinina, Arthur Aquino, Evgeniy Grigoryev, Natallia V. Dubashynskaya, Kseniya Zubkova, Anna Kostareva, and Alexey Golovkin. 2024. "Topographic Distribution of miRNAs (miR-30a, miR-223, miR-let-7a, miR-let-7f, miR-451, and miR-486) in the Plasma Extracellular Vesicles" Non-Coding RNA 10, no. 1: 15. https://doi.org/10.3390/ncrna10010015