Article

Refining and Validating Thermogravimetric Analysis (TGA) for Robust Characterization and Quality Assurance of Graphene-Related Two-Dimensional Materials (GR2Ms)

1
School of Chemical Engineering, The University of Adelaide, Adelaide, SA 5005, Australia
2
Curtin Corrosion Centre, WA School of Mines: Minerals, Energy and Chemical Engineering, Curtin University, Bently, WA 6102, Australia
*
Author to whom correspondence should be addressed.
Submission received: 8 February 2024 / Revised: 13 March 2024 / Accepted: 18 March 2024 / Published: 26 March 2024
(This article belongs to the Section Carbon Materials and Carbon Allotropes)

Abstract

:
Graphene-related two-dimensional materials available on the global market are manufactured using various production methods, with significant variations in properties and qualities causing serious concerns for the emerging multi-billion graphene industry. To address the limitations of conventional characterization methods probing the properties of individual graphene particles which may overlook the presence of non-graphene carbon impurities at a large (bulk) scale, this paper presents the refining thermogravimetric analysis as a complementary method for the reliable chemical characterization and quality control of graphene powders. A systematic parametric investigation of key experimental conditions such as sample mass and loading, heating rate, and gas environment and flow rate is performed to identify optimized settings for reliable thermal gravimetric measurements. These optimized conditions are evaluated through a series of comparative characterizations using industrially produced graphene, graphene oxide, and reduced graphene oxide powders, including their common carbon impurities. The ability of this method to provide both qualitative and quantitative analyses for characterizing graphene-related materials is confirmed. The optimized method is finally validated through an International Laboratory Comparison study and subsequently incorporated into a new standard. This low-cost, industry-affordable, and complementary characterization method is expected to enhance the quality control of manufactured graphene materials and make a valuable contribution to the growing graphene industry.

Graphical Abstract

1. Introduction

Since the groundbreaking discovery of graphene in 2004, the exploration of graphene-related 2D materials (GR2Ms) has surged, showcasing their remarkable properties across endless applications, including water purification, desalination, composites, protective coatings, energy storage, flexible electronics, sensing, and catalysis [1,2]. The family of GR2Ms encompasses several types of materials such as few-layer graphene (FLG), graphene oxide (GO), reduced graphene oxide (rGO), functionalized graphene, doped graphene, and graphene nanodots [3,4]. These materials are produced using many methods in diverse forms such as powders, dispersions, pastes, and foams, each exhibiting unique properties. While the diversity of GR2Ms in terms of their chemical and physical forms, properties, and manufacturing methods is beneficial for broadening their applications, at the same time, it poses challenges for their standardization and characterization. GR2Ms available on the global market are manufactured through over 20 scalable processes by more than 500 companies worldwide, resulting in considerable variations in their structural and chemical properties, qualities, and compositions. These variations in terms of the number of layers, lateral particle size, defects in the sp2 carbon structure, crystallinity, oxygen level, and the presence of impurities can significantly influence their properties and applicability for targeted applications [5,6]. Furthermore, disparities in properties and quality from one manufacturer to another and between batches in batch production is another challenge that can detrimentally affect the adoption of GR2Ms for new product developments. Developers of graphene-based products need to not only carefully select the most suitable graphene material for their application but also to gain confidence that manufacturers can consistently supply these materials with uniform quality and properties that align with their specifications. Escalating this challenge, recent studies have uncovered that a substantial portion of industrially manufactured graphene materials on the current market are not purely graphene; instead, they contain significant amounts of graphite, raising global concerns [4,7,8]. In light of these challenges, the establishment of a comprehensive GR2M standardization system supported by reliable, cost-effective characterization and quality control methods is critical and urgently needed. Such a system would not only ensure the credibility of graphene-based products but also foster trust among end users and facilitate the continued growth of the emerging graphene industry.
To address these challenges, international scientific and standardization communities, particularly the International Organization for Standardization (ISO), have dedicated significant efforts in recent years to developing a series of standards encompassing the terminology of GR2Ms and measurement techniques for determining their key properties [8,9,10]. These standards serve as a crucial foundation for establishing a unified standardization and characterization framework within the graphene industry and for graphene end users. Furthermore, complementary efforts that supplement the ISO standards have been made by the European Graphene Flagship, national standardization bodies like the British Standards Institution (BSI), and national metrology institutes like the National Physical Laboratory (NPL) in the UK [11,12]. These organizations have released additional supporting documents and guidance aimed at assisting both graphene manufacturers and end users in navigating the complexities of GR2Ms. As per these standards, a pivotal criterion for categorizing a carbon material as “graphene” is the stipulation that the number of graphene layers should be less than 10. Beyond this, depending on the number of layers of graphene particles, they undergo further classification into single-layer graphene (1LG), bilayer graphene (2LG), FLG, and graphene nanoplatelets (consisting of 50–100 layers) [8,9,10]. This systematic classification contributes to a clearer understanding and consistent terminology in the characterization of GR2Ms, facilitating communication and ensuring a standardized approach across the industry.
The ISO recommends a range of analytical methods, including scanning electron microscopy (SEM), transmission electron microscopy (TEM), Raman spectroscopy, atomic force microscopy (AFM), and X-ray photoelectron spectroscopy (XPS), for characterizing the key properties of GR2Ms such as the number of layers, particle size, defects, crystal structure, and chemical composition [9]. These established techniques are surface-probing methods that provide the localized or “spot” properties of a single particle or a few graphene particles at the nanoscale or micron scale. However, relying solely on these techniques may lead to misrepresentations of the properties of bulk GR2Ms powders at the kilogram scale which end users procure for their applications [12]. One critical limitation of these conventional methods lies in their requirement to test a sufficient number of individual particles and representative samples to obtain accurate and meaningful results. Other disadvantages include high capital and operational costs, extended testing times, and the need for skilled operators, making them economically unviable for the broader industry and smaller graphene manufacturers. In response to these limitations, there is a pressing need for analytical methods that are simpler, user-friendly, cost-effective, and accessible for the industry. They could serve as complementary methods, providing fast and consistent information on the bulk properties of graphene powders produced in large-scale batches (10–100 kg). Developing such methods is recognized as crucial to ensuring the widespread adoption and practical utility of characterization and quality control in the graphene manufacturing sector.
Among the various low-cost methods that can be used for the characterization of GR2Ms powders, thermogravimetric analysis (TGA) stands out as a highly promising approach. TGA is widely utilized in industrial laboratories for the assessment of diverse materials, including raw substances and finished products such as minerals, additives, plastics, paints, adhesives, and rubber, among others [13,14,15].This method involves subjecting a sample to controlled heating in a specific atmosphere, tracking the associated mass changes using a micro-balance, and recording the mass change data as a function of temperature or time controlled by computer software.
Pioneering studies by our team have unveiled distinct thermal decomposition signatures for various GR2Ms, such as GO, rGO, and FLG. These unique signatures, elucidated through thermogravimetry (TG) and derivative thermogravimetry (DTG) graphs, have proven effective in characterizing and ensuring the quality control of GR2Ms [13,16,17]. Notably, TGA parameters, including the number of peaks, their shapes, and the peak temperature or the temperature of the maximum mass change rate (Tp or Tmax), have been demonstrated to differentiate between different types of GR2Ms, facilitating both qualitative and quantitative analyses [13,16,17]. The studies also underscore that TGA results for GR2Ms can be influenced by various experimental conditions and parameters, such as sample size, heating rate, atmosphere, and gas flow rates, among others. These factors remain unexplored and warrant further investigation. To establish a foundation for consistent TGA measurements of GR2Ms across different laboratories, it is imperative to thoroughly explore, optimize, and standardize the experimental conditions and protocols employed in these analyses. This standardization is crucial for ensuring the reliability and reproducibility of results in the characterization and analysis of GR2Ms using TGA.
To bridge these gaps and enhance the TGA method to a level at which it can serve as a new and reliable standardized characterization technique for GR2M powders, this study conducted a comprehensive investigation into a diverse range of TGA experimental conditions that may impact its analytical performance. This study investigated for the first time the influence of key parameters and conditions on the TGA method for GR2M characterization, including (1) the sample mass, (2) methods for loading and storing samples in the crucible, (3) the heating rate, (4) the gas environment (air and nitrogen), (5) the gas flow rate, and (6) instrument design and furnace type. This exploration of TGA condition parameters utilized FLG as a model sample to elucidate their impacts on TGA results, presented as TG and DTG, Tmax (indicative of carbon decomposition for qualitative analysis), and mass loss values (utilized for the quantitative determination of a GR2M’s chemical composition, such as % moisture/solvent, oxygen content, functional groups, carbon, and residues). Building on the insights gained from this parametric study, the optimized TGA conditions were identified and validated through a systematic characterization involving three industry-manufactured types of GR2M powders (FLG, GO, and rGO). A comparative analysis was extended to include other carbon materials such as graphite, activated carbon, carbon nanotubes (CNTs), etc., along with their mixtures as potential carbon impurities in GR2Ms. Furthermore, the validated TGA protocol and conditions underwent an International Laboratory Comparison (ILC) study involving 12 laboratories across five continents which was recently published [16]. This international evaluation aimed to verify the analytical performance of the optimized TGA method, with insights and suggestions to improve the method required for its incorporation into a new ISO standard for the characterization of the chemical properties of GR2Ms [16].

2. Materials and Methods

Materials and sample preparation: FLG was used for most experiments as model graphene powder was donated from a graphene manufacturer. Other types of GR2Ms, such as GO and rGO, in the form of powder samples were also sourced by donation from graphene manufacturers.
Characterizations: The morphology, structural characteristics, and chemical composition of the GR2Ms used in this study were characterized using series of characterization methods including SEM (Quanta 450 FEG, FEI, USA), TEM (TEM, Philips CM200, Japan at 200 kV; FEI Tecnai G2 Spirit at 120 kV), AFM (AFM NT-MDT Ntegra Solaris, Russia, Raman spectroscopy (LabRAM HR Evolution, Horiba Jvon Yvon Technology, Japan), Fourier-transform infrared (FTIR, Nicolet 6700, Thermo Fisher) spectroscopy, X-ray powder diffraction (XRD, 600 Miniflex, Rigaku, Japan), X-ray photoelectron spectroscopy (XPS, AXIS Ultra DLD, Kratos, UK), and particle size distribution (PSD) by dynamic light scattering (DLS, Malvern Zetasizer Nanoseries, Malvern Instruments, Australia), with details presented in the Supplementary Materials.
TGA measurements: TGAs of the GR2M samples under different TGA conditions and parameters, including sample mass (2.0–47.5 mg), heating rate (5–100 °C/min), and heating atmosphere (N2, air, and O2), were conducted using a Mettler Toledo TGA/DSC 2 instrument. Comparative TGA measurements were performed using two other types of TGA instruments (Q500, TA instruments, USA, and Netzsch-STA 449 F5). The initial conditions used during the parametric study were as follows: a sample mass of 5.0 mg, pressure-free loading, an open crucible, a heating rate of 10 °C/min, an air atmosphere (a N2/O2 gas mixture), and a sample gas flow rate of 60 mL/min and nitrogen (20 mL/min) as the balance gas. The results obtained from the TGA measurements were represented as TG/DTG graphs and Tmax values, which were used as key parameters to explore the impact of experimental conditions. In addition, the influence of experimental conditions on the TGA results presenting quantitative measurements (mass % C) were also performed. More details about the TGA data stepwise analysis are provided in the Supplementary Materials.
Influence of sample mass and sample loading: Different sample masses (2.0–47.5 mg) of FLG powder were weighed using the internal balance of a TGA instrument (Mettler Toledo TGA/DSC 2) by either loosely or tightly packing the sample in an open 70 µL alumina (Al2O3) crucible before it was placed into the furnace of the TGA instrument. The samples were heated at a heating rate of 10 °C/min, using air (60 mL/min) as the sample gas and nitrogen (20 mL/min) as the balance gas up to 1000 °C.
Influence of crucible type: About 5.0 mg of FLG powder was weighed using the internal balance of a TGA instrument (Mettler Toledo TGA/DSC 2) and loosely packed in either an open or closed 70 µL alumina (Al2O3) crucible before it was placed into the furnace of the TGA instrument. The samples were heated at heating rates of 5–20 °C/min, using air as a sample gas up to 1000 °C. A measurement was also performed using a 5.0 mg sample in a different type of 70 µL crucible (alumina vs. platinum) at a heating rate of 5 °C/min with an open crucible, using air (60 mL/min) as the sample gas and nitrogen (20 mL/min) as the balance gas up to 1000 °C.
Influence of heating rates: About 5.0 mg of FLG powder was weighed using the internal balance of a TGA instrument (Mettler Toledo TGA/DSC 2) and loosely packed in a closed 70 µL alumina (Al2O3) crucible before it was placed into the furnace of the TGA instrument. The same procedure was repeated by heating the sample at heating rates of 5–100 °C/min, using air (60 mL/min) as the sample gas and nitrogen (20 mL/min) as the balance gas up to 1000 °C.
Influence of heating environment and flow rate: About 5.0 mg of FLG powder was weighed using the internal balance of a TGA instrument loosely packed in a closed 70 µL alumina crucible before it was placed into the furnace of the TGA instrument. The samples were heated at a heating rate of 10 °C/min using air and O2 gas (0–75%) as sample gases at different flow rates (0–100 mL/min) and nitrogen (20 mL/min) as the balance gas, unless otherwise stated.
Influence of TGA instrument design: Samples of about 5.0 mg of FLG powder were weighed using the internal balance of a TGA instrument and loosely packed in an open 70 µL alumina crucible before they were placed into the furnaces of different TGA instruments (Mettler Toledo TGA/DSC 2; Q500, TA instruments, USA, and Netzsch-STA 449 F5). The samples were heated at a heating rate of 5 °C/min using air as the sample gas at 60 mL/min and nitrogen (20 mL/min) as the balance gas.

3. Results and Discussion

Selected results for the GR2M powder samples used for the optimization (FLG) and validation studies (GO, rGO, and FLG) showing the physical, structural, composition, and chemical characteristics determined by benchmark characterization methods including SEM, TEM, XPS, AFM, Raman spectroscopy, FTIR spectroscopy, XRD, and PSD-DLS are presented in in Figure S1 and Table S1 (for FLG only). These results confirm that the samples have the expected properties of GR2Ms reported in the literature and our previous work. [13,16,17]

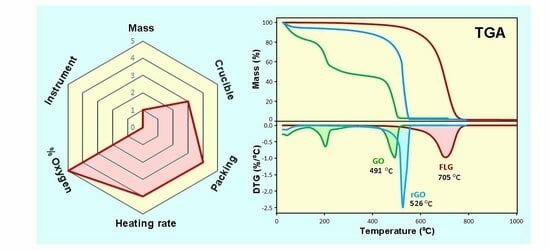
3.1. Optimizing TGA Experimental Conditions for the Characterization of GR2Ms

3.1.1. The Influence of the Mass and Method of Packing the GR2M Sample in the Crucible

The aim of this investigation was to evaluate the influence of the mass and method of packing graphene powder samples on TGA measurements of GR2Ms, with a specific focus on exploring the effect of heat/gas transfer, and their influence on TG/DTG graphs and Tmax values to identify optimized conditions for TGA measurements to prevent inconsistency. The mass and method of packing (loose or dense packing) FLG samples in the TGA crucible are expected to affect heat and air transfer through samples with different masses and densities, impacting their oxidative thermal decomposition. To explore the influence of sample mass, different masses of FLG samples (2.6–9.3 mg) were packed with different levels of mechanical pressing into the same crucible (alumina, 70 uL). A common practice of TGA operators is to freely load powder samples into the crucible (without pressing), but some operators practice pressing loaded samples into the crucible, which could be a source of inconsistency in TGA results.
In the first set of experiments, the effect of the FLG sample mass was investigated; four different masses from 2.6 to 9.3 mg were used and freely loaded inside an open alumina crucible to form a loosely packed powder. It is noteworthy to mention that the maximum loading of an FLG sample by this method in the 70 µL alumina crucible is 9.3 mg. For this experiment, the common conditions (a heating rate of 10 °C/min and an air environment) were used.
Figure 1a displays a set of TG/DTG graphs depicting the results obtained using FLG samples of varying masses. These TG/DTG graphs indicate that the highest mass loss occurred between 660 and 730 °C with Tmax peak values of 702–714 °C for all characterized samples. The TG plots of the loosely packed graphene samples (without pressing) appear to have similar mass loss patterns, without any significant differences observed for different masses. Meanwhile, no obvious trend was detected in their Tmax values ranging from 702 to 714 °C (SD = 7.9 °C) when the graphene sample mass was varied from 2.6 to 9.3 mg, suggesting that without pressing, the operational sample mass can be varied from 2.6 to 9.3 mg. However, it is recommended to keep all sample masses constant during TGA measurements, especially when a Tmax value is used as an analytical parameter. The consistency in mass loss behavior and the insensitivity of Tmax values to variations in sample mass can be explained by the high porosity of graphene, facilitating the unimpeded movement of air within loosely arranged particles.
In the second experiment, the effect of the method of packing the FLG samples in the crucible was investigated to show the difference between loosely packed FLG powder samples (freely loaded; no pressure) and samples pressed with mechanical force to fully fit the sample into the same volume of crucible. The FLG samples, in all cases, fully filled the crucible to the same volume of 70 µL, but the graphene powders had different masses, 9.3 mg (no pressure), 31.6 mg (strong pressure), and 47.5 mg (very strong pressure), and accordingly, they had different packing densities. These conditions were selected based on the common practice of TGA operators to pack the sample inside the crucible with an applied force that can vary from person to person. The results presented in Figure 1c and Figure S2 and Table S2 show significant differences in the TG-DTG graphs between freely loaded and pressed samples. These differences were observed in Tmax values and DTG graphs, showing the considerable impact of pressed samples on the shape of the DTG peaks.
When the sample was densely packed in the crucible at a higher mass (>30 mg), distorted DTG graphs with broad Tmax peaks at higher values were observed, indicating inaccurate TG measurements. This effect can be attributed to thermal lag, which refers to the temperature delay in the sample and relative to the surrounding environment due to the heat transfer limitation of the larger-mass pressed samples (31.6 and 47.5 mg) compared to the loosely packed powder sample at 9.3 mg. This experiment clearly demonstrates how critical it is to optimize the sample loading method, which is performed differently by TGA operators, as it could cause inconsistent and erratic TGA results in the case of highly pressed samples. The following summary and recommendations can be made from these results:
  • A mass of graphene sample in the range of 2.6–9.3 mg that is freely packed with the same packing density does not cause a significant difference in the TGA results. However, a mass of 5.0 mg with free loading is recommended (applied for a 70 uL crucible) to allow good heat transfer and maintain the consistency of TGA measurements (the exemptions are graphene samples which are ultra-light, fluffy, and highly porous and for which a lower mass ( around 2–3 mg) is sufficient to fully fill a 70 µL crucible using the free-loading method).
  • The results show that the packing method has a substantial influence on TGA results, especially when a higher mass is used. It is recommended to freely load (loosely pack) graphene powder in the crucible without pressing to prevent thermal lag (or to allow efficient heat transfer).

3.1.2. The Influence of Open and Closed Crucibles

The aim of this investigation was to evaluate the influence of open and closed crucibles on TGA measurements of GR2Ms as a potential source of inconsistency. These two different conditions are expected to have influence on TGA measurements because of their significant influence on heat transfer and air flow, impacting oxidative decomposition. The use of open crucibles is the most common practice by TGA operators, but it may be practically problematic in the case of very light and “fluffy” graphene powders that could escape from the crucible during measurement and cause errors. Graphene powder, when freely loaded (e.g., ~10 mg), can fully fill the crucible; depending on the volume of the crucible, this carries the risk of some graphene materials creeping or splashing out of the crucible during measurement, which will cause incorrect mass loss measurements. A closed crucible without a hole is considered unsuitable because a fully closed crucible significantly impacts heat transfer and air flow, changing the conditions for the oxidative decomposition of the sample. For these reasons, a crucible covered with a pierced lid (with a hole in the middle) is explored in this experiment in comparison with an open crucible (without a lid) to determine their influence on TGA results. Due to the expected influence of heat transfer, this experiment investigated the use of three different heating rates (5 °C/min, 10 °C/min, and 20 °C/min). The heating rate is an important factor to consider because the type of crucible used (with or without a lid) will significantly influence the impact of the heat transfer and thermal decomposition of a sample on the obtained TGA results.
The results obtained using freely loaded FLG samples (5.0 mg) in an open crucible (without a lid) and a closed crucible (with a pierced lid) at different heating rates (from 5 °C/min to 20 °C/min) are presented in Figure 2a,b. Significant differences in TG/DTG graphs and Tmax values were observed between the open and closed crucibles, showing the importance of optimizing this condition for the TGA characterization of GR2Ms. An insignificant difference (standard deviation, SD, of Tmax = 2 °C) was observed at a lower heating rate (5 °C/min), but the difference became more apparent at higher heating rates of 10 °C/min (SD of Tmax = 17 °C) and 20 °C/min (SD of Tmax = 26 °C) when crucibles with a pierced lid (with a hole) and without a lid were studied. Figure 3b summarizes the changes in Tmax values with the heating rate (5–20 °C/min), showing a significant difference between the open and closed crucibles at higher heating rates, as evidenced by the SDs of the Tmax values. These differences can be explained by the limitation of the heat/gas transfer in which the lid is acting as a physical barrier, delaying the oxidative combustion of graphene that shifts the Tmax to higher values.
To avoid the potential loss of a graphene sample during TGA measurements since light graphene powder could escape from the crucible, it is recommended to use a lid with a hole which is able to provide the uniform heat transfer needed for a TGA experiment at a heating rate of 5 °C/min.
The influence of the type of crucible, such as alumina vs. platinum, with the same volume (70 µL) and mass of sample (5.0 mg) at a heating rate of 5 °C/min with an open crucible was also explored, showing no obvious difference on TG/DTG graphs and with a Tmax value with only SD = 0.3 °C recorded (Figure S3). The following summary and recommendations can be made:
  • An optimal condition that will provide the uniform heat transfer needed for a TGA experiment is the use of an open crucible. However, to avoid the potential loss in case of using very light graphene samples from crucibles during TGA measurements, it is recommended to use a lid with a hole to cover the crucible with a heating rate of 5 °C/min or lower.
  • There is an insignificant influence of the type of crucible (alumina vs. platinum) under these conditions, and both types of crucibles can be used with no impact on TGA results.

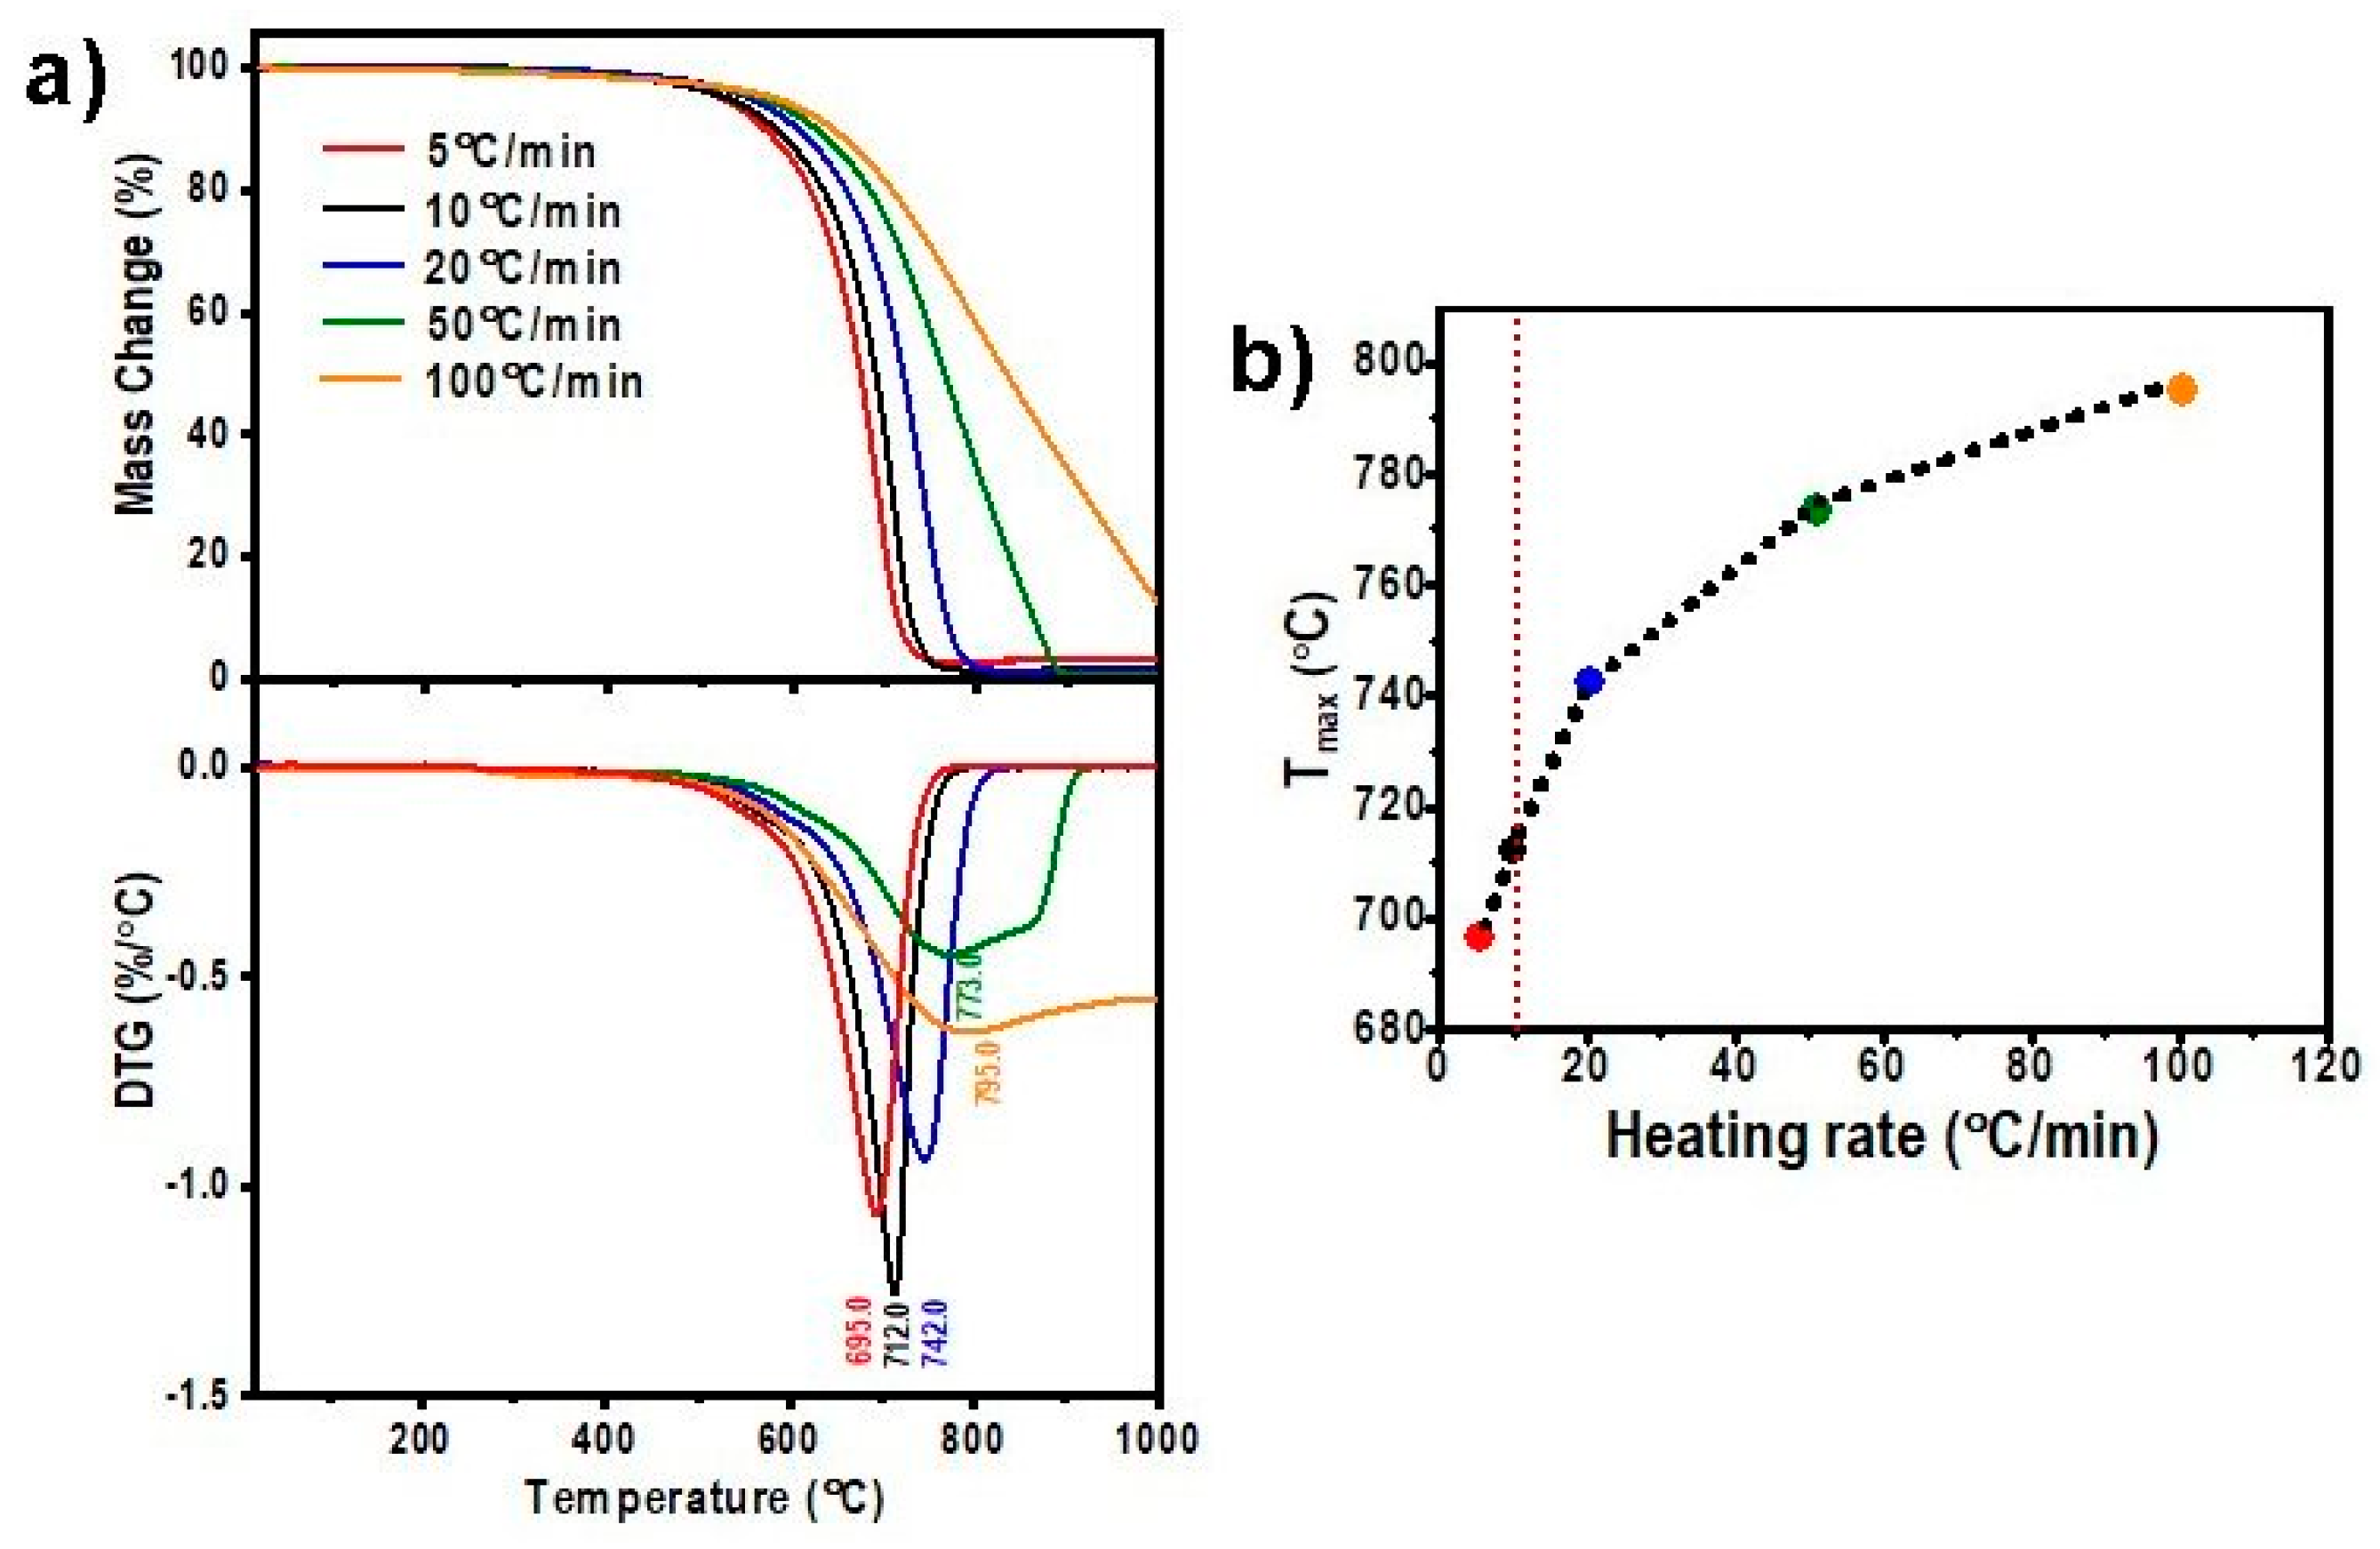
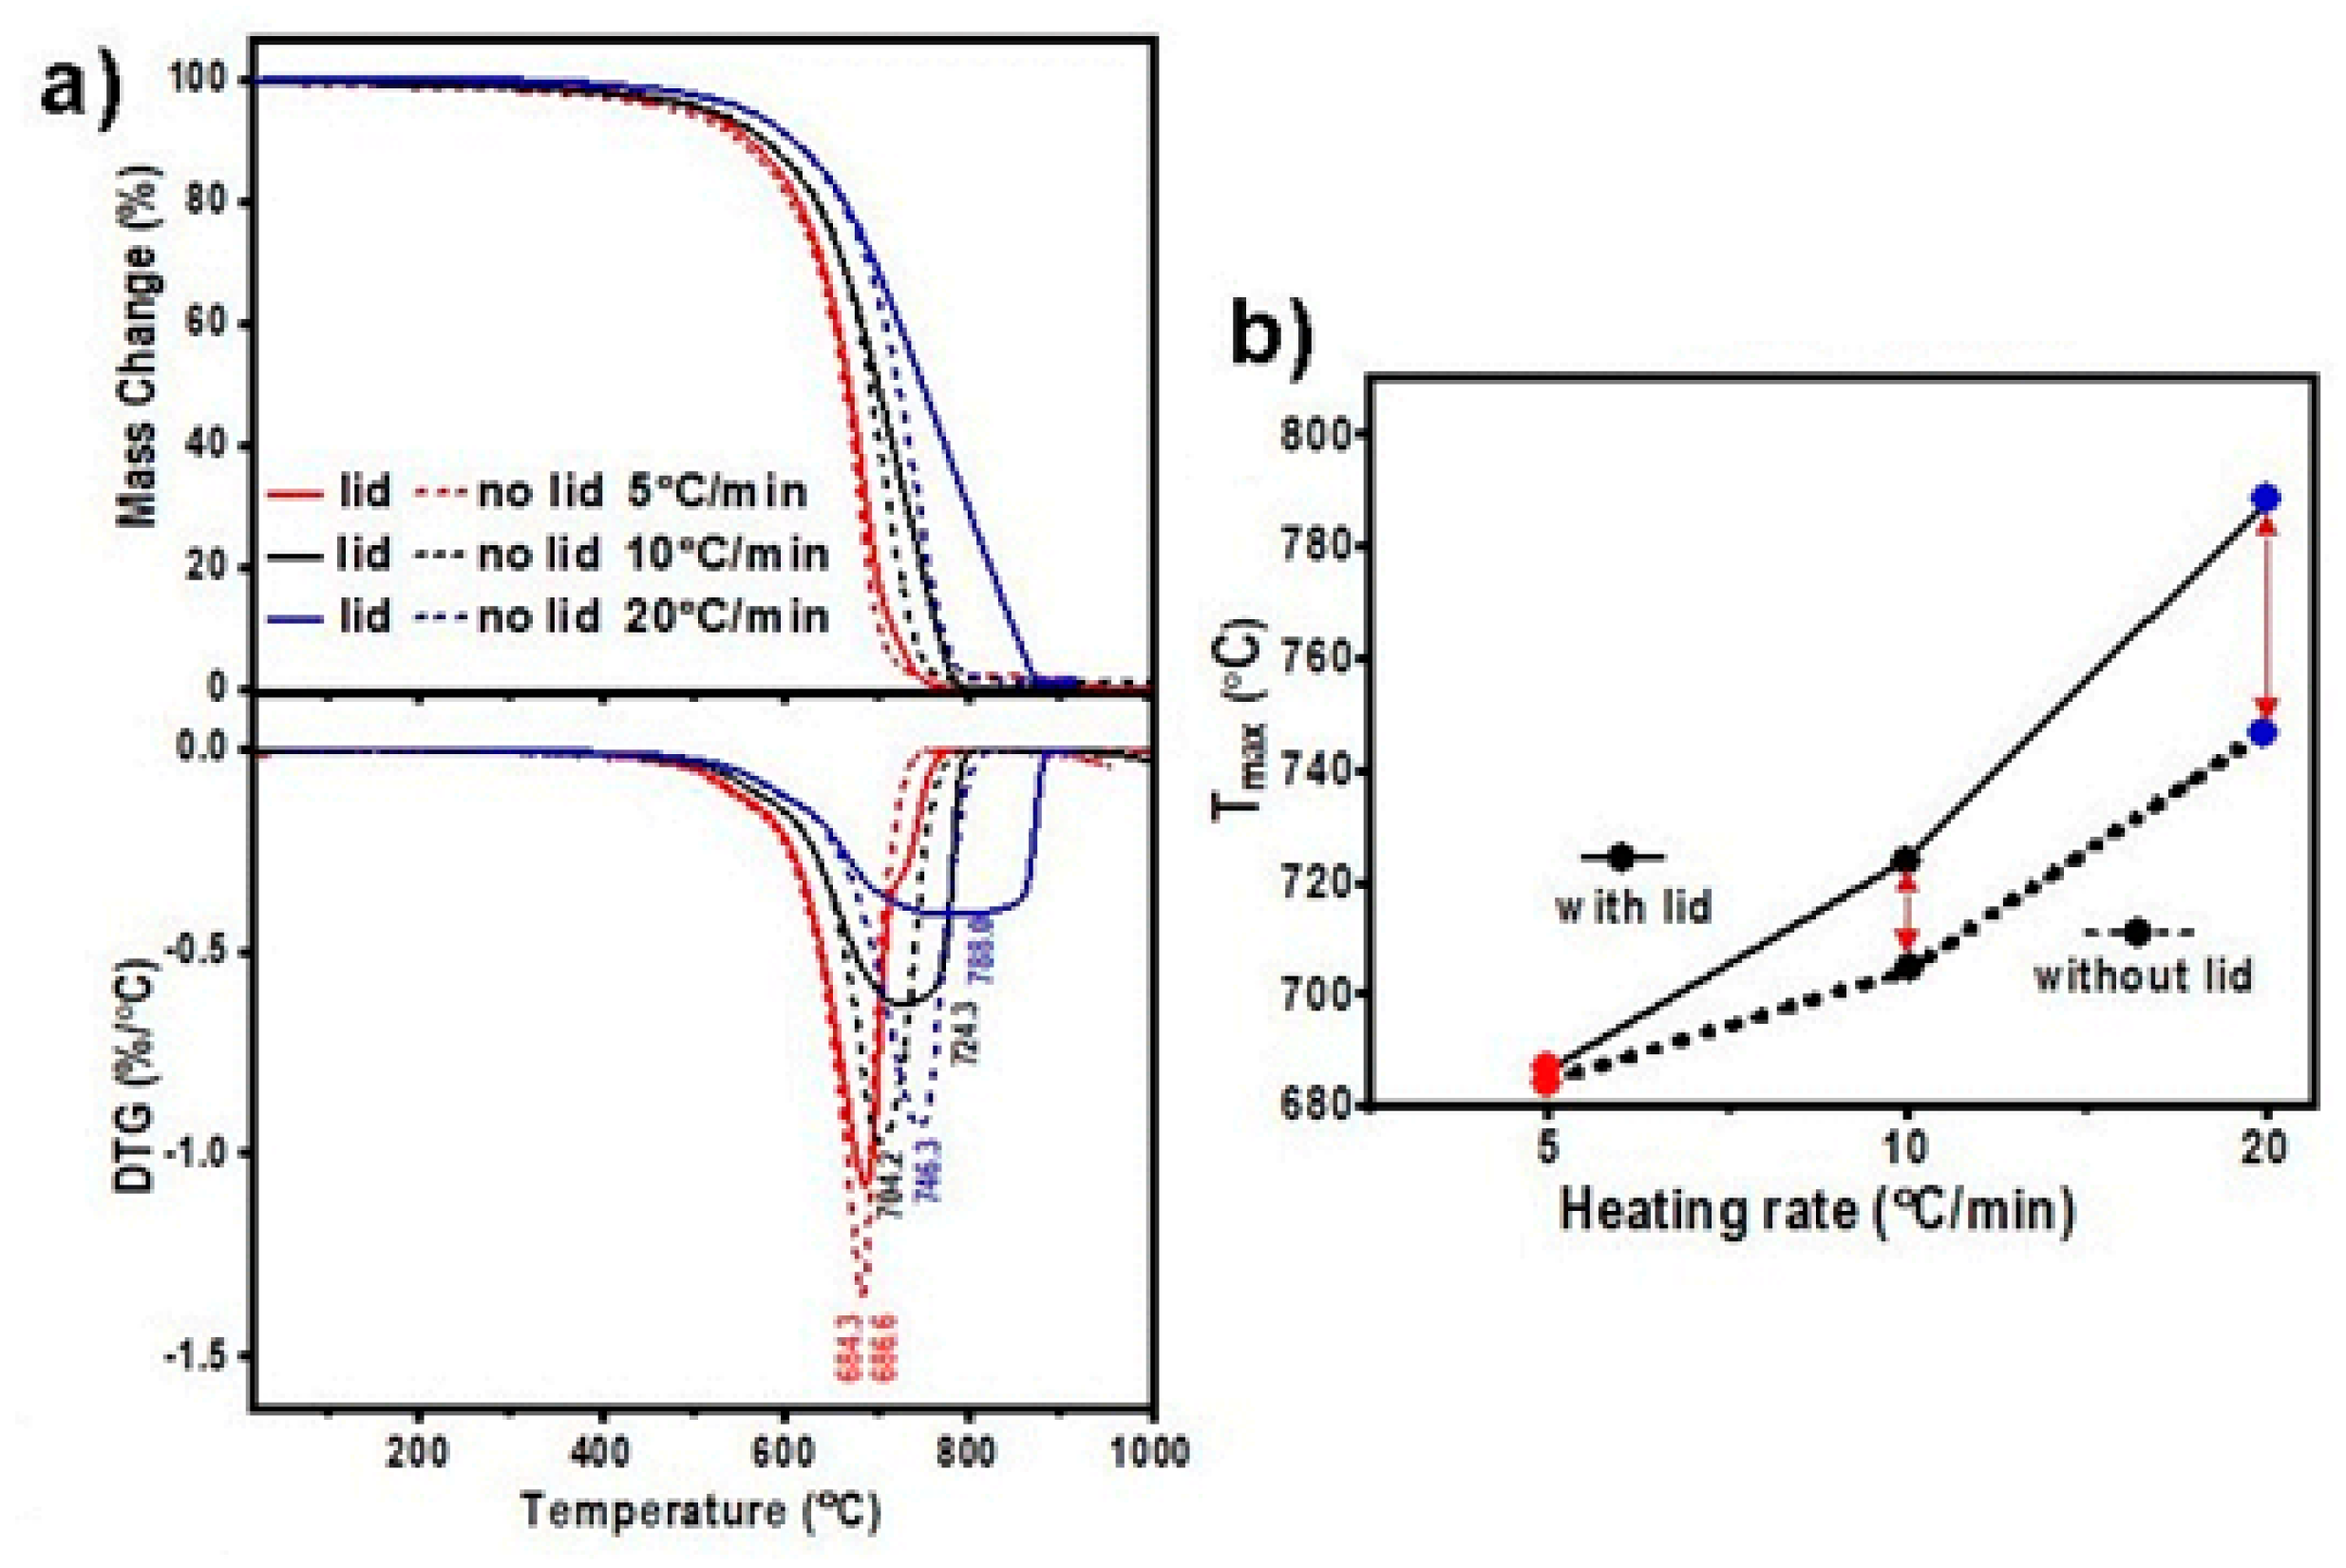
3.1.3. The Influence of the Heating Rate

The aim of this investigation was to explore the influence of heating rates on TG/DTG plots and Tmax values to identify optimized heating rates for reproducible and consistent TGA measurements of GR2Ms. The heating rate in the TGA method is known as one of the most influential parameters that could impact TGA results and needs optimization in new method development [18]. The heating rate (fast or slow) can influence the width of obtained DTG peaks and obtaining resolved peaks of thermally decomposed GR2M components during TGA measurements. Different types of GR2Ms have different thermal properties, which is another reason to optimize heating rate conditions for TGA, enabling TGA characterization for a broad range of GR2Ms. The influence of heating rate on the TGA of FLG used as a model GR2M was explored, using heating rates from 5 °C/min to 100 °C/min and keeping other parameters constant (a mass of 5.0 mg with free loading in an air environment and with an open crucible).
The obtained TG/DTG curves for FLG sample with varied heating rates are summarized in Figure 3a and Table S3. These TG/DTG results showed that increasing the heating rate from 10 °C/min to 100 °C/min has a significant influence on the TGA results, including the shape of the TG/DTG curves and their Tmax values, indicating the need to optimize this parameter.
Figure 3b represents the Tmax value and heating rate dependence that indicates a significant increase in Tmax with an increasing heating rate due to thermal lag and an increased temperature gradient inside the sample. The use of a higher heating rate (>20 °C/min) caused a significant shift in the DTG graph and Tmax to a higher temperature that is not suitable for qualitative analysis. To reduce the thermal gradient within the sample, it is recommended to use low heating rates; however, one drawback of using low heating rates is the increase in the testing time and cost. It is worth noting that this influence is mainly related to DTG graphs and Tmax values, which are thermal and qualitative analytical parameters, but it was found to have less influence on the decomposition mass % of C for TGA measurements below 1000 °C up to a heating rate of 50 °C/min, as illustrated in the TG plots (Figure 3a). To have consistent and comparable TGA measurements of GR2Ms, it is recommended to keep the heating rate parameter constant at optimal values. The following summary and recommendation can be made from these results:
  • The heating rate has a significant influence on TG/DTG graphs and Tmax values, which are significantly increased by increasing the heating rate.
  • The recommended heating rate for TGA of GR2Ms is in the range between 2 °C/min and 10 °C/min and, for consistency, an optimal heating rate of 5 °C/min is recommended. It is not recommended to use a higher heating rate > 20 °C/min that causes a significant widenning of the DTG peaks that might cause hiding to determine the presence of remaining impurities.

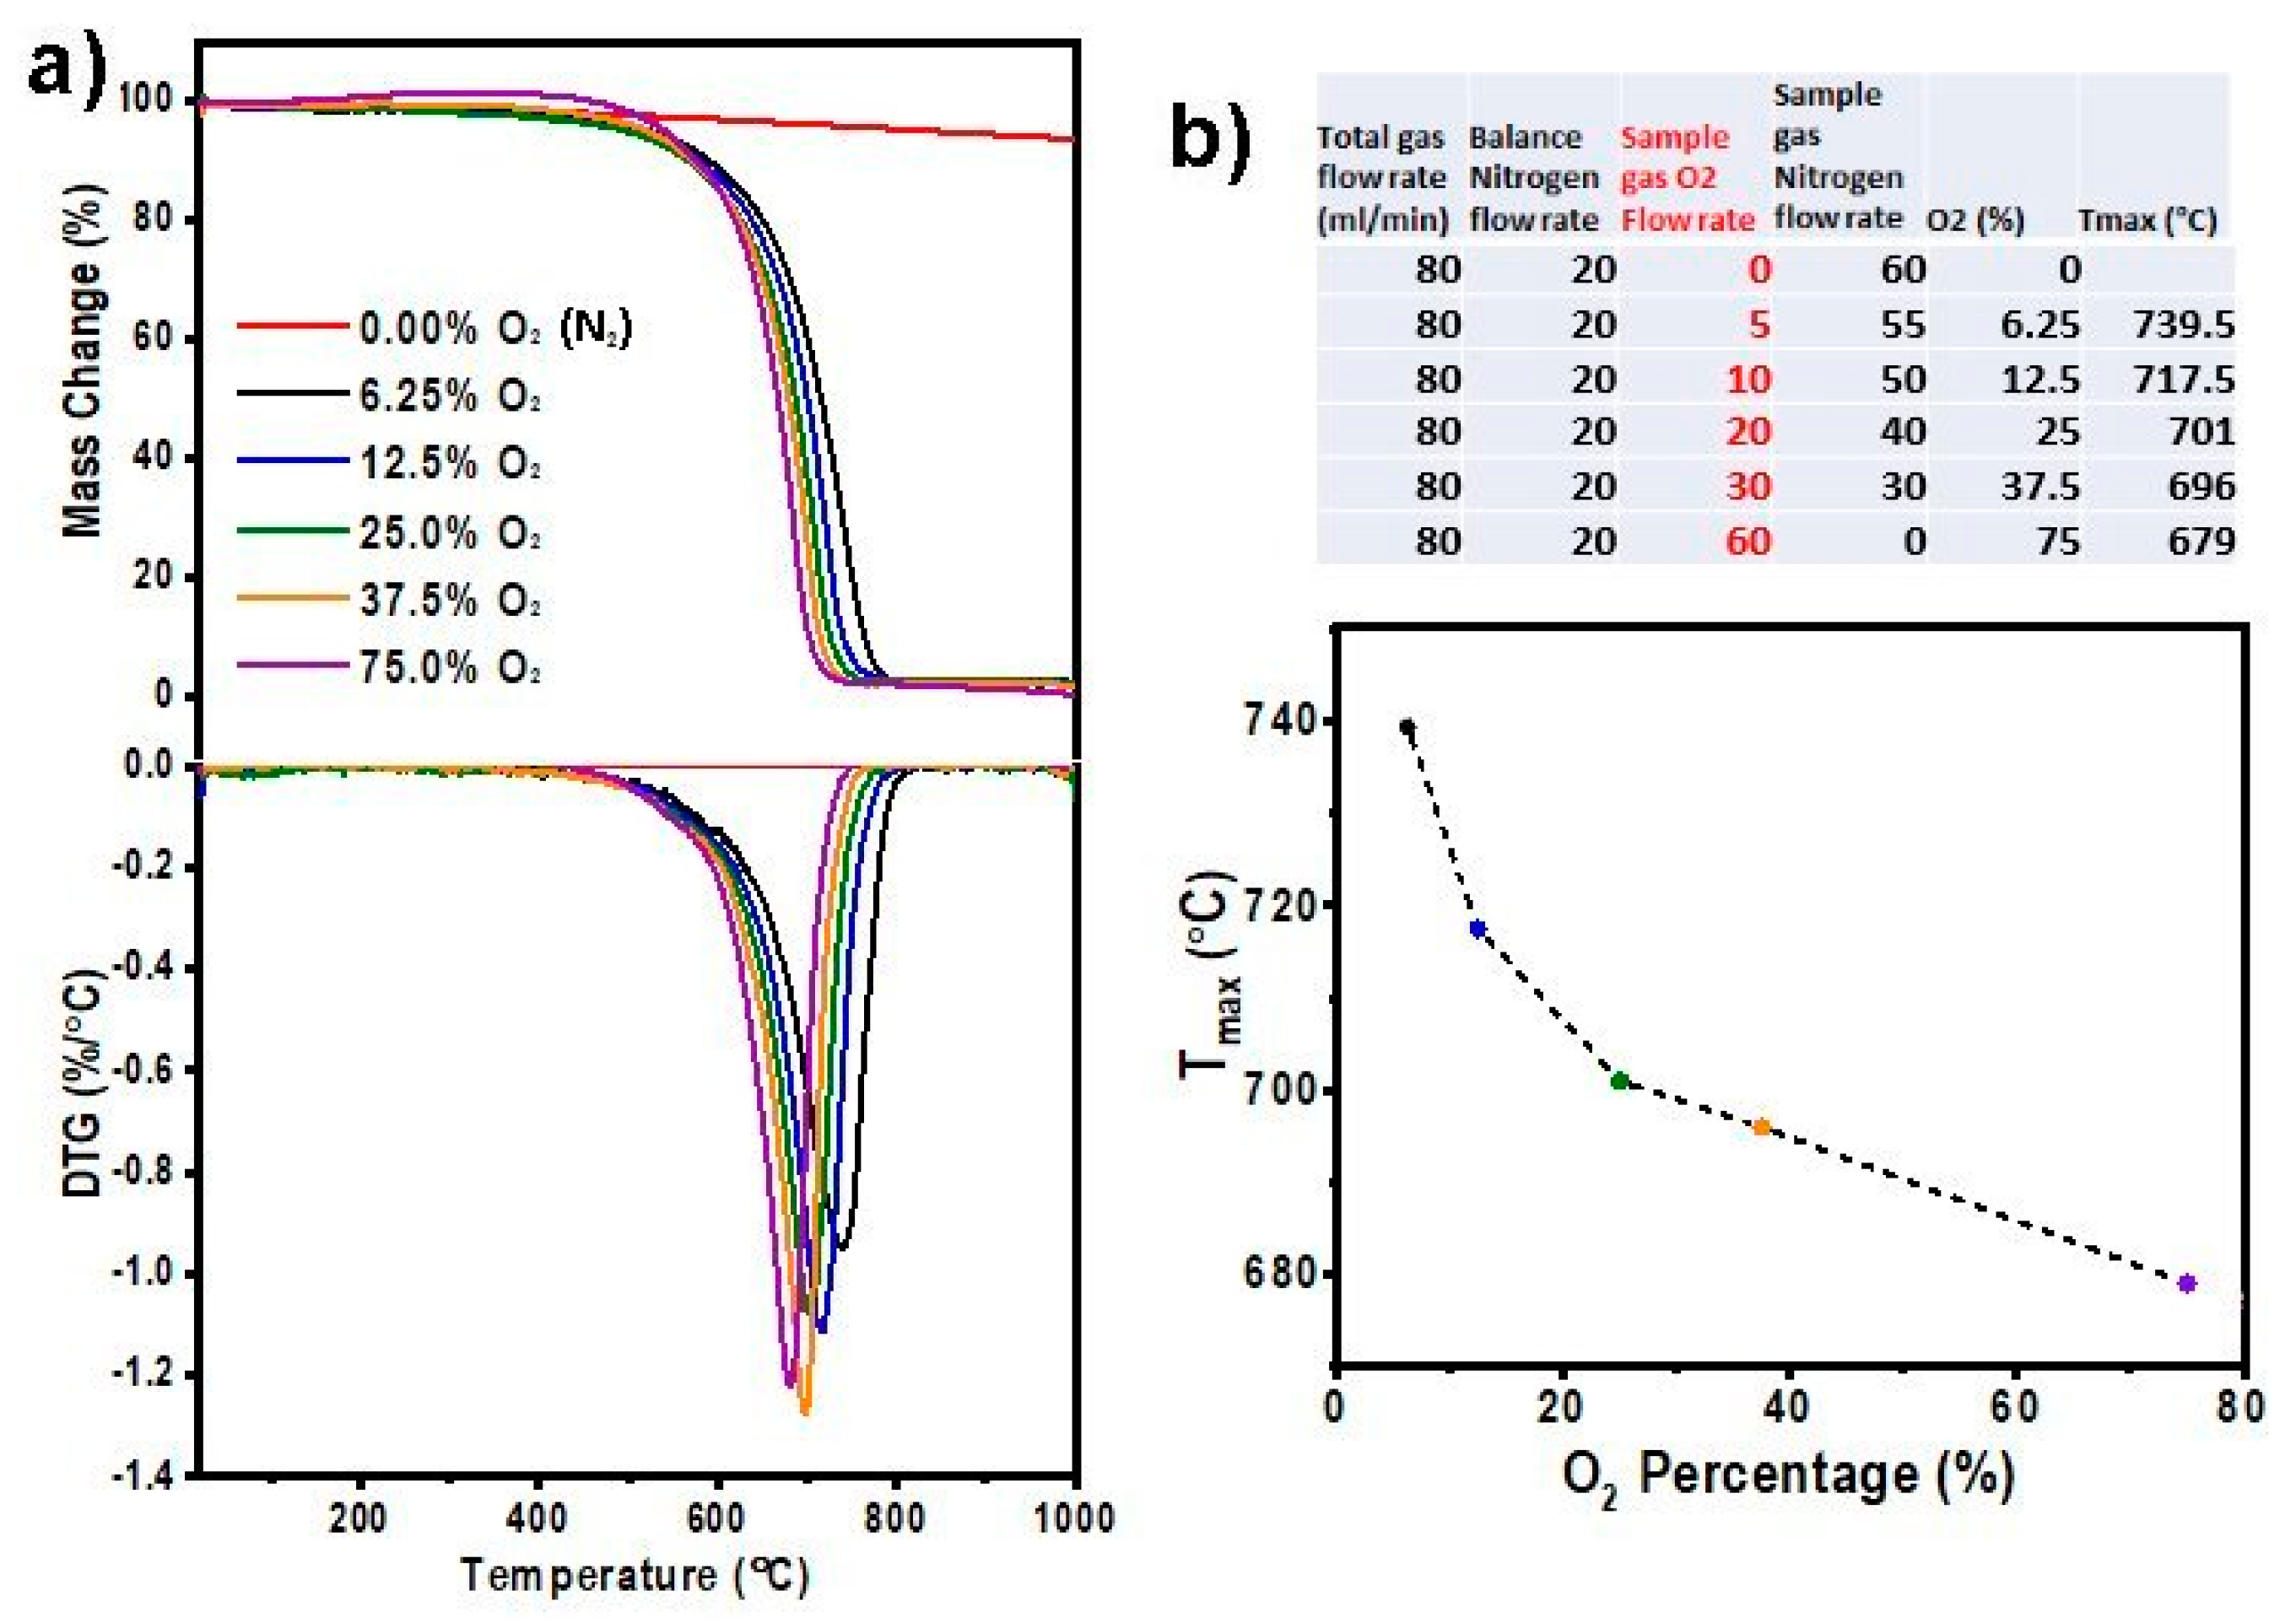
3.1.4. The Influence of the Heating Environment (Air/Oxygen and Nitrogen)

The aim of this part of the study was to determine the influence of the heating environment, air, oxygen and nitrogen, on TGA measurements of GR2Ms. The thermal treatment of materials involving evaporation, oxidation and decomposition is the core of TGA measurements that can be performed under different environmental conditions using different gases, such as nitrogen, air, oxygen, their mixtures, CO2, etc., which are used to obtain valuable information about the thermal properties of a material as well as its chemical composition when the TGA is coupled with other instruments such as FTIR spectrometer and mass spectrometer (MS) [19,20]. For the analytical application of TGA to determine the mass % of components in materials that decompose at different temperatures, oxidative decomposition using air (21% O2 and 78% N2) or a N2/O2 gas mixture is commonly used for TGA measurements. Oxidative decomposition is mainly used for characterization of GR2Ms as their combustion temperatures in range of 500–800 °C can provide resolute DTG peaks separated from other organic components and non-combustible inorganics. In the proposed investigation, gas environment conditions (0% O2 or 100%N2, 6.5% O2, 12.5% O2, 25% O2, 37.5% O2 and 75% O2) were varied while heating FLG samples by changing the ratio of N2/O2 gases in the chamber using a constant total flow rate (80 mL/min), keeping other conditions constant (mass, 5.0 mg; heating rate, 10 °C/min; sample freely loaded in an open crucible).
The obtained results are summarized in Figure 4a,b, showing significant differences in TG/DTG graphs and Tmax values using different gas environments. As was expected at 0% oxygen (100% nitrogen), the graphene materials did not decompose, showing a nearly flat TG curve and no DTG peak, indicating a minor mass change at 1000 °C. After the introduction of a small amount of O% at 6.2% (N2 = 93.75%), the decomposition of the graphene sample occurred at 739.5 °C. By increasing the oxygen concentration to 75% O2 (25% N2), the Tmax value decreased to 679 °C. The decreasing trend in the Tmax values as O2% increased for graphene decomposition is not surprising because at higher oxygen concentrations, more graphene particles are exposed to increasing oxygen molecules, which allows for a faster oxygen combustion rate of graphene in the oxygen-enriched environment and results in sharper DTG peaks. The use of high-purity oxygen can give more consistent results, but air gas also can be used to obtain reasonably consistent results with significantly lower test costs and while avoiding safety concerns associated with having oxygen bottles in the lab. As was expected, the quantitative mass % of carbon determined using these different gas conditions did not change, confirming the minor influence on analytical results of using different gases. The following summary and suggestions can be made from these results:
  • The gas environment during TGA measurements has a significant influence on TG/DTG graphs and their Tmax values, which are significantly decreased by increasing the % of oxygen. Increasing the % of oxygen was found to have a minor influence on the quantitative mass loss determination % of carbon. The gas environment is critical for measurements when Tmax is used as an analytical parameter (a qualitative analysis); therefore, it is important to keep these conditions constant.
  • The recommended gas environment for GR2M characterization is air that can provide adequate oxygen for the oxidative decomposition of GR2Ms for both qualitative and quantitative TGAs and is inexpensive.

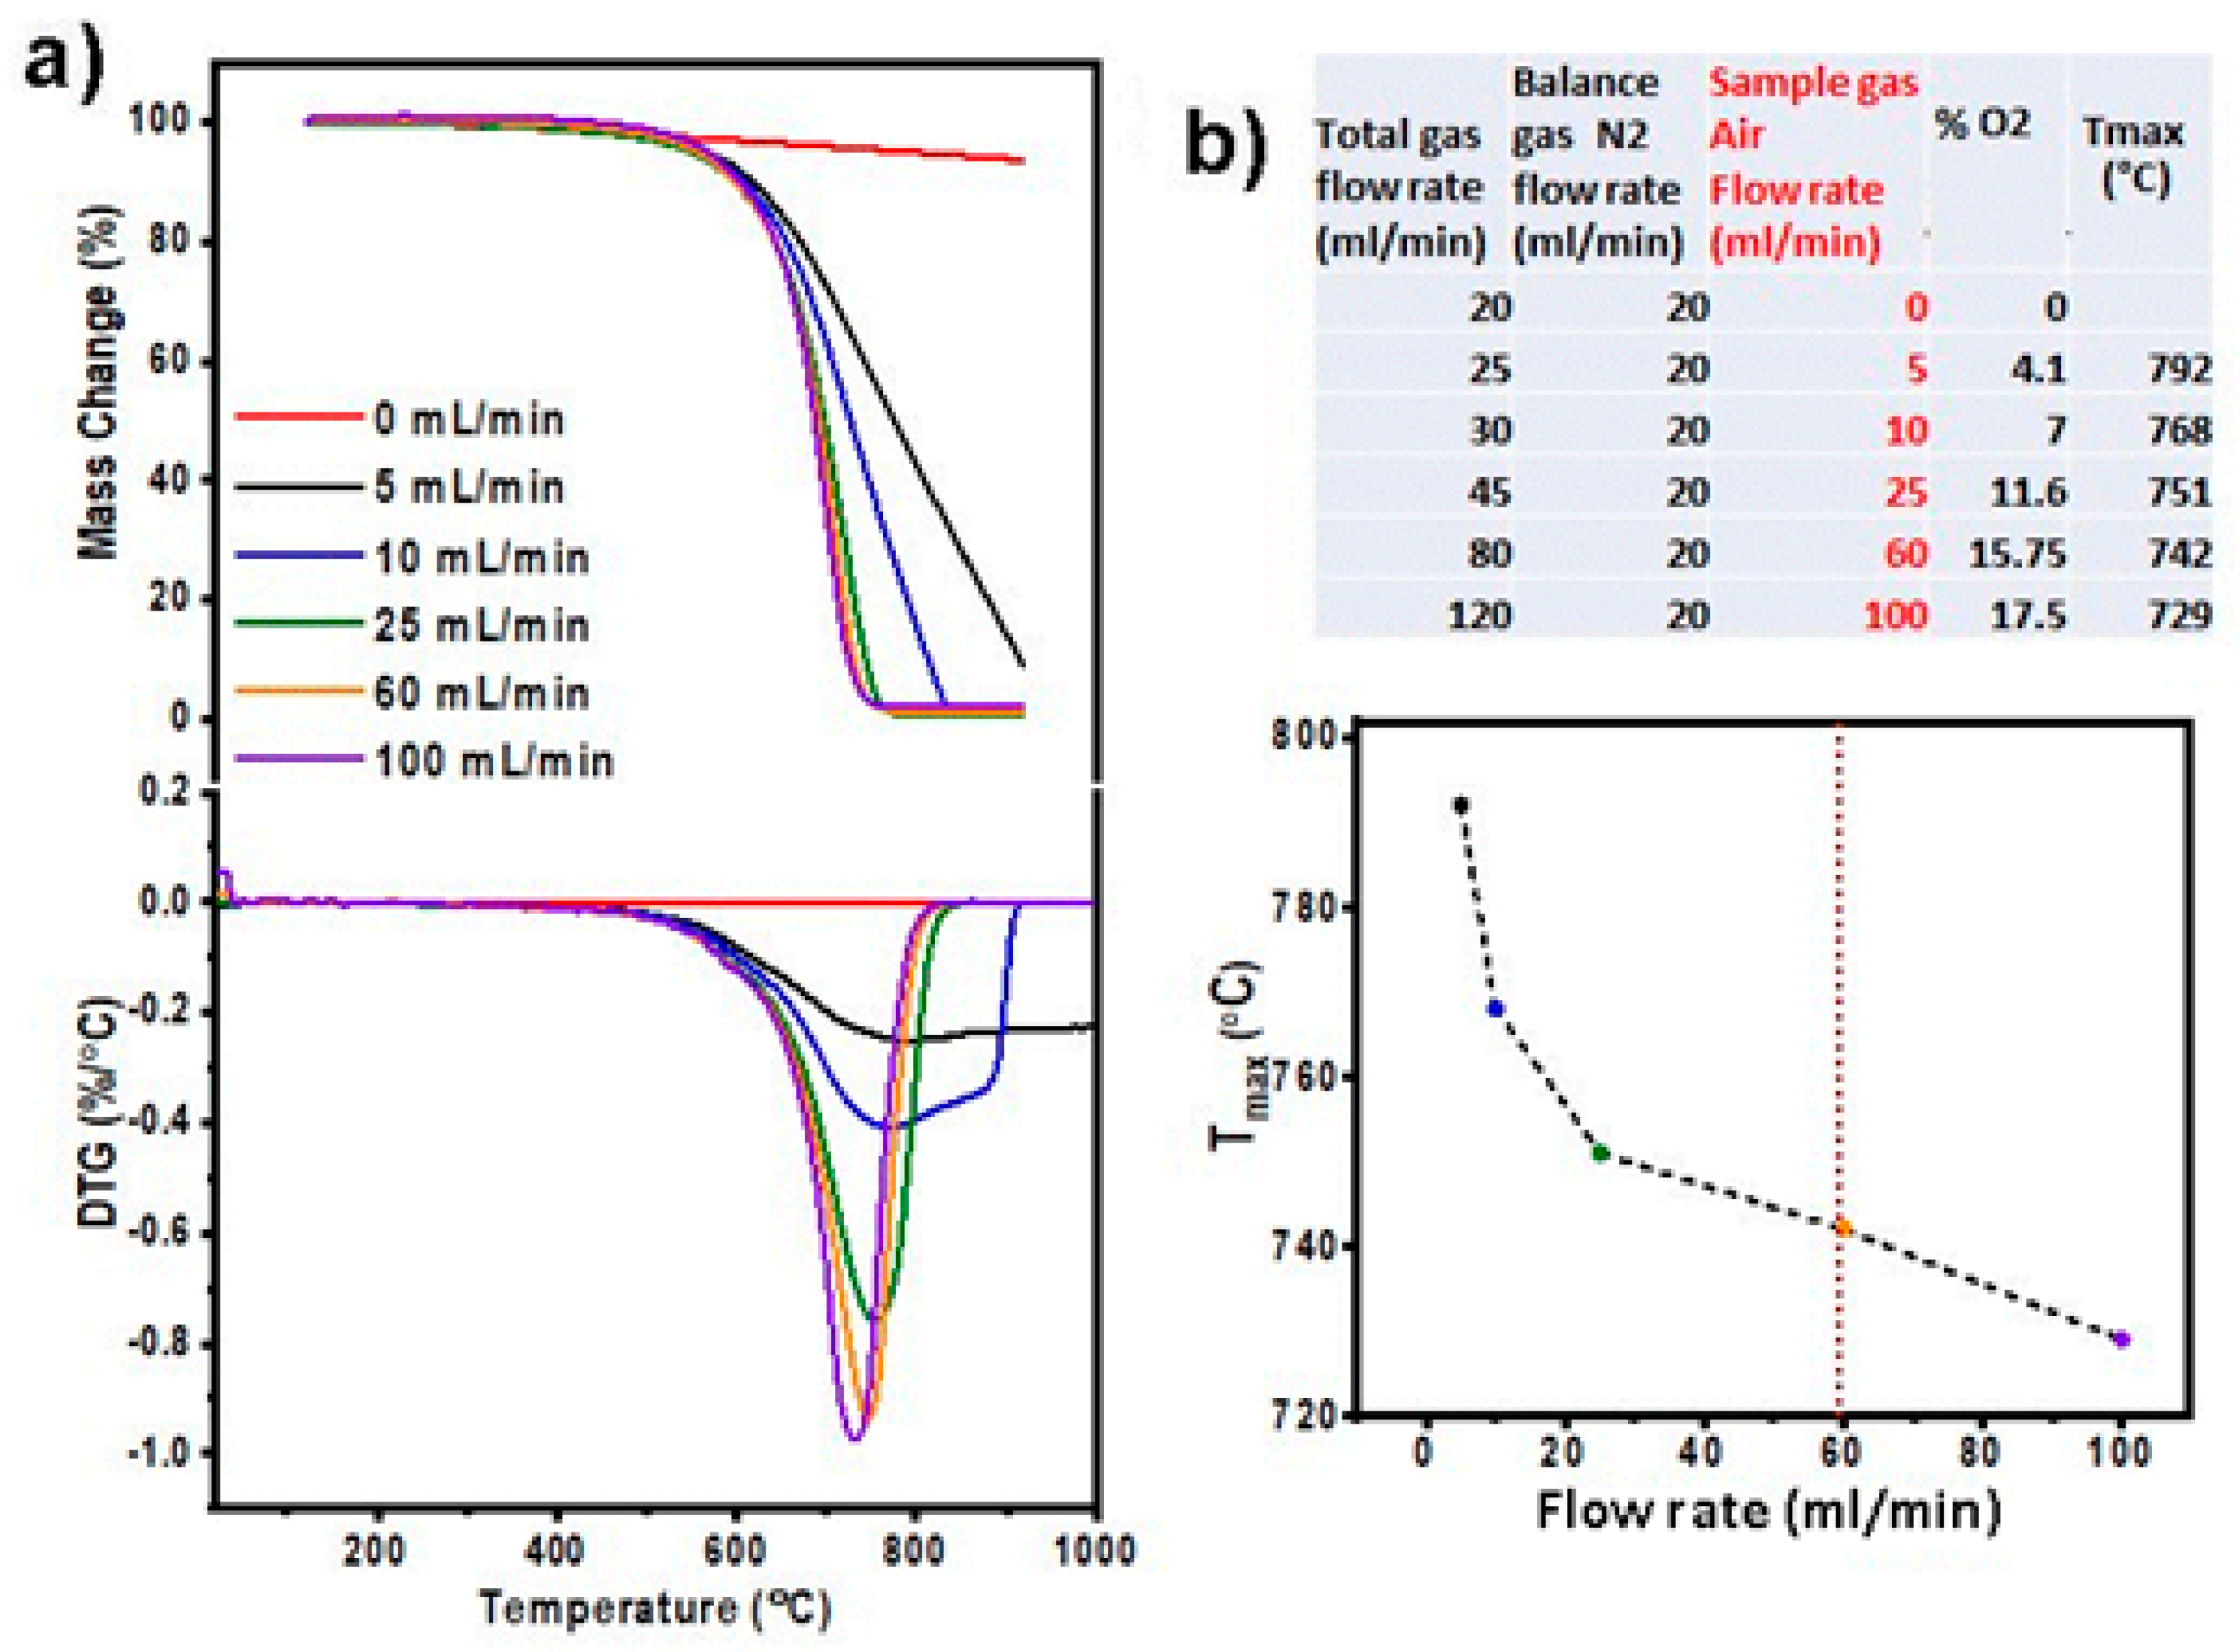
3.1.5. The Influence of the Sample Gas Flow Rate

The aim of this investigation was to explore the influence of the gas flow rate with air/nitrogen mixtures on the TGA of GR2Ms and to optimize these conditions to provide consistent measurements. The gas flow rate over the sample during TGA measurements is one of the important parameters to set at the beginning of TGA measurements. Gas flow can influence the heating environment discussed in the previous section and consequently affect the heat/mass transfer rate and the decomposition of the sample. Therefore, it is critical to optimize and keep the sample flow rate consistent to obtain reproducible TGA measurements. In this experiment, the sample gas flow rate (air) was varied from 0 to 100 mL/min, corresponding to changes in the oxygen concentration from 0 to 17.5% and keeping other conditions constant (a sample mass of 5.0 mg freely loaded in a closed crucible with a hole, a heating rate of 5 °C/min, and a constant nitrogen gas balance flow).
The obtained TGA results using FLG samples under these conditions are summarized in Figure 5a,b, showing differences in TG/DTG graphs and Tmax values using different sample gas flows. At a 0 mL/min sample gas flow or 100% N2 balance gas flow, no decomposition peak was observed because it was a 0% O2 atmosphere. By increasing the sample gas flow rate (5–10 mL/min), delayed FLG decomposition with a broad DTG peak was detected below 1000 °C. Under this condition, it was not possible to generate a sharp DTG peak with a reliable Tmax value, suggesting that these flow rates are not suitable for the thermal decomposition of GR2Ms. At further increased sample gas flow rates (25–100 mL/min), sharp DTG graphs with slight decreasing Tmax values when the sample gas flow rate increased were observed, indicating that this range is suitable for TGA measurements (Figure 5b). It is worth noting that not only was the flow rate of the sample gas changed but the overall calculated O2 concentration was also varied due to the introduction of a balance gas with a constant flow at different sample gas flow rates in these experiments. To avoid the potential influence of oxygen concentration, we performed additional control experiments using a constant flow of nitrogen gas as the balance gas at 20 mL/min and a mixture of O2 gas and N2 gas as a sample gas (instead of air) at (1) 10 mL/min O2 gas in 0 mL/min N2 and (2) at 60 mL/min O2 gas in 100 mL/min N2, which gave rise to the same final ratio of oxygen (33%).
The results of this experiment presented in Figure S4 show that the Tmax of the first (700.3 °C) and second (694.9 °C) control experiments showed a slight shift in the Tmax to lower temperatures with an increasing total gas flow rate due to better gas exchange. However, only a small shift in the SD (3.8 °C) was recorded despite the fact that a large difference in the total gas flow rate was used (30 mL/min for the first and 180 mL/min for the second) in these two control experiments. These experiments clearly imply that the O2 concentration is a more dominant factor than the gas flow rate in the Tmax of FLG. These results suggest that a gas flow rate in the range of 25–100 mL/min (SD = 6 °C) can be considered reliable for TGA measurements with oxygen concentrations of 11.6–15.75% to allow for the oxidative decomposition of GR2Ms and show no difference in the quantitative determination of the mass % of C. However, a sample gas flow rate of 60 mL/min with 20 mL/min of N2 balance gas (total 80 mL/min), providing 15.75% oxygen, is regarded as an optimal condition because the use of a higher gas flow rate achieves a better mass–gas exchange. The following summary and recommendation can be made from these results:
  • The sample gas flow rate has an influence on TG/DTG graphs and Tmax values that needs to be optimized. This impact is significant, especially at low sample gas flow rates of 0–10 mL/min, which are practically not suitable. Applicable sample gas flow rates for the TGA of GR2Ms are between 25 and 100 mL/min with minor changes in quantitative TGA measurements (mass % C).
  • A gas flow rate of 60 mL/min with an air atmosphere is recommended as an optimal condition that will be within the range of most TGA devices and can provide consistent results for both qualitative and quantitative TGAs.

3.1.6. The Influence of TGA Instrument Design (Furnace and Thermobalance)

In the final set of investigations, the influence of different designs of TGA instruments and their furnaces and balances on TGA measurements was explored, using the same TGA conditions, as a potential source of variation in TGA measurements of GR2Ms. For this study, three TGA instruments with different instrument designs and orientations were used, including a horizontal furnace/thermobalance with a side-loading design (Mettler-Toledo) and vertical furnaces/thermobalances with bottom-loading (TA instrument) and top-loading (Netzsch) designs. For these measurements, we kept the same conditions using an FLG sample, a 5.0 mg mass, free loading, an open crucible, a heating rate of 5 °C/min, and an air atmosphere (sample gas flowing at 60 mL/min by a purged gas, N2, at 20 mL/min). Comparative TG/DTG graphs are presented in Figure S5 and Table S5, showing insignificant difference in the TG/DTG graphs and Tmax values. This confirms that there is an insignificant influence of TGA instrument design and type of balance when adopting the optimized TGA measurement conditions for GR2Ms. The following summary and recommendation can be made from these results:
  • These results confirm that there is an insignificant influence of TGA instrument design on TGA results when using the same experimental conditions.
These experimental conditions were optimized based on TG/DTG graphs and Tmax values, which can be used as analytical parameters for the qualitative analysis of GR2Ms and summarized in Table 1. However, these TGA results can also be used for quantitative analysis (mass %) by further processing these results. Therefore, it is important to harmonize the data-processing protocols for obtained TG graphs, which could have a significant influence on the quantitative analysis of the mass % determination of GR2M components such as moisture, oxygen-containing functional groups, organic impurities, graphenic carbon, non-graphenic carbon, and non-combustible inorganic impurities. The processing of TGA data to obtain these quantitative values is usually performed using instrument software or manually where different approaches can be used, causing some variations influenced by the subjectivity of operators. To avoid this source of variation, we used a more reliable TGA-data-processing protocol for quantitative determination (Figure S6). Parameters such as temperature limits (Ti and Tf) obtained from DTG and second derivative thermogravimetry (d2TG) graphs were introduced to provide reliable determinants and accurately correlate with the mass change step from the TG curves regardless of operators. This data processing method is provided in the Supplementary Materials and will allow for a more consistent quantitative determination of GR2M components.

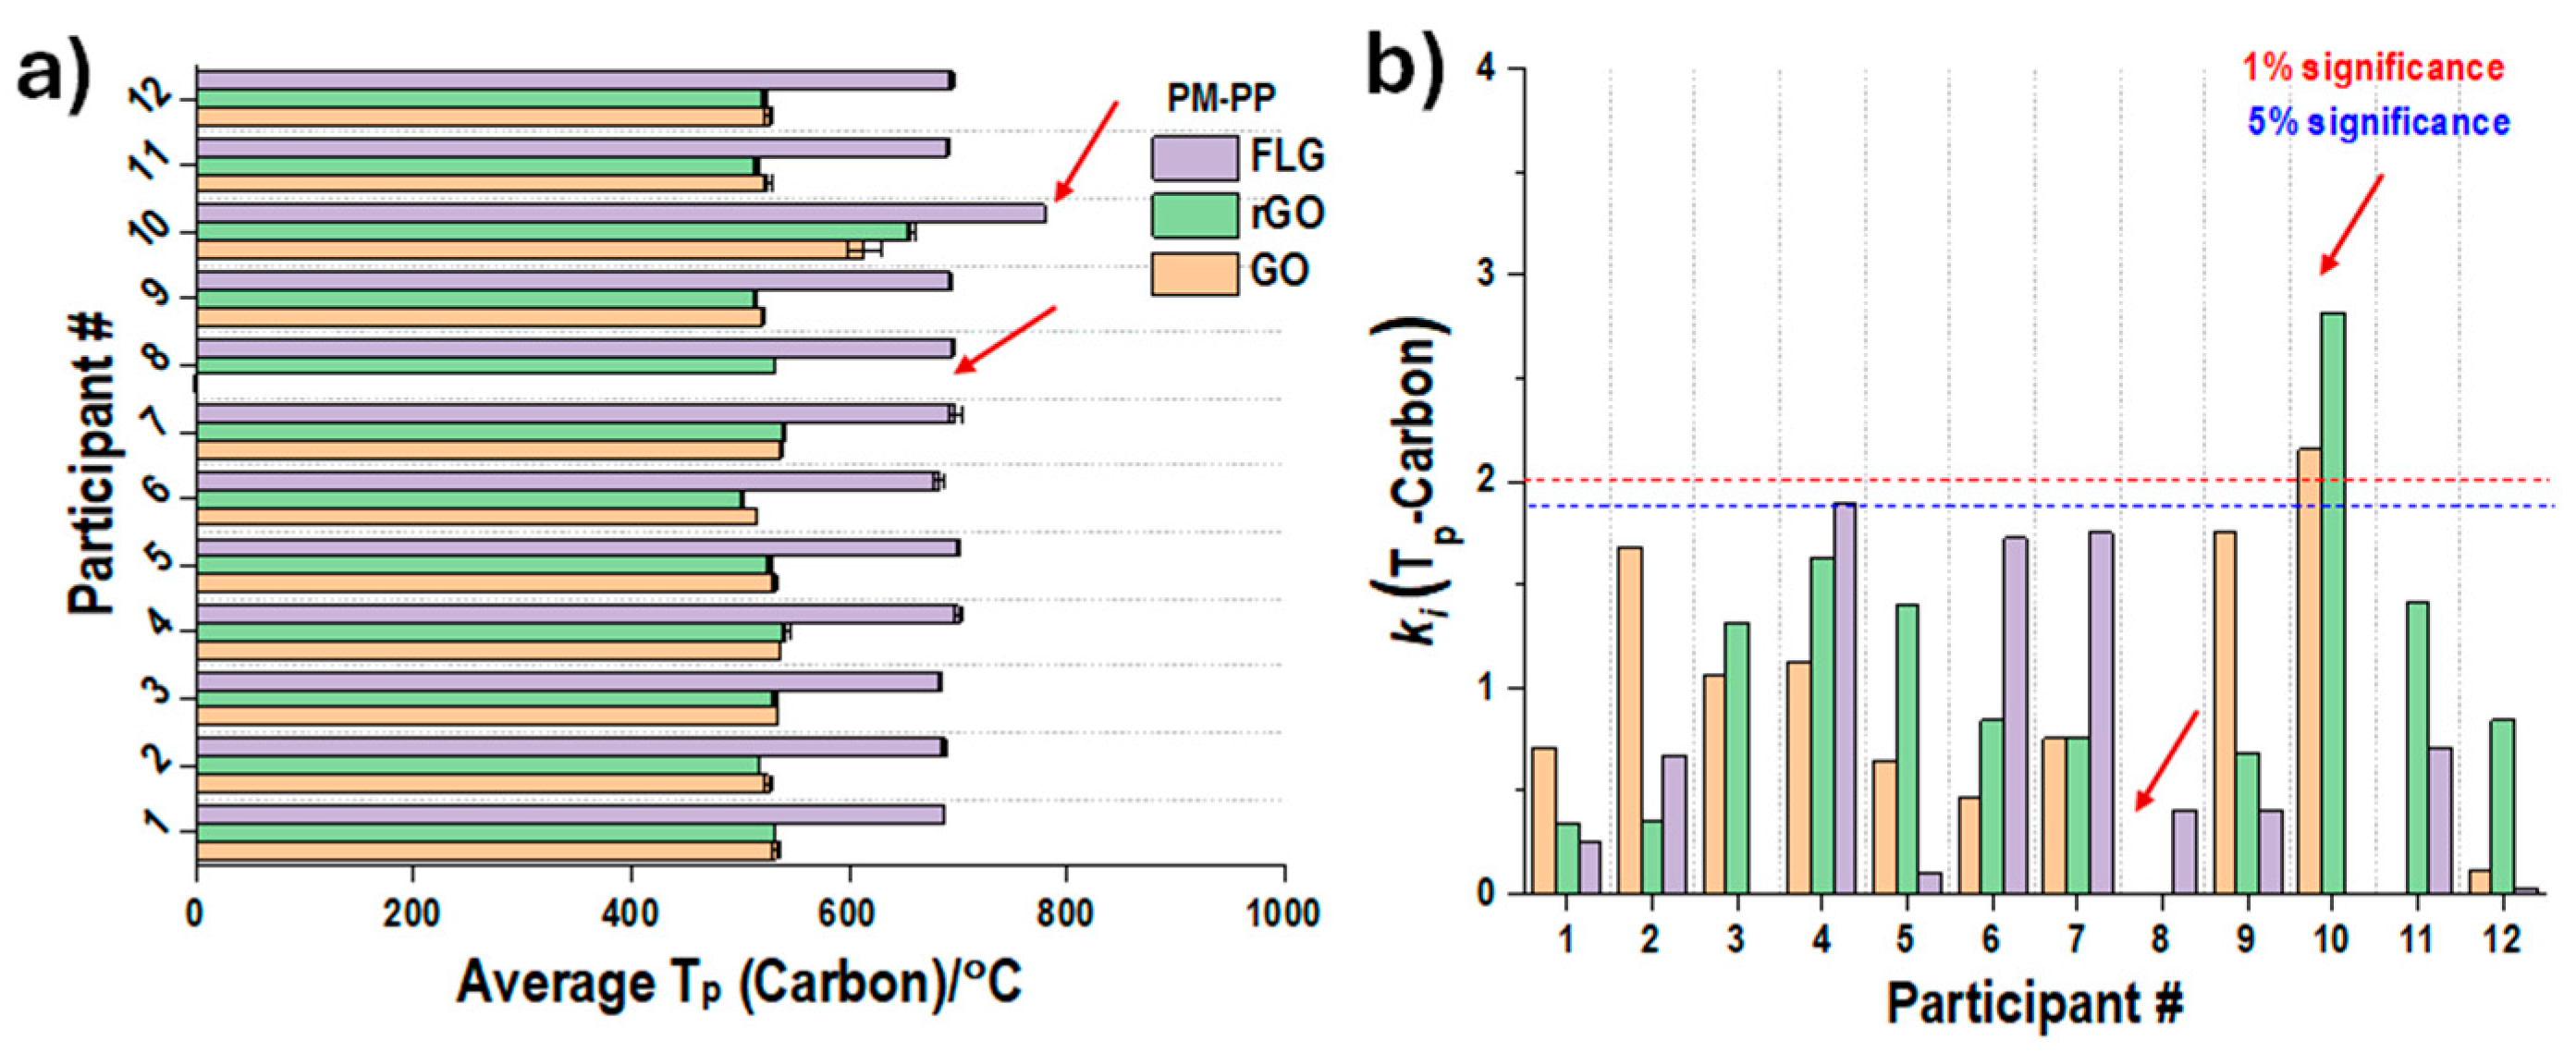
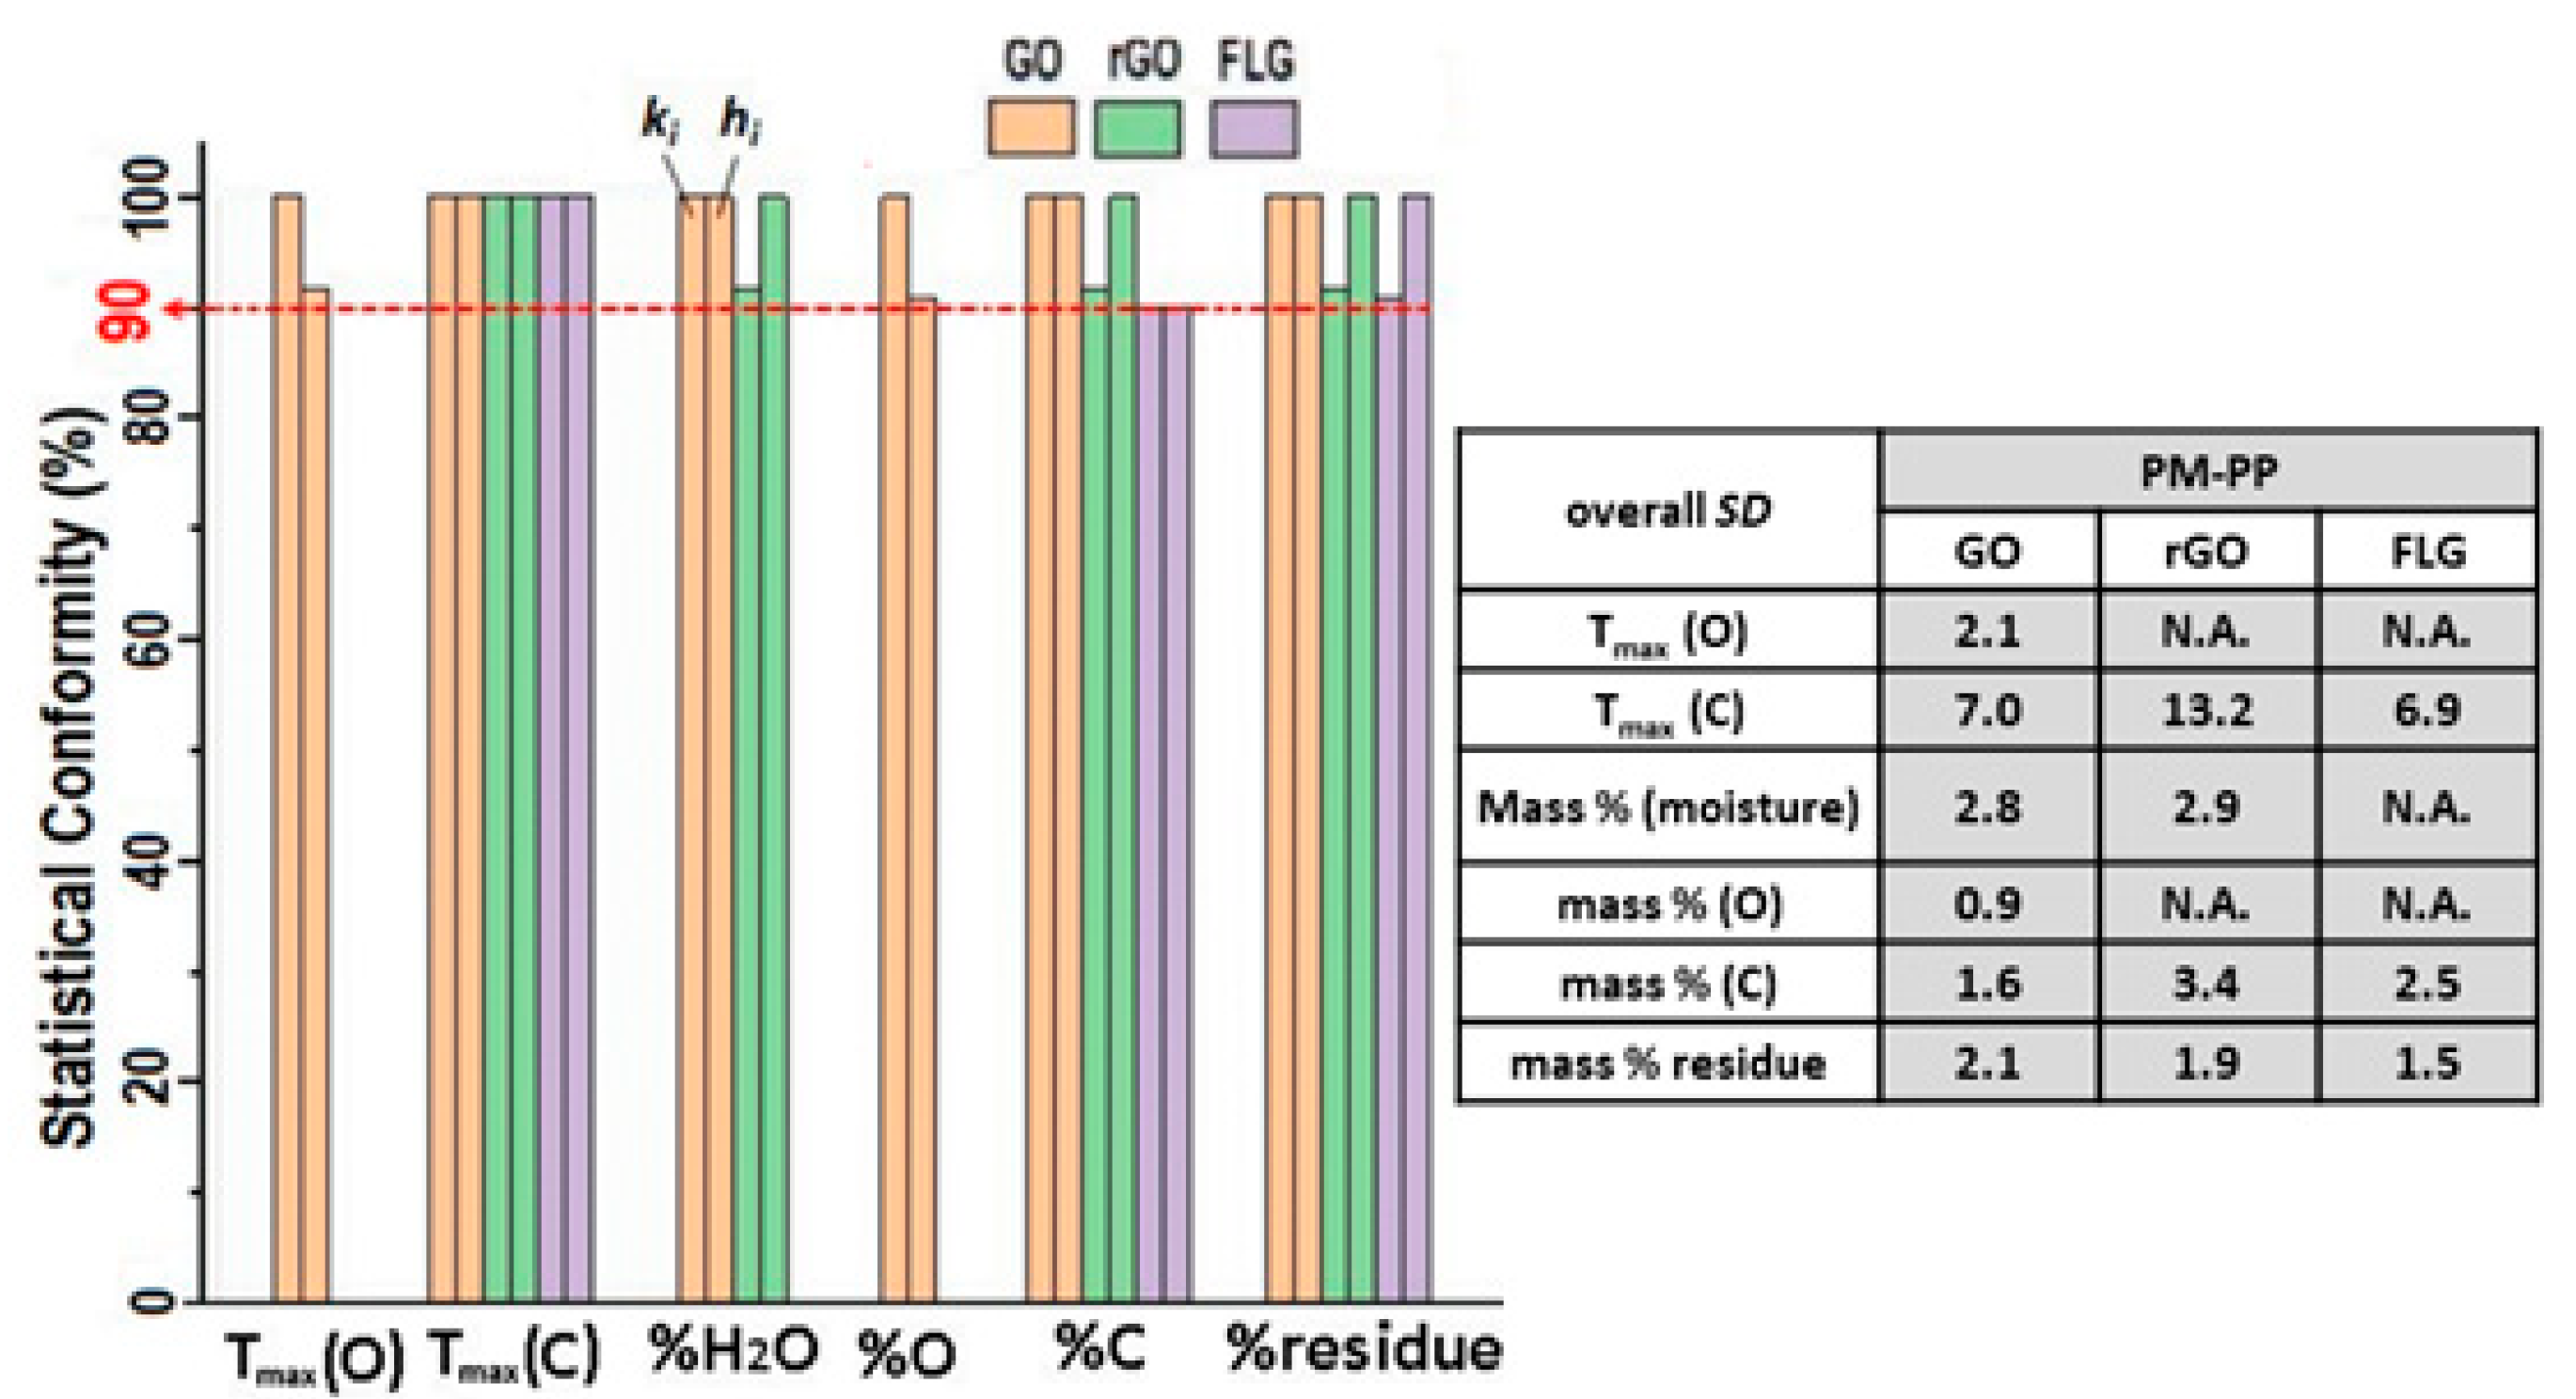
3.2. Validating the Optimized TGA Method for Characterizing GR2Ms

To demonstrate the analytical application of the optimized TGA method for the qualitative and quantitative characterization of GR2Ms, a series of laboratory validation tests followed by an International Interlaboratory Comparison (ILC) study through the VAMAS program were performed using industrially produced GR2Ms. The first validation was performed to demonstrate that the TGA method can be successfully used for a qualitative analysis and as a simple screening tool to discriminate GR2Ms (FLG, GO, and rGO) from other types of carbonaceous materials such as graphite, expanded graphite, and nanocarbons. This study was motivated by concerning information that most currently produced GR2Ms contain carbonaceous impurities as a result of the manufacturing process or which were added on purpose [17].
The results of comparative TG measurements of GO, RGO, and FLG and a series of non-graphene carbonaceous materials are presented in Figure 6. The obtained TG and DTG graphs indicate distinctive differences in the thermal oxidative decomposition of GR2Ms and other carbon materials, showing characteristic DTG peak patterns (position), shapes, and Tmax values. These distinctive TG/DTG curves and Tmax values for carbon peaks at about 491 °C (GO), 526 °C (rGO), and 705 °C (FLG) can be used for the qualitative analysis and detection of unwanted carbon impurities in GR2Ms [17,21]. The observed differences are outcomes of the intrinsic chemical and physical properties of these carbonaceous materials and arguably show the ability of the TGA method to be used for differentiating graphene, rGO, and GO from other carbon materials. These results also reflect the importance of using optimized and defined TGA conditions to obtain consistent TGA/DTG and Tmax results that can be different if different conditions are used, highlighting why it is important to standardize the TGA characterization method for GR2Ms.
The ability of the optimized TGA method to identify these carbon impurities in GR2Ms was successfully confirmed in the following experiment by spiking 5–10% of graphitic particles into GO, rGO, and FLG samples. The obtained TG/DTG graphs summarized in Figure S5 for all GR2Ms show additional DTG peaks with a Tmax value at ca. 800 °C. These results reveal the presence of graphitic particles, demonstrating the ability of the TGA method to provide a qualitative analysis of GR2M powders. It is worth stating that comparative analyses using Raman, TEM, SEM, and XPS could overlook these impurities if a statistically relevant number of particles and samples is not used, showing the benefits of the TGA method for GR2M characterization. Remarkably, the developed method is not only able to provide the qualitative detection of these graphitic impurities but also their quantitative determination [17]. These results, with more details, are provided in our previous work [16].
In the final step to validate the optimized TGA method for the characterization of GR2Ms, an International Interlaboratory Comparison (ILC) study was performed under the VAMAS program, involving 12 labs across five continents from metrology organizations, academia, and industry [16]. In this study, three types of GR2Ms (FLG, GO, and rGO) were characterized using the optimized TGA method for selected characterization parameters including the number of mass change steps, thermal stability, the temperature of the maximum mass change rate (Tmax) for each decomposition step, and the mass contents (%) of moisture, oxygen groups, carbon, and impurities (organic and non-combustible residues). The results from this study are presented in detail as a separate paper [16]. One example showing an evaluation of the method for the quantitative determination of the % carbon in GR2Ms samples (GO, rGO, and FLG) is presented in Figure 7. The average mass content of carbon was reported to be 49 ± 2% for the GO sample, 94 ± 3% for rGO, and 98 ± 3% for FLG by 12 participants, with a high consistency within participants that was confirmed by statistical evaluation using Mandel’s k plot (Figure 7). All the calculated k values were below the critical values’ significance levels of 1% and 5% set as the criteria for outliers except for one participant (10) (due to the incorrect use of N2 gas during the TGA analysis that led to incomplete carbon combustion). The high consistency of Mandel’s k values showed that the optimized TGA method achieved high within-laboratory repeatability [16].
A statistical analysis showing the standard variation and consistency of the TGA measurements for five evaluated parameters is summarized in Figure 8. This analysis shows that >90% statistical conformity was achieved for all the evaluated parameters, indicating a satisfactory performance of the optimized TGA method in measuring selected characterization parameters of GR2Ms [16]. The standard deviation analysis from the ILC study demonstrates low-level variations for most evaluated TGA parameters. The Tmax (C) parameter showed a higher SD value when compared to the Tmax (O) variance, while other assessed parameters related to quantitative determination such as the mass % fraction (moisture, O groups, C, and residues) showed SD values of less than 5.0 for all GR2M samples for all ILC participants [16]. The ILC outcomes prove that the optimized TGA method is highly reliable since in the ILC study, the TGA measurements were performed by operators who did not have previous experience on GR2Ms and used the provided protocol for the first time.
The outcomes from the performed ILC study confirmed that the TGA method with optimized experimental conditions and experimental and data-processing protocols can be satisfactorily used for the characterization of the proposed parameters and can be recommended for the characterization and quality control of GR2Ms. This study revealed that the observed discrepancies are influenced by several factors including (1) the operators’ adherence to the provided experimental protocol, (2) the operators’ subjectivity in data processing and the interpretation of TGA graphs, (3) the stability of GR2M samples, in particular, GO, and (4) the influence of the laboratory environment on the storage of GR2M samples and their measurements (temperature; humidity). The positive outcomes from this study were that the use of TGA instruments from five different manufacturers of TGA instruments with different types of furnaces, balances, sensitivity, software, and sample holders did not show a significant influence on the observed variation in the results. Based on these outcomes, a new and improved TGA protocol for the characterization of GR2Ms is prepared and will be included in the new ISO standard ISO DTS 23359:202#(X), Nanotechnologies—Chemical characterization of graphene-related two-dimensional materials from powders and dispersions, which is now in the consultation stage.

4. Conclusions

In summary, this paper explores and optimizes the experimental conditions of the TGA method for the characterization of GR2M powders, followed by a validation of the optimized approach through an ILC study. The objective was to develop a robust analytical method for reliable characterization, enabling both qualitative and quantitative chemical analyses of GR2M powders. Various experimental parameters, such as sample mass, loading method in the crucible, heating rate, gas environment, gas flow rate, and TGA instrument configurations, were systematically evaluated using FLG as a GR2M model material. This study reveals the limitations of these parameters in identifying the optimal TGA method.
The optimized TGA conditions, along with the data-processing protocol, were validated using three common GR2Ms (GO, rGO, and FLG) and other non-graphene carbon materials (graphite, expanded graphite, activated carbon, etc.). The results demonstrate the TGA method’s ability to offer both qualitative and quantitative chemical analyses of GR2Ms, even in mixtures with other carbon impurities. The DTG peak shape and Tmax values were identified as indicators providing evidence of non-graphene carbon impurities in GR2Ms, posing a concern for industrially manufactured GR2Ms with high graphitic contents.
Finally, an ILC study involving 12 laboratories worldwide was conducted through the VAMAS program to validate the optimized TGA protocol using GO, rGO, and FLG samples. The study confirmed that the TGA method can be satisfactorily used for the proposed qualitative and quantitative characterization of GR2Ms. The outcomes of this ILC study, along with recommended improvements for the TGA method, are in progress for implementation into a new ISO standard for the chemical characterization of graphene-related two-dimensional materials in powders and dispersions. The developed TGA method offers a cost-effective, rapid, simple, and highly reliable approach for the characterization and quality control of GR2Ms. The method, when applied in a quality control system, will increase confidence in the quality of industrially produced graphene powders, proving its essential role for the burgeoning graphene industry and end users across diverse sectors.

Supplementary Materials

The following supporting information can be downloaded at: https://www.mdpi.com/article/10.3390/c10020030/s1. The experimental section includes experimental protocols, results of the characterization of 3 GR2M samples using SEM, TEM, XPS, Raman, FTIR, PSD, and TGA, processed TGA results with tables, bar graphs, and histograms on the testing of 5 parameters, their statistical analysis, and some raw data and graphs.

Author Contributions

Conceptualization, D.L. and F.F.; methodology, F.F. and P.L.Y.; validation, D.L., F.F., and P.L.Y.; formal analysis, F.F. and P.L.Y.; investigation, F.F. and P.L.Y.; resources, D.L.; data curation, D.L. and F.F.; writing—original draft preparation, D.L. writing—review and editing, D.L., F.F. and P.L.Y.; supervision, D.L.; project administration, D.L.; funding acquisition, D.L. All authors have read and agreed to the published version of the manuscript.

Funding

ARC Research Hub for Graphene Enabled Industry Transformation, grant (IH150100003).

Data Availability Statement

Data are contained within the article and supplementary materials.

Acknowledgments

The authors thank the ARC Research Hub for Graphene Enabled Industry Transformation grant (IH150100003) funding and acknowledge support from VAMAS for completing the ILC study on TGA on GR2Ms and ARC Research Hub for Advanced Manufacturing with 2D Materials (IH 210100025).

Conflicts of Interest

The authors declare no conflicts of interest.

References

  1. Ferrari, A.C.; Bonaccorso, F.; Fal’Ko, V.; Novoselov, K.S.; Roche, S.; Bøggild, P.; Borini, S.; Koppens, F.H.; Palermo, V.; Pugno, N. Science and technology roadmap for graphene, related two-dimensional crystals, and hybrid systems. Nanoscale 2015, 7, 4598–4810. [Google Scholar] [CrossRef] [PubMed]
  2. Geim, A.K.; Novoselov, K.S. The rise of graphene. Nat. Mater. 2007, 6, 183–191. [Google Scholar] [CrossRef] [PubMed]
  3. Kong, W.; Kum, H.; Bae, S.-H.; Shim, J.; Kim, H.; Kong, L.; Meng, Y.; Wang, K.; Kim, C.; Kim, J. Path towards graphene commercialization from lab to market. Nat. Nanotechnol. 2019, 14, 927–938. [Google Scholar] [CrossRef] [PubMed]
  4. Kauling, A.P.; Seefeldt, A.T.; Pisoni, D.P.; Pradeep, R.C.; Bentini, R.; Oliveira, R.V.B.; Novoselov, K.S.; Castro Neto, A.H. The Worldwide Graphene Flake Production. Adv. Mater. 2018, 30, 1803784. [Google Scholar] [CrossRef] [PubMed]
  5. Zhu, Y.; Ji, H.; Cheng, H.-M.; Ruoff, R.S. Mass production and industrial applications of graphene materials. Natl. Sci. 2017, 5, 90–101. [Google Scholar] [CrossRef]
  6. Cohen-Tanugi, D.; Grossman, J.C. Water Desalination across Nanoporous Graphene. Nano Lett. 2012, 12, 3602–3608. [Google Scholar] [CrossRef] [PubMed]
  7. Bøggild, P. The war on fake graphene. Nature 2018, 562, 502–503. [Google Scholar] [CrossRef] [PubMed]
  8. ISO/TS 80004-13:2017; Nanotechnologies—Vocabulary—Part 13: Graphene and Related Two-Dimensional (2D) Materials. ISO: Geneva, Switzerland, 2017.
  9. ISO/TS 21356-1:2021; Nanotechnologies—Structural Characterization of Graphene. Part 1: Graphene from Powders and Dispersions. ISO: Geneva, Switzerland, 2021; 48p.
  10. ISO/TR 19733:2019; ISO Nanotechnologies. Matrix of Properties and Measurement Techniques for Graphene and Related Two-Dimensional (2D) Materials. ISO: Geneva, Switzerland, 2019.
  11. PAS 1201:2018; Properties of Graphene Flakes—Guide. The British Standards Institution (BSI): London, UK, 2018.
  12. Pollard, A.; Paton, K.; Clifford, C.; Legge, E. Characterisation of the Structure of Graphene. Good Practice Guide No 145; National Physical Laboratory (NPL): Teddington, UK, 2017. [Google Scholar]
  13. Farivar, F.; Yap, P.L.; Hassan, K.; Tung, T.T.; Tran, D.N.H.; Pollard, A.J.; Losic, D. Unlocking thermogravimetric analysis (TGA) in the fight against “Fake graphene” materials. Carbon 2021, 179, 505–513. [Google Scholar] [CrossRef]
  14. Farivar, F.; Lay Yap, P.; Karunagaran, R.U.; Losic, D. Thermogravimetric Analysis (TGA) of Graphene Materials: Effect of Particle Size of Graphene, Graphene Oxide and Graphite on Thermal Parameters. C 2021, 7, 41. [Google Scholar] [CrossRef]
  15. Shtein, M.; Pri-Bar, I.; Varenik, M.; Regev, O. Characterization of Graphene-Nanoplatelets Structure via Thermogravimetry. Anal. Chem. 2015, 87, 4076–4080. [Google Scholar] [CrossRef] [PubMed]
  16. Yap, P.L.; Farivar, F.; Jämting, Å.K.; Coleman, V.A.; Gnaniah, S.; Mansfield, E.; Pu, C.; Landi, S.M.; David, M.V.; Flahaut, E.; et al. International Interlaboratory Comparison of Thermogravimetric Analysis of Graphene-Related Two-Dimensional Materials. Anal. Chem. 2023, 95, 5176–5186. [Google Scholar] [CrossRef] [PubMed]
  17. Losic, D.; Farivar, F.; Yap, P.L.; Karami, A. Accounting Carbonaceous Counterfeits in Graphene Materials Using the Thermogravimetric Analysis (TGA) Approach. Anal. Chem. 2021, 93, 11859–11867. [Google Scholar] [CrossRef] [PubMed]
  18. Olatunji, O.O.; Akinlabi, S.A.; Mashinini, M.P.; Fatoba, S.O.; Ajayi, O.O. Thermo-gravimetric characterization of biomass properties: A review. IOP Conf. Ser. Mater. Sci. Eng. 2018, 423, 012175. [Google Scholar] [CrossRef]
  19. Gabbott, P. Principles and Applications of Thermal Analysis; John Wiley & Sons: Hoboken, NJ, USA, 2008. [Google Scholar]
  20. Brown, M.E. Introduction to Thermal Analysis: Techniques and Applications; Springer: Berlin/Heidelberg, Germany, 2001. [Google Scholar]
  21. Losic, D.; Farivar, F.; Yap, P.L.; Tung, T.T.; Nine, M.J. New insights on energetic properties of graphene oxide (GO) materials and their safety and environmental risks. Sci. Total Environ. 2022, 848, 157743. [Google Scholar] [CrossRef] [PubMed]
Figure 1. The influence of the sample mass and the method of packing in a crucible with FLG samples on TGA measurements. (a) TG and DTG graphs obtained using the free loading of samples (loose packing; no pressing) of different masses (2.6 to 9.3 mg) in a crucible with volume of 70 µL; (b) a graph showing the dependence of the Tmax on the mass of freely loaded samples, indicating a minor influence of mass change on Tmax values. (c) TG/DTG graphs obtained using different masses (9.3 freely loaded; 31.6 mg and 47.5 mg pressed) with different packing methods (freely loaded vs. pressed samples to fill 70 µL in a crucible). All measurements were performed in an open crucible at a heating rate of 10 °C/min in an air environment.
Carbon 10 00030 g001
Figure 2. The influence of open (without a lid) and closed (a lid with a hole) crucibles with FLG samples on TGA results. (a) TG/DTG graphs obtained using FLG samples in open and closed crucibles at the following measurement conditions: 5.0 mg, free loading, and heating rates of 5 °C/min, 10 °C/min, and 20 °C/min in an air environment. (b) A plot showing the dependence of Tmax vs. heating rate with open and closed crucibles.
Carbon 10 00030 g002
Figure 3. The influence of heating rate on TGA results for FLG. (a) TG/DTG graphs obtained using different heating rates (from 5 °C/min to 100 °C/min), using freely loaded FLG samples with other constant conditions (5.0 mg, free loading, open crucible, and heating rates of 5–100 °C/min in an air environment). (b) A graph showing the dependence of Tmax on the heating rate, indicating that a heating rate >10 °C/min is not suitable for TGA measurements with a significant shift in Tmax to higher values.
Carbon 10 00030 g003
Figure 4. The influence of the gas environment on TGA results using few-layer graphene (FLG) samples. (a) TG/DTG graphs obtained using different concentrations of oxygen (0% to 75%) paired with N2, gas using an FLG sample and keeping other conditions constant (5.0 mg, free loading in open crucible, and a heating rate of 10 °C/min) (b) A table and a graph showing the dependence of Tmax against the concentration of oxygen, indicating its influence in shifting Tmax to lower values (faster decomposition) with an increasing concentration of oxygen.
Carbon 10 00030 g004
Figure 5. The influence of the gas flow rate TGA condition using FLG samples on TGA results. (a) TG/DTG graphs obtained using different total flow rates (0 mL/min to 100 mL/min) of freely loaded FLG samples (5 mg) in a closed crucible with a hole and a heating rate of 10 °C/min. (b) A graph showing the dependence of Tmax on the flow rate, showing the shifting of Tmax to lower values (faster decomposition) with increasing flow rates.
Carbon 10 00030 g005
Figure 6. Comparative TG/DTG graphs and Tmax values of GR2Ms (GO, rGO, and FLG) and other carbon materials, including multiwall carbon nanotubes (MWCNT-1s), activated carbon-2, graphene ribbons-3, single-walled carbon nanotubes (SWCNT-4s), and graphene onions-5 expanded graphite-6 and graphite-7, using optimized TGA conditions, showing the ability of the TGA method to discriminate these possible carbon impurities or additives in GR2M powders based on differences in TG/DTG graphs/peaks and Tmax values.
Carbon 10 00030 g006
Figure 7. (a) Mass content of carbon (%-C) based on ILC participants for TGA results on GO, rGO, and FLG for selected parameters and (b) statistical Mandel’s k to evaluate consistency within participants (12). Arrows show laboratories for which data were excluded for performing experiments incorrectly (adapted from [16]).
Carbon 10 00030 g007
Figure 8. Summary of the overall statistical conformity of the selected characterization parameters (Tmax for O groups and C, mass % (concentration) for moisture, O groups, C, and residues) performed using the TGA method on three GR2M samples (GO, rGO, and FLG) by 12 participants, showing Mandel’s ki and hi statistical analysis based on the participants’ measurements and analyses (adapted from [16]).
Carbon 10 00030 g008
Table 1. The optimized experimental conditions for TGA measurements of GR2Ms.
Evaluated Conditions Applicable Range Optimized Comments
Mass of sample, mg (2–47 mg)2–10 4–5 mgLimited by vol. of crucible, powders not fluffy
Sample loading in crucible (pressure free or pressure loaded)Pressure-free Pressure-freeTightly packed/pressed sample with higher mass will impact heat transfer and results
Type of crucible (Pt or alumina) Pt or alumina, 60–100 uL Alumina or PtNo influence of crucible materials is observed
Open or closed
crucible (lid with a hole)
Both acceptable. Open can be used for higher heating rating up to 10 °C/min and a lid with ≤5°C/min OpenFor fluffy graphene samples a lid with a hole is a recommended solution with optimized conditions
Heating rate, 5–100 °C/min 5–10 °C/min5 °C/minHigher heating rate (>20 °C/min) cause higher thermal gradient within the sample
Gas environment, 0–75 % O25–75 % O2Air or close to air (10–20% O2)0 % O2, no combustion for C
Sample gas flow rate, mL/min25–100 mL/min 60 mL/min Low flow can impact on combustion and results via lowering O2 ratio after mixing with the balance gas
TGA instrument design (furnace and thermobalance)Vertical or horizontal Vertical or horizontalInsignificant impact.
Disclaimer/Publisher’s Note: The statements, opinions and data contained in all publications are solely those of the individual author(s) and contributor(s) and not of MDPI and/or the editor(s). MDPI and/or the editor(s) disclaim responsibility for any injury to people or property resulting from any ideas, methods, instructions or products referred to in the content.

