Article

Miscanthus-Derived Biochar as a Platform for the Production of Fillers for the Improvement of Mechanical and Electromagnetic Properties of Epoxy Composites

by
Salvatore Scavuzzo
1,
Silvia Zecchi
2,
Giovanni Cristoforo
2,
Carlo Rosso
1,*,
Daniele Torsello
2,3,
Gianluca Ghigo
2,3,
Luca Lavagna
2,4,
Mauro Giorcelli
2,4,*,
Alberto Tagliaferro
2,4,
Marco Etzi
5 and
Mattia Bartoli
4,5
1
Department of Mechanical and Aerospace Engineering, Polytechnic University of Turin, Corso Duca degli Abruzzi 24, 10129 Turin, Italy
2
Department of Applied Science and Technology, Polytechnic University of Turin, Corso Duca degli Abruzzi 24, 10129 Turin, Italy
3
Istituto Nazionale di Fisica Nucleare, Sez. Torino, Via P. Giuria 1, 10125 Torino, Italy
4
Consorzio Interuniversitario Nazionale per la Scienza e Tecnologia dei Materiali (INSTM), Via Giuseppe Giusti 9, 50121 Florence, Italy
5
Center for Sustainable Future, Italian Institute of Technology, Via Livorno 60, 10144 Turin, Italy
*
Authors to whom correspondence should be addressed.
Submission received: 31 May 2024 / Revised: 30 July 2024 / Accepted: 23 August 2024 / Published: 5 September 2024

Abstract

:
The production of multipurpose sustainable fillers is a matter of great interest, and biochar can play a pivotal role. Biochar is a biomass-derived carbon source that can act as a versatile platform for the engineering of fillers as neat or functionalized materials. In this work, we investigate the utilization of 800 °C annealed Miscanthus-derived biochar as a filler for the production of epoxy composites with promising mechanical and electrical properties. We also used it in the production of an iron-rich hybrid filler in order to fine-tune the surface and bulk properties. Our main findings reveal that hybrid composites containing 20 wt.% biochar exhibit a 27% increase in Young’s modulus (YM), reaching 1.4 ± 0.1 GPa, while the ultimate tensile strength (UTS) peaks at 30.3 ± 1.8 Mpa with 10 wt.% filler, a 27% improvement over pure epoxy. However, higher filler loadings (20 wt.%) result in decreased UTS and maximum elongation. The optimal toughness of 0.58 ± 0.14 MJ/m³ is observed at 5 wt.% filler content. For organic composites, YM sees a notable increase of 90%, reaching 2.1 ± 0.1 Gpa at 20 wt.%, and UTS improves by 32% with the same filler content. Flexural tests indicate an enhanced elastic modulus but reduced maximum elongation as filler content rises. Electromagnetic evaluations show that hybrid fillers maintain a primarily dielectric behavior with a negligible impact on permittivity, while biochar–epoxy composites exhibit increased conductivity at higher filler loadings, suitable for high-frequency applications. In light of these results, biochar-based fillers demonstrate significant potential for enhancing the mechanical and electrical properties of epoxy composites.

1. Introduction

The production of high-performance composites is a key sector for plenty of applications including automotive and aerospace ones [1,2].
Great effort has been made in the development of fillers able to simultaneously exploit several improvements [3]. Nanosized carbon fillers (i.e., graphene, carbon nanotubes) are among the most studied due to their remarkable properties of electrical conduction [4,5,6,7] and reinforcement action [8,9,10,11]. Nevertheless, nanosized carbon fillers have shown several issues due to their high cost [12,13], complex handleability [14,15], and difficult production standardization [16,17].
These limitations have driven development toward nanostructured neat and hybrid carbon fillers with high dispersibility [18] and performances comparable with those achieved used nanosized ones [19]. Zhang et al. [20] described the use of carbon nanotubes dispersed onto micrometric clay as a solid choice to achieve a high dispersion and a great improvement in the tensile modulus. Similarly, Zhao et al. [21] produced micrometric carbon sponges using carbon nanotube bundles, improving the elastic modulus above 70% compared to neat matrices.
An interesting approach is the use of biochar (BC) as a carbon matrix for the production of polymeric composites with improved mechanical and electronic properties [22]. BC has shown very promising properties as a toughening agent for several polymeric matrices [23,24,25], also improving their electrical conductivity [26,27,28]. Neat BC performances are mainly due to the combination of high tuneability properties based on the production temperature [29] and good dispersibility in a polymeric matrix [30]. BC can be further tailored by thermal annealing beyond the pyrolysis temperature to further boost the electrical conductivity [31], along with surface tailoring with organic and inorganic species to increase the interaction with the matrix [32]. As reported by Zecchi et al. [33], the simultaneous presence of iron oxide and biochar traces are able to fine-tune the electronic properties under high-frequency irradiation. Additionally, the carbon residues on iron-rich fillers can preserve the dispersibility of the neat biochar in contrast to other inorganic fillers [34,35,36].
The exploration of hybrid fillers combining biomass-derived materials and inorganic fillers remains limited. There is a significant gap in the research concerning the synergistic effect of hybrid fillers that include a biomass and an inorganic component and their impact on both mechanical and electromagnetic properties.
In this work, we used Miscanthus-derived biochar as a platform for the production of annealed BC and iron-rich biochar-derived filler, exploiting their ability to improve a wide range of mechanical and electromagnetic performances. The findings of this research can lead to the creation of new materials suitable for various applications, from structural components to electromagnetic interference-shielding materials. Moreover, the results suggest the potential ability of these materials for adhesive applications.

2. Materials and Methods

2.1. Materials

Biochar was purchased from UK Biochar Research Gate (MSP 550) and used as received without purification. The biochar was produced from Miscanthus through pyrolysis under an inert atmosphere. The temperature reached during the process was 500 °C. The two-component BFA diglycidyl resin was purchased from CORES (Cores epoxy resin, LPL). Iron nitrate nonahydrate (>99%) was provided by Sigma-Aldrich and used without additional purification.

2.2. Methods

2.2.1. BC Production

The Miscanthus biochar underwent pulverization using a TURBULA® mixer T 2 F (Muttenz, Switzerland) for 15 min. Subsequently, the resulting powder underwent grinding and further pyrolysis within a tubular furnace (Carbolite TZF 12/65/550) under a nitrogen atmosphere. This process involved a heating rate of 15 °C/min, reaching and maintaining a temperature of 800 °C for 30 min. The biochar was then retrieved and utilized without undergoing any additional purification steps.

2.2.2. Fe-BC Production

A similar production process, schematically illustrated in Figure 1, was employed for the hybrid filler as reported by Tamborrino et al. [37]. Miscanthus biochar was pulverized using a TURBULA® mixer T 2 F (Muttenz, Switzerland) for 15 min and then mixed with iron nitrate nonahydrate at a BC:Fe weight ratio equal to 1:10. The mixture was suspended in water and dried at 110 °C for 48 h. The resulting powder was then ground and subjected to pyrolysis again in a tubular furnace (Carbolite TZF 12/65/550) under a nitrogen atmosphere, using a heating rate of 15 °C/min and maintaining the temperature at 800 °C for 30 min. The Fe@BC product was recovered and used without further purification.

2.2.3. Filler Characterization

The Raman spectra of both powders were collected using a Renishaw inVia (H43662 model, Gloucestershire, UK) equipped with a laser line emitting at wavelengths of 514 and 785 nm and a 50× objective lens. Raman spectra were recorded in the range from 150 cm−1 to 3500 cm−1, and the region between 1000 and 2000 cm−1 was analyzed using homemade software compiled in MATLAB® (version R2020a), following a procedure reported by Tagliaferro et al. [38]. The crystalline size of carbon was calculated according to Tuinstra et al. [39].
The morphology of Fe@BC was observed using a field-emission scanning electron microscope (FE-SEM, Zeiss SupraTM40, Oberkochen, Germany). The instrument was equipped with an energy-dispersive X-ray detector (EDX, Oxford Inca Energy 450, Oberkochen, Germany) for compositional evaluation of BC and Fe@BC.
XRD analyses were performed using a Panalytical X’PERT PRO PW3040/60 diffractometer (Cu K α radiation at 40 kV and 40 mA, Panalytical BV, Almelo, the Netherlands). The diffraction spectra were obtained from biochar powder in the 2θ range from 20° to 70° with a step size of 0.026. XRD spectra were analyzed by using QualX software (version 2) and crystalline sizes were calculated using the Scherrer equation.
Thermogravimetric analysis (TGA) was run using a Mettler Toledo 1600 (Ockerweg 3, 35353 Giessen) in flowing 50 mL/min O2 or Ar. Samples were heated from 25 to 800 °C with a constant heating ramp of 10 °C/min.

2.2.4. Composite Preparation and Characterization

Fillers, as outlined in Table 1, were dispersed into the resin monomer through manual mixing for 10 min. Following the addition of the curing agent (monomer:curing agent weight ratio of 2:1), the resulting solution underwent further mixing for an additional 2 min. Subsequently, it was poured into a PLA 3D-printed mold and left to cure for 24 h at room temperature. Thermal curing was then conducted in a ventilated oven (I.S.C.O. SRL “The scientific manufacturer”, Venice, Italy) at 50 °C for 7 h. This temperature was selected to prevent PLA degradation, thereby avoiding mold shrinkage and specimen deformation.
Various filler loadings were produced to understand their influence on mechanical and electromagnetic properties. Specifically, filler concentrations of 5%, 10%, and 20% by weight were used for both filler families.
For tensile and flexural tests, five samples were prepared for each concentration to ensure reproducibility and facilitate statistical analysis. Specimens without fillers were also produced as reference samples for electromagnetic and mechanical characterization. Due to the differing nature of the tests, multiple types of specimens were manufactured: dog-bone-shaped specimens were produced for the tensile test according to BS EN ISO 527-2:2012, while bar specimens were used for the flexural test according to BS EN ISO 178:2019.
Additionally, toroidal-shaped specimens were manufactured for electromagnetic analysis. The investigations were conducted at high frequency (1–12 GHz) with the Rodhe Schwarz ZVK Vector Network Analyzer, connected to the EpsiMu toolkit [40]. Electromagnetic properties were obtained from the measured scattering matrix using a Nicolson–Ross–Weir transmission/reflection algorithm [41,42].
Surface properties were investigated using a single-way tribometer (Anton-Paar Pin-on-Disk Tribometer TRB, Seongnam, Republic of Korea) equipped with a polished steel sphere (AISI 420) with a diameter of 6 mm.
A microindenter (INNOVATEST, Nemesis 9000 Borgharenweg. Maastricht, The Netherlands) equipped with a pyramidal tip (Vickers) was used to apply a nominal force of 1 N.

3. Results and Discussion

3.1. Filler Characterization

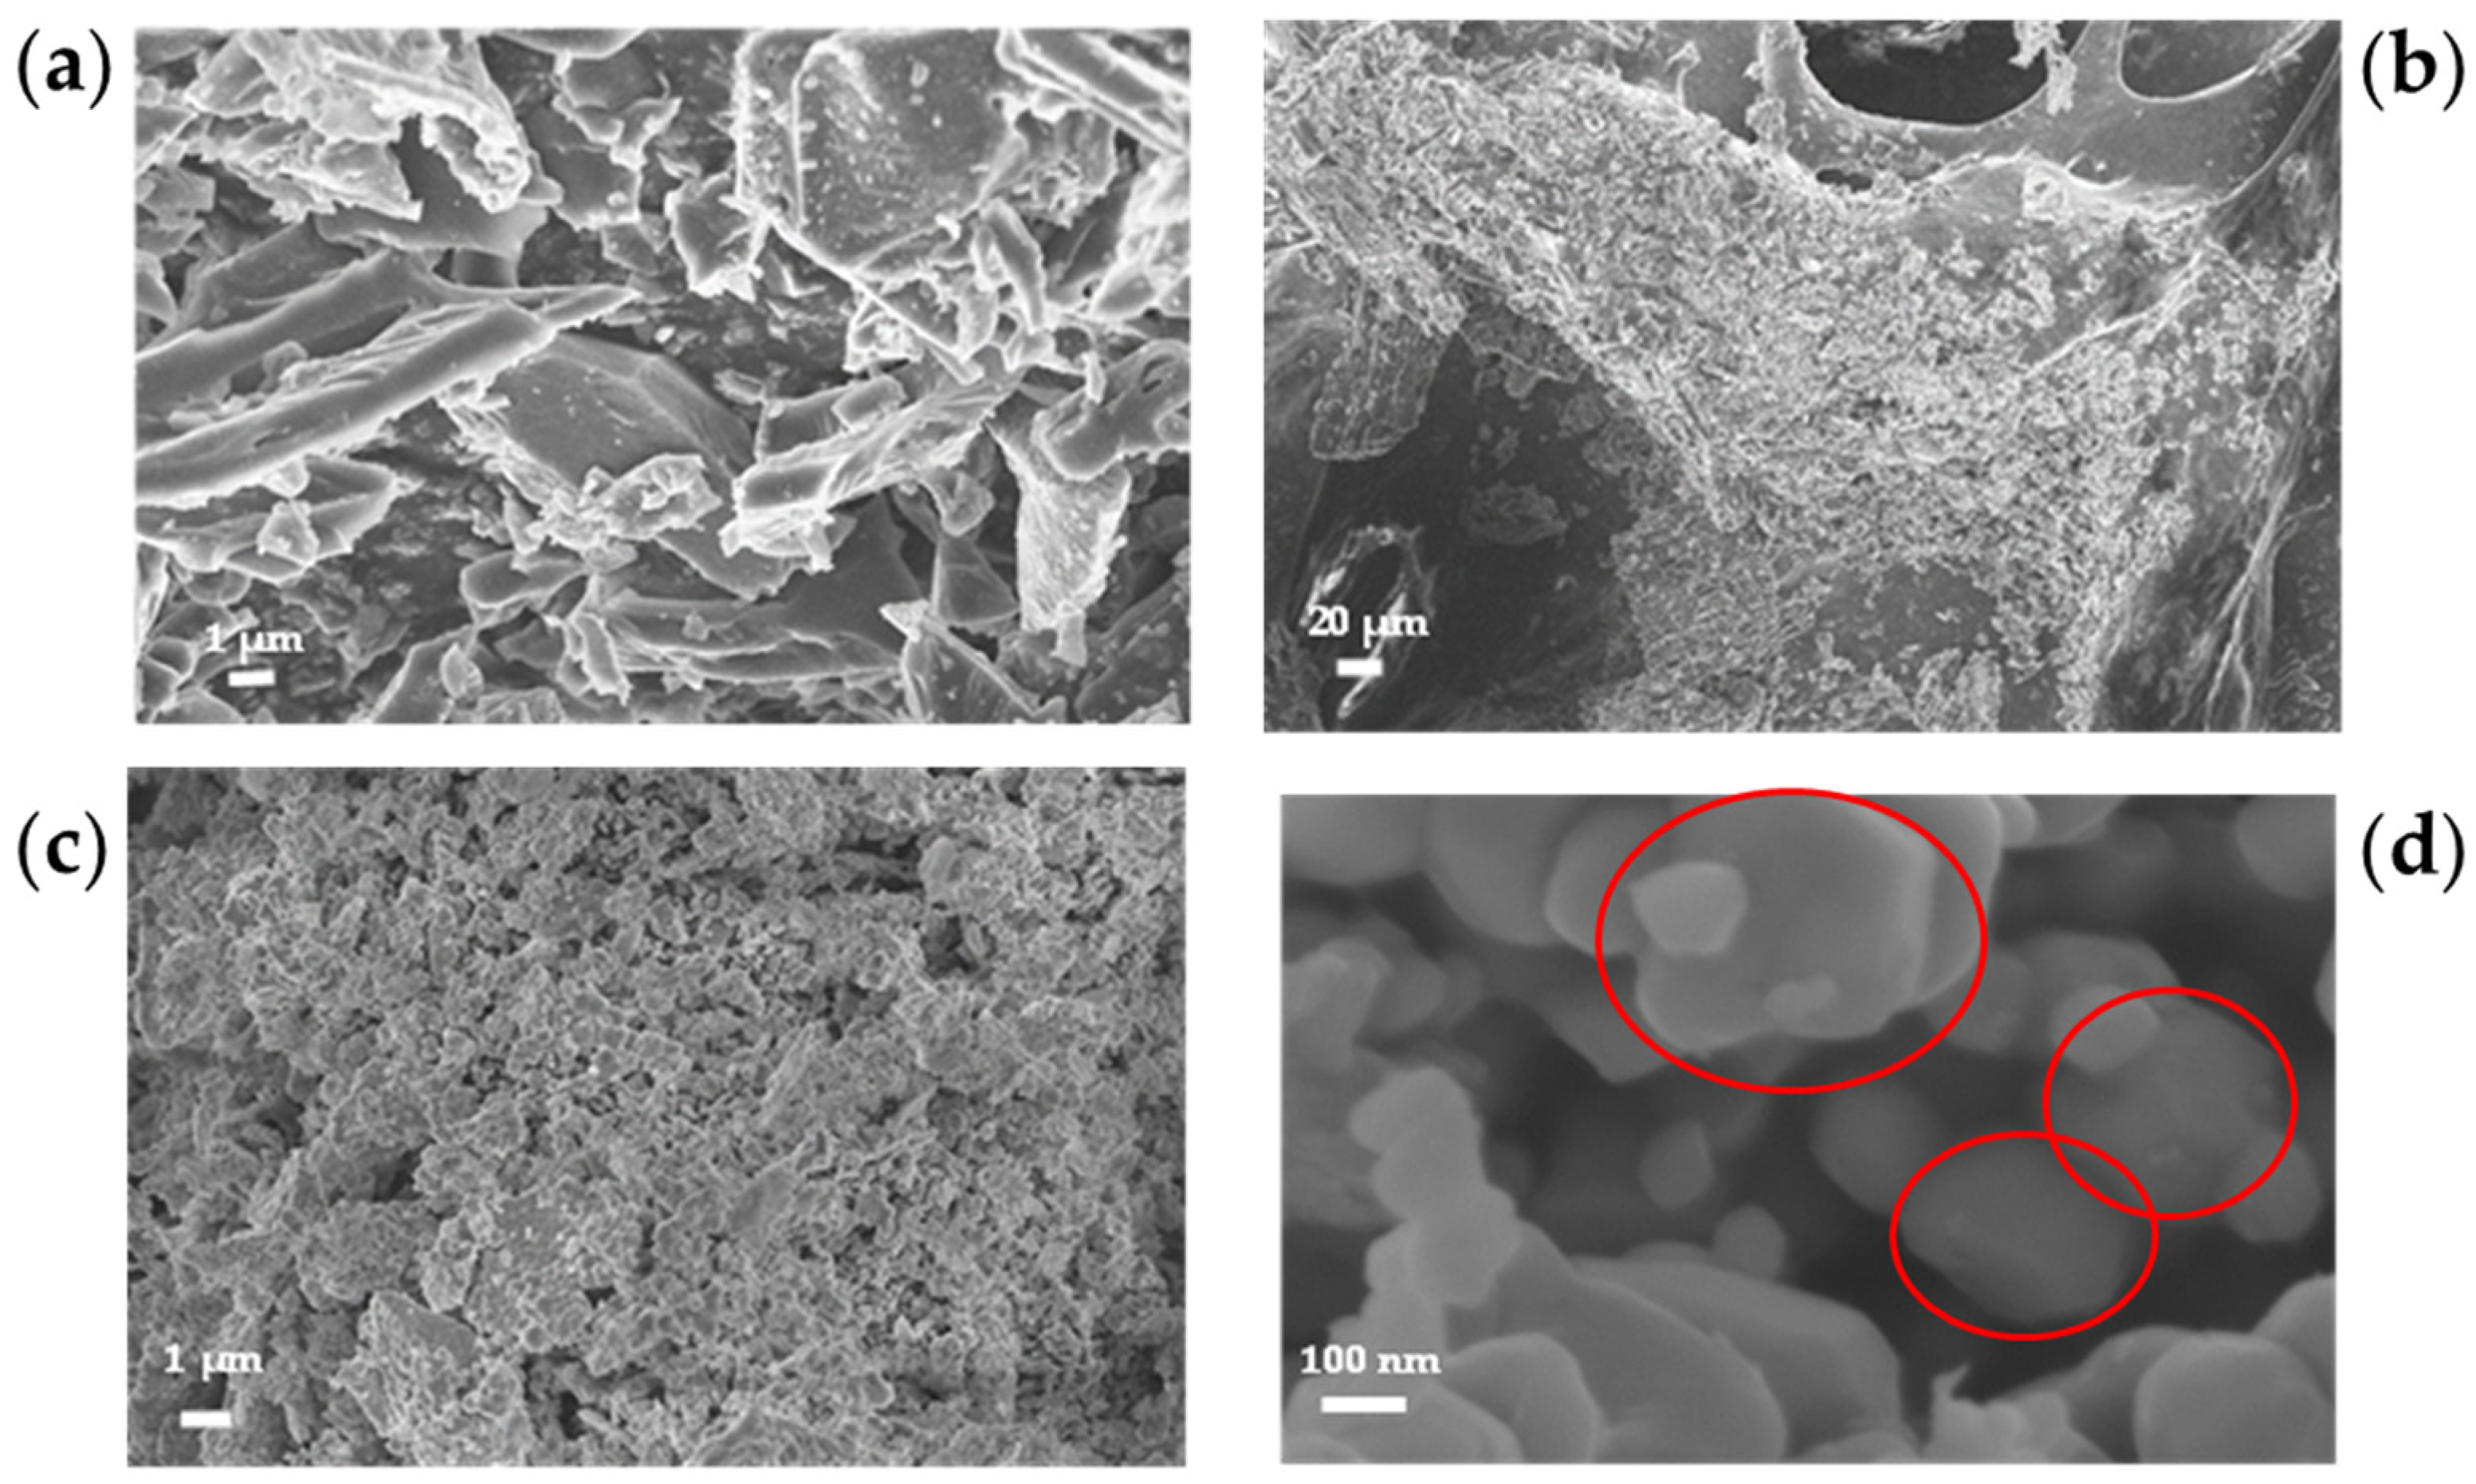
The morphology of biochar particles is closely correlated with the biomass used for the pyrolytic process and the pre- and post-treatments applied [43]. FE-SEM images, reported in Figure 2a,b, show MSP biochar with a very clean surface and the presence of an external core covered by spikes. FE-SEM images of the hybrid fillers, shown in Figure 2c,d, reveal the presence of iron-based particles (highlighted in red) and biochar aggregates. The predominant morphology of iron particles is hexagonal-based polyhedral, surrounded by a few biochar spheres. The production of the iron particles was due to the carbothermal reduction of iron precursors at high temperature in the presence of BC as reported by Tamborrino et al. [37]. The utilization of micrometric carbon structures allowed the preliminary anchoring of iron seeds limiting the volumetric growth and confining the Fe@BC on the nanoscale.
As reported in Table 2, the Fe/C ratio of the filler is higher than the theoretical ratio calculated based on the precursor masses used. Indeed, the filler with a theoretical Fe/C ratio of 10 has an actual ratio of 18.55. This deviation from the theoretical value can be attributed to the different reactivity of the precursors and the heat treatment, as prolonged exposure to 800 °C in a tube furnace enhances the carbothermal reduction process. In this process, the carbon in the biochar acts as a reducing agent on iron oxides (Fe(II), Fe(III)), facilitating the formation of metallic iron. As a result, the carbon is partially oxidized (passing into gaseous form: CO, CO2), thus decreasing its amount in the final product. As reported in Table 1 and shown in Figure S1 (see Supplementary Materials), the EDX analysis conducted on the filler revealed the presence of oxygen, which could be contained in the protective shell around the metallic iron core or could be indicative of the presence of iron oxides that have not been reduced by carbon.
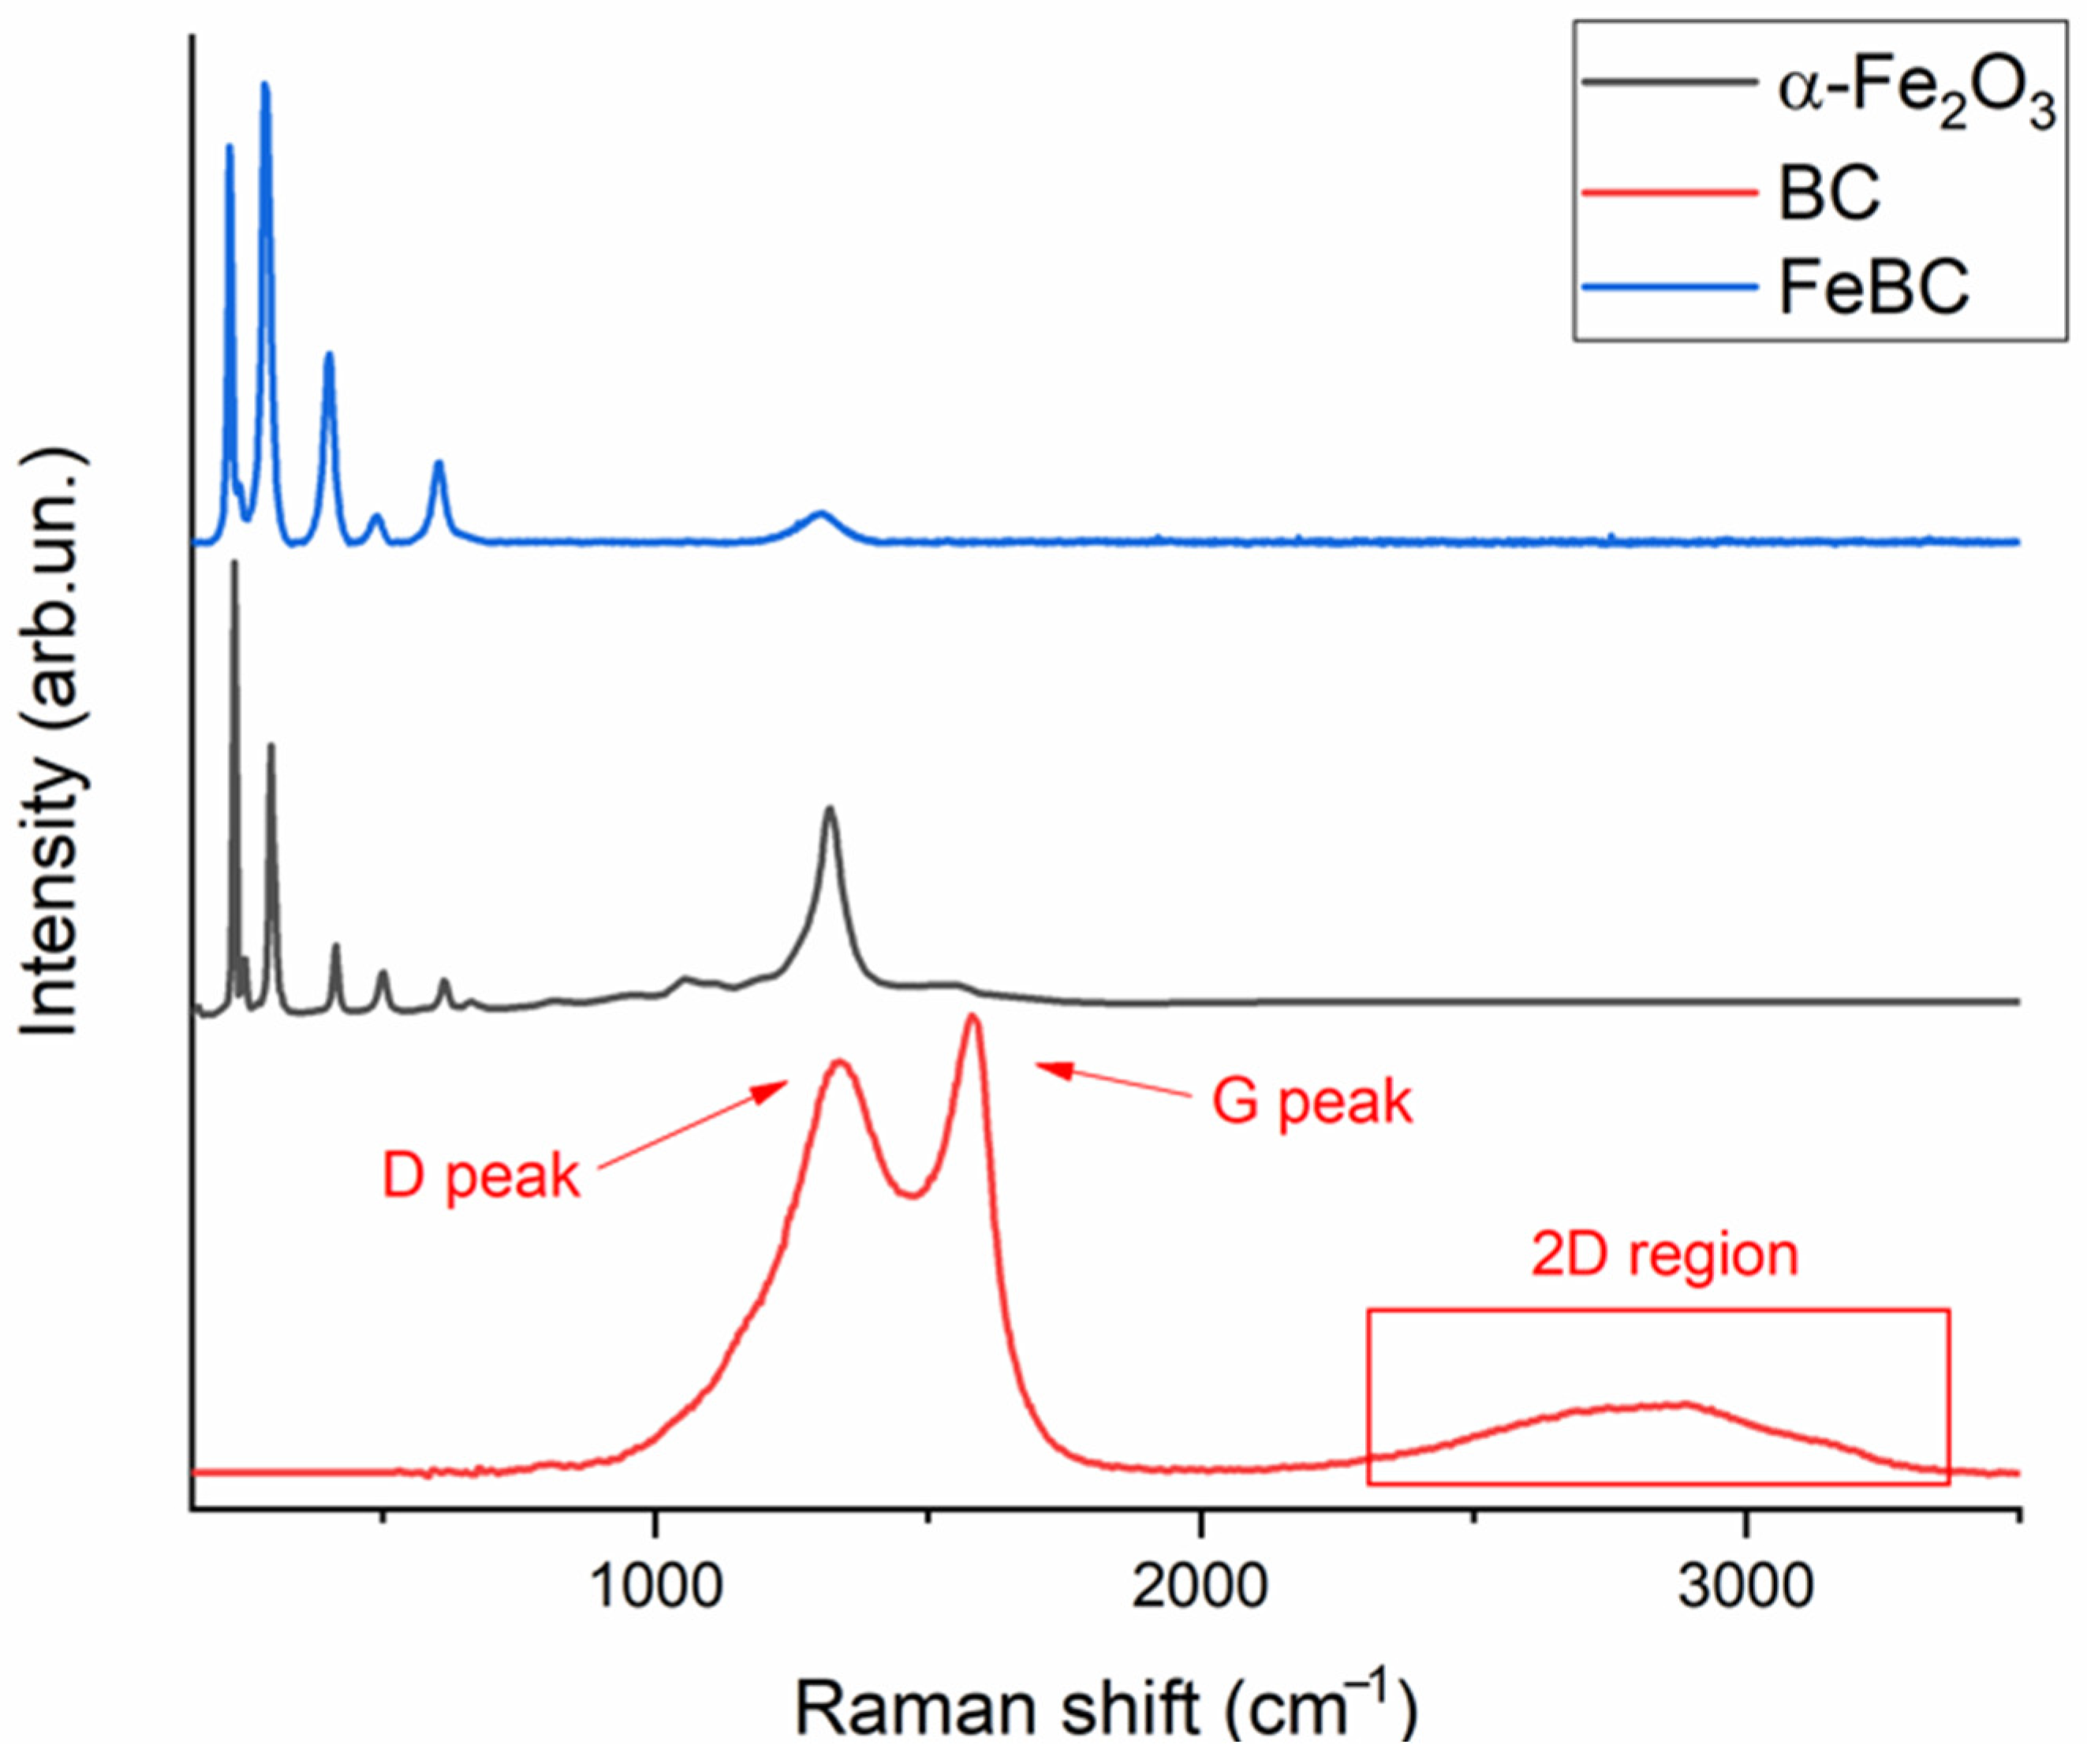
Raman spectra of the biochar and the Fe@BC materials are shown in Figure 3. In the biochar spectrum, the characteristic D and G peaks of carbonaceous materials can be observed with a not very intense 2D band. The ID/IG ratio (equal to 2.07, as reported in Table S1 in the Supplementary Materials, and the fit is depicted in Figure S2) is high, suggesting a highly disordered structure with a crystalline size of up to 22.2 Å.
The absence of distinct carbon peaks in the Raman spectrum of Fe@BC filler can be attributed to several factors. Firstly, during the thermal reduction process, carbon undergoes transformation into gaseous CO and CO2, resulting in a decreasing carbon content within the synthesized material. Consequently, any carbon-related Raman signals are likely overshadowed by the more intense bands originating from other constituents.
Upon comparison with existing literature, the spectrum aligns with that of hematite (α-Fe2O3) [44], showcasing seven phonon dispersion bands: 2 A1g (at 220 and 491 cm−1) and 5 Eg (at 238, 283, 288, 402, and 613 cm−1) as reported in the Supplementary Materials (Table S3). The feature at 1306 cm−1 is assigned to a two-magnon scattering, which arises from the interaction of two magnons created on antiparallel close spin sites [45]. However, the slight shifts observed in these bands indicate potential structural variations within the synthesized material. One possible explanation for these shifts is the presence of structural heterogeneities at the material interface, as perfect crystallinity is rarely achieved in synthesized materials. These interface effects can introduce strain fields, causing deviations of phonon frequencies from their ideal values.
Additionally, the broadening of Raman bands could be attributed to the presence of residual carbon within the material. When carbon is introduced into the material matrix, it interacts with neighboring atoms and alters their electronic structure. This interaction modifies the vibrational modes of the material, leading to shifts and broadening of Raman peaks.
The phenomenon known as the “π-polarization effect” further contributes to the broadening of Raman bands. In materials containing carbon, the pi-electron cloud undergoes polarization upon excitation, inducing changes in the local electric field. This polarization effect modifies the scattering cross-section of the material, resulting in enhanced Raman scattering intensity and broadening of Raman bands [46]. The introduction of carbon alters the local electronic and vibrational properties, leading to a broadening of Raman peaks.
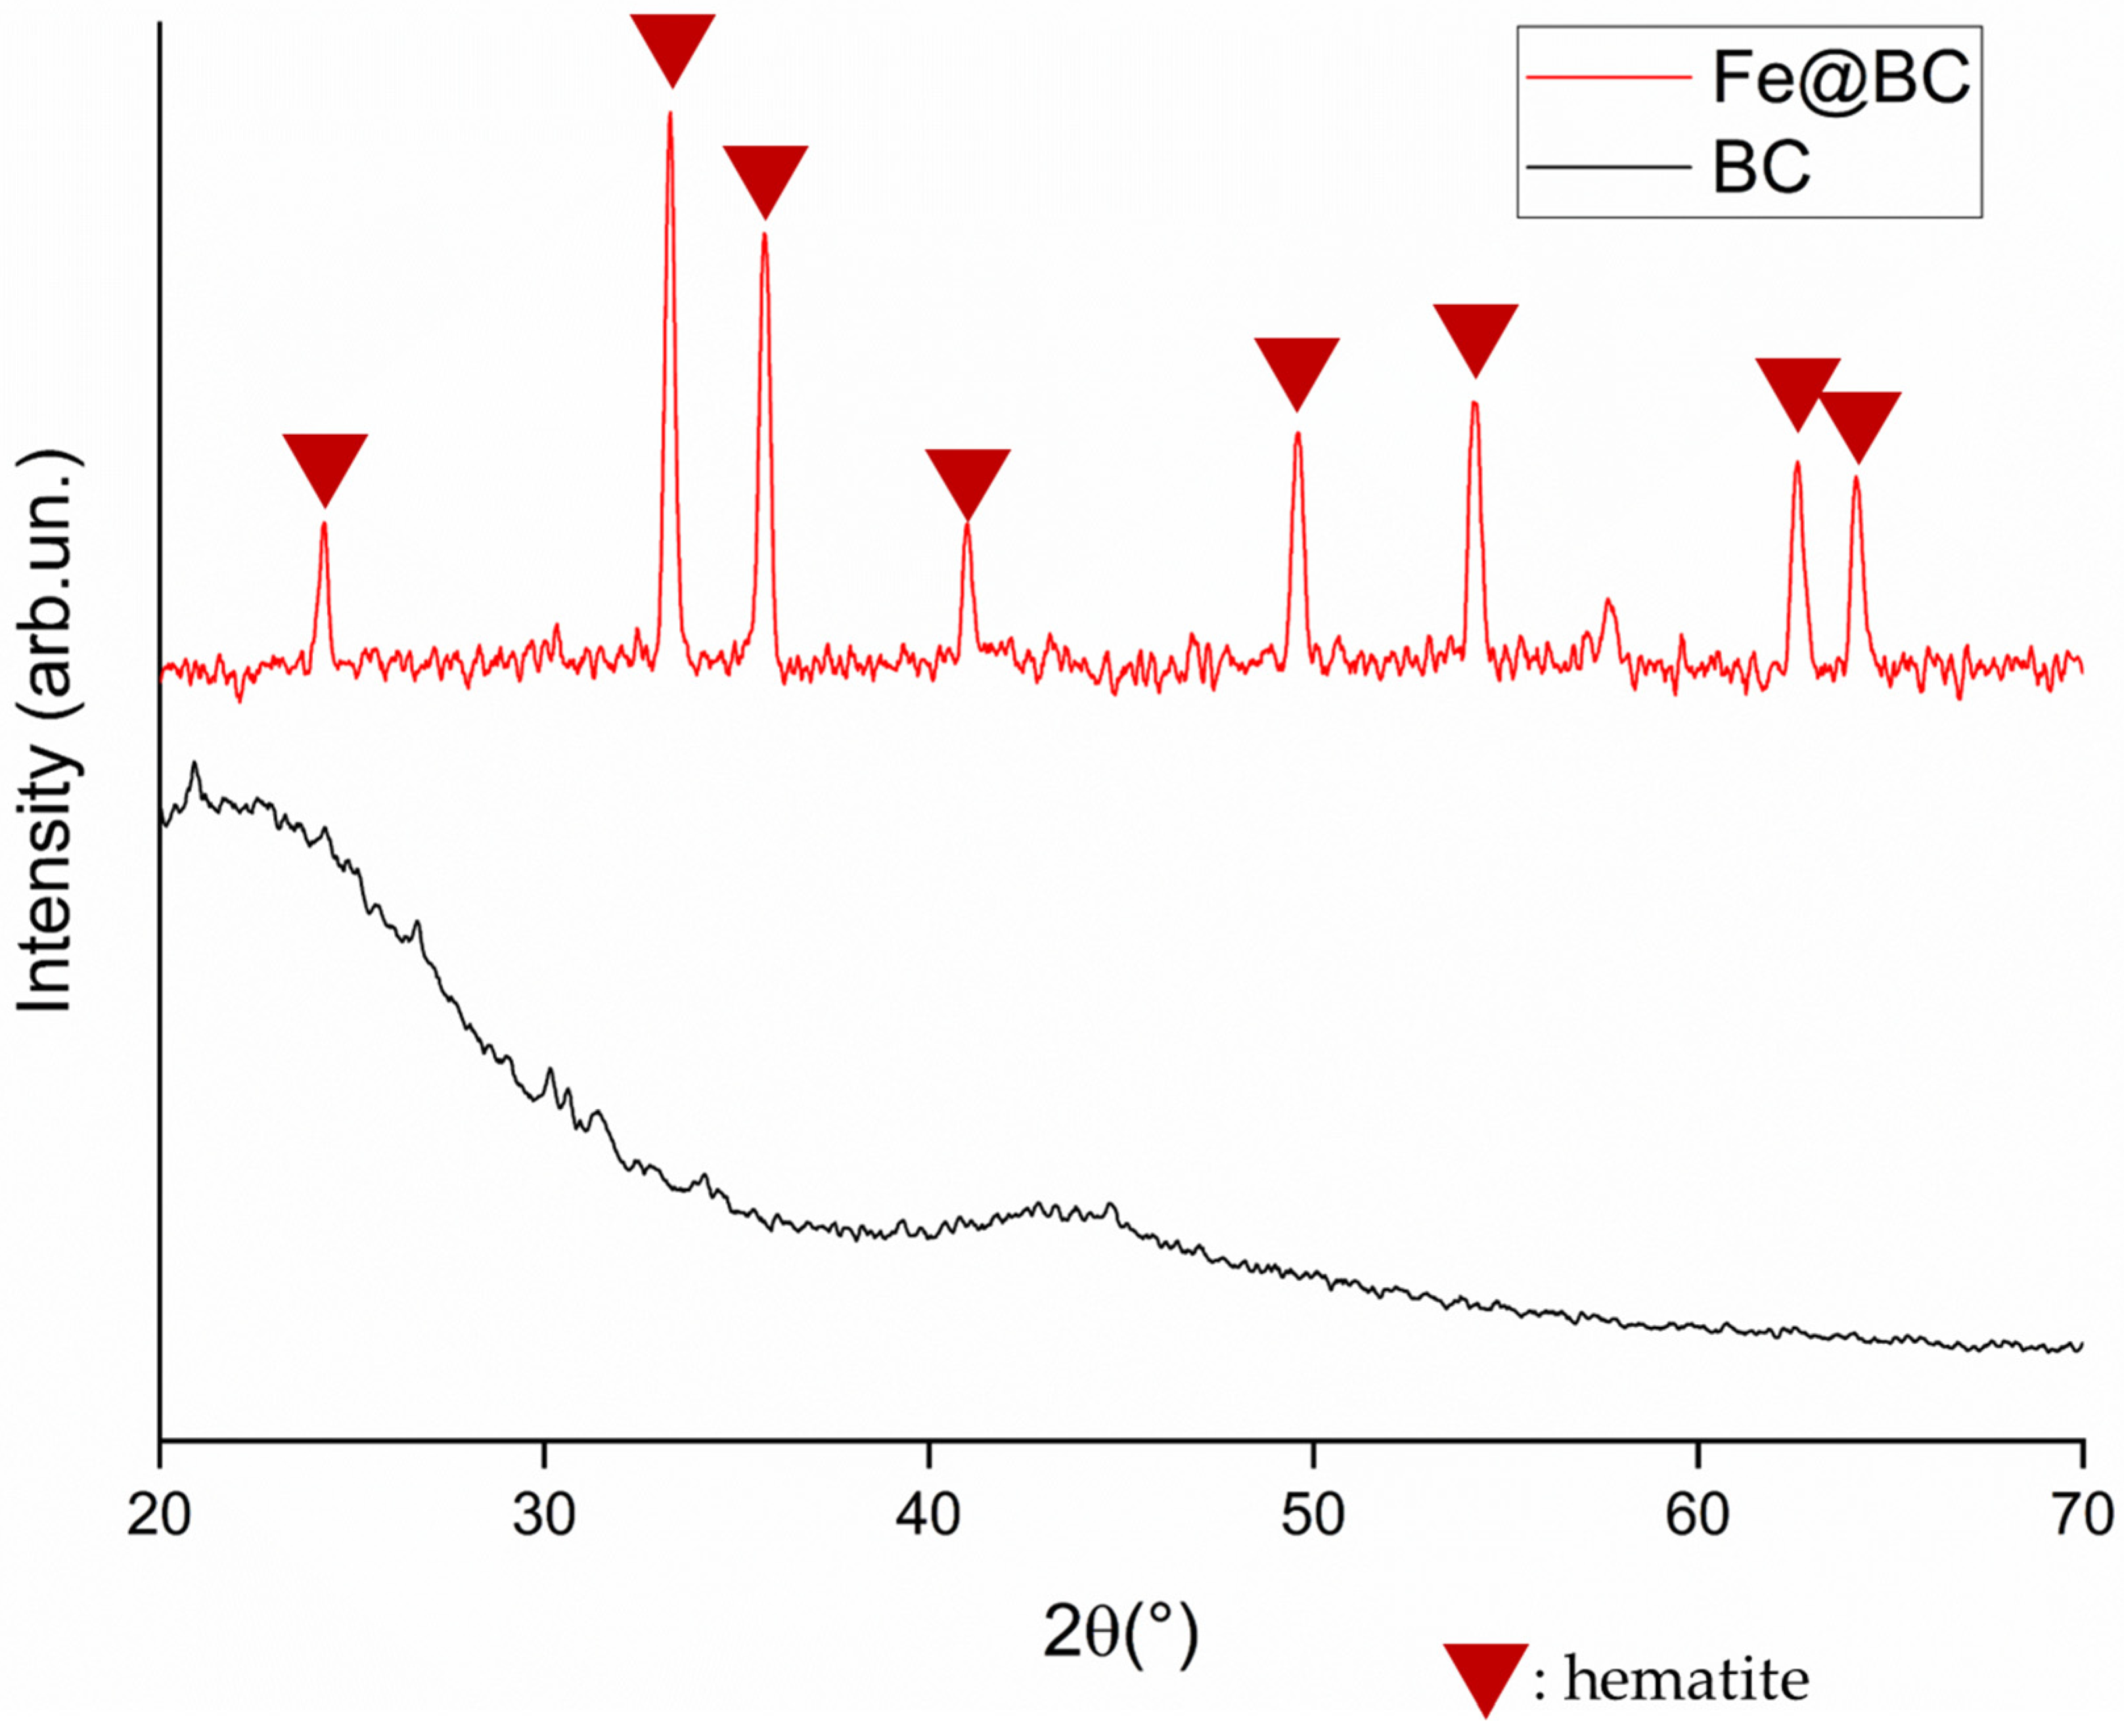
As reported in Figure 4, the XRD pattern of BC is compatible with the presence of disorganized carbon, with a broad band up to 30°, while the Fe@BC shows a crystalline pattern of hematite in good agreement with Raman data with a crystalline size of 5.7 Å.
As reported in the Supplementary Materials (Figure S3), the TGA of Fe@BC does not show any significant change in either an oxidizing or inert atmosphere, confirming the presence of only hematite. In contrast, BC shows a degradative stage at 550 °C due to the degradation of aromatic moieties in O2.

3.2. Mechanical Properties

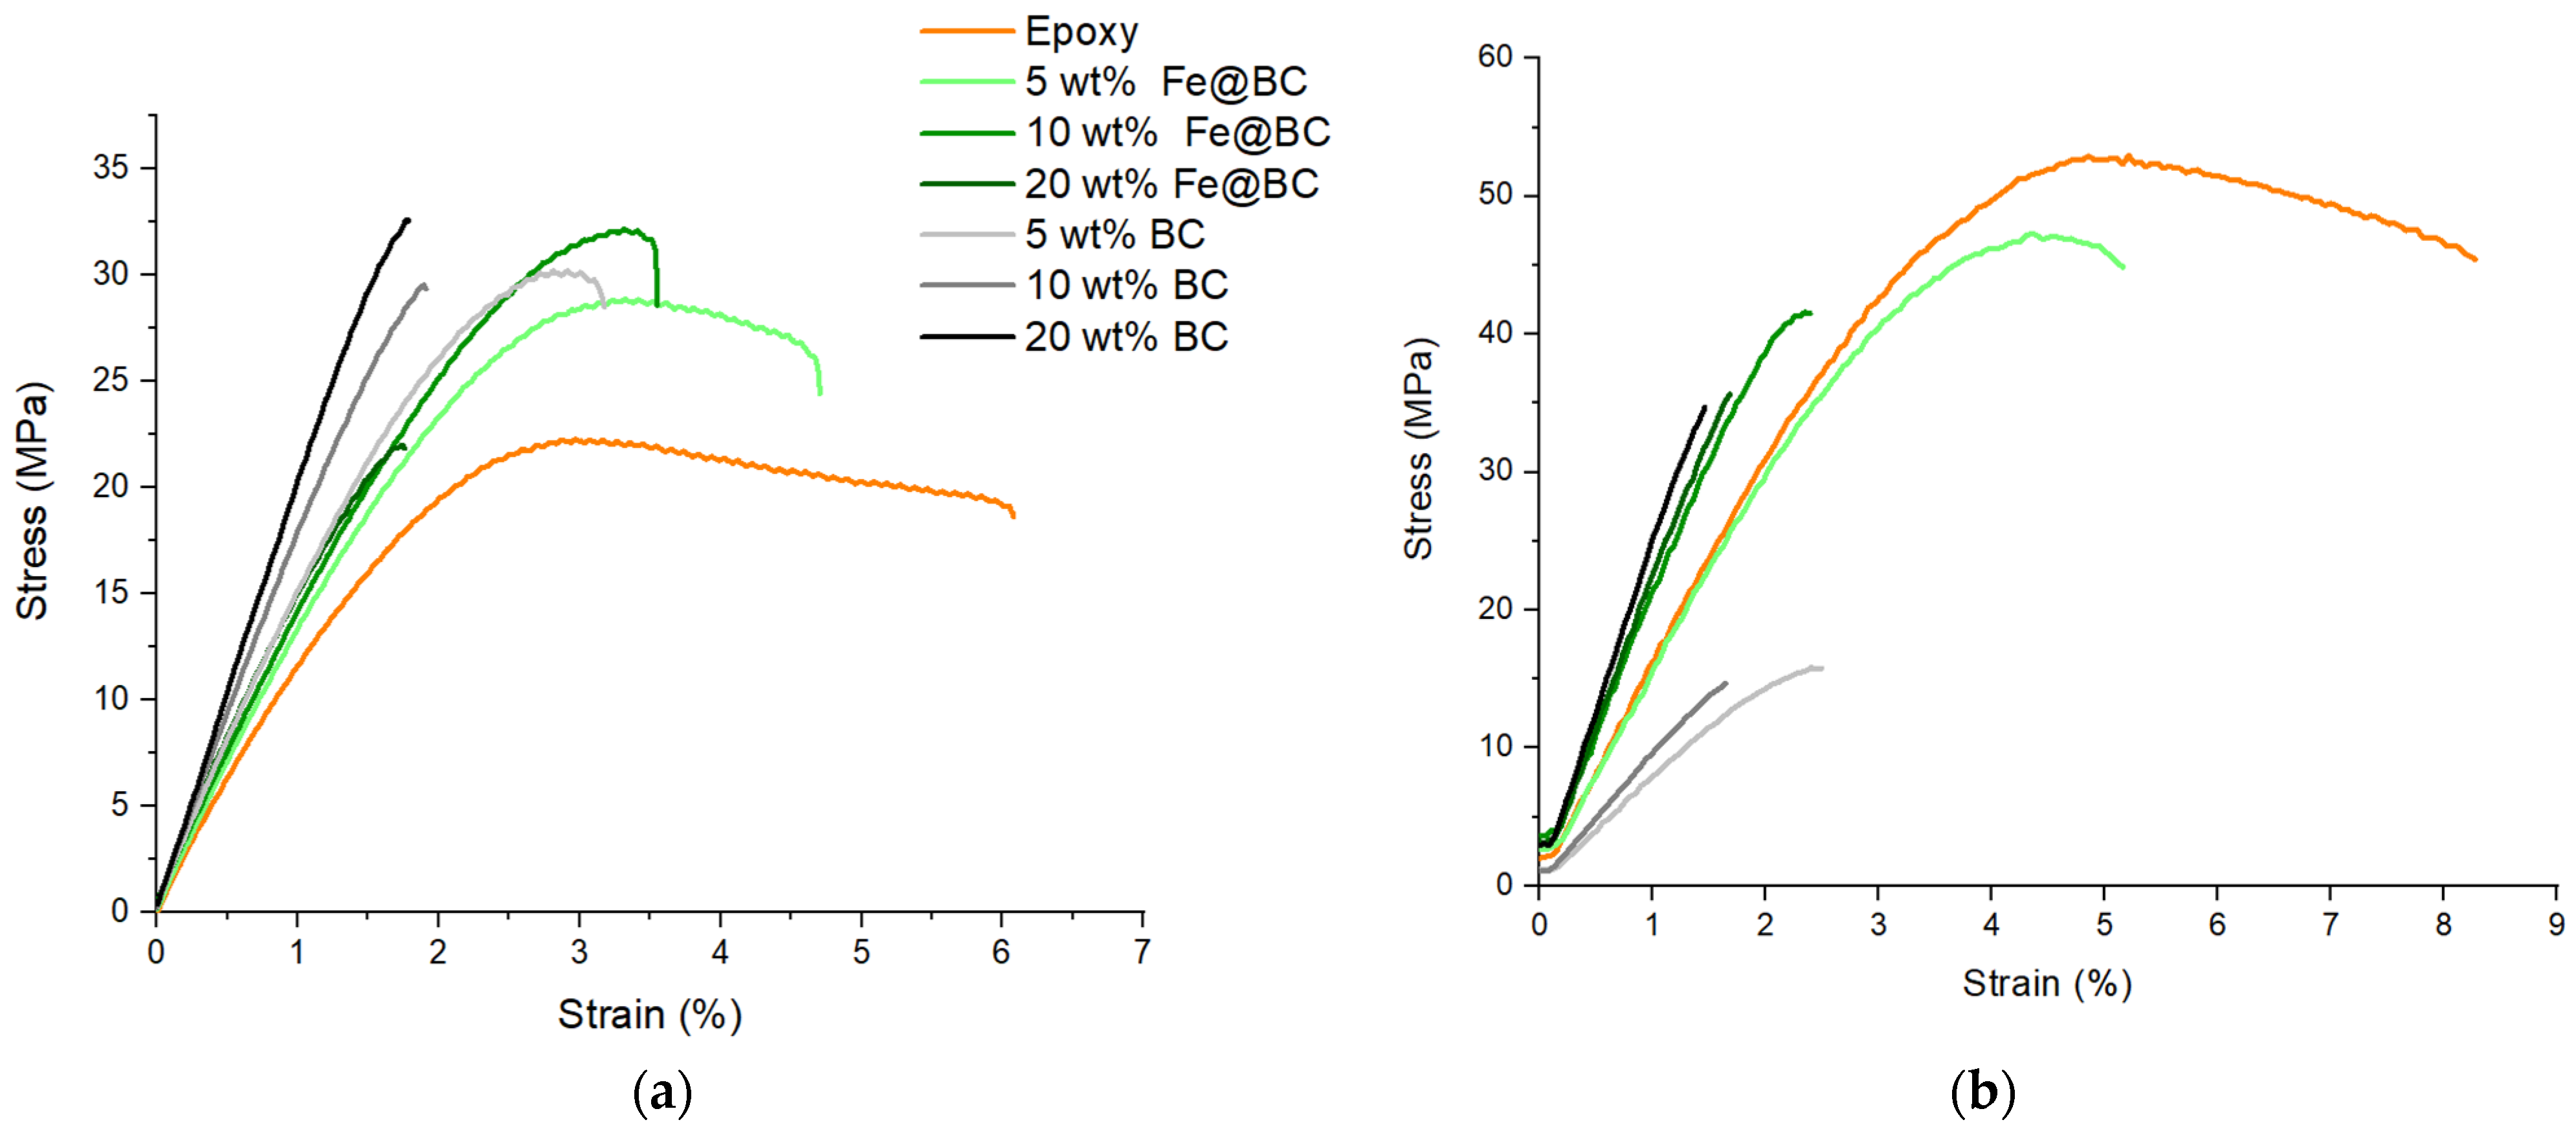
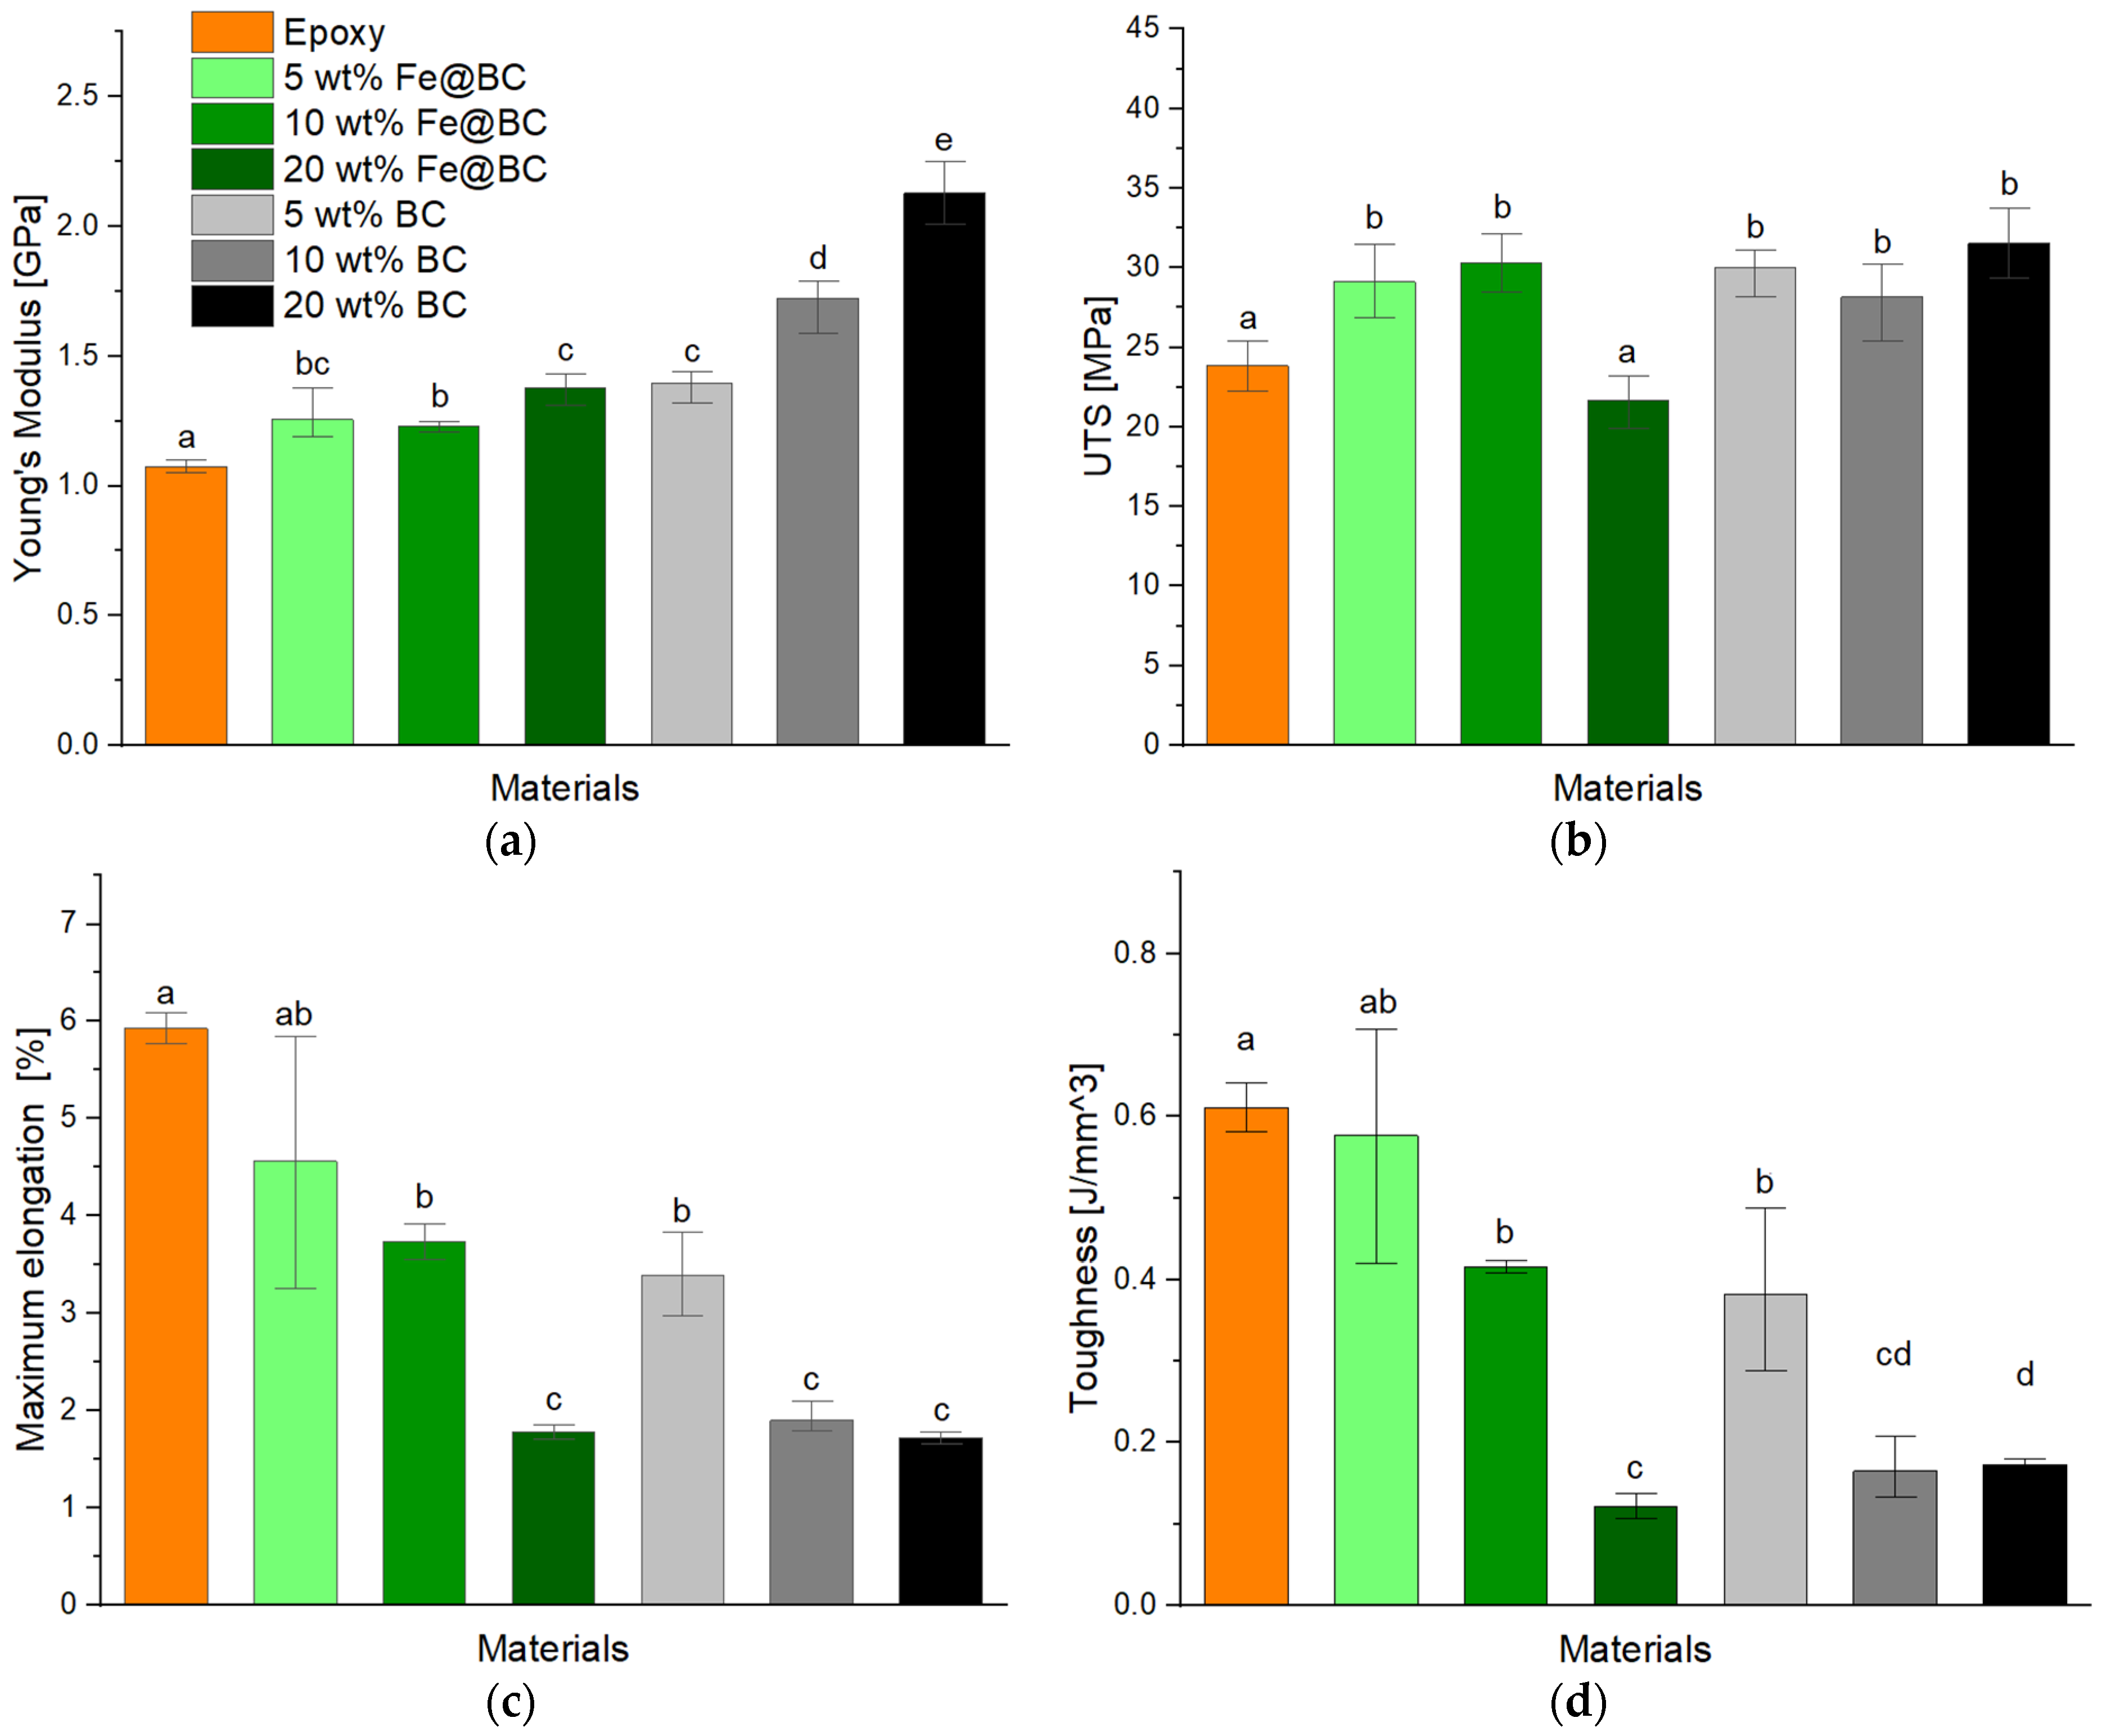
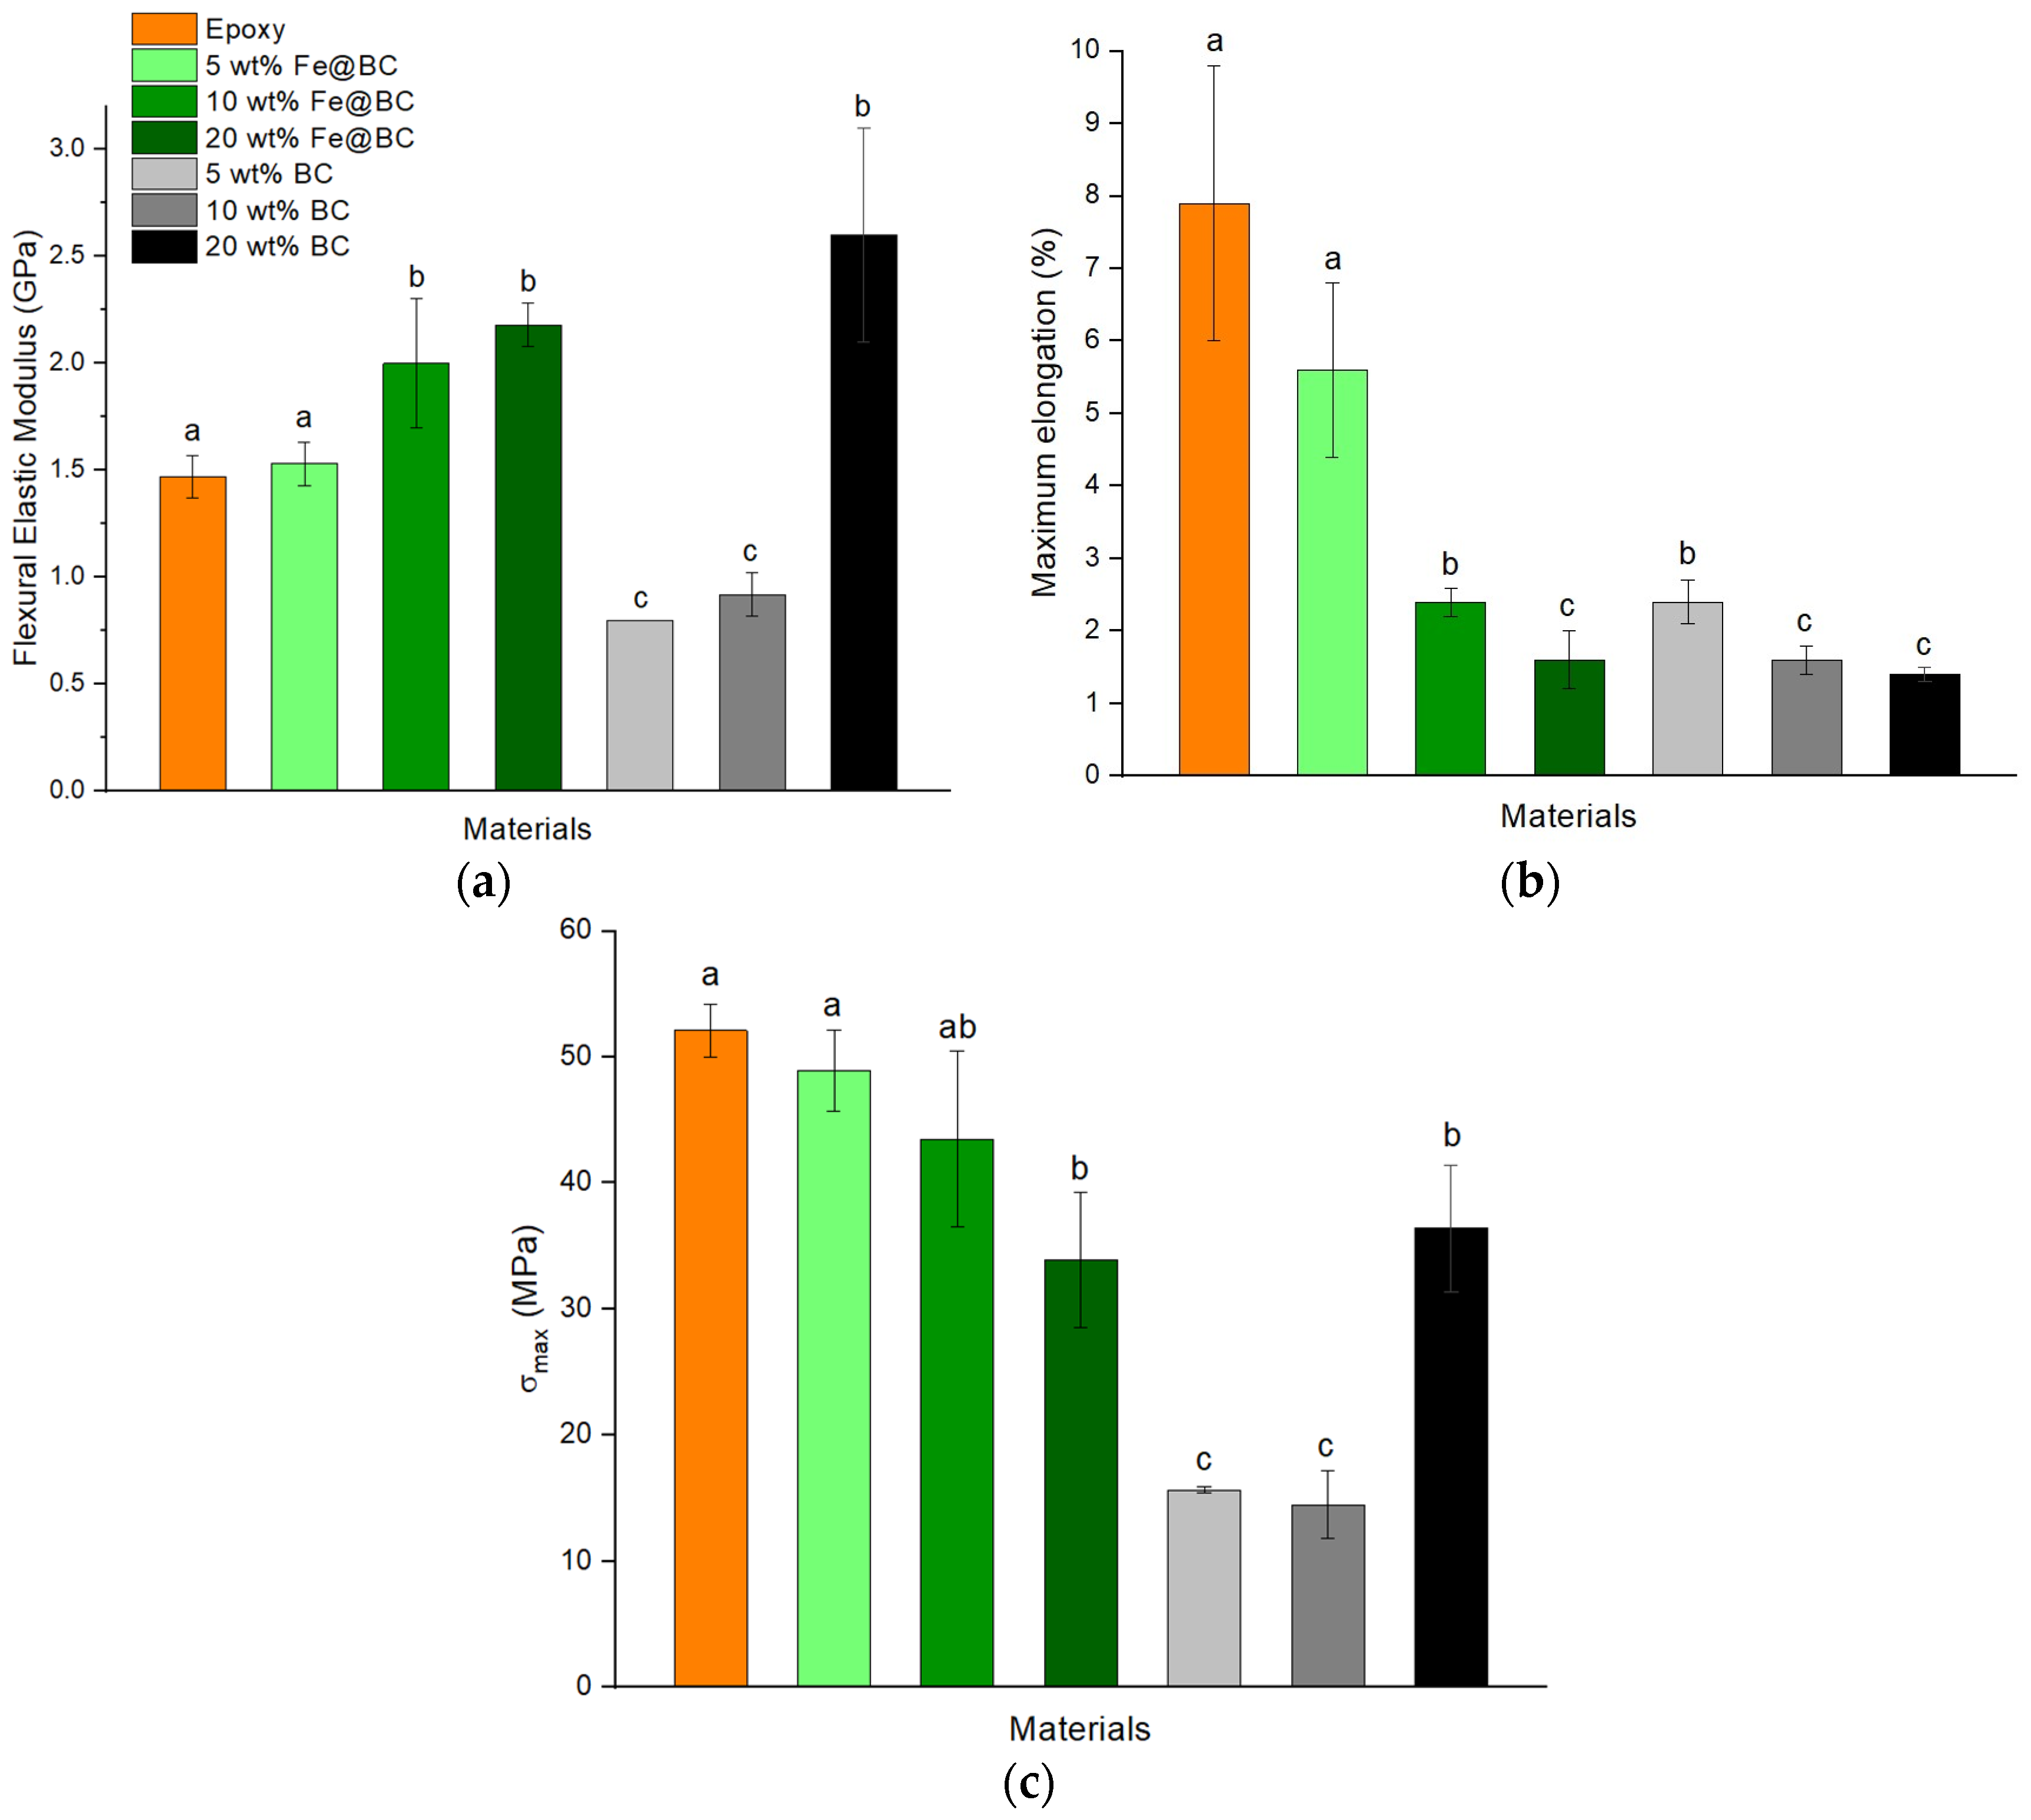
Dog-bone and bar samples were produced according to the methods described above using filler concentrations of 5 wt.%, 10 wt.%, and 20 wt.%. Specimens were analyzed through tensile and flexural tests, producing the curves reported in Figure 5, while the properties are reported in Figure 6 and Figure 7.
The Spearman correlation coefficient, often denoted as ρ (rho), was calculated for the elastic modulus, maximum stress, elongation at break, and fracture toughness, both under tensile and flexural stress (Table 3 and Table 4). Ρ is a statistical measure of the strength and direction of association between two ranked variables. It assesses how well the relationship between two variables can be described using a monotonic function. Unlike Pearson’s correlation coefficient, which measures linear relationships, Spearman’s coefficient can capture nonlinear relationships as well.
All the values exceed 0.8, apart from in the case of biochar in which the corresponding coefficients for the maximum stress under tension and flexion are relatively low, registering −0.254 and 0.731, respectively, indicating that there is not a clear correlation among the data obtained.
Pure epoxy resin was characterized by a Young’s modulus (YM) of 1.1 ± 0.0 GPa, an ultimate tensile strength (UTS) of 23.8 ± 1.6 MPa, and a maximum elongation of 5.9 ± 0.2%. Furthermore, the toughness values were reported to be up to 0.61 ± 0.03 MJ/m3. Hybrid composites showed a general improvement in YM, reaching a maximum value of up to 1.4 ± 0.1 GPa with a filler concentration of 20 wt.%. Consequently, with a filler loading of 20 wt.%, an increase in the YM property of 27% was achieved. At the same time, there was also an increase compared to neat epoxy for the other two filler concentrations: 1.3 ± 0.1 GPa for 5 wt.% and 1.2 ± 0.0 GPa for 10 wt.%.
Using a filler loading of 5 wt.%, the UTS significantly increased compared to neat resin, reaching a value of 29.1 ± 2.3 MPa. Furthermore, an increase to 10 wt.% led to further growth of this property up to a value of 30.3 ± 1.8 MPa, achieving a gain of 27% compared with epoxy. However, a further addition to 20 wt.% induced a decrease to 21.7 ± 1.7 MPa. Similar results were reported by Minugu et al. [47] and also by Ahmetli et al. [48]. Investigating tensile properties of epoxy samples with different concentrations of biochar, they explained the results obtained with two considerations. The resistance offered by the material when the tensile loads are applied is due to the interlocking and adhesion bonds between the matrix and biochar filler. So, the enhanced strength observed with the addition of biochar may be attributed to the penetration of polymer resin into the pores present on the surface of the biochar filler particles, forming a mechanical interlock. The decrease in composite strength can be attributed to the elevated filler loading, which resulted in a lack of effective bonding between the particles and resin due to inadequate wettability. Furthermore, the inadequate mixing of the filler and resin further weakened their interfacial bonding. As a result, the distribution of stress between the matrix and filler became compromised, ultimately leading to a reduction in strength.
A ductile behavior was achieved for both hybrid composites with filler concentrations of 5 wt.% and 10 wt.%. For the former, a maximum elongation value of 4.6 ± 1.3% was reached, while for the latter, a value of 3.7 ± 0.2% was achieved. However, an additional quantity of filler led to a decrease in the maximum elongation, with a value of 1.8 ± 0.1% for 20 wt.%.
The other property evaluated, toughness, exhibited a trend for the hybrid composites. The highest value was achieved with a filler loading of 5 wt.%, reaching 0.58 ± 0.14 MJ/m3. However, the property decreased with the addition of a larger quantity of filler, achieving 0.42 ± 0.01 MJ/m3 for 10 wt.% and 0.12 ± 0.02 MJ/m3 for 20 wt.%.
Organic composites showed a significant improvement in YM, reaching a maximum value of up to 2.1 ± 0.1 GPa with a concentration of 20 wt.%. This represents an improvement of 90%. Moreover, there was also an increase in YM compared to neat epoxy for the other two filler concentrations: 1.4 ± 0.1 GPa for 5 wt.% and 1.7 ± 0.1 GPa for 10 wt.%.
UTS values were higher than those of neat epoxy resin. The highest increase was observed for 20 wt.%, reaching a value up to 31.5 ± 2.2 MPa, that compared with neat epoxy expressed a gain of 32%. Furthermore, significant values were achieved for lower filler content, with a value of 28.2 ± 2.4 MPa obtained for 10 wt.% and 30.0 ± 1.5 MPa for 5 wt.%. A more in-depth analysis should be conducted to better understand this phenomenon. The minimum value observed for an intermediate filler content suggests two competing mechanisms of failure, one occurring for high filler loading and the other for lower filler content. According to Zuccarello et al. [49] a low concentration of biochar acts as a microsized structural defect in the epoxy resin matrix while a high concentration prevents a proper reticulation, inducing brittleness.
A general decrease in maximum elongation was observed. The material remained ductile at a concentration of 5 wt.%, reaching a maximum elongation value of up to 3.4 ± 0.4%. However, increasing the filler concentration led to embrittlement of the composite, with maximum elongation values of 1.9 ± 0.2% at 10 wt.% and 1.7 ± 0.1% at 20 wt.%.
Furthermore, toughness values were lower across all concentrations, with the peak value of 0.39 ± 0.10 MJ/m3 attained at 5 wt.%. This trend can be attributed to the lower maximum elongation values associated with these filler loadings, which consequently result in a reduced area under the stress–strain curves.
For the flexural test (Figure 5b), neat epoxy exhibited ductile behavior, featuring a flexural elastic modulus of 1.5 ± 0.1 GPa, a maximum stress of 52.1 ± 2.1 MPa, and a maximum elongation of 7.9 ± 1.9%.
Both hybrid and organic composites demonstrated the expected trend, characterized by an increase in flexural elastic modulus for most specimens and a decrease in maximum elongation as the filler loading increased.
In hybrid composites, adding a greater quantity of filler led to an increase in the flexural elastic modulus. The peak of this parameter was reached at 20 wt.%, with a value up to 2.2 ± 0.1 GPa, representing a 47% increase compared to neat epoxy. However, this property decreased in specimens with 10 wt.% filler, with a value of 2.0 ± 0.3 GPa, and reached its minimum at 5 wt.%, with 1.5 ± 0.1 GPa.
With regard to the maximum stresses reached during the test, all the composites exhibited a decrease in this parameter. The optimal behavior was observed for 5 wt.%, with a maximum stress of 48.9 ± 3.2 MPa. Increasing the filler quantity resulted in a reduction of this parameter to 43.5 ± 7.0 MPa for 10 wt.% and 33.9 ± 5.4 MPa for 20 wt.%.
As previously mentioned, the maximum flexural elongation also exhibited a clear trend related to the wt.% of filler. As the filler loading increased, a decrease in maximum elongation was observed. For this reason, the best result was obtained with a filler loading of 5 wt.%, reaching a value of up to 5.6 ± 1.2%. Subsequently, a value of 2.4 ± 0.2% was achieved for 10 wt.% and 1.6 ± 0.4% for 20 wt.%.
In organic composites, a different trend was observed. For low filler loadings, a decrease in flexural elastic modulus was recorded, with values of 0.8 ± 0.0 GPa for 5 wt.% and 0.9 ± 0.1 GPa for 10 wt.%. The property increased for higher filler loadings; for 20 wt.%, a value of 2.6 ± 0.5 GPa was observed. This trend was also reported by Matykiewicz [43].
Moreover, the same situation occurred as regards maximum stresses reached during the test, with the highest value 36.4 ± 5.0 MPa reached for 20 wt.%. A decrease with respect to neat epoxy was observed in the other specimens with different filler loading. For 5 wt.% a value of 15.7 ± 0.2 MPa was registered while for 10 wt.% a value of 14.5 ± 2.7 MPa was achieved. The flexural strength of the composite primarily depends on the particle dispersion and the wetting and infiltration of the polymer into these particles. Therefore, the increase could be attributed to the presence of rigid biochar with a large surface area within the epoxy matrix [43,50].
As noted earlier, the maximum flexural elongation displayed a clear pattern related to the filler’s weight percentage. With higher filler loading, there was a reduction in maximum elongation. Consequently, the most favorable outcome was attained with a filler loading of 5 wt.%, reaching up to 2.4 ± 0.3%. Following this, a value of 1.6 ± 0.2% was obtained for 10 wt.%, and 20 wt.% also yielded 1.4 ± 0.1%.
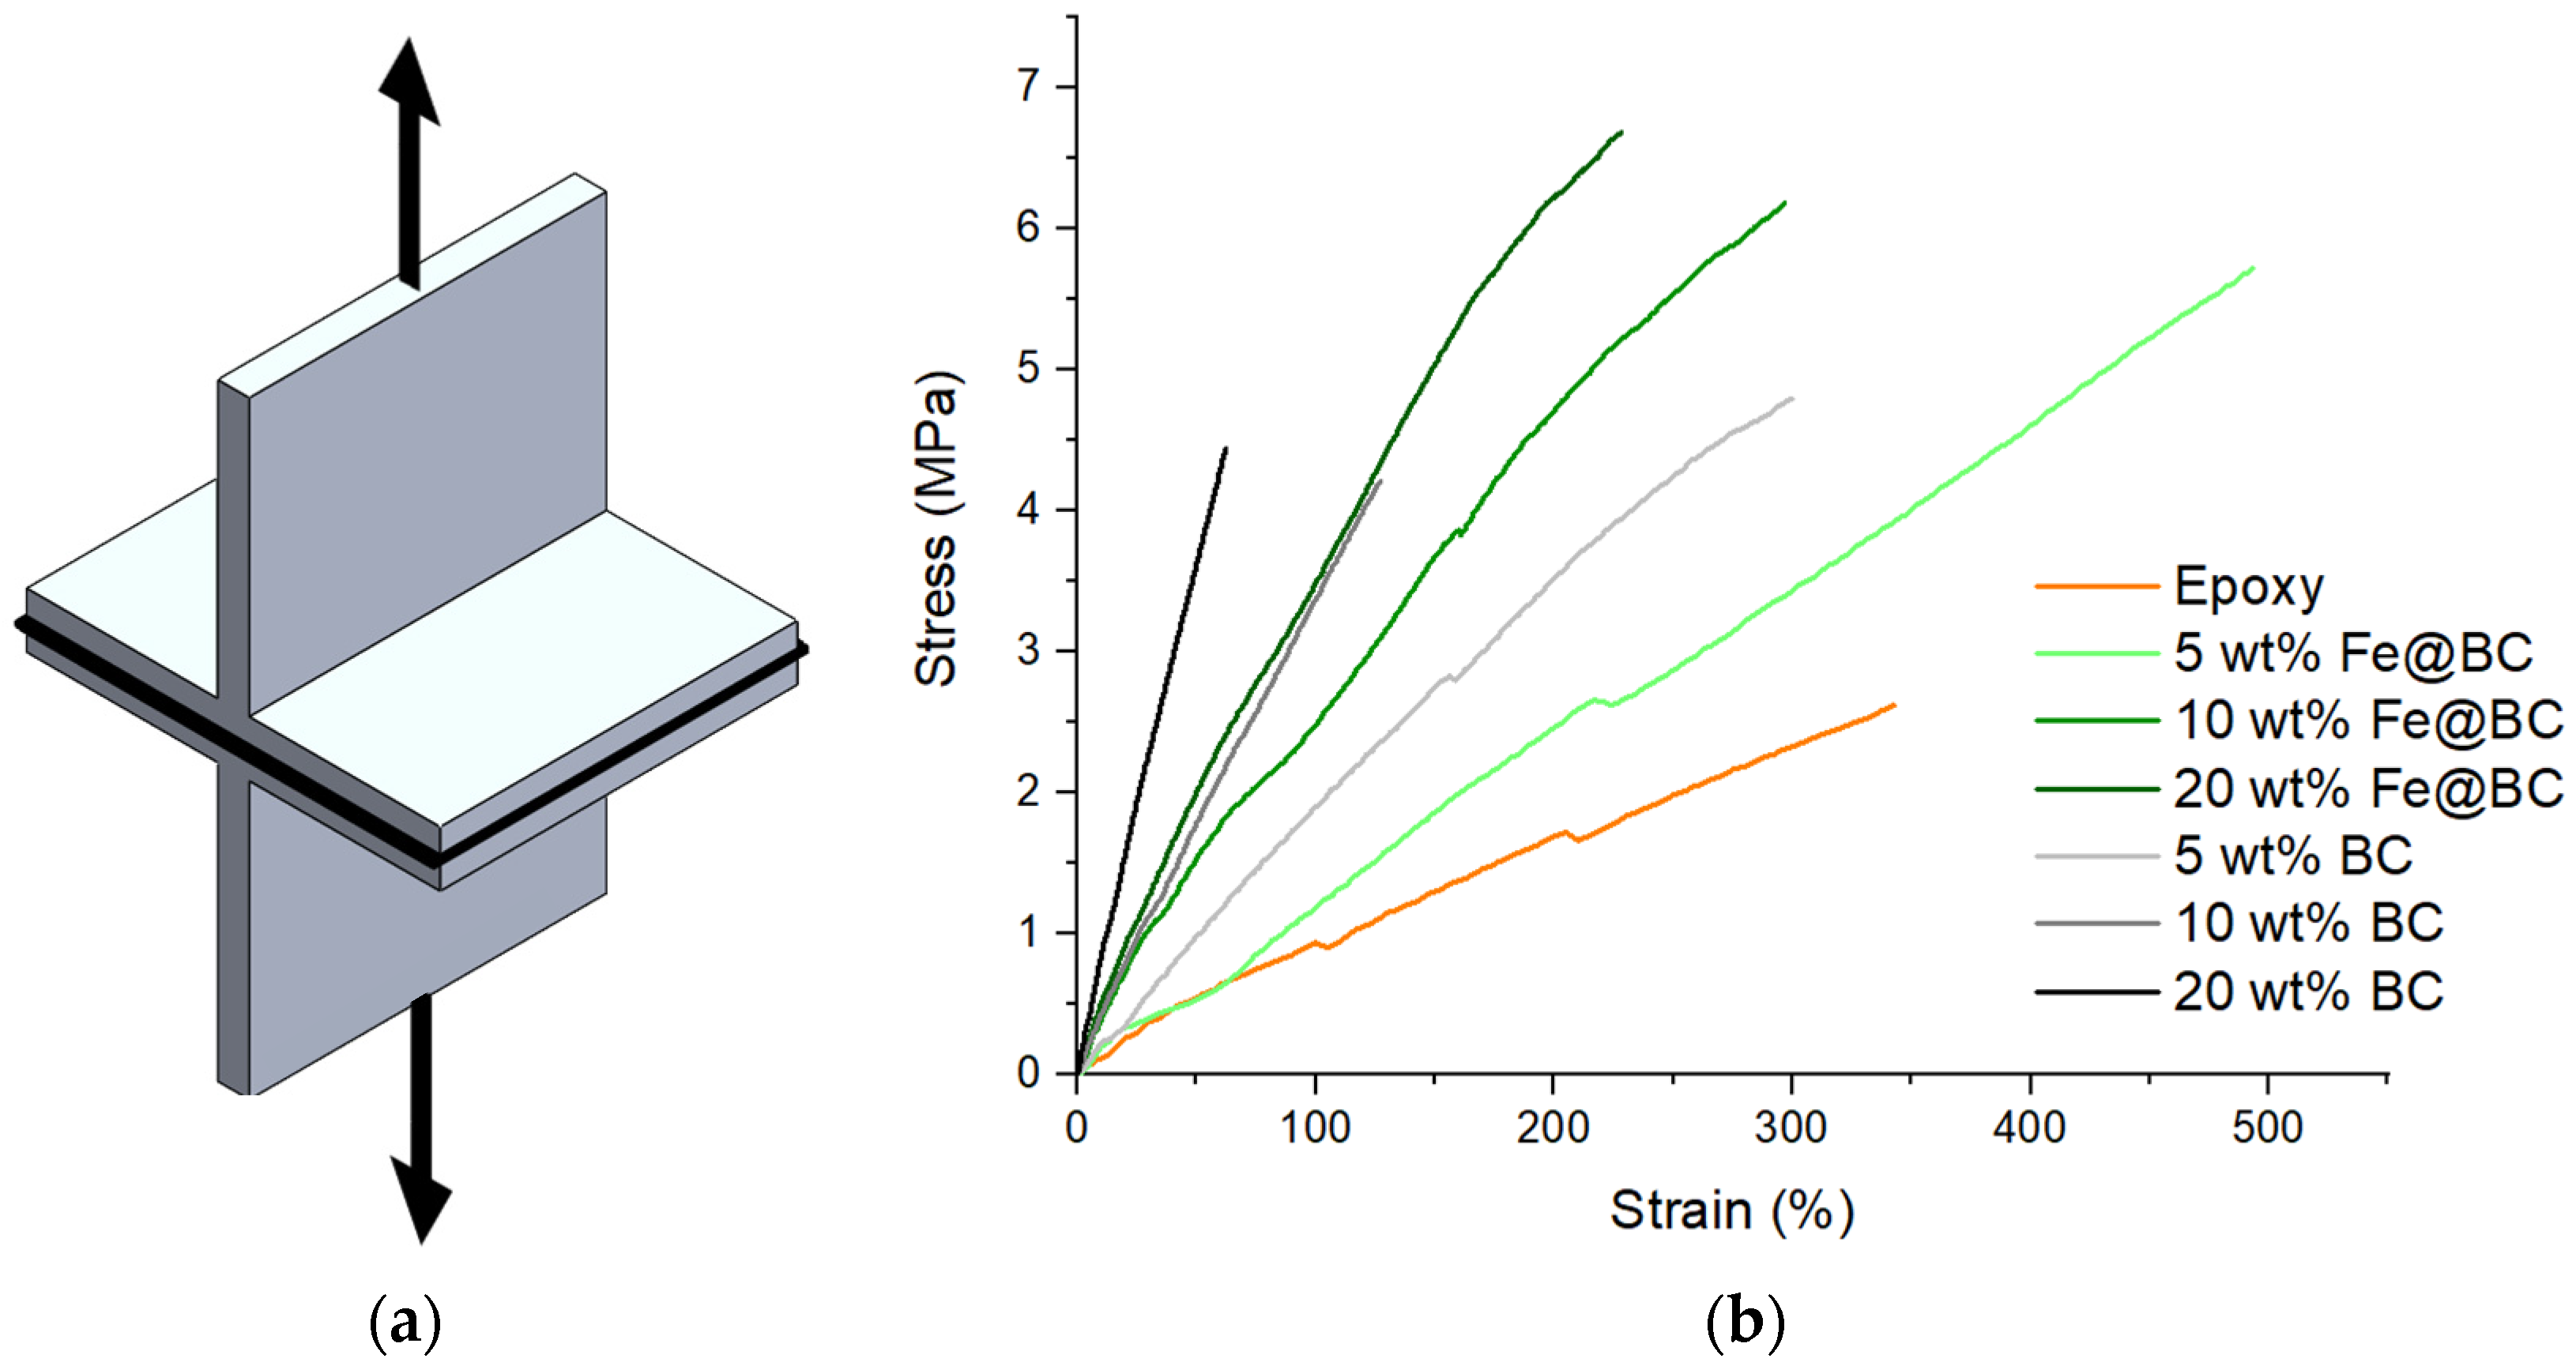
Additionally, an adhesion test was performed to investigate the bonding of the composites with metal. A novel methodology was employed, utilizing a new type of specimen. For clarity on the test setup, a depiction of the specimen is provided in Figure 8a. Tensile testing was conducted on these specimens, and the results are shown in Figure 8b.
Furthermore, to assess adhesion properties, an energetic parameter was evaluated. This parameter was derived from the force–displacement curves, where the area under these curves represents the energy required to rupture the bond. Moreover, to facilitate comparison between materials and fillers at various loadings, the evaluated energy was normalized to a unit volume, resulting in a value in J/m3.
Referring to Figure 8b, the adhesion property evaluation reveals that the neat epoxy exhibited a baseline value of 5.4 ± 0.5 MJ/m3. A consistent trend was observed across all specimen families: an increase in filler loading corresponded to a decrease in this property.
Hybrid composites demonstrated significant enhancement. The peak adhesion value was achieved with a filler loading of 5 wt.%, reaching up to 14.8 ± 1.0 MJ/m3. This filler loading led to a 174% increase in adhesion property. However, the other two filler loadings also surpassed the epoxy resin, but experienced a decline compared to 5 wt.% Fe@BC. Specifically, for the 10 wt.% concentration, a value of 12.5 ± 1.6 MJ/m3 was attained while the 20 wt.% concentration recorded 7.4 ± 1.4 MJ/m3.
Similarly, organic composites exhibited a parallel trend. Unlike hybrid composites, not all specimens showed an increase in adhesion property. The optimal value in this scenario was also observed at 5 wt.% loading, achieving 7.7 ± 1.9 MJ/m3. Conversely, both 10 wt.% and 20 wt.% specimens experienced a decline in adhesion property, with values dropping to 3.5 ± 1.4 MJ/m3 for the former and 1.9 ± 0.3 MJ/m3 for the latter.
Additionally, other critical properties, such as UTS and maximum elongation, were assessed, both of which exhibited enhancements compared to neat epoxy. The neat resin showed a maximum stress of 2.8 ± 0.2 MPa and a maximum elongation of 353 ± 10%.
In the case of hybrid composites, there was an increase in maximum stress, with the highest value observed at a filler loading of 20 wt.% reaching 6.2 ± 0.5 MPa. This filler loading resulted in a 121% increase in maximum stress. However, the other two filler loadings also showed substantial improvements, with values of 5.5 ± 0.4 MPa for 5 wt.% and 5.3 ± 0.9 MPa for 10 wt.%. Concurrently, maximum elongation experienced an uptick, reaching its peak at the 5 wt.% filler loading with a value of 483 ± 26%. Once more, the introduction of this filler resulted in a 37% increase in maximum elongation.
Similarly, organic composites demonstrated an increase in ultimate tensile strength (UTS), with the highest value of 4.9 ± 0.6 MPa observed at 5 wt.%. Repeatedly, incorporating this filler resulted in a significant enhancement of the adhesion property, reaching up to a 75% increase. The other two filler loadings also showed improvements, registering 4.3 ± 0.8 MPa for 10 wt.% and 4.7 ± 0.4 MPa for 20 wt.%. However, there was a decrease in maximum elongation for this family of composites, with the optimal value of 297 ± 28% observed at 5 wt.%.

3.3. Surface Properties

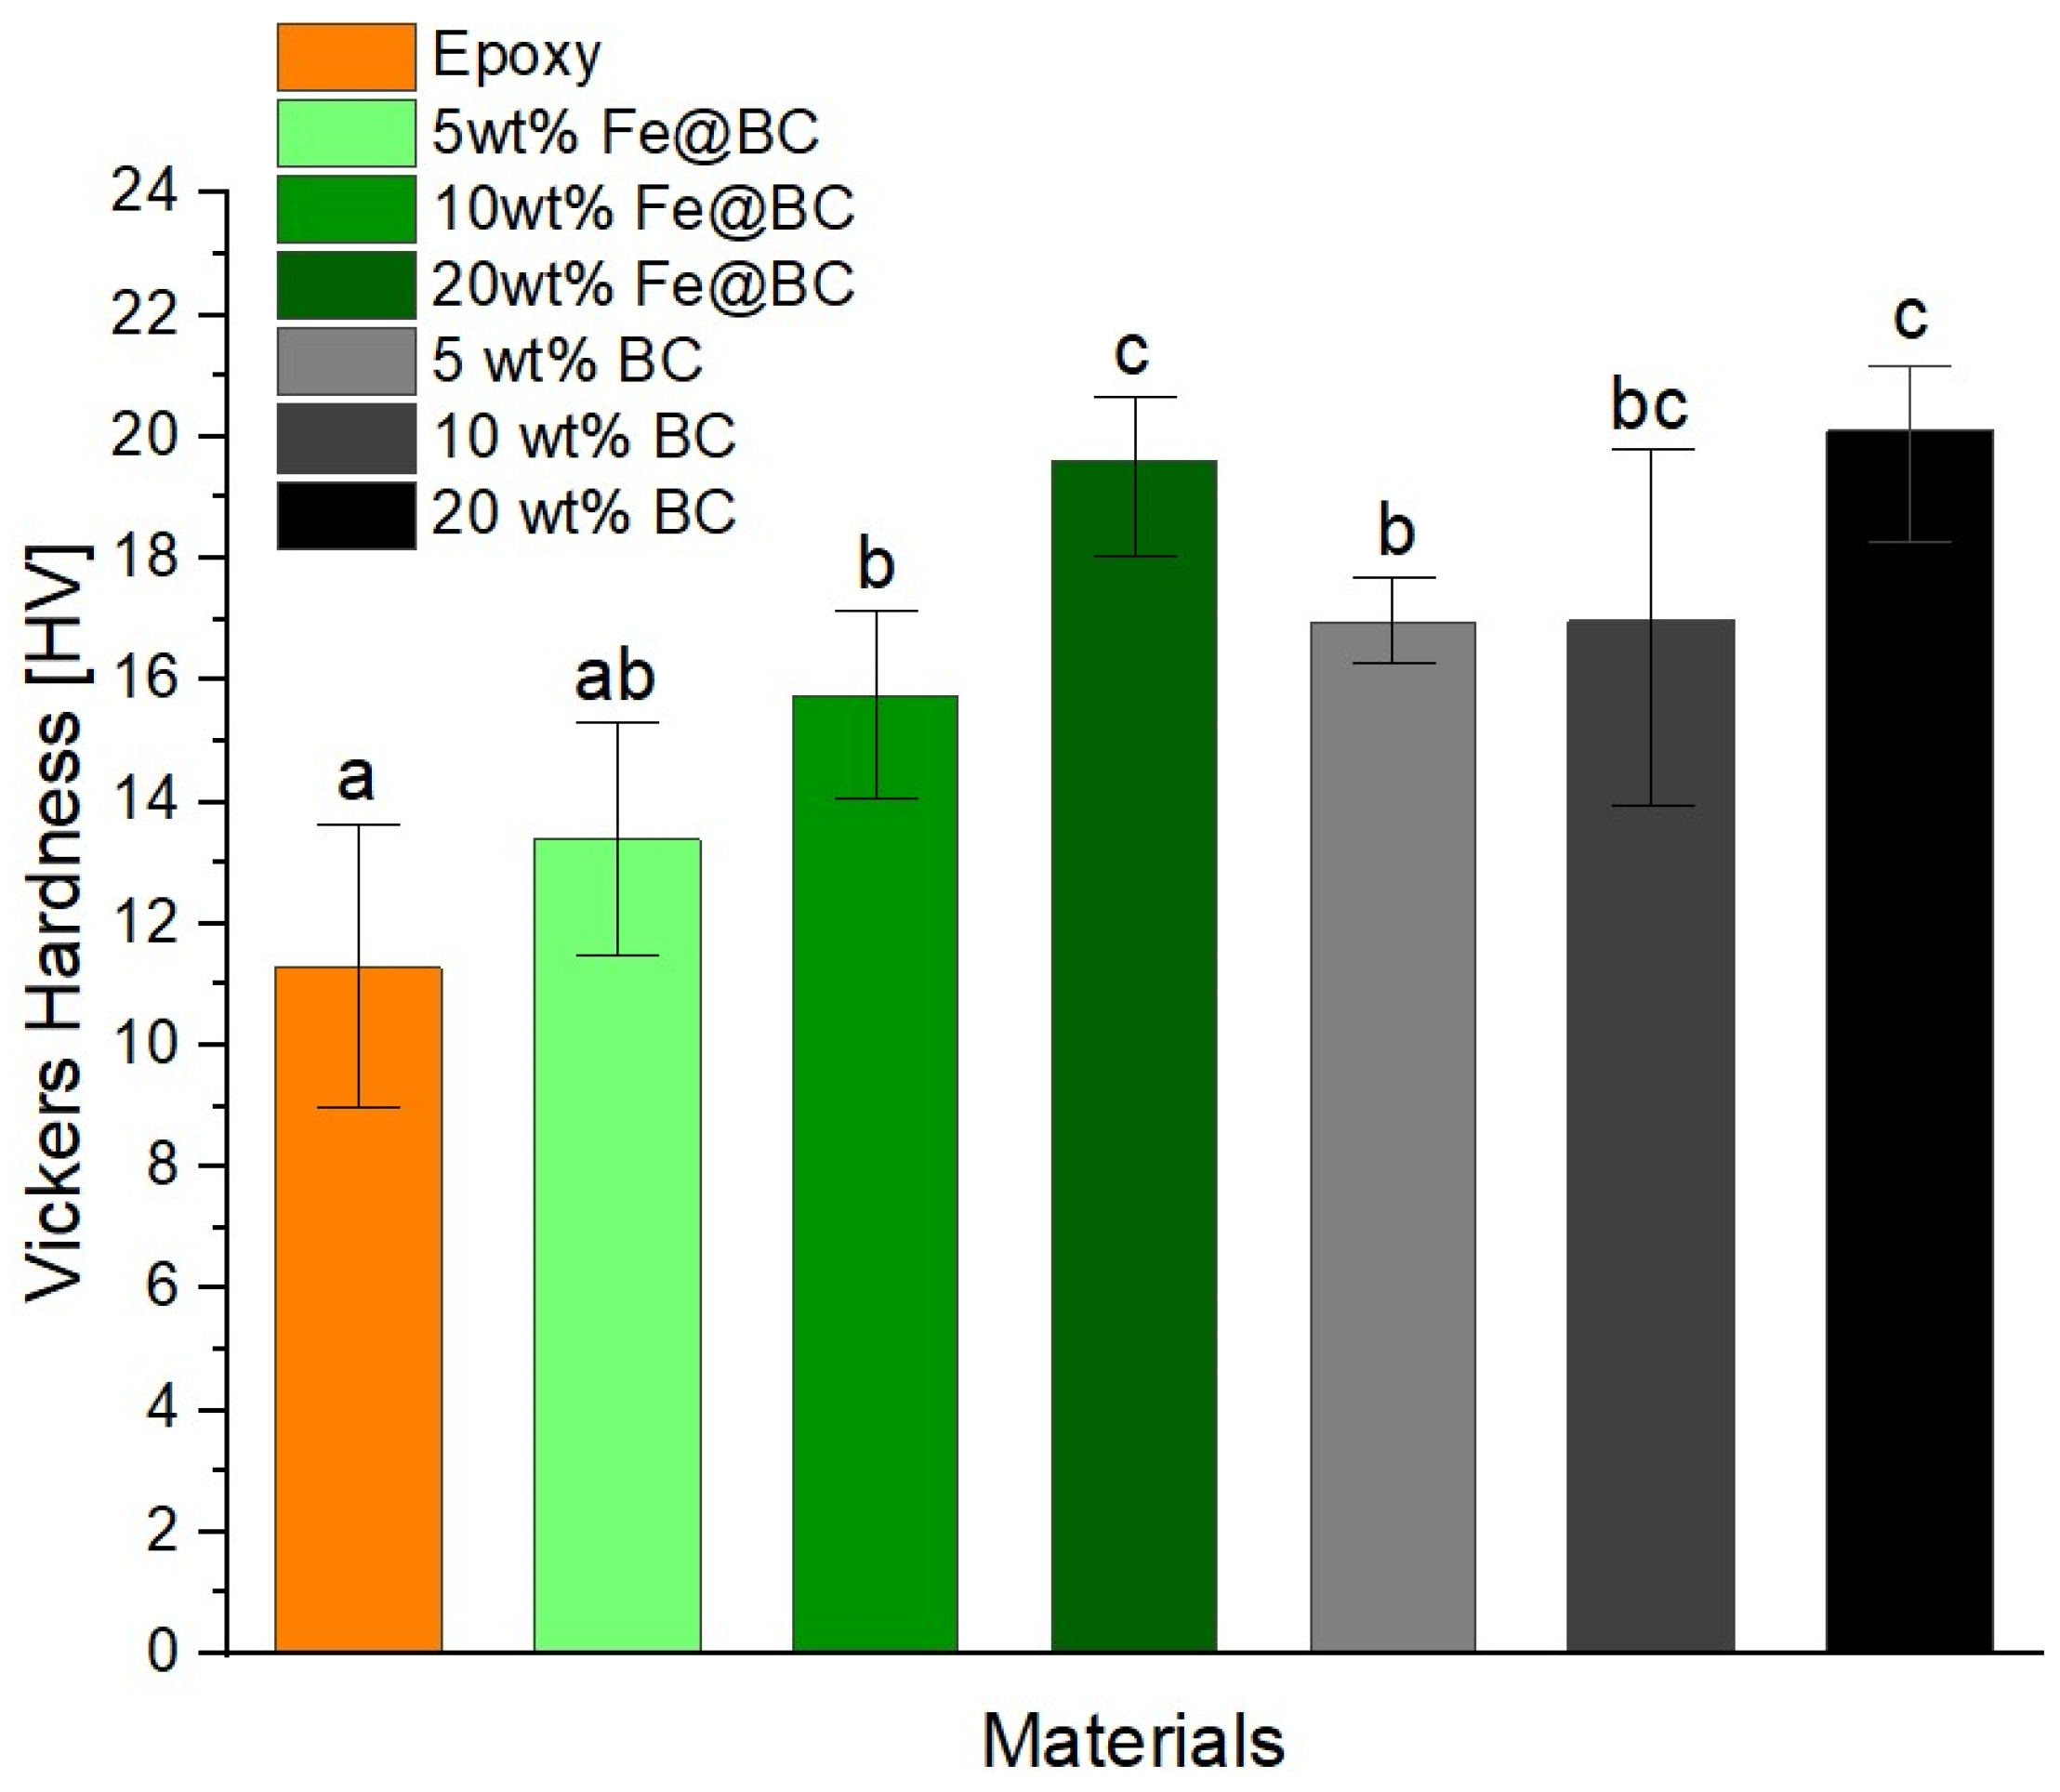
For the study purposes, Vickers microhardness analysis emerges as a fundamental methodology for evaluating the mechanical properties of materials as shown in Figure 9.
The comparison between the two families of materials was conducted relative to neat epoxy, which exhibited a value of 11.3 ± 2.3 HV.
The hybrid composites showed an increase in hardness with the filler loading. This outcome was attributed to the fact that the filler had greater hardness compared to the neat matrix. The greatest enhancement in hardness was observed with a filler loading of 20 wt.%, yielding a value of 19.6 ± 1.3 HV. Moreover, a value of 15.7 ± 1.5 HV was achieved for 10 wt.%, while 5 wt.% resulted in a value of 13.4 ± 1.9 HV.
Regarding organic composites, a similar trend was observed, with the maximum value of 20.1 ± 1.5 HV attained for a filler loading of 20 wt.%. The other two materials exhibited comparable results: 17.0 ± 2.9 HV for 10 wt.% and 17.0 ± 0.7 HV for 5 wt.%.
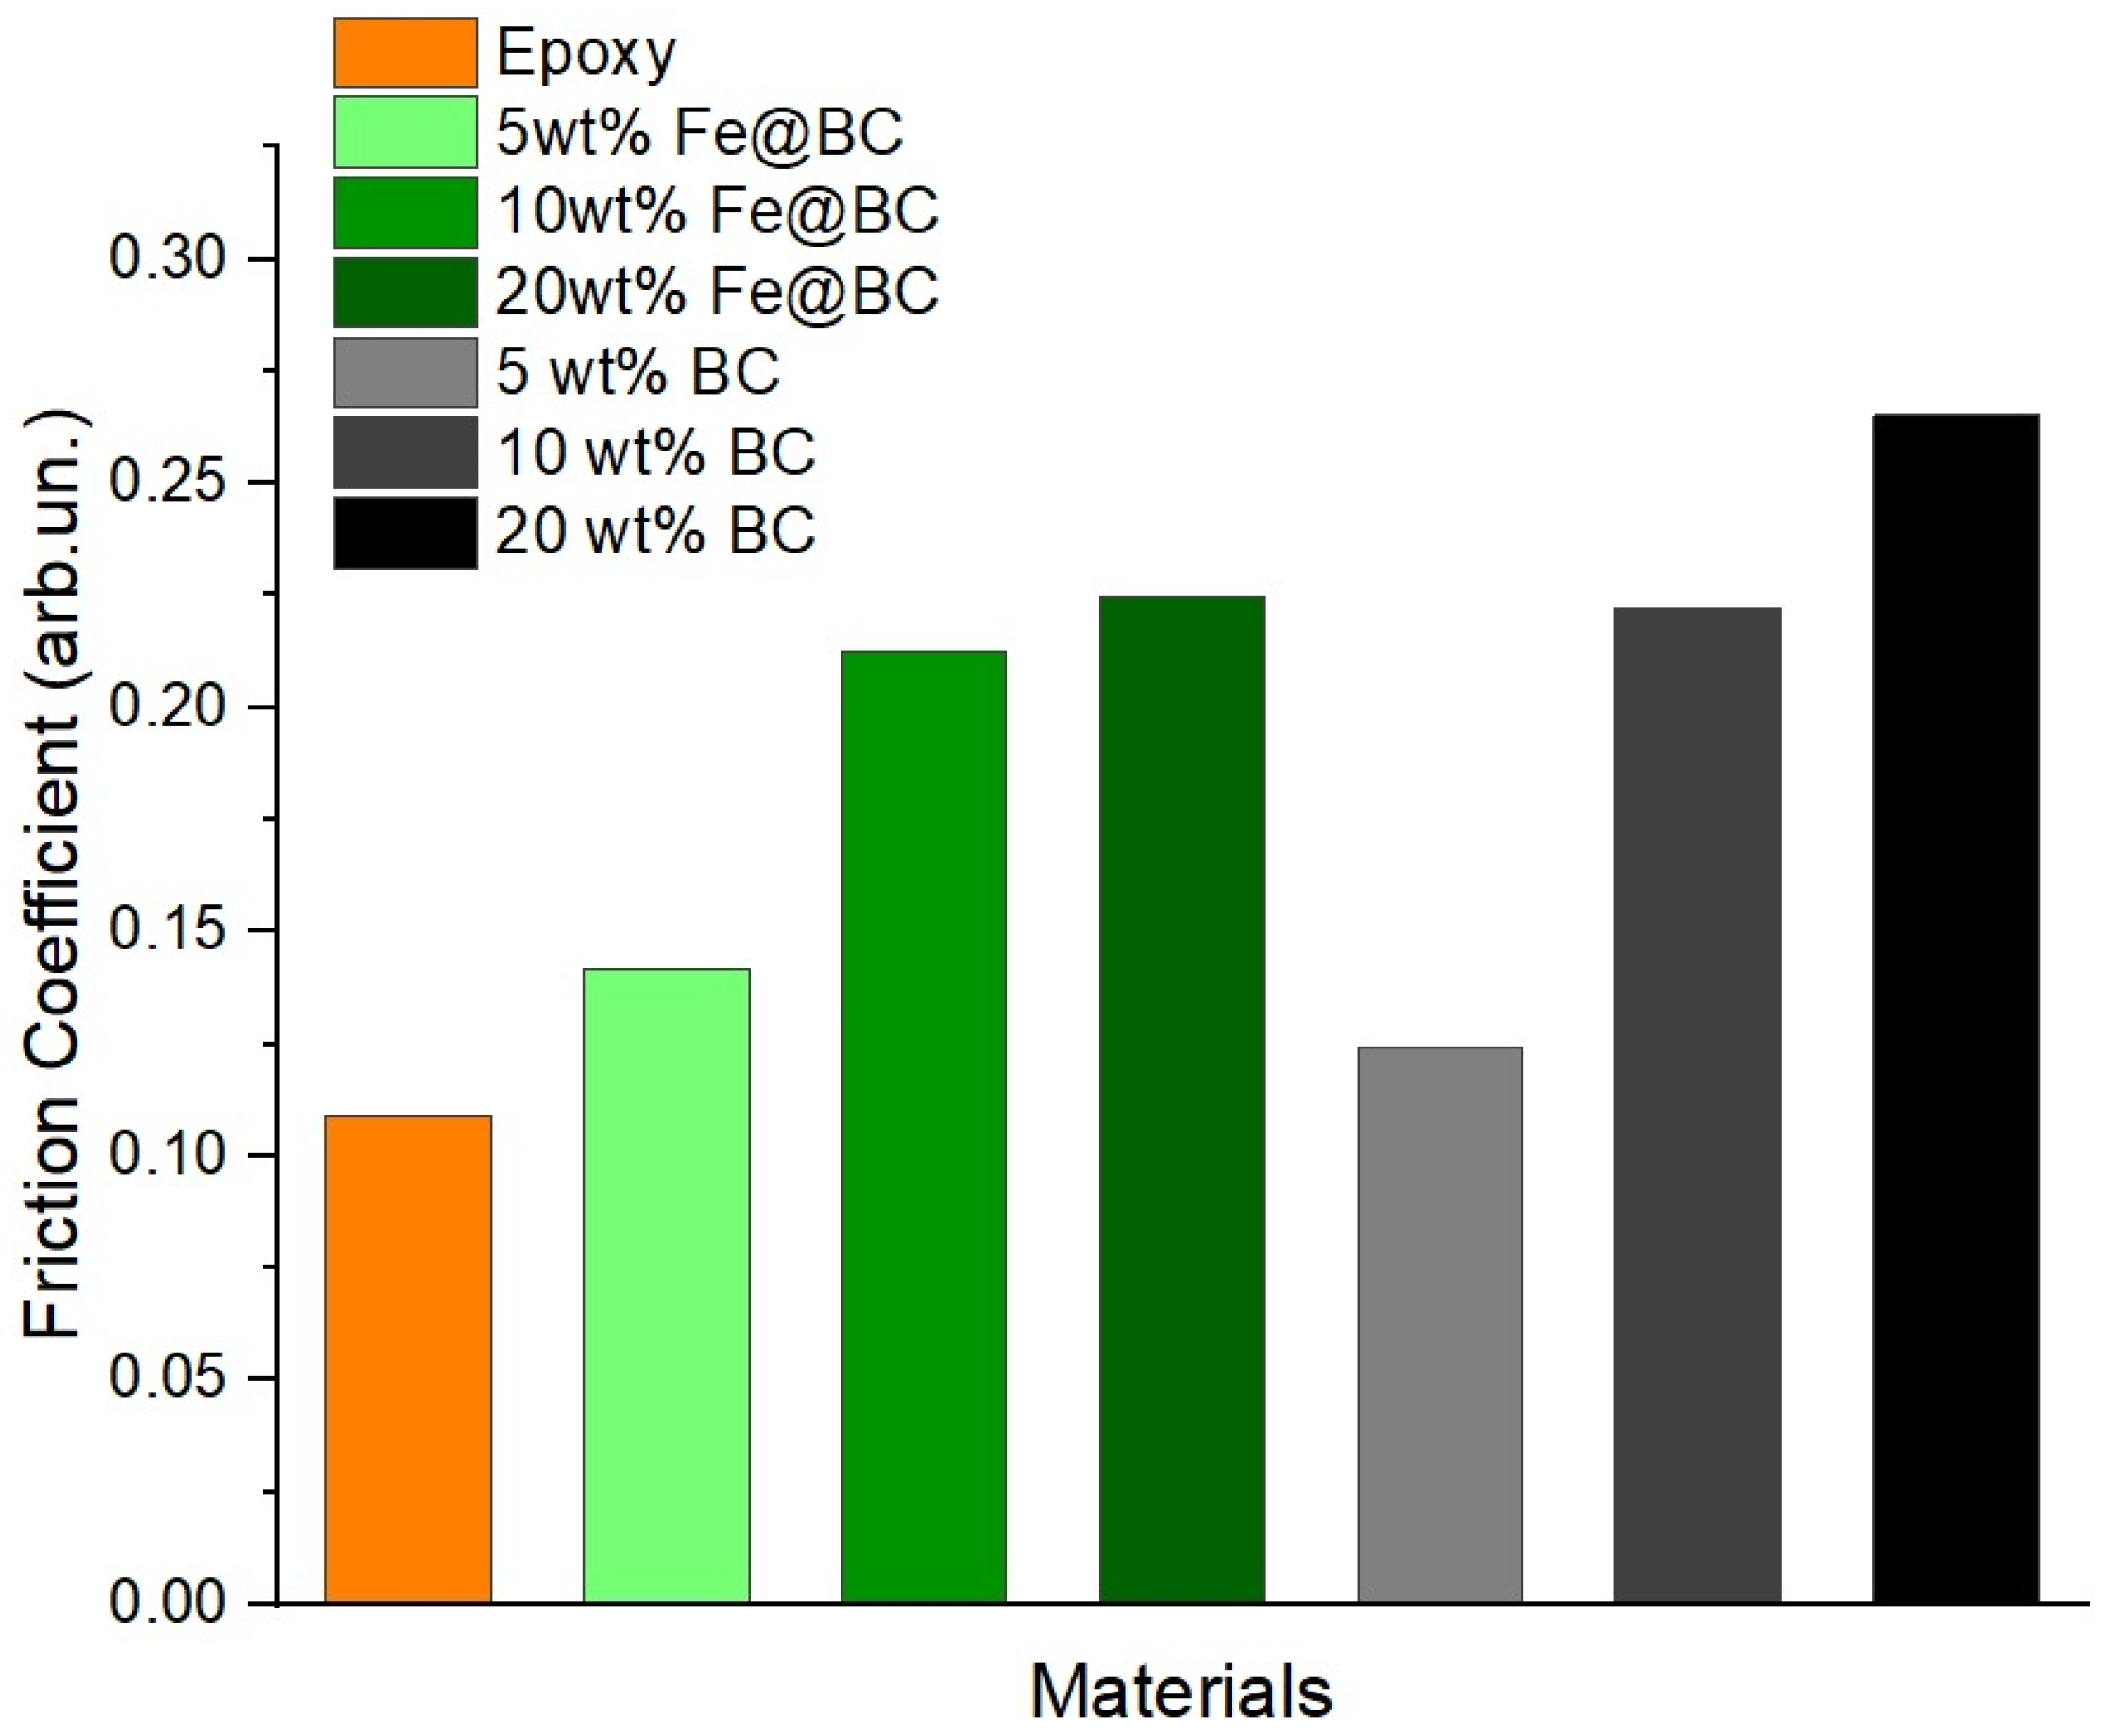
Furthermore, the composites surface properties were investigated using a tribometer determining the friction coefficients as shown in Figure 10.
The two families of composites exhibited different trends. Hybrid composites showed an increase in the friction coefficient at low filler loading, with a value of 0.34 for 5 wt.%. However, adding a greater quantity of filler led to a decrease in the property, with values of 0.28 for 10 wt.% and 0.29 for 20 wt.%. In contrast, organic composites demonstrated a decrease in the friction coefficient at low loading levels, registering a value of 0.23. As filler loading increased, the friction coefficient rose, reaching values comparable to those of hybrid composites. A value of 0.28 was achieved for 10 wt.%, while a value of 0.26 was obtained for 20 wt.%.

3.4. Microscopical Analysis of the Fracture Surfaces

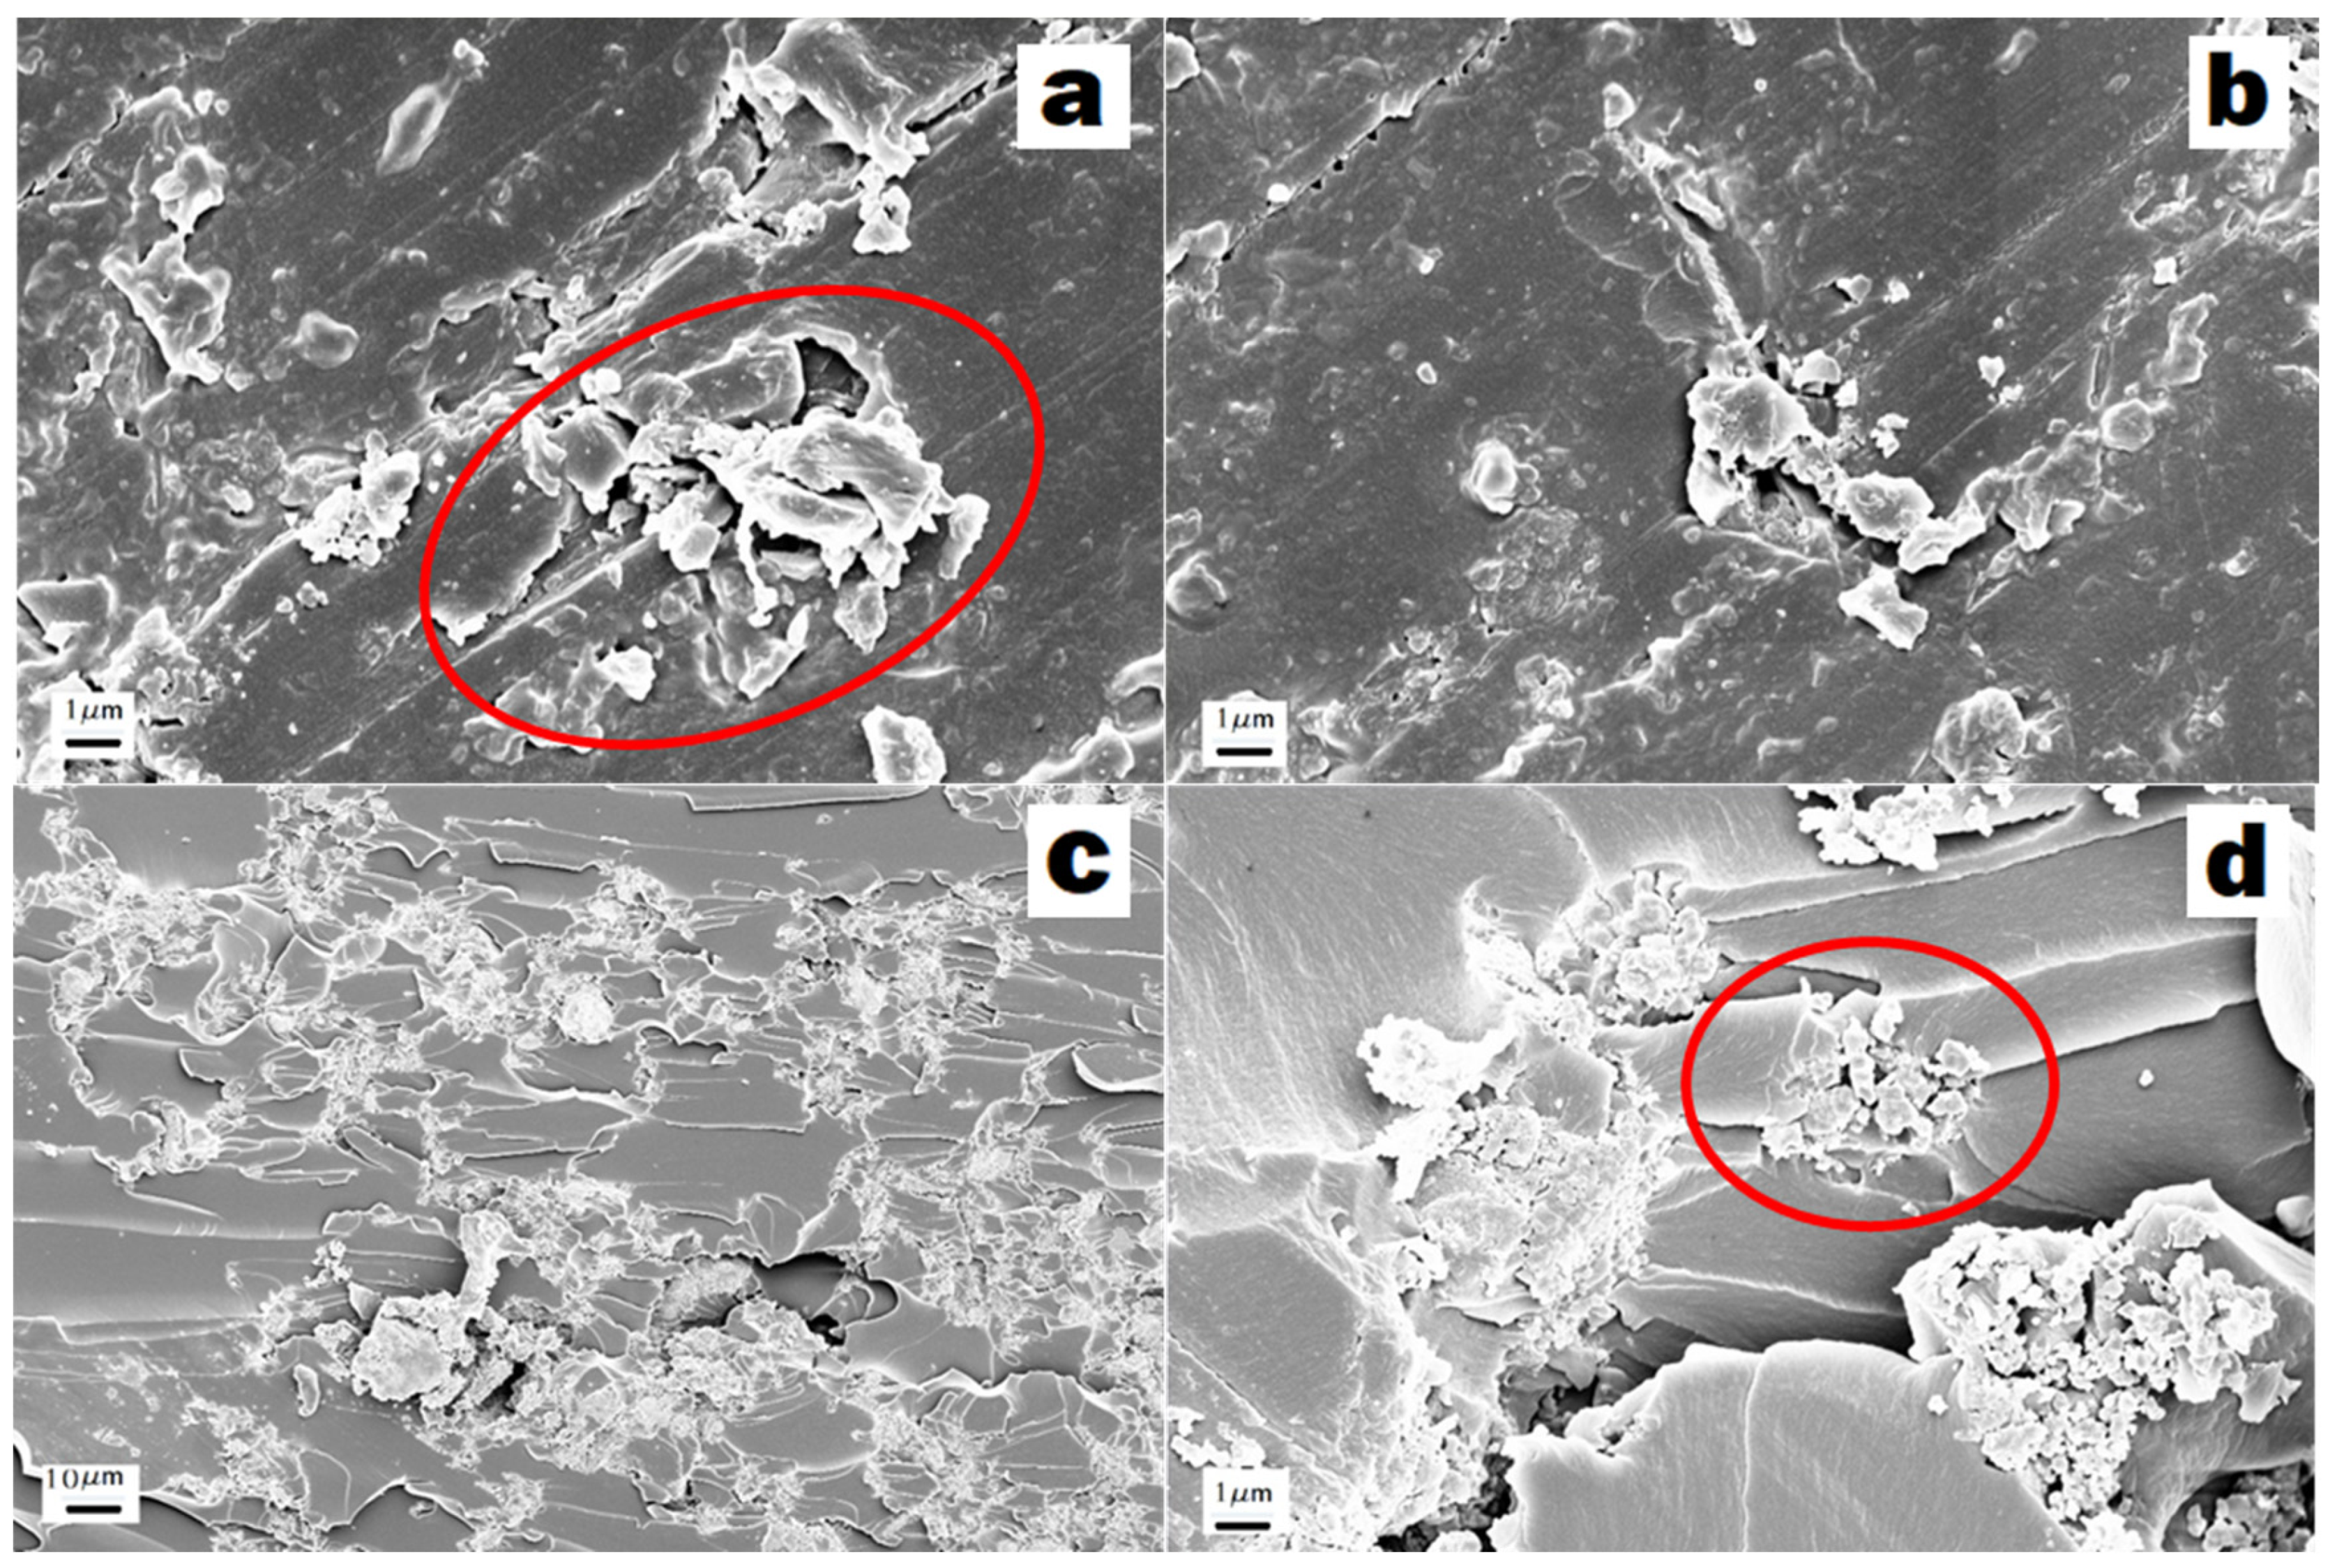
As reported in Figure 11a,b, internal microfractures and striations can be observed due to a damage mechanism occurring on a plane perpendicular to the main stress axis. This suggests the presence of a preferential slip plane within the material’s microstructure. As seen in Figure 11a, the organic filler acts as a barrier increasing the stress required for crack propagation and leading to higher detectable maximum stresses. Additionally, the crack must navigate around the agglomerate to continue its path, which impedes crack propagation (Figure 11a). This slowing of microfractures and striations, even in the elastic phase, directly translates into a significant increase in certain mechanical parameters, such as the elastic modulus. Moreover, it results in the detachment of the filler cluster from the epoxy matrix.
As reported in Figure 11c,d, the fracture morphology no longer exhibits a planar structure but instead displays a more brittle fracture where numerous cracks with different propagation directions are evident. This microstructural fragility of the composite directly translates into a decrease in the material’s elongation at break. Furthermore, the nature of the filler is also different; the filler clusters are inherently more fragile. This is evident when the crack attempts to pass through an agglomerate (Figure 11d). Unlike the case with the organic filler, the cluster is penetrated and fractured, indicating a weak interaction between the filler particles and between the filler and the matrix. This phenomenon reduces wettability, causing the resin to interact poorly with the surface of the filler, resulting in various manifestations of filler imprint. Furthermore, such a weak interaction undermines the mechanical properties achievable by the material. Additionally, it is proposed that the clusters themselves act as crack nucleation points. This is manifested in the mechanical properties, where an increase in the loading percentage associated with the number of nucleation points results in a decrease in elongation at break.

3.5. Electromagnetic Characterization

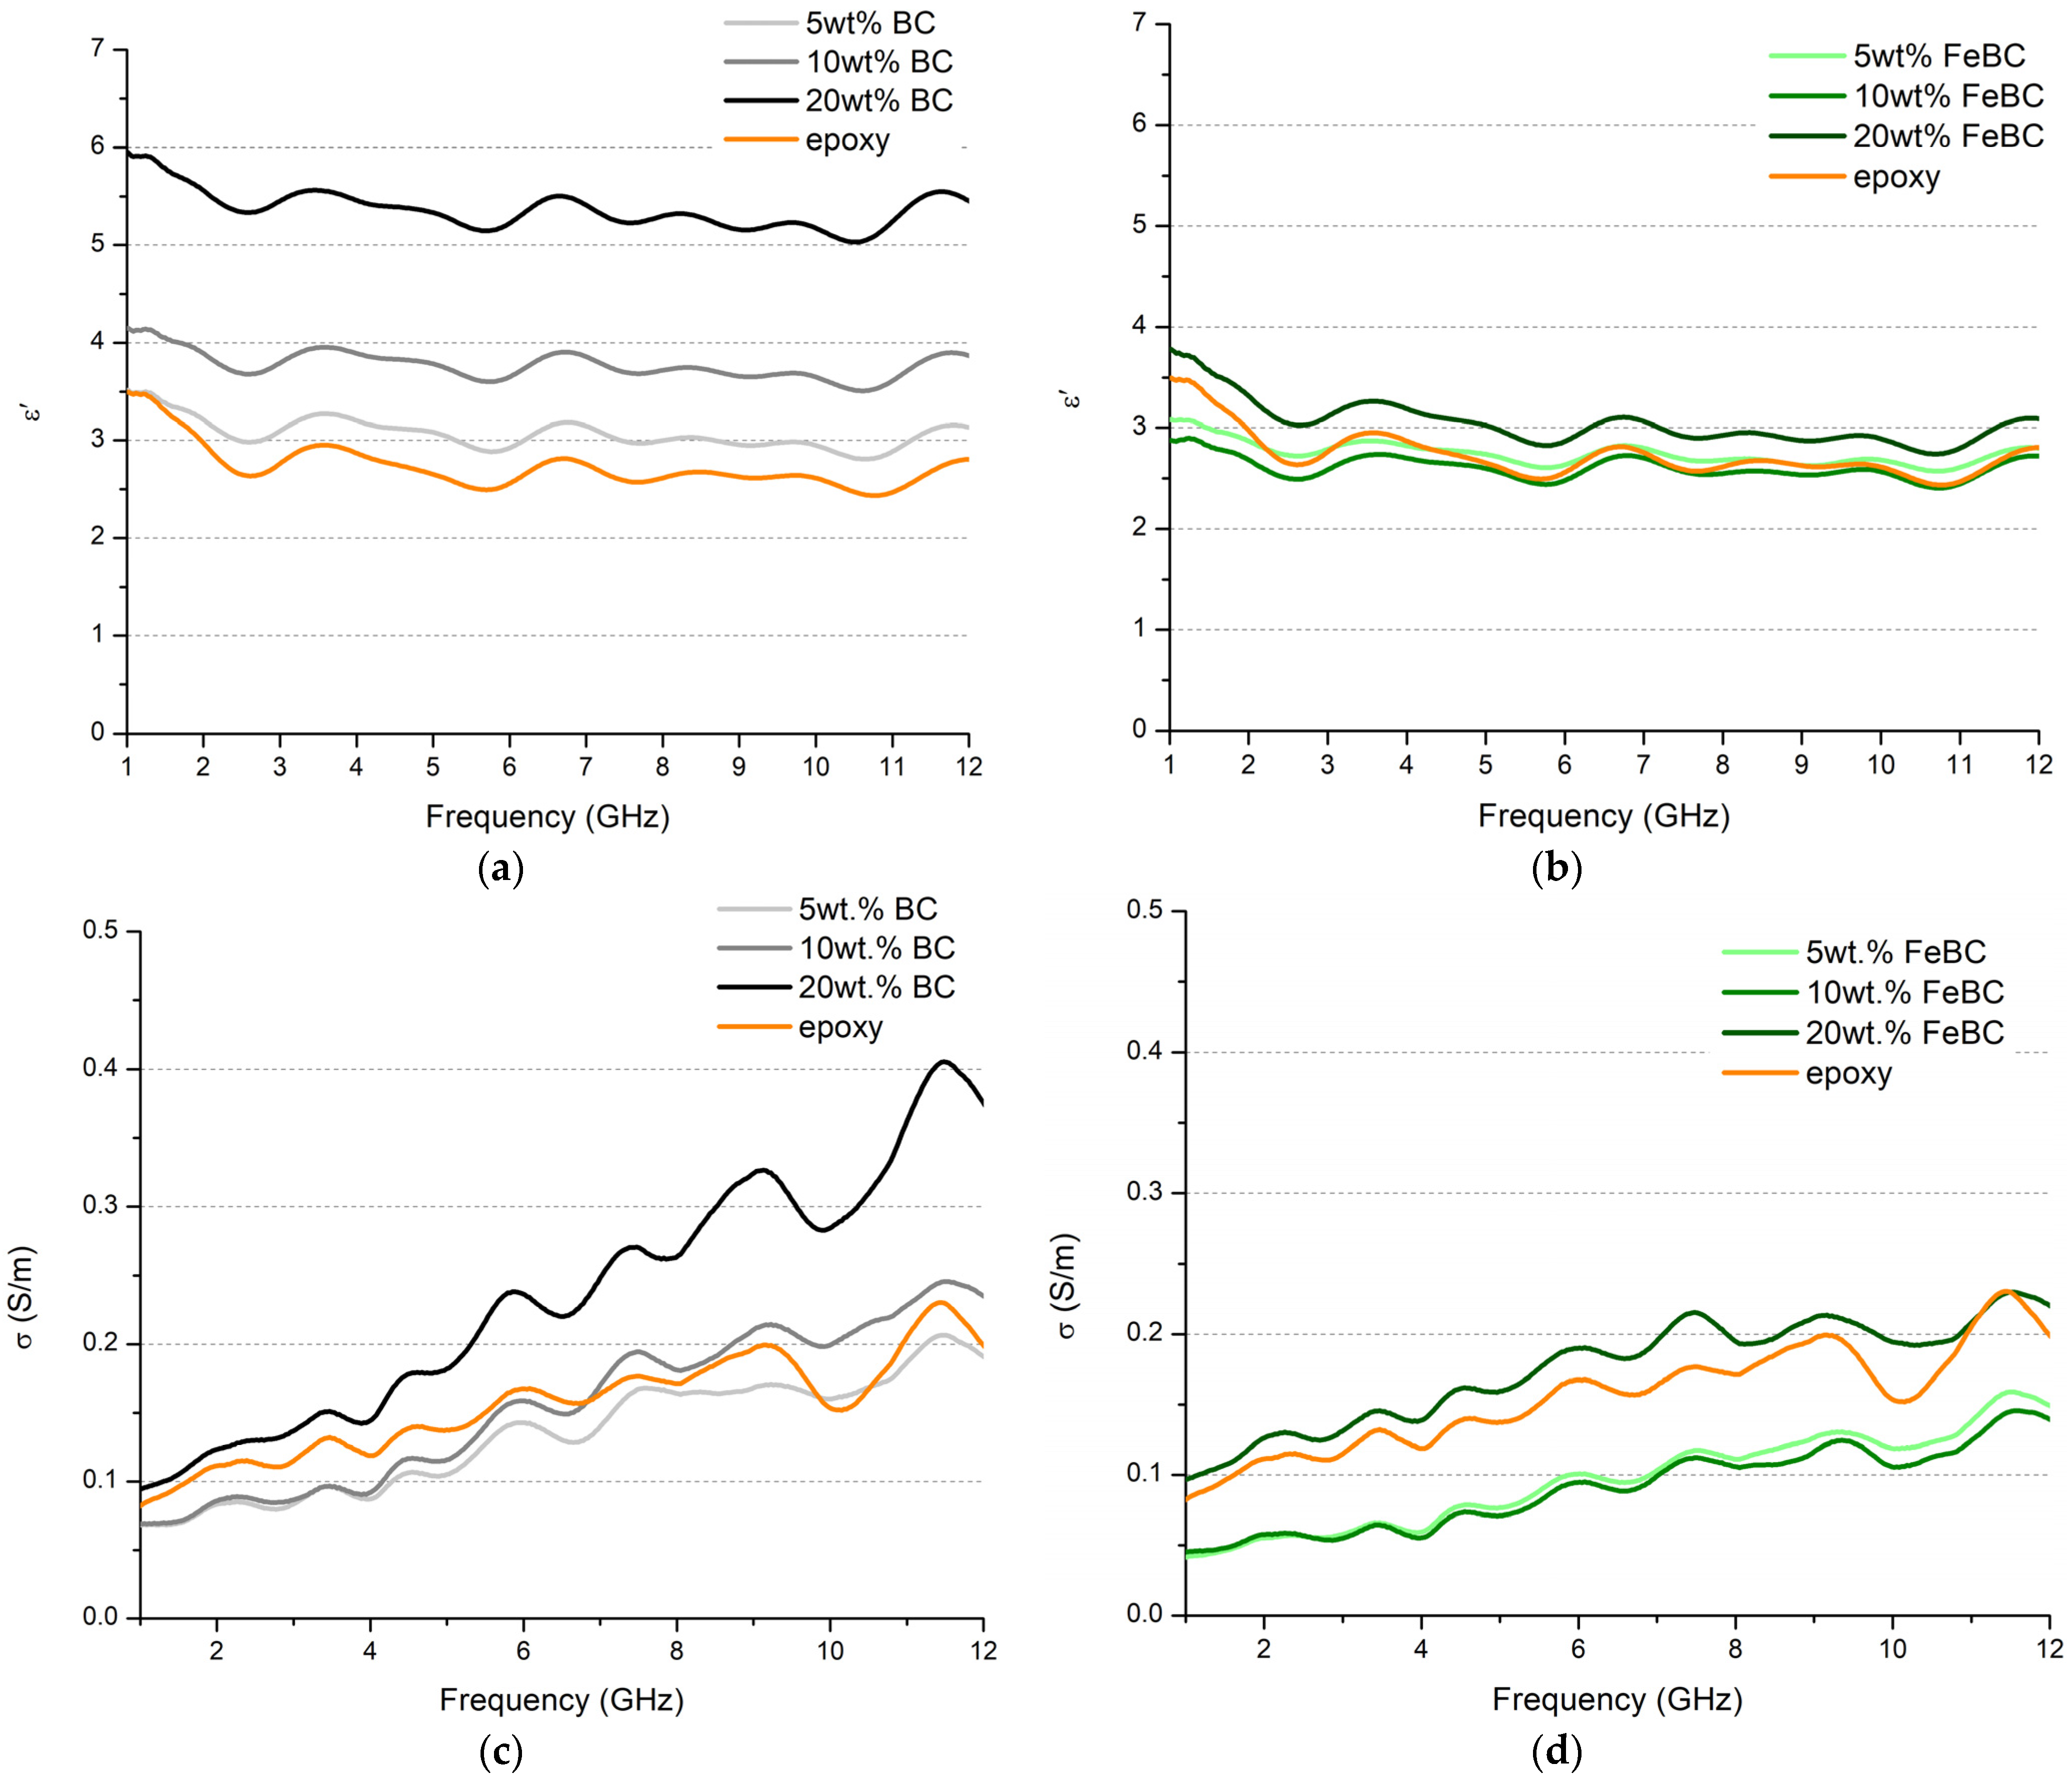
The electromagnetic properties of organic and hybrid composites were investigated at high frequencies. In Figure 12, the real part of the complex permittivity and conductivity are reported from 1 to 12 GHz. The real part of the permittivity remains almost constant over the whole frequency range for each composite. For biochar-loaded composites, a monotonic increase of ε’ is observed with increasing filler content. A slightly larger increase in the property is shown by the 20 wt.% loaded material. Nonetheless, the behavior of composites is still mainly dielectric despite the thermal treatment at high temperature. Hybrid fillers do not drastically affect the electrical permittivity: it is found to stay nearly constant when varying the filler content, underlining again a dielectric behavior.
In general, conductivity increases with the frequency, as expected. Hybrid-loaded composites (Figure 12d) exhibit a dielectric behavior (σ < 0.25 S/m across the entire frequency range), which is comparable to that of the epoxy resin. This behavior can be attributed to the oxidic nature of hematite, a weakly conductive mineral that mainly constitutes the filler, as deduced from the Raman spectrum [51]. For biochar–epoxy composites, conductivity remains unchanged up to 10 wt.% biochar. However, the 20 wt.% biochar-loaded composite shows a slight increase in conductivity, making it suitable for high-frequency applications.

3.6. Mechanical Properties of Other Polymer–BC Composites

Some literature on biochar–epoxy composites was investigated. In general, research demonstrates that Young’s modulus increases with the addition of biochar. Major increases are observed at low loading levels. Composites exhibit a ductile behavior at low concentrations (up to 2 wt.%), while higher amounts of filler lead to a semi-brittle behavior. Giorcelli et al. [52] reported on biochar–epoxy composites with concentrations from 1 wt.% to 20 wt.%. In contrast to this work, highly filled composites (20 wt.%) exhibited a semi-ductile behavior characterized by deformation at break greater than 8%. This can be attributed to a better adhesion between the matrix and the filler that optimizes the stress transfer from the matrix to the filler. Matykiewicz [53] investigated mechanical properties of carbon-fiber-reinforced epoxy composites loaded with biochar (2.5 wt.%, 5 wt.%, and 10 wt.%) and also focused on flexural properties. Similar to our work, he reported a decrease in flexural modulus of composites compared to neat epoxy, with an increase in the property with higher loadings. In our study, highly loaded composite (20 wt.% of BC) exhibits a remarkable increase in flexural modulus. This can be attributed to efficient stress transfer within the network of biochar particles during flexural force application and to the ability to deflect and obstruct crack propagations. Khan et al. [19] investigated low-cost carbonaceous fillers for mechanical and electrical properties. Through tensile testing, they demonstrated the transition from a ductile behavior at low loading levels to a semi-brittle one for higher concentrations (20 wt.%), which leads to lower tensile toughness as reported in our work. The author attributes this behavior to the spherical morphology of the reinforcements, which is less effective in absorbing energy. Giorcelli et al. [54] focused on epoxy–biochar (15 wt.%) composites. The mechanical analysis results are comparable to our work, with a neat embrittlement of 20 wt.% BC composite characterized by higher Young’s modulus, low elongation at break, and, consequently, low toughness. Thermoplastic matrices and their composites were also investigated. Zouari et al. [55] highlighted a strong impact of BC addition (5 wt.%, 10 wt.%, and 20 wt.%) on PLA matrix. While a 5 wt.% BC concentration enhances Young’s modulus, maintaining a reasonable elongation at break, higher concentrations lead to a Young’s modulus comparable to that of neat PLA while significantly reducing elongation at break. The authors attributed this behavior to a difficult dispersion process when increasing filler content, that results in the formation of aggregates unable to efficiently transfer stress. Nan et al. [56] focused on the impact of BC addition on a high-ductility matrix (PVA) at concentrations up to 10 wt.%. For thermoset matrices, low filler contents (2 wt.%) lead to an increase in Young’s modulus, maintaining a ductile behavior (deformation at break > 50%). Increasing filler content dramatically affects mechanical properties, exhibiting a transition to a brittle behavior: Young’s modulus increases by +271% for 6 wt.% BC and by +429% for 10 wt.% BC, while deformation at break decreases from 211% to 13% (6 wt.% BC) and 5% (10 wt.% BC). The authors attribute these results to the large particle size distribution and the disruption of the matrix network due to the incorporation of BC particles. Das et al. [57] reported interesting properties, both tensile and flexural, of polypropylene–biochar composites (15 wt.% ÷ 35 wt.%). They observed improvements in moduli (Young’s modulus, flexural modulus) while maintaining strength comparable to neat PP. Once again, the authors relate these properties to the physical characteristics of biochar: a large surface area allows the polymer to permeate the filler’s pores, enhancing mechanical and physical interlocking between the matrix and the dispersed phase. From the comparison with the state of the art, it clearly emerges that key factors for effectively enhancing mechanical properties of biochar–polymer composites are good dispersion and distribution, adhesion between the two phases, particle sizes, and their morphology.

4. Conclusions

The utilization of BC-derived fillers has emerged as a solid choice for producing high-performance composites with reduced environment impact. The study revealed that filler concentration significantly influences mechanical properties such as Young’s modulus, ultimate tensile strength, elongation at break, and toughness.
Both hybrid and organic composites exhibited improvements in stiffness and strength at lower filler concentrations, with notable gains in Young’s modulus and ultimate tensile strength at 5 wt.% and 10 wt.%.
In this work, we reported that 20 wt.% Fe@BC improved the elastic modulus by up to 27% and the flexural modulus by up to 47%. Annealed biochar (BC) demonstrated superior performance in elastic modulus, reaching 31.5 ± 2.2 MPa, which is a 32% improvement over neat epoxy. The reduction of elongation at break was minimal, and surface performance improved with a friction coefficient as low as 0.23 at a filler loading of 5 wt.%. However, higher filler loadings often led to reductions in properties, such as a decrease in ultimate tensile strength to 21.7 ± 1.7 MPa at 20 wt.% in hybrid composites. This decline at higher concentrations is attributed to poor wettability and inadequate dispersion, leading to weaker interfacial bonding and increased brittleness. Fracture surface analysis corroborated these findings, revealing that high filler content induces a more brittle fracture morphology. Effective reinforcement requires optimal filler dispersion and adhesion within the matrix.
Electromagnetic characterization revealed that hybrid-loaded composites maintained dielectric behavior, with conductivity comparable to that of neat epoxy resin. Annealed BC demonstrated superior performance under microwave treatment, with conductivity double that of the analogous samples containing Fe@BC.
Annealed biochar-loaded composites showed a monotonic increase with filler content, with a slight increase in conductivity observed at 20 wt.% filler content, making them suitable for high-frequency applications. Overall, the results align with existing literature, highlighting the importance of filler–matrix interaction in determining the performance of biochar–polymer composites. The approach presented here offers a promising strategy for developing a filler library that can be used to selectively tune mechanical, surface, electrical, or adhesion properties. Future works should focus on enhancing filler dispersion and interface adhesion to fully exploit biochar’s potential as a reinforcing agent and to optimize both mechanical and electromagnetic properties.

Supplementary Materials

The following supporting information can be downloaded at: https://www.mdpi.com/article/10.3390/c10030081/s1, Figure S1: EDX graphs of (a) MSP800 and (b) Fe@BC; Figure S2: Raman spectrum of MSP800 (black line) with its fitted spectrum (red line) and sub-peaks; Figure S3: TGA of MSP800 (a) and Fe-BC (b); Table S1: Raman data related to MSP800; Table S2: Raman modes of hematite (Fe2O3) and Fe@BC.

Author Contributions

Conceptualization, C.R. and M.B.; methodology, S.S., S.Z., G.C., C.R., D.T., G.G., L.L., M.E. and M.B.; formal analysis, S.S., S.Z., G.C., L.L. and M.E.; investigation, S.S., S.Z., G.C., L.L. and M.E.; resources, C.R. and A.T.; writing—original draft preparation, S.S., S.Z., G.C., C.R., D.T., G.G., L.L., M.G., A.T. and M.B.; writing—review and editing, S.S., S.Z., G.C., C.R., D.T., G.G., L.L., M.G., A.T., M.E. and M.B.; visualization, S.S., S.Z. and G.C.; supervision, C.R. and M.B. All authors have read and agreed to the published version of the manuscript.

Funding

This work was funded by PRIN 2022 ICELESS: Ice Control Enabled via a Low-Energy Smart System (CUP E53D23002630006).

Data Availability Statement

The original contributions presented in the study are included in the article/Supplementary Materials, further inquiries can be directed to the corresponding author/s.

Conflicts of Interest

The authors declare no conflicts of interest.

References

  1. Mangino, E.; Carruthers, J.; Pitarresi, G. The future use of structural composite materials in the automotive industry. Int. J. Veh. Des. 2007, 44, 211–232. [Google Scholar] [CrossRef]
  2. Soni, R.; Verma, R.; Garg, R.K.; Sharma, V. A critical review of recent advances in the aerospace materials. Mater. Today Proc. 2023. [Google Scholar] [CrossRef]
  3. Bakht, S.M.; Pardo, A.; Gómez-Florit, M.; Reis, R.L.; Domingues, R.M.; Gomes, M.E. Engineering next-generation bioinks with nanoparticles: Moving from reinforcement fillers to multifunctional nanoelements. J. Mater. Chem. B 2021, 9, 5025–5038. [Google Scholar] [CrossRef]
  4. Rahaman, M.; Theravalappil, R.; Bhandari, S.; Nayak, L.; Bhagabati, P. Electrical conductivity of polymer-graphene composites. In Polymer Nanocomposites Containing Graphene; Elsevier: Amsterdam, The Netherlands, 2022; pp. 107–139. [Google Scholar]
  5. Rahman, M.R.; Rashid, M.M.; Islam, M.M.; Akanda, M.M. Electrical and chemical properties of graphene over composite materials: A technical review. Mater. Sci. Res. India 2019, 16, 142–163. [Google Scholar] [CrossRef]
  6. Moisala, A.; Li, Q.; Kinloch, I.; Windle, A. Thermal and electrical conductivity of single-and multi-walled carbon nanotube-epoxy composites. Compos. Sci. Technol. 2006, 66, 1285–1288. [Google Scholar] [CrossRef]
  7. Gardea, F.; Lagoudas, D.C. Characterization of electrical and thermal properties of carbon nanotube/epoxy composites. Compos. Part B Eng. 2014, 56, 611–620. [Google Scholar] [CrossRef]
  8. Nurazzi, N.; Sabaruddin, F.; Harussani, M.; Kamarudin, S.; Rayung, M.; Asyraf, M.; Aisyah, H.; Norrrahim, M.; Ilyas, R.; Abdullah, N. Mechanical performance and applications of cnts reinforced polymer composites—A review. Nanomaterials 2021, 11, 2186. [Google Scholar] [CrossRef] [PubMed]
  9. Arash, B.; Wang, Q.; Varadan, V. Mechanical properties of carbon nanotube/polymer composites. Sci. Rep. 2014, 4, 6479. [Google Scholar] [CrossRef]
  10. Papageorgiou, D.G.; Kinloch, I.A.; Young, R.J. Mechanical properties of graphene and graphene-based nanocomposites. Prog. Mater. Sci. 2017, 90, 75–127. [Google Scholar] [CrossRef]
  11. Palermo, V.; Kinloch, I.A.; Ligi, S.; Pugno, N.M. Nanoscale mechanics of graphene and graphene oxide in composites: A scientific and technological perspective. Adv. Mater. 2016, 28, 6232–6238. [Google Scholar] [CrossRef] [PubMed]
  12. Lin, L.; Peng, H.; Liu, Z. Synthesis challenges for graphene industry. Nat. Mater. 2019, 18, 520–524. [Google Scholar] [CrossRef] [PubMed]
  13. Zhang, Q.; Huang, J.Q.; Zhao, M.Q.; Qian, W.Z.; Wei, F. Carbon nanotube mass production: Principles and processes. ChemSusChem 2011, 4, 864–889. [Google Scholar] [CrossRef]
  14. Gábor, T.; Aranyi, D.; Papp, K.; Kármán, F.; Kálmán, E. Dispersibility of Carbon Nanotubes. In Materials Science Forum; Trans Tech Publications Ltd.: Bach, Switzerland, 2007; pp. 161–168. [Google Scholar]
  15. Perumal, S.; Atchudan, R.; Cheong, I.W. Recent studies on dispersion of graphene–polymer composites. Polymers 2021, 13, 2375. [Google Scholar] [CrossRef]
  16. Kauling, A.P.; Seefeldt, A.T.; Pisoni, D.P.; Pradeep, R.C.; Bentini, R.; Oliveira, R.V.; Novoselov, K.S.; Castro Neto, A.H. The worldwide graphene flake production. Adv. Mater. 2018, 30, 1803784. [Google Scholar] [CrossRef]
  17. Huang, J.; Zhang, Q.; Zhao, M.; Wei, F. A review of the large-scale production of carbon nanotubes: The practice of nanoscale process engineering. Chin. Sci. Bull. 2012, 57, 157–166. [Google Scholar] [CrossRef]
  18. Bartoli, M.; Giorcelli, M.; Rosso, C.; Rovere, M.; Jagdale, P.; Tagliaferro, A. Influence of commercial biochar fillers on brittleness/ductility of epoxy resin composites. Appl. Sci. 2019, 9, 3109. [Google Scholar] [CrossRef]
  19. Khan, A.; Savi, P.; Quaranta, S.; Rovere, M.; Giorcelli, M.; Tagliaferro, A.; Rosso, C.; Jia, C.Q. Low-cost carbon fillers to improve mechanical properties and conductivity of epoxy composites. Polymers 2017, 9, 642. [Google Scholar] [CrossRef] [PubMed]
  20. Zhang, W.D.; Phang, I.Y.; Liu, T. Growth of carbon nanotubes on clay: Unique nanostructured filler for high-performance polymer nanocomposites. Adv. Mater. 2006, 18, 73–77. [Google Scholar] [CrossRef]
  21. Zhao, W.; Li, T.; Li, Y.; O’Brien, D.J.; Terrones, M.; Wei, B.; Suhr, J.; Lu, X.L. Mechanical properties of nanocomposites reinforced by carbon nanotube sponges. J. Mater. 2018, 4, 157–164. [Google Scholar] [CrossRef]
  22. Bartoli, M.; Arrigo, R.; Malucelli, G.; Tagliaferro, A.; Duraccio, D. Recent advances in biochar polymer composites. Polymers 2022, 14, 2506. [Google Scholar] [CrossRef]
  23. Arrigo, R.; Bartoli, M.; Torsello, D.; Ghigo, G.; Malucelli, G. Thermal, dynamic-mechanical and electrical properties of UV-LED curable coatings containing porcupine-like carbon structures. Mater. Today Commun. 2021, 28, 102630. [Google Scholar] [CrossRef]
  24. Bartoli, M.; Rosso, C.; Giorcelli, M.; Rovere, M.; Jagdale, P.; Tagliaferro, A.; Chae, M.; Bressler, D.C. Effect of incorporation of microstructured carbonized cellulose on surface and mechanical properties of epoxy composites. J. Appl. Polym. Sci. 2020, 137, 48896. [Google Scholar] [CrossRef]
  25. Bifulco, A.; Bartoli, M.; Climaco, I.; Franchino, M.C.; Battegazzore, D.; Mensah, R.A.; Das, O.; Vahabi, H.; Malucelli, G.; Aronne, A. Coffee waste-derived biochar as a flame retardant for epoxy nanocomposites. Sustain. Mater. Technol. 2024, 41, e01079. [Google Scholar] [CrossRef]
  26. Bartoli, M.; Duraccio, D.; Faga, M.G.; Piatti, E.; Torsello, D.; Ghigo, G.; Malucelli, G. Mechanical, electrical, thermal and tribological behavior of epoxy resin composites reinforced with waste hemp-derived carbon fibers. J. Mater. Sci. 2022, 57, 14861–14876. [Google Scholar] [CrossRef]
  27. Bartoli, M.; Torsello, D.; Piatti, E.; Giorcelli, M.; Sparavigna, A.C.; Rovere, M.; Ghigo, G.; Tagliaferro, A. Pressure-responsive conductive poly (vinyl alcohol) composites containing waste cotton fibers biochar. Micromachines 2022, 13, 125. [Google Scholar] [CrossRef]
  28. Torsello, D.; Ghigo, G.; Giorcelli, M.; Bartoli, M.; Rovere, M.; Tagliaferro, A. Tuning the microwave electromagnetic properties of biochar-based composites by annealing. Carbon Trends 2021, 4, 100062. [Google Scholar] [CrossRef]
  29. Weber, K.; Quicker, P. Properties of biochar. Fuel Sci. 2018, 217, 240–261. [Google Scholar] [CrossRef]
  30. Yasim-Anuar, T.A.T.; Yee-Foong, L.N.; Lawal, A.A.; Farid, M.A.A.; Yusuf, M.Z.M.; Hassan, M.A.; Ariffin, H. Emerging application of biochar as a renewable and superior filler in polymer composites. RSC Adv. 2022, 12, 13938–13949. [Google Scholar] [CrossRef]
  31. Giorcelli, M.; Bartoli, M.; Sanginario, A.; Padovano, E.; Rosso, C.; Rovere, M.; Tagliaferro, A. High-temperature annealed biochar as a conductive filler for the production of piezoresistive materials for energy conversion application. ACS Appl. Electron. Mater. 2021, 3, 838–844. [Google Scholar] [CrossRef]
  32. Bélanger, N.; Prasher, S.; Dumont, M.-J. Tailoring biochar production for use as a reinforcing bio-based filler in rubber composites: A review. Polym. Technol. Mater. 2023, 62, 54–75. [Google Scholar] [CrossRef]
  33. Zecchi, S.; Ruscillo, F.; Cristoforo, G.; Bartoli, M.; Loebsack, G.; Kang, K.; Piatti, E.; Torsello, D.; Ghigo, G.; Gerbaldo, R. Effect of Red Mud Addition on Electrical and Magnetic Properties of Hemp-Derived-Biochar-Containing Epoxy Composites. Micromachines 2023, 14, 429. [Google Scholar] [CrossRef]
  34. Park, S.; Bernet, N.; De La Roche, S.; Hahn, H.T. Processing of iron oxide-epoxy vinyl ester nanocomposites. J. Compos. Mater. 2003, 37, 465–476. [Google Scholar] [CrossRef]
  35. Gnanavel, M.; Maridurai, T. Effect of surface modification and particle size on dielectric properties of iron (III) oxide-epoxy composite film. Dig. J. Nanomater. Biostruct. 2018, 13, 39–48. [Google Scholar]
  36. Javidparvar, A.; Ramezanzadeh, B.; Ghasemi, E. The effect of surface morphology and treatment of Fe3O4 nanoparticles on the corrosion resistance of epoxy coating. J. Taiwan Inst. Chem. Eng. 2016, 61, 356–366. [Google Scholar] [CrossRef]
  37. Tamborrino, V.; Costamagna, G.; Bartoli, M.; Rovere, M.; Jagdale, P.; Lavagna, L.; Ginepro, M.; Tagliaferro, A. Catalytic oxidative desulphurization of pyrolytic oils to fuels over different waste derived carbon-based catalysts. Fuel 2021, 296, 120693. [Google Scholar] [CrossRef]
  38. Tagliaferro, A.; Rovere, M.; Padovano, E.; Bartoli, M.; Giorcelli, M. Introducing the novel mixed gaussian-lorentzian lineshape in the analysis of the raman signal of biochar. Nanomaterials 2020, 10, 1748. [Google Scholar] [CrossRef]
  39. Tuinstra, F.; Koenig, J.L. Raman spectrum of graphite. J. Chem. Phys. 1970, 53, 1126–1130. [Google Scholar] [CrossRef]
  40. Ba, D.; Sabouroux, P. Epsimu, a toolkit for permittivity and permeability measurement in microwave domain at real time of all materials: Applications to solid and semisolid materials. Microw. Opt. Technol. Lett. 2010, 52, 2643–2648. [Google Scholar] [CrossRef]
  41. Nicolson, A.M.; Ross, G.F. Measurement of the intrinsic properties of materials by time-domain techniques. IEEE Trans. Instrum. Meas. 1970, 19, 377–382. [Google Scholar] [CrossRef]
  42. Baker-Jarvis, J.; Vanzura, E.J.; Kissick, W.A. Improved technique for determining complex permittivity with the transmission/reflection method. IEEE Trans. Microw. Theory Tech. 1990, 38, 1096–1103. [Google Scholar] [CrossRef]
  43. Matykiewicz, D. Biochar as an Effective Filler of Carbon Fiber Reinforced Bio-Epoxy Composites. Processes 2020, 8, 724. [Google Scholar] [CrossRef]
  44. Sparavigna, A.C. Raman Spectroscopy of the Iron Oxides in the Form of Minerals, Particles and Nanoparticles. ChemRxiv 2023. [Google Scholar] [CrossRef]
  45. De Faria, D.L.; Venâncio Silva, S.; de Oliveira, M.T. Raman microspectroscopy of some iron oxides and oxyhydroxides. J. Raman Spectrosc. 1997, 28, 873–878. [Google Scholar] [CrossRef]
  46. Tang, B.; Guoxin, H.; Gao, H. Raman spectroscopic characterization of graphene. Appl. Spectrosc. Rev. 2010, 45, 369–407. [Google Scholar] [CrossRef]
  47. Minugu, O.P.; Gujjala, R.; Shakuntala, O.; Manoj, P.; Chowdary, M.S. Effect of biomass derived biochar materials on mechanical properties of biochar epoxy composites. Proc. Inst. Mech. Eng. Part C J. Mech. Eng. Sci. 2021, 235, 5626–5638. [Google Scholar] [CrossRef]
  48. Ahmetli, G.; Kocaman, S.; Ozaytekin, I.; Bozkurt, P. Epoxy composites based on inexpensive char filler obtained from plastic waste and natural resources. Polym. Compos. 2013, 34, 500–509. [Google Scholar] [CrossRef]
  49. Zuccarello, B.; Bartoli, M.; Bongiorno, F.; Militello, C.; Tagliaferro, A.; Pantano, A. New Concept in Bioderived Composites: Biochar as Toughening Agent for Improving Performances and Durability of Agave-Based Epoxy Biocomposites. Polymers 2021, 13, 198. [Google Scholar] [CrossRef]
  50. Bartoli, M.; Troiano, M.; Giudicianni, P.; Amato, D.; Giorcelli, M.; Solimene, R.; Tagliaferro, A. Effect of heating rate and feedstock nature on electrical conductivity of biochar and biochar-based composites. Appl. Energy Combust. Sci. 2022, 12, 100089. [Google Scholar] [CrossRef]
  51. Lin, F.; Feng, X.-T.; Yang, C.; Li, S.; Zhang, J.; Su, X.; Tong, T. Microwave response characteristics and influencing factors of ores based on dielectric properties of synthetic samples. J. Rock Mech. Geotech. Eng. 2022, 14, 315–328. [Google Scholar] [CrossRef]
  52. Giorcelli, M.; Khan, A.; Pugno, N.M.; Rosso, C.; Tagliaferro, A. Biochar as a cheap and environmental friendly filler able to improve polymer mechanical properties. Biomass Bioenergy 2019, 120, 219–223. [Google Scholar] [CrossRef]
  53. Bartoli, M.; Giorcelli, M.; Jagdale, P.; Rovere, M.; Tagliaferro, A. A Review of Non-Soil Biochar Applications. Materials 2020, 13, 261. [Google Scholar] [CrossRef] [PubMed]
  54. Giorcelli, M.; Bartoli, M. Development of coffee biochar filler for the production of electrical conductive reinforced plastic. Polymers 2019, 11, 1916. [Google Scholar] [CrossRef] [PubMed]
  55. Zouari, M.; Devallance, D.B.; Marrot, L. Effect of biochar addition on mechanical properties, thermal stability, and water resistance of hemp-polylactic acid (PLA) composites. Materials 2022, 15, 2271. [Google Scholar] [CrossRef] [PubMed]
  56. Nan, N.; DeVallance, D.B.; Xie, X.; Wang, J. The effect of bio-carbon addition on the electrical, mechanical, and thermal properties of polyvinyl alcohol/biochar composites. J. Compos. Mater. 2016, 50, 1161–1168. [Google Scholar] [CrossRef]
  57. Das, O.; Bhattacharyya, D.; Hui, D.; Lau, K.-T. Mechanical and flammability characterisations of biochar/polypropylene biocomposites. Compos. Part B Eng. 2016, 106, 120–128. [Google Scholar] [CrossRef]
Figure 1. Schematic illustration of the hybrid filler preparation process: (a) addition of water to iron-nitrate-nonahydrate–biochar mixture; (b) suspension of hybrid filler precursors; (c) dehydration; (d) dry powder; (e) pyrolysis of the dry powder in nitrogen atmosphere; (f) recovery of the hybrid filler.
Carbon 10 00081 g001
Figure 2. FE-SEM images of biochar derived from MSP (a,b) and FE-SEM images of FeBC (c,d) with iron particles circled in red.
Carbon 10 00081 g002
Figure 3. Raman spectra of BC, Fe@BC, and α-hematite.
Carbon 10 00081 g003
Figure 4. XRD analysis of BC (black line) and Fe@BC (red line) in the range from 20 up to 70 2θ.
Carbon 10 00081 g004
Figure 5. Stress–stain curves obtained from tensile tests (a) and flexural tests (b).
Carbon 10 00081 g005
Figure 6. Summary of mechanical properties of composites: Young’s modulus (a), UTS (b), elongation at break, (c) and toughness (d). Data annotated with different letters are significantly different (at a 95% confidence level).
Carbon 10 00081 g006
Figure 7. Summary of flexural properties of epoxy composites: flexural modulus (a), maximum elongation, (b) and maximum stress (c). Data annotated with different letters are significantly different (at a 95% confidence level).
Carbon 10 00081 g007
Figure 8. Sample specimen (a) and stress–strain curves of adhesion test of composites (b).
Carbon 10 00081 g008
Figure 9. Vickers Hardness of composites. Data annotated with different letters are significantly different (at a 95% confidence level).
Carbon 10 00081 g009
Figure 10. Friction coefficient of composites.
Carbon 10 00081 g010
Figure 11. FE-SEM images of the fracture surfaces of organic composite (a,b) and hybrid composite (c,d). Biochar particles are shown in red circles.
Carbon 10 00081 g011
Figure 12. (a) Real permittivity of biochar–epoxy composites; (b) Real permittivity of Fe@BC–epoxy composites; (c) Conductivity of biochar–epoxy composites; (d) Conductivity of Fe@BC–epoxy composites.
Carbon 10 00081 g012
Table 1. Unitary composite recipe.
Sample IDResin (g)Hardener (g)Filler (g)
Blank epoxy0.670.33-
5 wt.% Fe@BC0.660.340.05
10 wt.% Fe@BC0.600.300.10
20 wt.% Fe@BC0.530.270.20
5 wt.% BC0.660.340.05
10 wt.% BC0.600.300.10
20 wt.% BC0.530.270.20
Table 2. Elemental analysis of BC and Fe@BC through EDX analysis.
SampleElemental Composition (wt.%)
COFe
BC88.811.20.0
Fe@BC3.531.265.3
Table 3. Spearman’s coefficient of composites for tensile tests.
Tensile TestElastic ModulusUTSElongation at BreakToughness
GpaVariation (%)MpaVariation (%)%Variation (%)MJ/m3Variation (%)
Epoxy1.1 ± 0.0023.8 ± 1.605.9 ± 0.200.61 ± 0.030
5 wt.% Fe@BC1.2 ± 0.0+929.1 ± 2.3+224.6 ± 1.3−220.58 ± 0.14−5
10 wt.% Fe@BC1.1 ± 0.2+030.3 ± 1.8+273.7 ± 0.2−370.42 ± 0.01−31
20 wt.% Fe@BC1.4 ± 0.1+2721.7 ± 1.7−91.8 ± 0.1−690.12 ± 0.02−80
ρ0.898−0.803−0.944−0.944
5 wt.% BC1.4 ± 0.1+2730.0 ± 1.5+263.4 ± 0.4−420.39 ± 0.10−36
10 wt.% BC1.7 ± 0.1+5428.2 ± 2.4+181.9 ± 0.2−680.17 ± 0.04−72
20 wt.% BC2.1 ± 0.1+9031.5 ± 2.2+321.7 ± 0.1−710.17 ± 0.01−72
ρ0.950−0.254−0.930−0.821
Table 4. Spearman’s coefficient of composite under flexural tests.
Flexural TestFlexural ModulusMaximum StressDeformation at Break
GpaVariation (%)MpaVariation (%)%Variation (%)
Epoxy1.5 ± 0.1052.1 ± 2.107.9 ± 1.90
5 wt.% Fe@BC1.5 ± 0.1+048.9 ± 3.2−65.6 ± 1.2−29
10 wt.% Fe@BC2.0 ± 0.3+3343.5 ± 7.0−172.4 ± 0.2−70
20 wt.% Fe@BC2.2 ± 0.1+4733.9 ± 5.4−351.6 ± 0.4−80
ρ0.860−0.930−0.931
5 wt.% BC0.8 ± 0.0−4715.7 ± 0.2−702.4 ± 0.3−70
10 wt.% BC0.9 ± 0.1−5314.5 ± 2.7−721.6 ± 0.2−80
20 wt.% BC2.6 ± 0.5+7336.4 ± 5.0−301.4 ± 0.1−82
ρ0.8960.731−0.870
Disclaimer/Publisher’s Note: The statements, opinions and data contained in all publications are solely those of the individual author(s) and contributor(s) and not of MDPI and/or the editor(s). MDPI and/or the editor(s) disclaim responsibility for any injury to people or property resulting from any ideas, methods, instructions or products referred to in the content.