Article

Preferential Stripping Analysis of Post-Transition Metals (In and Ga) at Bi/Hg Films Electroplated on Graphene-Functionalized Graphite Rods

SensorLab, Department of Chemistry, University of the Western Cape, Robert Sobukwe Road, Bellville 7535, South Africa
*
Author to whom correspondence should be addressed.
Submission received: 25 July 2024 / Revised: 30 October 2024 / Accepted: 7 November 2024 / Published: 12 November 2024

Abstract

:
In this study, we introduce a novel electrochemical sensor combining reduced graphene oxide (rGO) sheets with a bismuth–mercury (Bi/Hg) film, electroplated onto pencil graphite electrodes (PGEs) for the high-sensitivity detection of trace amounts of gallium (Ga3+) and indium (In3+) in water samples using square wave anodic stripping voltammetry (SWASV). The electrochemical modification of PGEs with rGO and bimetallic Bi/Hg films (ERGO-Bi/HgF-PGE) exhibited synergistic effects, enhancing the oxidation signals of Ga and In. Graphene oxide (GO) was accumulated onto PGEs and reduced through cyclic reduction. Key parameters influencing the electroanalytical performance, such as deposition potential, deposition time, and pH, were systematically optimized. The improved adsorption of Ga3+ and In3+ ions at the Bi/Hg films on the graphene-functionalized electrodes during the preconcentration step significantly enhanced sensitivity, achieving detection limits of 2.53 nmol L−1 for Ga3+ and 7.27 nmol L−1 for In3+. The preferential accumulation of each post-transition metal, used in transparent displays, to form fused alloys at Bi and Hg films, respectively, is highlighted. The sensor demonstrated effective quantification of Ga3+ and In3+ in tap water, with detection capabilities well below the USEPA guidelines. This study pioneers the use of bimetallic films to selectively and simultaneously detect the post-transition metals In3+ and Ga3+, highlighting the role of graphene functionalization in augmenting metal film accumulation on cost-effective graphite rods. Additionally, the combined synergistic effects of Bi/Hg and graphene functionalization have been explored for the first time, offering promising implications for environmental analysis and water quality monitoring.

Graphical Abstract

1. Introduction

In contemporary times, there is a surging interest within environmental communities in developing methodologies for detecting, remediating, and quantifying trace metals, including Gallium and Indium. This heightened interest is primarily driven by the imperative to ensure effective wastewater treatment [1,2,3,4,5]. Recently, semiconductor materials like III–V semiconductors (e.g., InAs, InP, GaAs, and GaP) have emerged as crucial strategic materials extensively employed in high-tech industries for devices like light-emitting diodes, semiconductor laser diodes, solar cells, optical computers, and liquid crystal displays. Indium and Gallium, both belonging to group IIIA metallic elements, exhibit semiconductor or optoelectronic characteristics and find widespread application in thin-film transistor liquid crystal display (TFT-LCD) production for television screens, portable computer screens, and cell phone displays [6,7].
The etching wastewater discharged from semiconductor or optoelectronic plants contains trace amounts of Indium and its compounds, suspected to be carcinogenic to humans and capable of causing damage to the heart, kidney, and liver [4,8]. Consequently, there is a growing interest in developing new methods to determine trace Indium in the environment, motivated by health and environmental concerns. Similarly, trace amounts of Gallium exist in the human body through natural water, vegetables, and fruits, although its physiological function remains unknown. Gallium (III) can easily be absorbed into the blood as the transferrin–gallium complex due to its similarity to Fe (III). Some Gallium compounds have demonstrated anti-inflammatory and immunosuppressive activities, making them potential antimicrobial agents against certain pathogens [9,10,11,12,13,14]. The increasing use of Gallium and its compounds has led to a rise in Gallium levels in the environment around industrial areas, necessitating studies on the determination of trace Gallium in environmental or biological samples.
Traditionally, the determination of trace metals has been conducted using techniques such as atomic absorption spectroscopy (AAS) or inductively coupled plasma atomic emission spectroscopy (ICP-AAS) and ICP-mass spectrometry (ICP-MS) [5,15]. However, these methods are expensive, require qualified personnel, and are time-consuming. An alternative approach involves electrochemical sensors, with electrochemical stripping voltammetry emerging as a valuable technique. Among these, anodic stripping voltammetry (ASV) stands out due to its ability to accumulate metal ions at the electrode surface, resulting in high sensitivity and low detection limits [16,17,18,19].
Electrode materials are crucial in stripping voltammetry. Carbon-based electrodes have been favoured in various applications due to their favourable potential ranges and minimal contribution to background current [20,21,22,23]. Of these, pencil rods made of graphite, referred to as pencil graphite electrodes (PGE), have gained popularity in recent years owing to their favourable characteristics, including good electro-conductivity, low cost, disposability, and the absence of time-consuming pretreatments [24,25,26]. Additionally, the modifications to PGE surfaces and treatment steps cause changes in reactivity and active area [27,28,29,30,31].
The utilization of graphene and reduced graphene oxide in carbon electrode functionalization improves surface area, strength, conductivity, and ease of functionalization [32,33,34,35,36,37]. Graphene-based electrodes, particularly those modified with graphene oxide, have demonstrated superior detection capabilities, resulting in environmental and biological sensors [38,39,40,41,42]. Adjusting the surface area while maintaining the ratio, ease of functionalization, and improved electron-transport kinetics is leveraged for improved detection sensitivity in a range of electrochemical sensors.
Mercury electrodes have historically yielded the best analytical results due to their excellent electrochemical performance. Mercury, in its pure liquid form at ambient temperatures, can easily form a fresh surface crucial for sensitive analysis, and it boasts a wide usable potential range [43,44,45,46,47,48]. Mercury films have shown wide application in the stripping analysis of metals [49,50,51]. Thin bismuth-film electrodes have shown similar or comparable results to mercury-film electrodes, due to their alloy formation capabilities offering improved sensitivity, resolution, and simplicity [52,53,54,55,56]. The formation of Bi and Hg films has been leveraged for the past 2–3 decades and are well documented in the literature. It is believed that the high concentration of metallic film material used over the analyte (usually >1000 times) leads to film formation instead of nanoparticles. To the best of our knowledge, all work reporting the formation of bismuth nanoparticles has used chemical and other methods for the synthesis of the nanostructures with electrochemical methods used only for electrodeposition. The synergistic effects of Bi/Hg bimetallic films have been leveraged in a handful of studies for the stripping analysis of heavy metals [48,57,58]. To date, only one study has investigated its use for the determination of metalloids or transition metals, establishing a unique gap in current research for further exploration [59]. Moreover, the high affinity of the cation-π interactions facilitates the electroplating of metallic films at carbon nanostructure surfaces.
In this specific study, the pencil graphite electrode (PGE) was electrochemically modified with reduced graphene oxide. The resulting modified pencil graphite electrode, in conjunction with an in situ plated bismuth–mercury film (ERGO-Bi/HgF-PGE), was for the first time employed for the simultaneous determination of Gallium and Indium in water samples. To date, conventional and expensive solid electrode materials or hanging mercury drop electrodes have been reported in all studies for the quantitative determination of In3+ and Ga3+ in various media. This study, therefore, is one of the first reported works using low-cost and disposable alternatives for post-transition metal detection. The method’s detection limit was found to be comparable to those reported in the literature, though lower detection limits have been achieved. Despite this, low detection limits remain a significant challenge for the simultaneous analysis of Gallium and Indium. The utilization of ERGO-Bi/HgF–PGE involves relatively simple modification protocols, and the method yields low detection limits.

2. Materials and Methods

2.1. Chemicals and Reagents

In this investigation, only chemicals of analytical reagent grade were employed, and they were utilized without undergoing additional purification steps. Standard stock solutions, specifically atomic absorption standard solutions with a concentration of 1000 mg L−1, were procured from Sigma-Aldrich (Darmstadt, Germany) and subsequently diluted as needed for the experiments. To create the supporting electrolyte, an acetate buffer with a pH of 4.38 and a concentration of 0.1 M was utilized. The acetate buffer comprised of appropriate ratios of acetic acid and sodium acetate. All solutions were prepared with impurity-free ultra-pure distilled water obtained from MilliporeSigma (Darmstadt, Germany).

2.2. Apparatus

The Metrohm (Herisau, Switzerland), 797 VA Computrace instruments were used for all voltammetry experiments. The experimental setup involved a three-electrode system, where the electrochemically reduced graphene oxide bismuth–mercury film pencil graphite electrode (ERGO-Bi/HgF-PGE) functioned as the working electrode. Additionally, a platinum wire served as the counter electrode, and an Ag/AgCl (saturated KCl) electrode served as the reference electrode. All electrode potentials recorded herein are plotted vs. the Ag/AgCl reference electrode. The standard hydrogen electrode (SHE) potential for the Ag/AgCl reference electrode (saturated KCl) is 0.25 V. All experimental procedures took place in a single-compartment 20 mL voltammetric cell maintained at room temperature.

2.3. Electrochemical Reduction of Grapheme Oxide onto Pencil Graphite Electrodes (ERGO-PGE)

Graphene oxide (GO) dispersions were prepared in aqueous media following a conventional modified Hummer’s method [17,60]. GO nanoplatelets were synthesized from graphite powder in the presence of sodium nitrate, sulfuric acid, and potassium permanganate as oxidizing agents. Alternate acid and ultra-pure water washes were used to purify the resultant GO flakes prior to drying in a desiccator. Subsequently, mechanical exfoliation (1 h) of the prepared graphite oxide was performed in an ultrasonic bath and dispersed in an acetate buffer solution (ABS).
The 6-cm pencil graphite rods (0.5 mm diameter), specifically the Pentel brand, were used as working electrodes for all experiments. Graphite rods inserted into a plastic syringe casing were affixed with copper wire through the top to ensure electrical connection, and 1-cm portions exposed for detection. Before undergoing modification, the surface of the pencil graphite electrode (PGE) was polished with 3M nitric acid and cleaned with deionized water. The electrode was then conditioned through five cycles in an acetate buffer solution (ABS) using cyclic voltammetry. Subsequently, ERGO films were prepared from 1 mg mL−1 graphite oxide (GO) dispersions. Voltammetric scanning between −1.4 V and +0.3 V (vs. Ag/AgCl sat) for five successive cycles resulted in the reduction and deposition of ERGO on the PGE surface. The instrumental parameters for the electrodeposition procedure included a deposition time of 120 s, frequency of 50 Hz, amplitude of 0.04 V, and voltage step of 0.004 V. Following the electrodeposition procedure, the electrochemically reduced graphene oxide-modified pencil graphite electrode (ERGO-PGE) was dried for one hour and then conditioned in an acetate buffer solution (ABS) through square wave voltammetry before each measurement.

2.4. Voltammetric Analysis of Post-Transition Metals (Ga3+ and In3+)

Square wave anodic stripping voltammetry (SWASV) measurements were carried out in a 10 mL solution of 0.1 mol L−1 acetate buffer solution (ABS) with a pH of 4.38. The solution included 200 ppb of bismuth (Bi), 100 ppb of mercury (Hg), and Ga3+ and In3+. Bismuth–mercury films and the target metal ions were deposited onto the ERGO-PGE by in situ coating following fixed potential reduction at −1.2 V (vs. Ag/AgCl sat) for 120 s. An anodic scan of the ERGO-PGE from −1.2 V to −0.5 V (vs. Ag/AgCl sat) through a square-wave waveform was used for detection. At the end of the scan, the ERGO-PGE underwent an electrochemical cleaning process to remove residual metals. This was achieved by applying a potential of 0.5 V (vs. Ag/AgCl sat) for 120 s, ensuring the electrode was thoroughly cleaned from any remaining metal ions. The standard oxidation potentials of Ga3+ (−0.88 V), In3+ (−0.67 V), Bi (−0.10 V), and Hg (0.21 V) recorded at the ERGO-PGE in 0.1 M of acetate buffer solution (pH 4.38) vs. the Ag/AgCl saturated reference electrode is shown in Figure S1. An overview of the ERGO-PGE preparation and stripping procedure (deposition and stripping steps) is given in Scheme 1.

3. Results and Discussion

3.1. Electrochemical Characterization and Optimization of ERGO-Bi/Hg-Film PGEs for the Simultaneous Stripping Analysis of Post-Transition Metals

The electrochemical reduction of graphene oxide (GO) dispersions prepared in 0.1 acetate buffer solution was performed by cyclic voltammetric reduction between −1.4 V and +0.3 V (vs. Ag/AgCl sat) for five successive cycles. The successive reduction and consequent deposition cycles are shown in Figure S2 for 20 cycles. Changes in the oxidation of the PGE surface during successive scans confirm the deposition of electrochemically reduced graphene oxide (ERGO) at the PGE surface. High-resolution scanning electron microscopy (HRSEM) images shown in Figure S3A,B confirm the deposition of ERGO sheets as irregular deposits on the spherical graphitic rod surface.
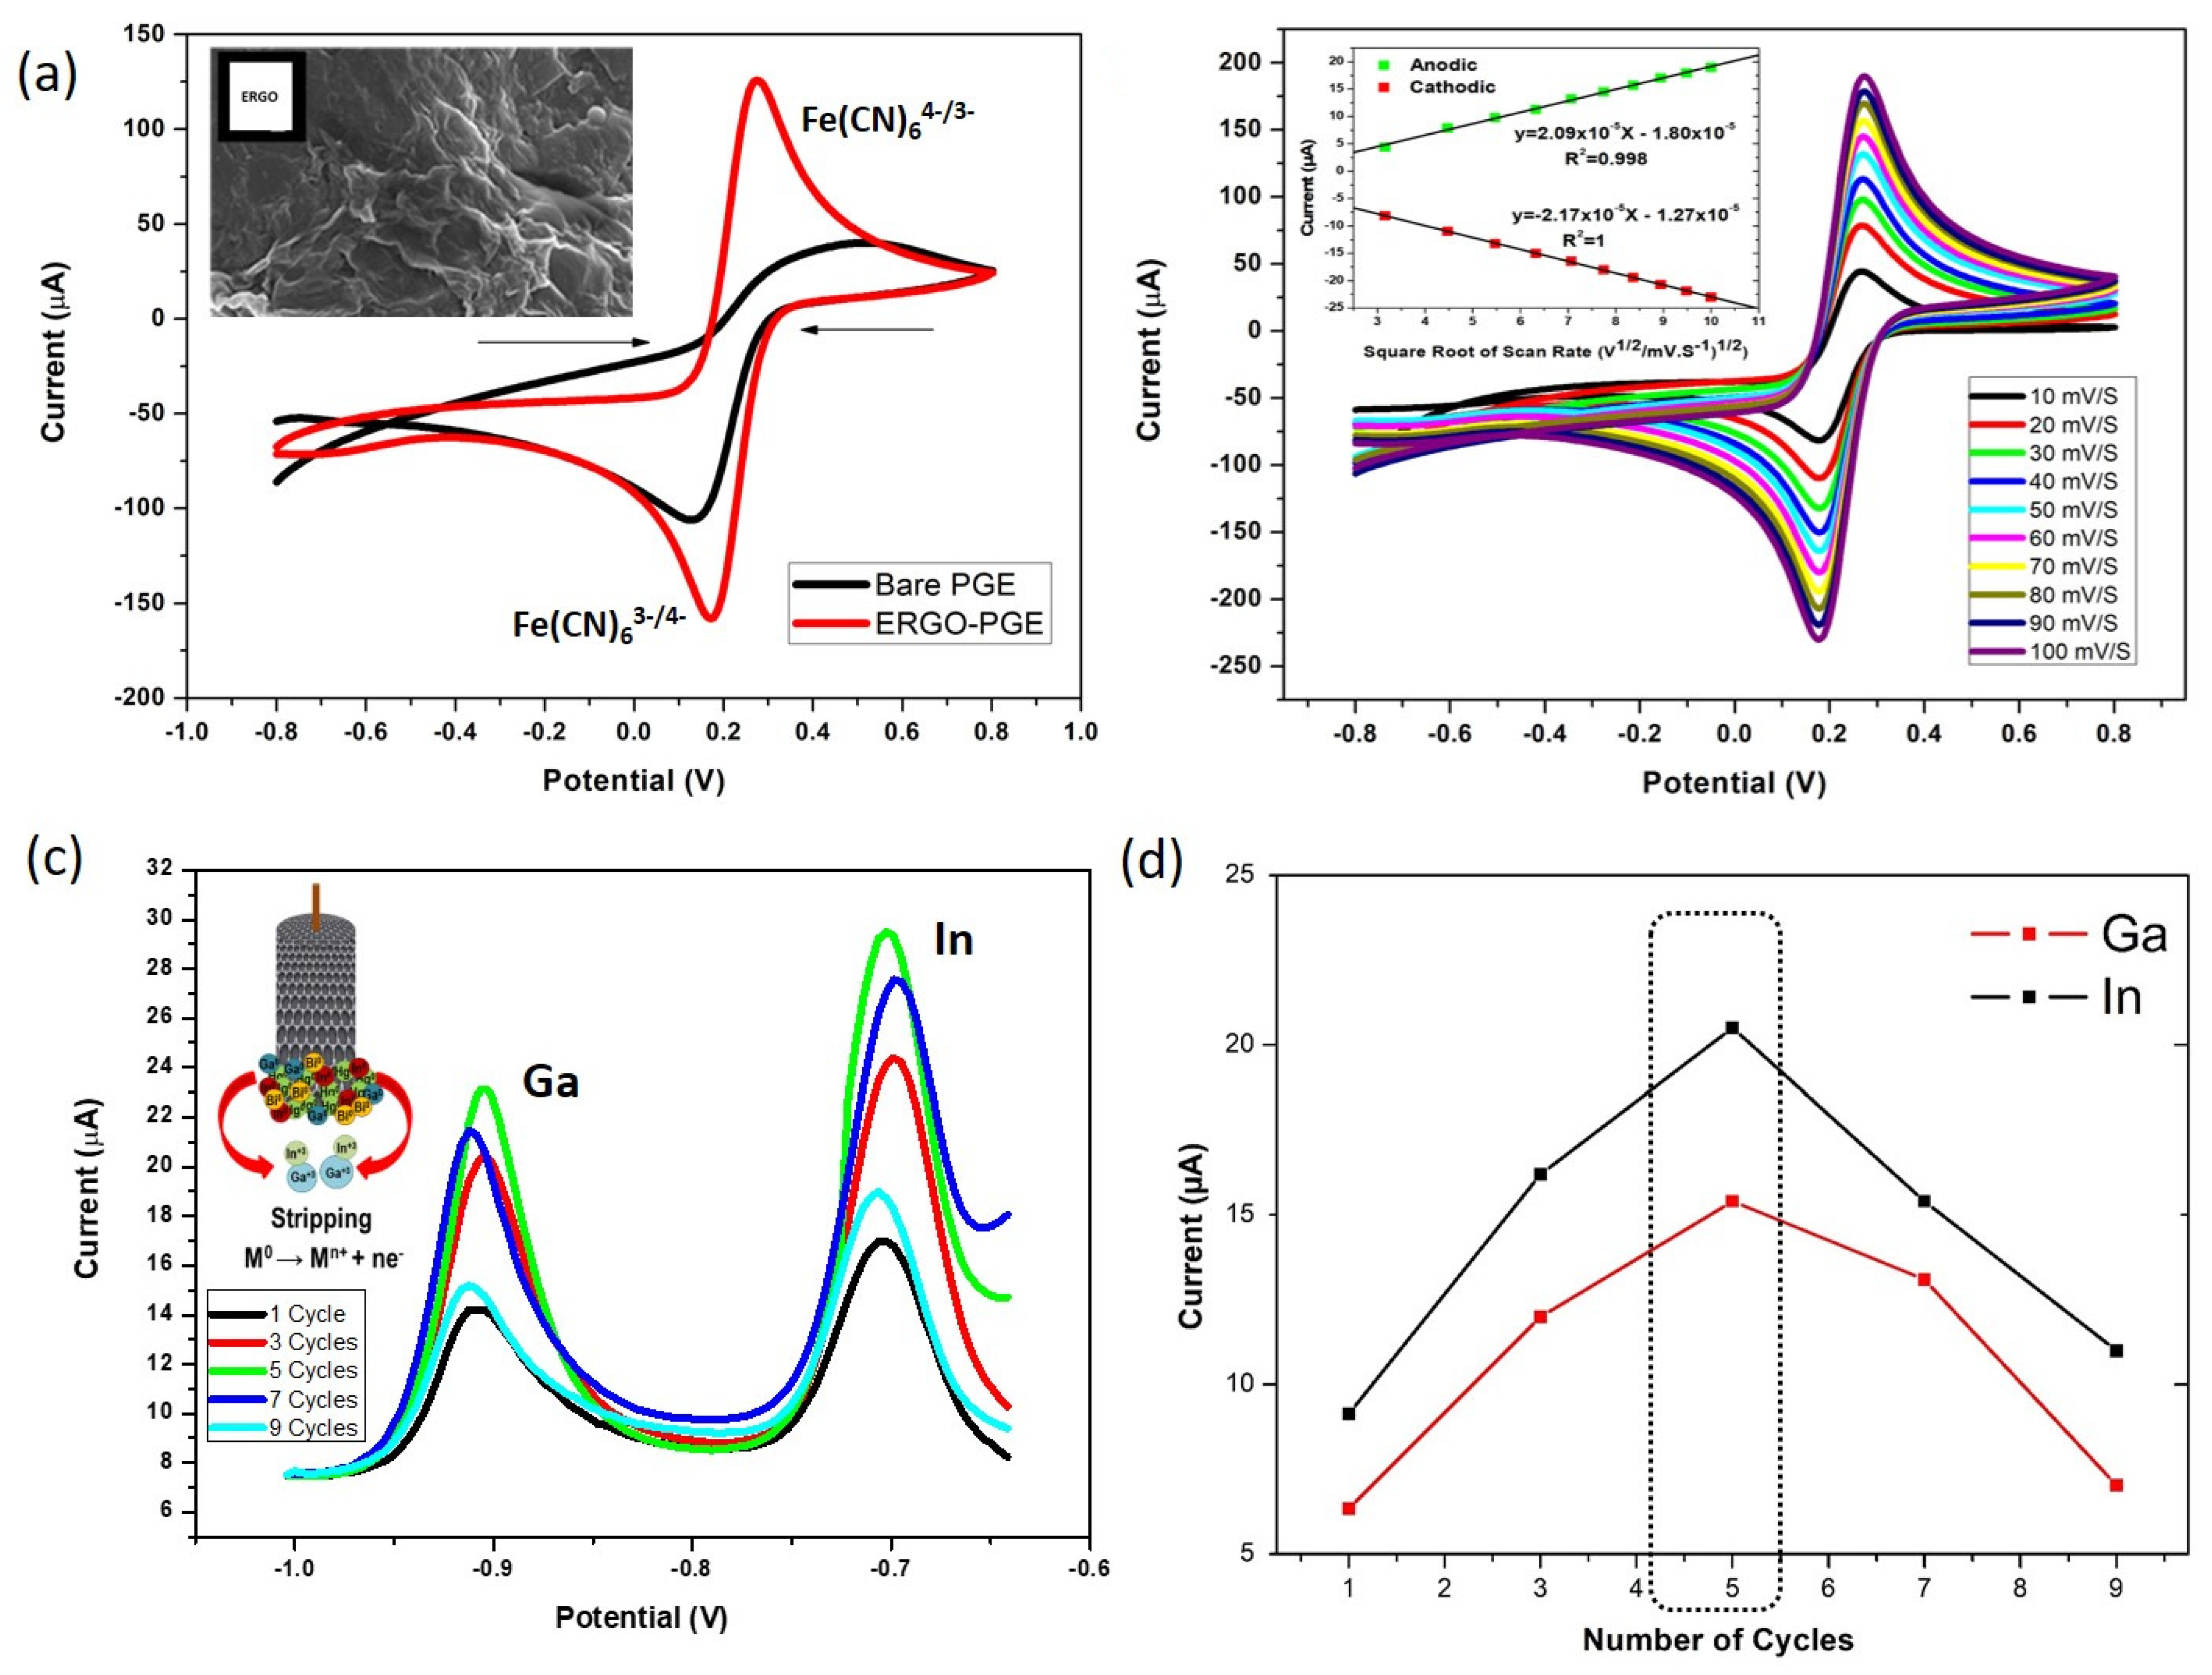
Figure 1a provides a comprehensive visualization of the electrochemical response of the PGE and ERGO-PGE in a ferricyanide solution. This evaluation involves the examination of the oxidation and reduction responses of a 5 mM [Fe (CN) 6]3−/4− redox couple, situated within a 0.1 M KCl solution, at both the unmodified PGE and the PGE modified with electrochemically reduced graphene oxide (ERGO-PGE). The measurements were conducted using cyclic voltammetry, employing a scan rate of 50 mV s−1. Upon close inspection of the results, it is evident that the bare pencil graphite electrode exhibits broad peaks associated with the [Fe (CN) 6]3−/4− redox couple. Notably, at the bare PGE, the separation between the anodic and cathodic peaks measures 0.715 V (vs. Ag/AgCl sat). In stark contrast, the ERGO-PGE displays a notably different electrochemical response. The separation between the anodic and cathodic peaks at the ERGO-PGE is significantly narrower, measuring 0.115 V (vs. Ag/AgCl sat). This reduced peak separation can be attributed to the modifications involving the deposition of reduced graphene oxide (GO). The effect of ERGO modification is reflected in an enhancement of the response current, signifying a substantial improvement in the sensitivity of the ERGO-PGE electrode. This is attributed to the high electrochemical active surface area (ECSA) of the deposited ERGO. This phenomenon signifies a substantial improvement in the sensitivity of the electrode surface. The enhanced sensitivity is primarily a consequence of the higher surface-to-volume ratio associated with the modified ERGO-PGE. This alteration facilitates a more efficient and rapid transfer of electrons, resulting in superior electrochemical performance. The visual representation in Figure 1a effectively captures these changes, demonstrating the positive impact of ERGO modification on the electrochemical response of the pencil graphite electrode.
Figure 1b illustrates the relationship between peak currents and the scan rate across a range of 10 mV s−1 to 100 mV s−1. This assessment is critical in understanding the electrochemical behavior of the system. The peak currents, corresponding to the oxidation and reduction processes, display a distinct and noteworthy pattern; they exhibit a linear increase as the square root of the scan rate increases (see Inset). The observed linearity in the relationship between peak currents and the square root of the scan rate is a significant finding. It strongly suggests that the electrochemical processes at play are predominantly diffusion-controlled. In other words, the observed changes in peak currents are primarily dictated by the rate at which analyte species can diffuse to and from the electrode surface. To further quantify this relationship, a correlation coefficient of 0.996 was obtained for both the anodic and cathodic peak currents concerning the square root of the scan rate. This high correlation coefficient serves as compelling evidence that the electrochemical behavior being studied is indeed governed by a diffusion-controlled process. Such knowledge is vital for designing and optimizing electroanalytical methods, ensuring that the system operates predictably and consistently across different conditions.
The sensitivity and overall performance of any electrode are intricately linked to the efficiency of electron transfer across the deposited film [61,62]. The figure displayed in Figure 1c underscores the influence of the number of graphene oxide (GO) electrodeposition cycles on the oxidation peak of Gallium (Ga3+) and Indium (In3+). Upon careful examination, it is evident that a deposition consisting of five cycles yields the most prominent peak for Ga3+ and In3+. This observation prompts the selection of the five-cycle deposition approach for subsequent experiments aimed at detecting Ga3+ and In3+ at electrodes modified with electrochemically reduced graphene oxide (ERGO-PGE). However, it is noteworthy that the peak current for Ga3+ and In3+ displays a decline beyond the fifth cycle (Figure 1d). This decrease in peak current is primarily attributed to the thickening of the graphene film. As the film thickness increases, it progressively hinders the efficient flow of electrons to the electrode surface. In essence, while a thicker film can be advantageous in certain scenarios, it reaches a point where it starts to impede electron transfer, leading to a reduction in peak current. It is imperative to highlight that the electrodeposition of GO onto the pencil electrode, employing cycling voltammetry, offers a distinct advantage. This advantage lies in the precise control it affords over the thickness of the film deposited on the electrode surface. The ability to modulate film thickness is a key factor in tailoring electrode performance to suit specific analytical requirements.

3.2. The Synergetic Effect of Graphene Sheets and Bismuth-Mercury Film on the Electrochemical Response of Ga3+ and In3+

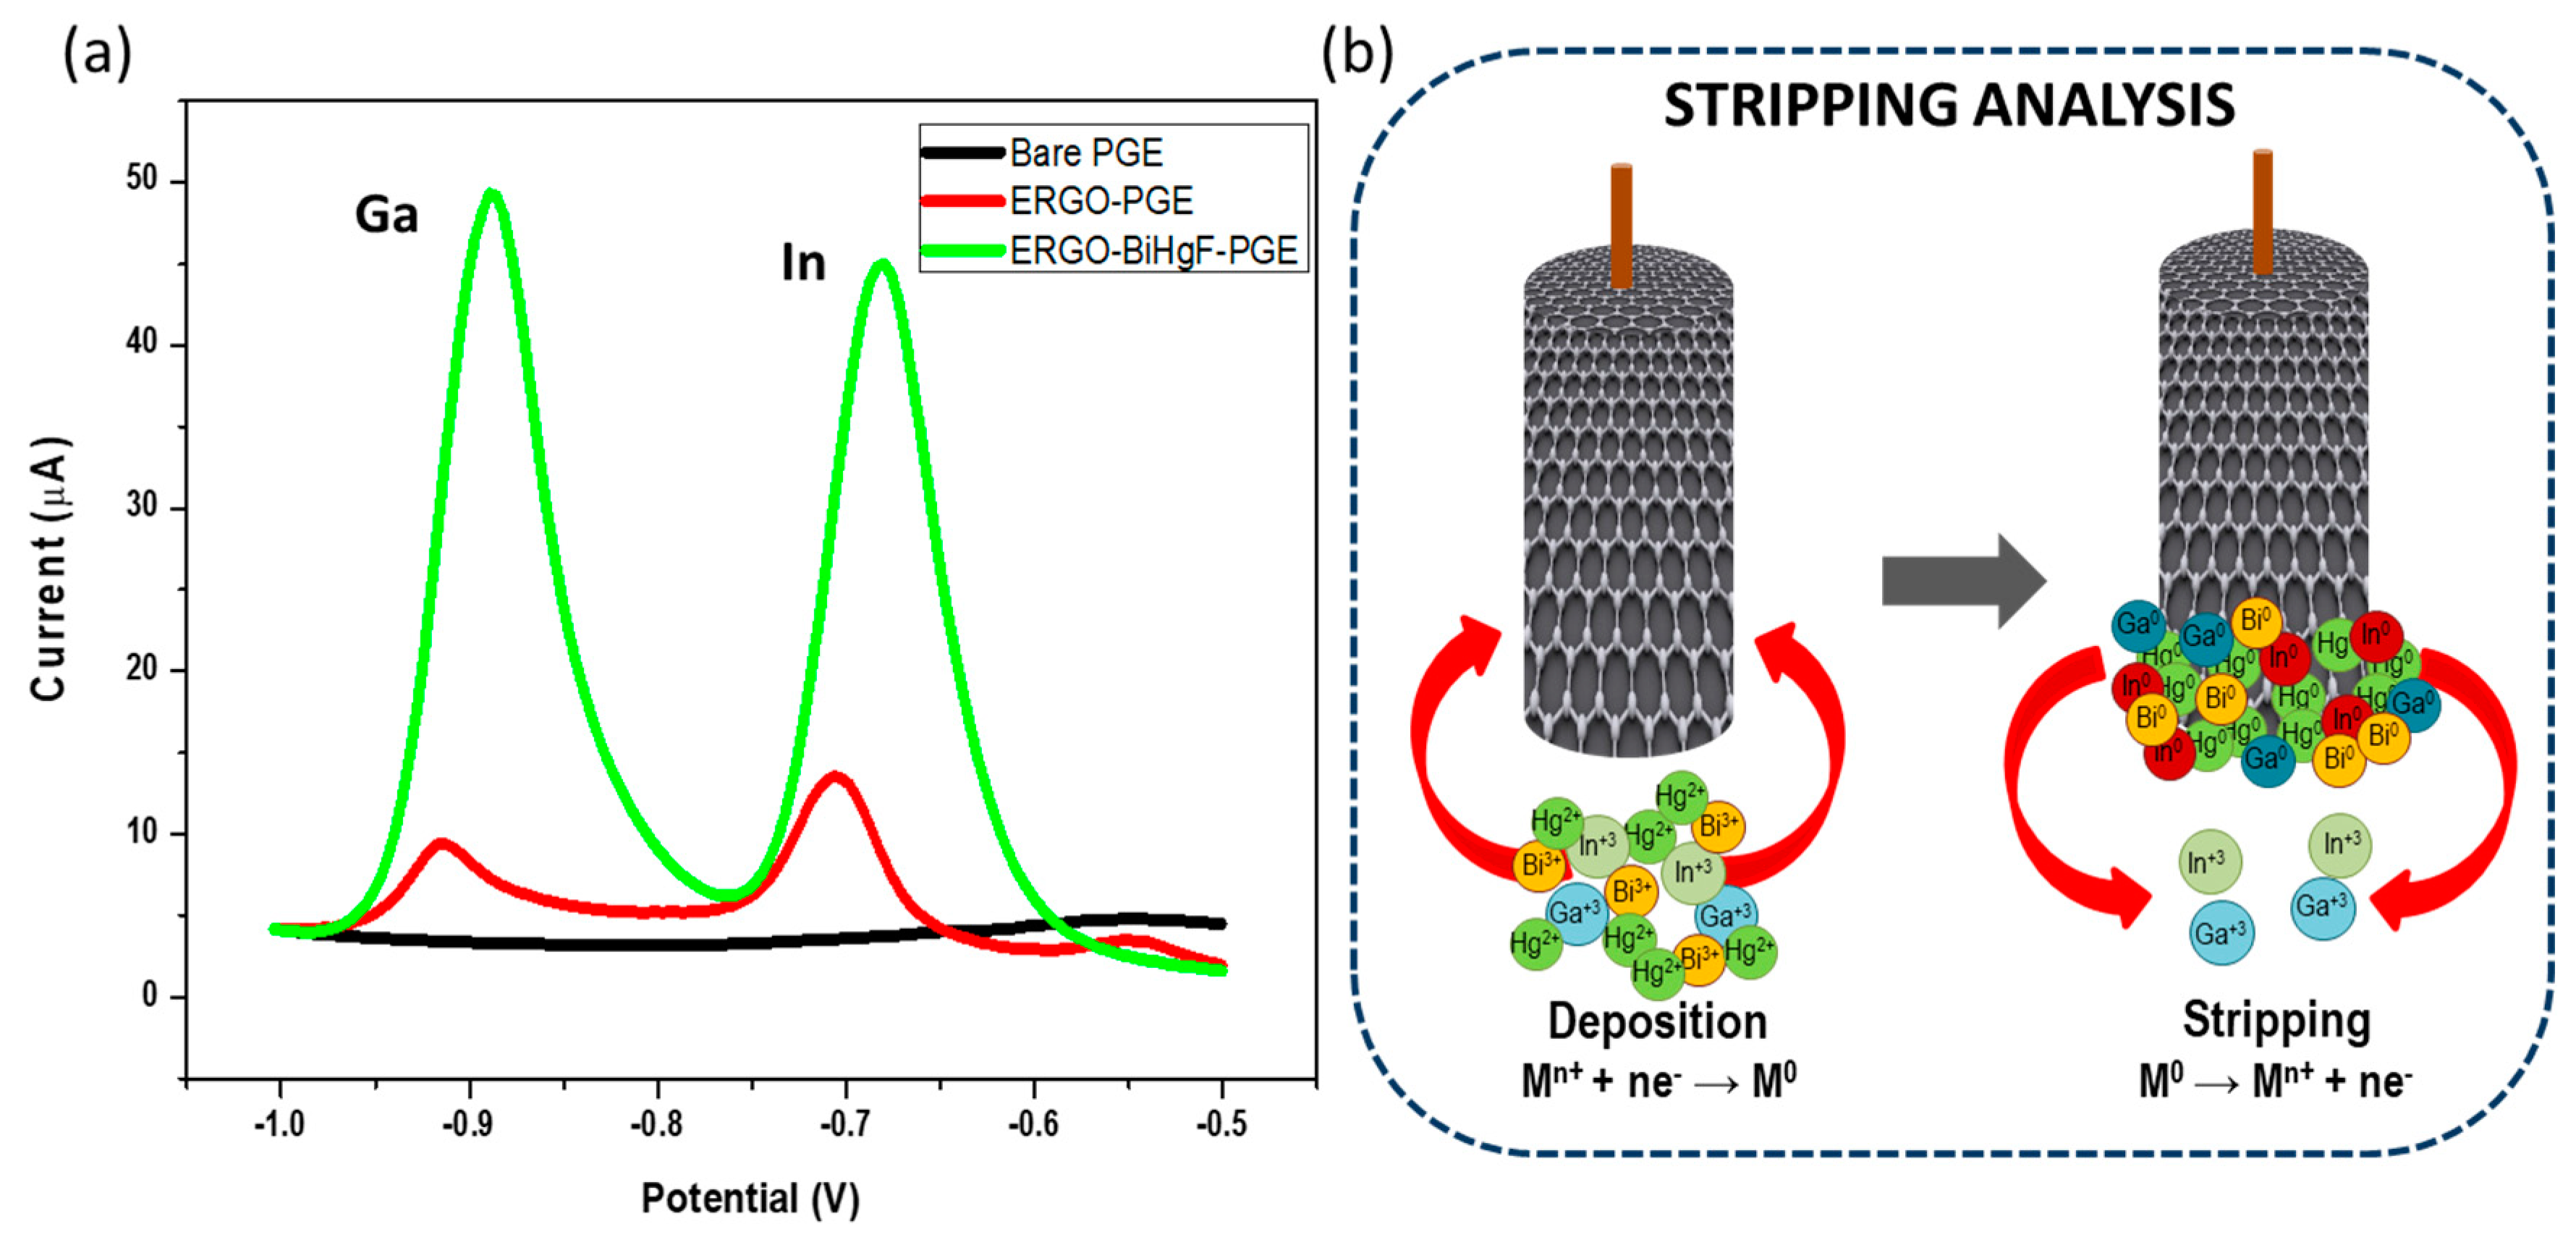
Figure 2a shows changes observed in the oxidation peak heights of 30 ppb Ga3+ and 20 ppb In3+ through the use of Square Wave Anodic Stripping Voltammetry (SWASV). A comparison is made between two types of electrodes: the bare pencil graphite electrode (PGE) and the modified pencil graphite electrode. The competitive stripping analysis of Ga3+ and In3+ at the bimetallic metal-film-functionalized carbon nanostructured electrode surfaces follows the schematic shown in Figure 2b. Reduced graphene oxides have readily been studied for their ability to absorb metal cations through weak intermolecular forces. Cation-π interactions arise as a result of strong attractive forces between positively charged entities and the π-electron cloud of aromatic groups. Typically, Bi and Hg cations are accumulated at the ERGO surfaces through cation-π stacking interactions arising from the unoccupied π-orbitals in the graphene lattice structure. The weak Van der Waal’s interactions and increased active surface area associated with graphene inclusion facilitate metal accumulation at the electrode surface during the deposition step. Accumulated Bi3+ and Hg2+ cations are reduced at the ERGO-functionalized PGE surfaces to create bimetallic films. While this phenomenon has not been independently studied in stripping analysis, the accumulation may follow a similar route to the work performed in membrane analysis and energy applications [63,64]. Simultaneously, target metal ions (Ga3+ and In3+) are reduced to forms with the deposited metallic film:
xMn+ + (nx+3y+2z)e + yBi3+ + zHg2+ → MxBiyHgz)
Bismuth and Mercury were selected for their ability to form alloys with a wide range of metal cations, facilitating Ga3+ and In3+ accumulation for reduction, thereby pre-concentrating the ERGO-PGE surface. Competition for available film sites results in preferential accumulation of In3+ and Ga3+ for the Hg2+ and Bi3+ cations, respectively. Thereafter, the subsequent re-oxidation of the metal cation at prescribed redox potentials causes its stripping, giving rise to two distinct peaks in the stripping step. Upon careful examination, it becomes evident that the oxidation peaks corresponding to Ga3+ and In3+ are distinctly visible only when the electrode is subject to modification with electrochemically reduced Graphene Oxide (ERGO). This is a crucial observation, indicating the pivotal role played by the ERGO modification in enabling the electrochemical determination of these analytes. Notably, a substantial and noteworthy enhancement in the peak height is observed when transitioning from the bare PGE to the ERGO-Bi/HgF-PGE, as illustrated in Figure 2. This enhancement in peak currents can be attributed to several key factors. First and foremost, the introduction of ERGO-Bi/HgF on the electrode’s surface significantly increases the surface area-to-volume ratio. The resulting high surface area within the nanometer range (1–100 nm) is instrumental in promoting enhanced conductivity and electron transfer. The concept of quantum confinement plays a crucial role in this context. This phenomenon, occurring at the nanoscale, effectively confines electrons and other charge carriers within specific energy levels, leading to more efficient electron transfer processes. The combined synergistic effects of the ERGO cation-π stacking and alloy formation (between Ga3+ and In3+ and bimetallic Bi/Hg-films) gives rise to high sensitivity. As a result, the ERGO-Bi/HgF-PGE exhibits superior electrochemical performance, enabling the precise and sensitive determination of Ga3+ and In3+ in the tested samples. This heightened sensitivity is essential for trace analysis in various fields, making the ERGO-Bi/HgF-PGE a valuable tool in analytical chemistry and environmental monitoring. The bimetallic ERGO-Bi/HgF-PGE was compared to the ERGO-BiF-PGE and ERGO-HgF-PGE and the results are shown in Figure S4. Enhanced peak currents are shown for both Ga3+ and In3+ over the monometallic counterparts under optimized Bi and Hg concentrations.

3.3. Experimental Parameter Optimization of ERGO-Bi/Hg-Film PGE for Ga3+ and In3+ Detection

The impact of electrochemical cleaning on the restoration of the initial response of Ga3+ and In3+ at the ERGO-PGE was subject to thorough investigation using Square Wave Anodic Stripping Voltammetry (SWASV). As depicted in Figure 3a, the relationship between the oxidation peaks of Ga3+ and In3+ at the ERGO-PGE and the electrochemical cleaning process is elucidated. Figure 3a clearly illustrates that a remarkable recovery of the original response of Ga3+ and In3+ can be achieved through the systematic application of electrochemical cleaning to the electrode. The restoration of the peak height and signal intensity is particularly significant for accurate and reliable analysis, ensuring that subsequent measurements yield consistent and precise results. After careful examination, it was determined that a cleaning duration of 120 s using electrochemical cleaning delivered the most effective recovery of the electrode’s initial response. This duration was established as the optimal cleaning time for further measurements, as it strikes a balance between thorough cleaning and efficient recovery. The chosen 120 s cleaning time ensures that the ERGO-PGE remains in an optimal condition for the sensitive and accurate determination of Ga3+ and In3+ in subsequent analyses. This process enhances the reliability and reproducibility of the analytical results, making it a critical step in the electroanalytical methodology employed in this study. For each experimental set, the same modified electrodes are employed and subjected to electrochemical cleaning between successive measurements. Given the low cost of pencil graphite electrodes, a freshly modified electrode is utilized for each distinct set of experiments.
The influence of pH on the stripping peak current (Ip) was meticulously examined through a series of square wave voltammetry measurements conducted within a pH range spanning from 4.08 to 4.58. The analyte solution comprised 10.0 ppb Ga3+ and 2.0 ppb In3+, as depicted in Figure 3b. The relationship between pH and the stripping peak current (Ip) for Ga3+ and In3+ was clearly observed. It is evident from the data that the peak current for Ga3+ reaches its maximum magnitude at a pH of 4.38. At this pH, two distinct and well-defined oxidation peaks, corresponding to Ga3+ and In3+, are clearly discernible. The selection of pH 4.38 as the optimal pH setting is of paramount importance for subsequent Ga3+ and In3+ measurements. At this pH, the analytical system exhibits the highest sensitivity and provides a clear demarcation between the oxidation peaks of Ga3+ and In3+. The use of pH 4.38 ensures that the electroanalytical methodology is operating under conditions that yield the most precise and reliable results, enhancing the overall accuracy of the measurements.
Reduction potentials influence the deposition of Ga3+ and In3+ at the ERGO-Bi/HgF-PGE. Their influence on peak currents was methodically investigated within a potential range spanning from −1.0 V to −1.7 V (vs. Ag/AgCl sat). The data presented in Figure 3c provide insights into the influence of deposition potential on the electrochemical behavior of these metal ions. At deposition potentials more negative than −1.2 V (vs. Ag/AgCl sat), a signal emerges at approximately −1.3 V (vs. Ag/AgCl sat). This signal is attributed to the formation of a Ga-In-Hg amalgam, a phenomenon that suppresses the reduction reaction responsible for the deposition of metal ions from the solution onto the electrode surface. In general, the peak currents corresponding to In and Ga exhibit an upward trend as the deposition potential becomes more negative. This increase in peak current is especially pronounced, up to −1.2 V (vs. Ag/AgCl sat) for In3+ and up to −1.4 V (vs. Ag/AgCl sat) for Ga3+. This behavior can be attributed to the preferential reduction and deposition of In3+ and Ga3+ at the electrode surface under these conditions. However, it is noteworthy that beyond the deposition potential of −1.2 V (vs. Ag/AgCl sat), electrode saturation occurs, leading to a decline in the stripping response for In3+. As a result, a deposition potential of −1.2 V (vs. Ag/AgCl sat) was judiciously selected for further analysis. This choice ensures that the electrode operates in a regime that maximizes the analytical sensitivity for In3+ and Ga3+, contributing to more accurate and reliable measurements.

3.4. Intermetallic Interferences

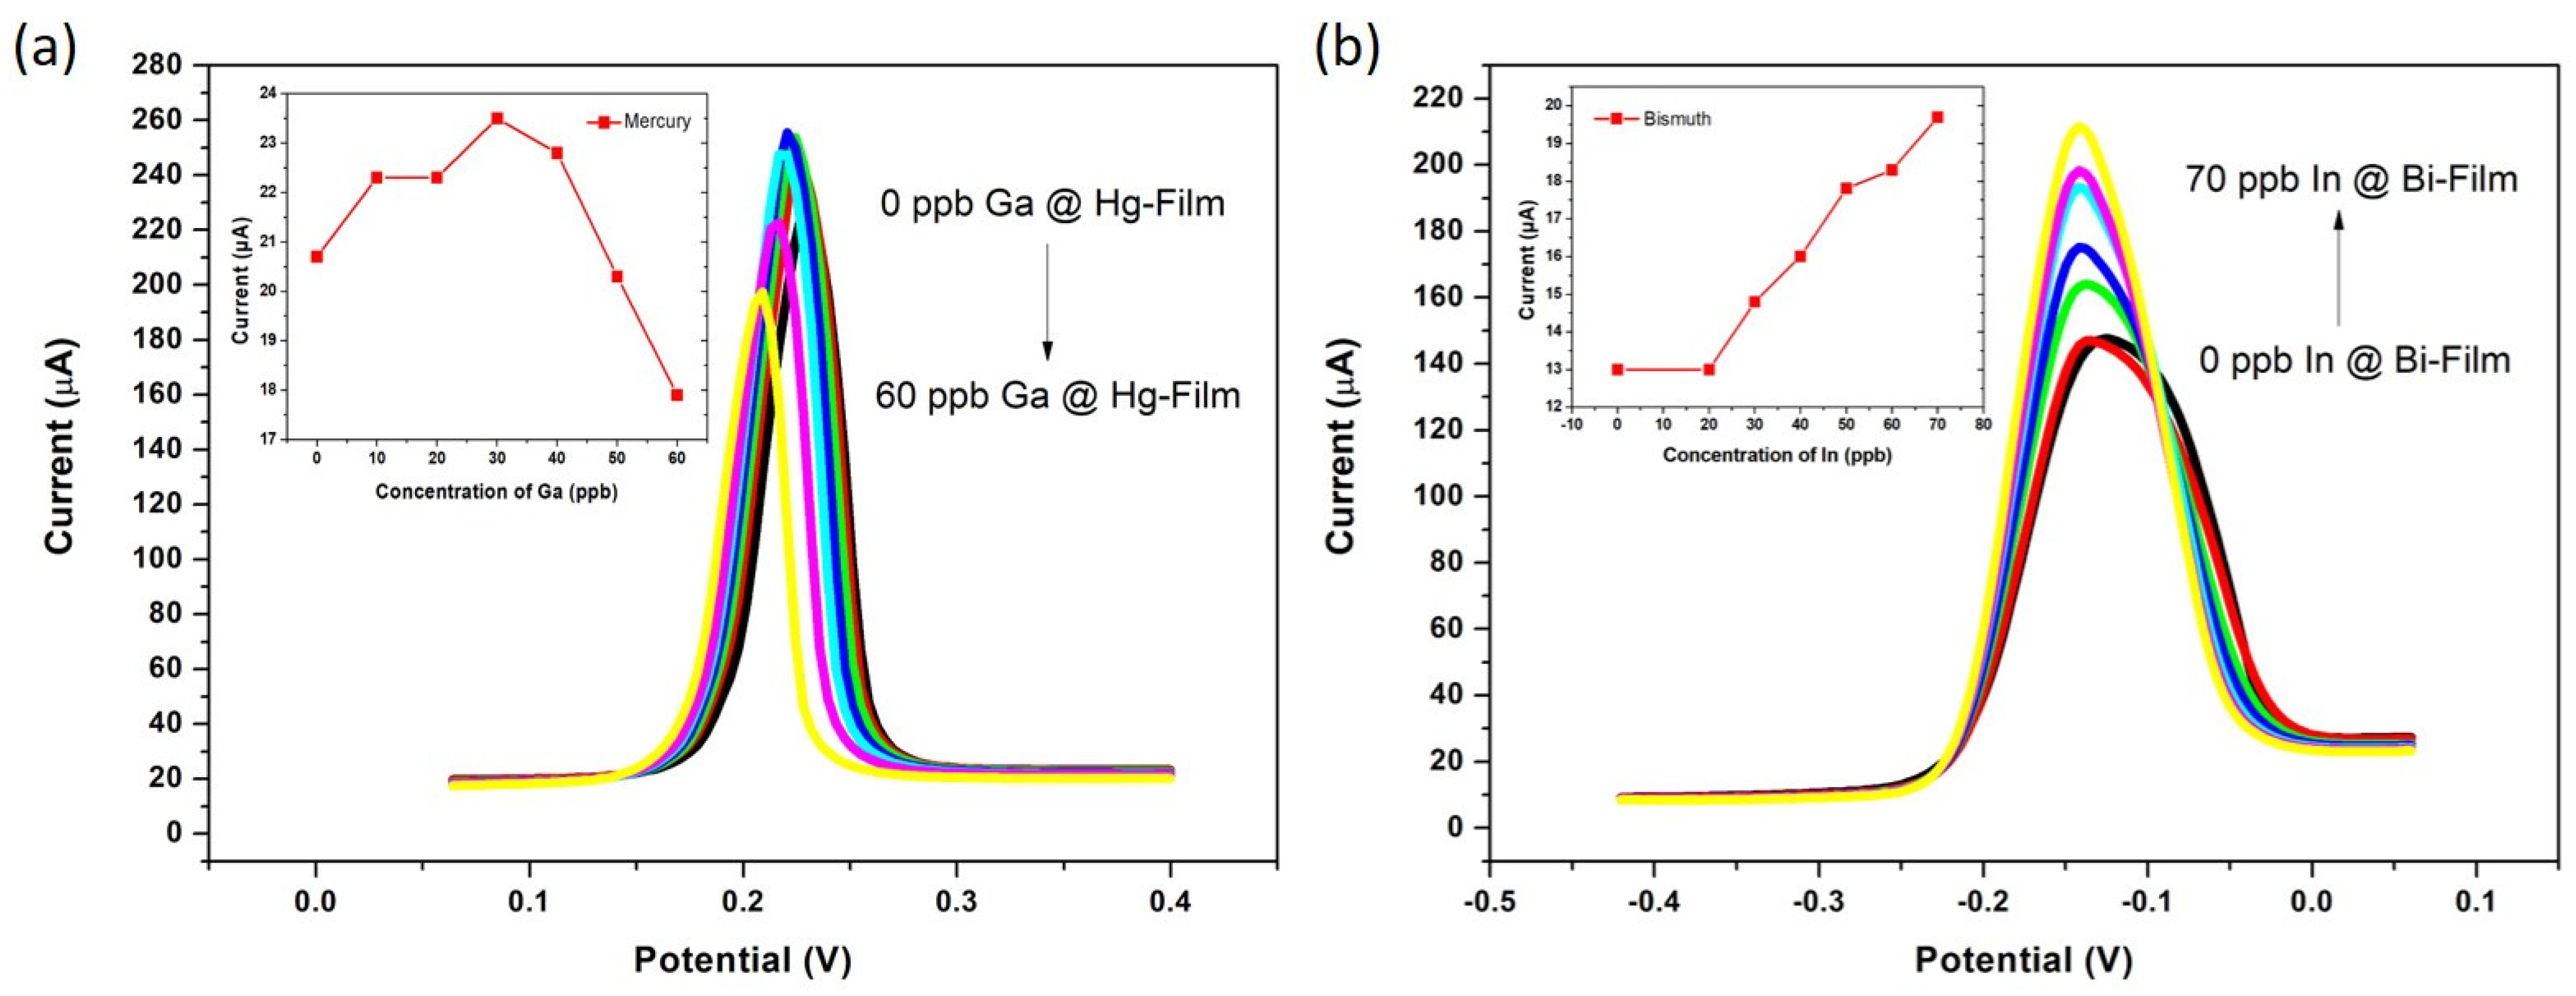
Mercury and Bismuth films notably show markedly different performances for accumulating In3+ or Ga3+ ions at the electrode surface, respectively. Figure 4a,b show the effect of (a) Ga3+ concentration and (b) In3+ concentration on Hg and Bi film formation. The data clearly indicate that during the deposition of Ga3+ onto the electrode surface, competition ensues between Hg and Ga3+ ions for available surface sites on the electrode. Consequently, with increasing Ga3+ concentration, less Hg is plated at the surface of the ERGO-PGE. Conversely, an increase in In3+ concentration increases Bi plating due to fused alloy formation. The findings highlight preferential interactions between Ga3+ and Hg, and In3+ and Bi, respectively.
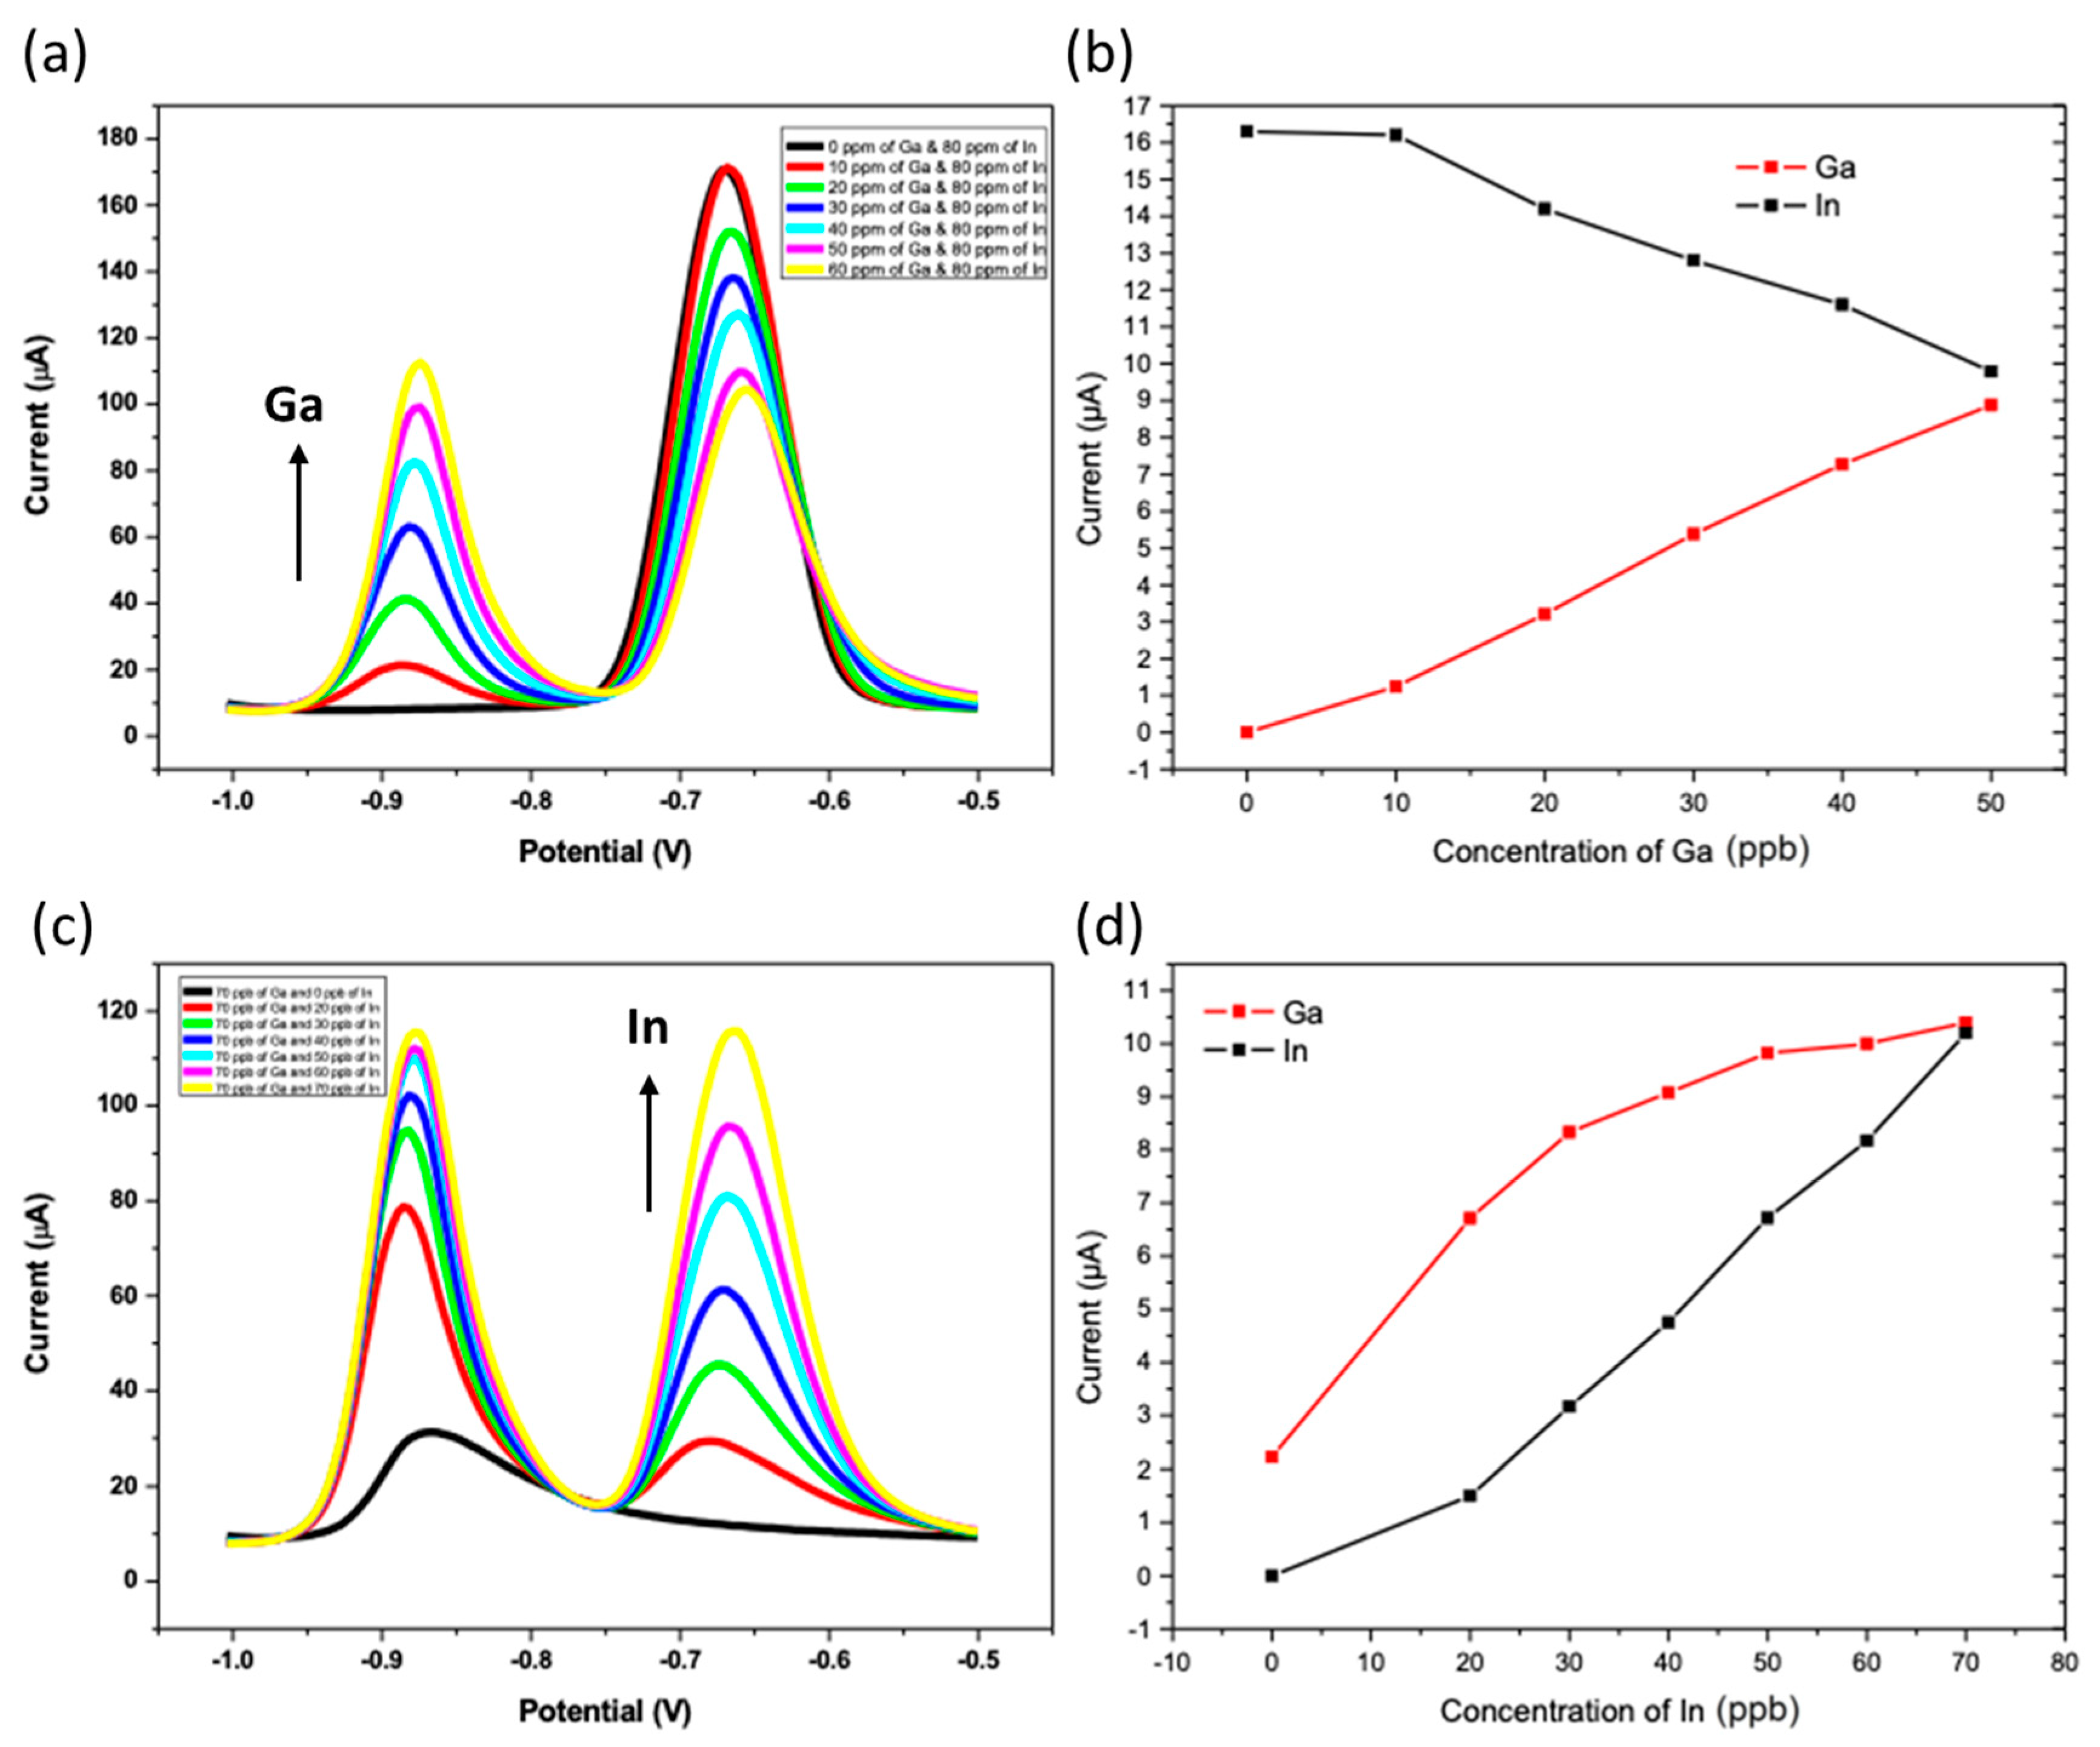
Figure 5a,b provide valuable insights into the interaction between Ga3+ ions and the peak height of In3+ at a constant concentration of In3+. The literature indicates that gallium demonstrates selectivity toward bismuth, while indium exhibits selectivity toward mercury [65]. As illustrated in Figure 5b, the amount of deposited gallium on the electrode surface has a direct and significant impact on the In3+ peak height during anodic stripping. This observation aligns with the fact that Ga3+ ions experience a faster rate of reduction compared to Hg ions. Consequently, the number of unoccupied sites on the electrode surface, which can be utilized for the electrodeposition of mercury from the solution, decreases as the amount of deposited gallium increases. The net result of this competition is the inhibition of deposited mercury, limiting the formation of an In3+ amalgam. This phenomenon becomes more pronounced with a decrease in the amount of electrodeposited mercury on the electrode surface. These insights are critical for understanding and optimizing the electrochemical behavior of In3+ and Ga3+ ions, thereby enhancing the accuracy and efficiency of subsequent analytical measurements.
Figure 5c provides a clear depiction of the influence of In3+ ions on the oxidation response of gallium ions. The data reveal an interesting trend, as depicted in Figure 5d, where an increase in the concentration of indium results in a continuous and noticeable enhancement in the oxidation peak of a constant amount of gallium. In simpler terms, as the concentration of indium ions in the solution increases, the electrochemical response of gallium ions during oxidation becomes increasingly pronounced. This observed phenomenon indicates an accelerated electrodeposition of bismuth ions on the surface sites of the electrode, effectively outperforming indium ions. This intensified electrodeposition of bismuth, known for its stronger affinity with gallium, leading to the formation of a gallium-fused alloy, ultimately manifests in a heightened Ga3+ oxidation peak.
Figure S5 illustrates the investigation into interferences from other metal ions in the water samples, using standard addition and spiking techniques. Metal ions that interfere with Ga3+ and In3+ were added to the test solution. These ions can form alloys with bismuth or amalgams with mercury. They may also produce reduction peaks that overlap with or suppress the Ga3+ and In3+ peaks, thus affecting measurement accuracy. The study evaluated the impact of Zn2⁺, Cd2⁺, Pb2⁺, Ni2⁺, Co2⁺, and Cu2⁺. Notably, a two-fold excess of Pd2⁺ and a three-fold excess of Co2⁺ caused a 30% and 20% decrease in Ga3+ peak currents, respectively, and a 10% and 5% decrease in In3+ peak currents. The remaining metals did not interfere with Ga3+ and In3+ measurements, improving the method’s selectivity and reliability.

3.5. Analytical Performance of the ERGO-Bi/Hg-Film PGEs for the Individual Determination of Ga3+ and In3+

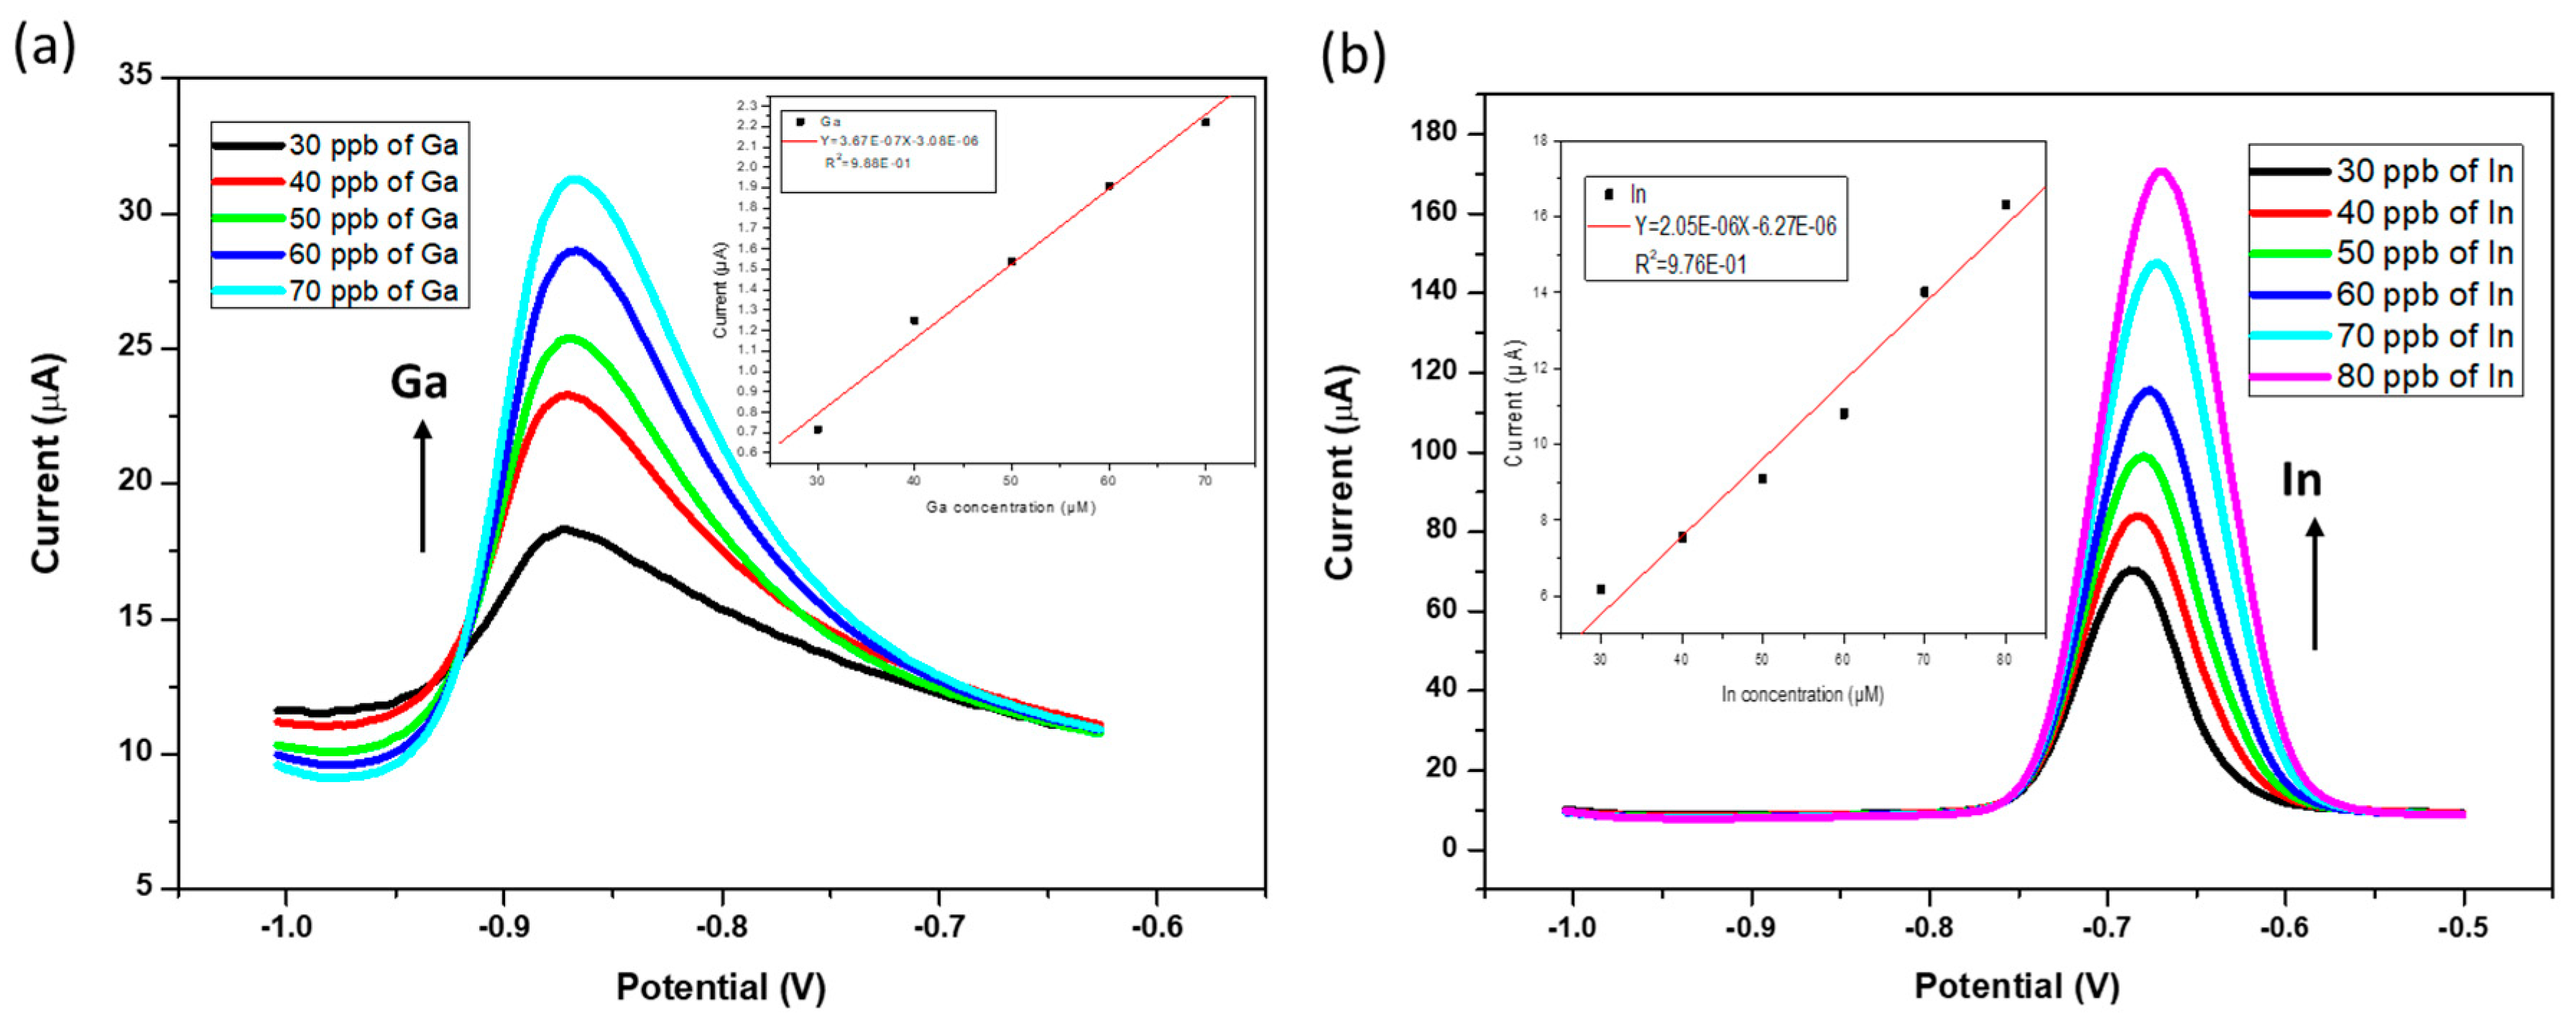
The analytical performance of the developed ERGO-Bi/Hg-film PGEs for the individual analysis of Ga3+ and In3+ in test samples was evaluated in test solutions using an acetate buffer as the electrolyte. The detection limit was determined by constructing a calibration curve for Ga3+ using the optimized SWASV conditions at the ERGO-Bi/HgF-PGE. The relationship between Ga3+ concentration (ranging from 30 to 70 ppb) and peak current is illustrated in Figure 6a. Increases in the stripping peak current associated with the three-electron oxidation of Ga0 to Ga3+ were observed during the anodic scan, with no observable shift in peak potential. The data shown in the inset display a linear correlation between Ga3+ concentration and peak current, with a noteworthy correlation coefficient of 0.988 (n = 3). The linear regression equation for the calibration curves (n = 3) was employed to determine the DL. The equation is as follows:
I(µA) = 0.367 (µA/ppb) [Ga3+] (ppb)−3.08 (µA)
I(µA) = 25.59 (µA/µM) [Ga3+] (µM) − 3.08 (µA)
Using the 3σ/slope ratio, where σ represents the standard deviation of the mean value from 10 voltammograms of the blank, the detection limit was determined to be 1.02 µM. This value signifies the lowest concentration of gallium that can be reliably detected under the given experimental conditions.
Similarly, the ERGO-Bi/Hg-film PGE was investigated for In3+ analysis. A linear correlation between In3+ concentration, ranging from 30 to 80 ppb, was found, and peak current was observed with a commendable correlation coefficient of 0.976, as depicted in Figure 6b. The standard deviation was determined based on the linear regression equation for the average of calibration curves (n = 6), expressed as follows:
I(µA) = 2.05 (µA/ppb) [In3+] (ppb) − 3.08 (µA)
I(µA) = 235.38 (µA/µM) [In3+] (µM) − 3.08 (µA)
The detection limit for In3+ using the ERGO-PG-Bi/HgFE was calculated using the following formula:
D.L. = 3σ/slope
Here, D.L. stands for the limit of detection, 3σ denotes three times the standard deviation of the blanks, and Slope represents the gradient (slope) of the calibration curve. Blanks were recorded at the ERGO-Bi/HgF-PGE in 0.1 M acetate buffer (pH 4.38) in the absence of Ga3+ and In3+. Currents were recorded at the Ga3+ and In3+ oxidation potentials for 10 replications. The resultant bar graphs of the ten replications are shown in Figure S6, with relative standard deviation (RSD) percentages of 0.92% and 1.4% found at Ga3+ and In3+ oxidation potentials. A summary of the analytical data used for the limit of detection calculations for both simultaneous and individual analysis is given in Table S1. The determined detection limit was 0.276 µM, based on the results of ten replications of the electrode’s response in the blank solutions. This value indicates the lowest concentration of indium that can be reliably detected under the given experimental conditions. Improved current responses may be observed for In3+ over Ga3+ owing to the higher affinity of In3+ for Hg films, which offer improved current responses over Bi film electrodes. Moreover, the findings show the high sensitivity of both post-transition metal cations for the ERGO-Bi/Hg-film PGEs facilitated through enhanced electroplating of the bimetallic film at the ERGO-functionalized surfaces.

3.6. Simultaneous Analysis of In3+ and Ga3+ at ERGO-Bi/Hg-Film PGEs in Simulated Samples

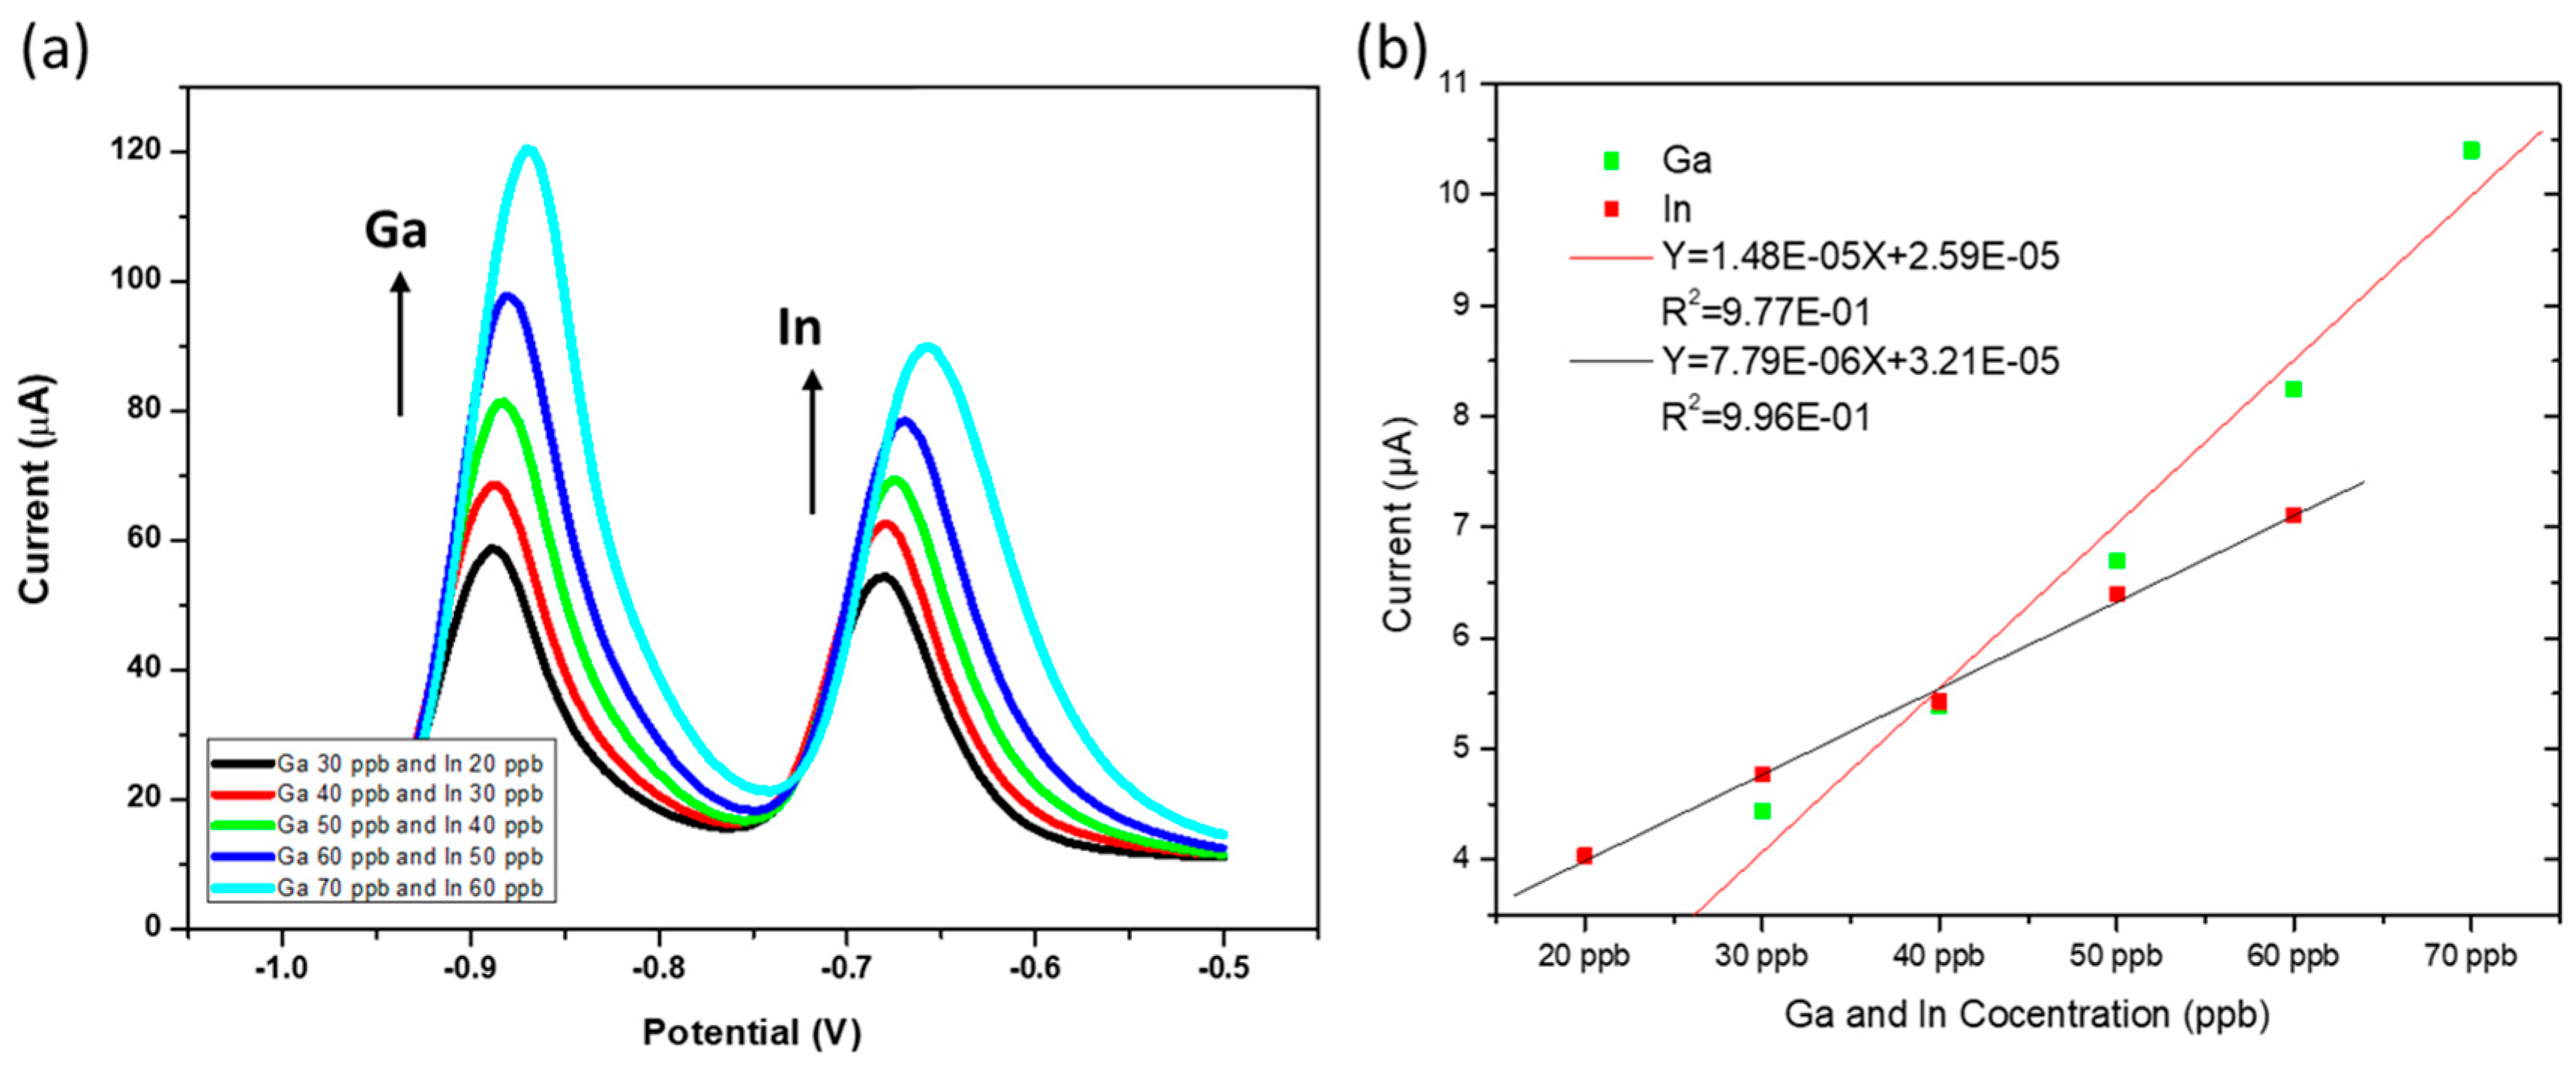
The simultaneous analysis of Ga3+ and In3+ ions was carried out across a concentration range of 20 to 70 ppb at the ERGO-PG-Bi/HgFE, aimed at assessing the analytical performance of the electrode. The resulting peak currents from the voltammogram (as illustrated in Figure 7a) were used to create the calibration plot presented in Figure 7b. Based on the calibration curve, the detection limits for these metal ions were computed using the following formula: three times the standard deviation (3σblank) of the blank solution divided by the slope of the calibration curve. The standard deviation of the blank was determined through ten replications in the blank solutions. The calculated detection limits for Ga3+ and In3+ were 0.00253 µmol L⁻1 and 0.00727 µmol L⁻1, respectively, with correlation coefficients of 0.977 and 0.996, respectively. These detection limits signify the lowest concentrations of Ga3+ and In3+ that can be accurately and reliably detected under the given experimental conditions, while the correlation coefficients reflect the quality of the calibration curves for these respective ions.
An overview of recent work regarding In and Ga3+ detection is summarized in Table 1 and Table 2, respectively. Hanging mercury electrodes remain the most common support material for Ga3+ and In3+ determination to date, owing to the high-affinity amalgam formation achieved with mercury drops. Metallic films, like Bi, Pb, and Sb, are commonly employed to reduce the amount of toxic mercury. Mercury silver amalgams are also being used quite commonly. Of these, comparable detection limits are achieved for all platforms studied, indicating that metallic film surfaces are able to detect both Ga3+ and In3+ sensitively. The Bi/Hg bimetallic film, which here is studied for the first time for post-transition metals, shows good performance compared to the more conventional films. A comparison of this study with other research on the electrochemical detection of gallium and indium reveals several key distinctions. All reported studies to date have relied on costly solid electrodes or toxic hanging mercury and mercury-film electrodes, which have contributed to the high sensitivity of these works. Unlike previous studies, the proposed work is the only to investigate cost-effective, disposable electrodes utilizing pencil graphite electrodes (PGEs) to improve accessibility in resource-limited settings. Additionally, this is the first study to use graphene to enhance the low electrode sensitivity associated with disposable electrode materials for the detection of target metals, a strategy that enabled the successful application of the inexpensive PGE. To the best of our knowledge, all previous studies have performed individual detection of In3+ or Ga3+ ions. The lower sensitivity achieved herein may be a consequence of the fact that this is the first reported work regarding the simultaneous detection of gallium and indium, with only one instance in 2004 attempting this under significantly higher metal concentrations. In that study, the detection limits achieved were approximately 107 times higher than those obtained here. The use of a low-cost, disposable PGE, enhanced with graphene for improved sensitivity, and the application of a bimetallic mercury–bismuth film to achieve selectivity for the simultaneous detection of gallium and indium, demonstrate the novelty of this study, particularly in achieving low detection limits.

3.7. Application to Tap Water Samples

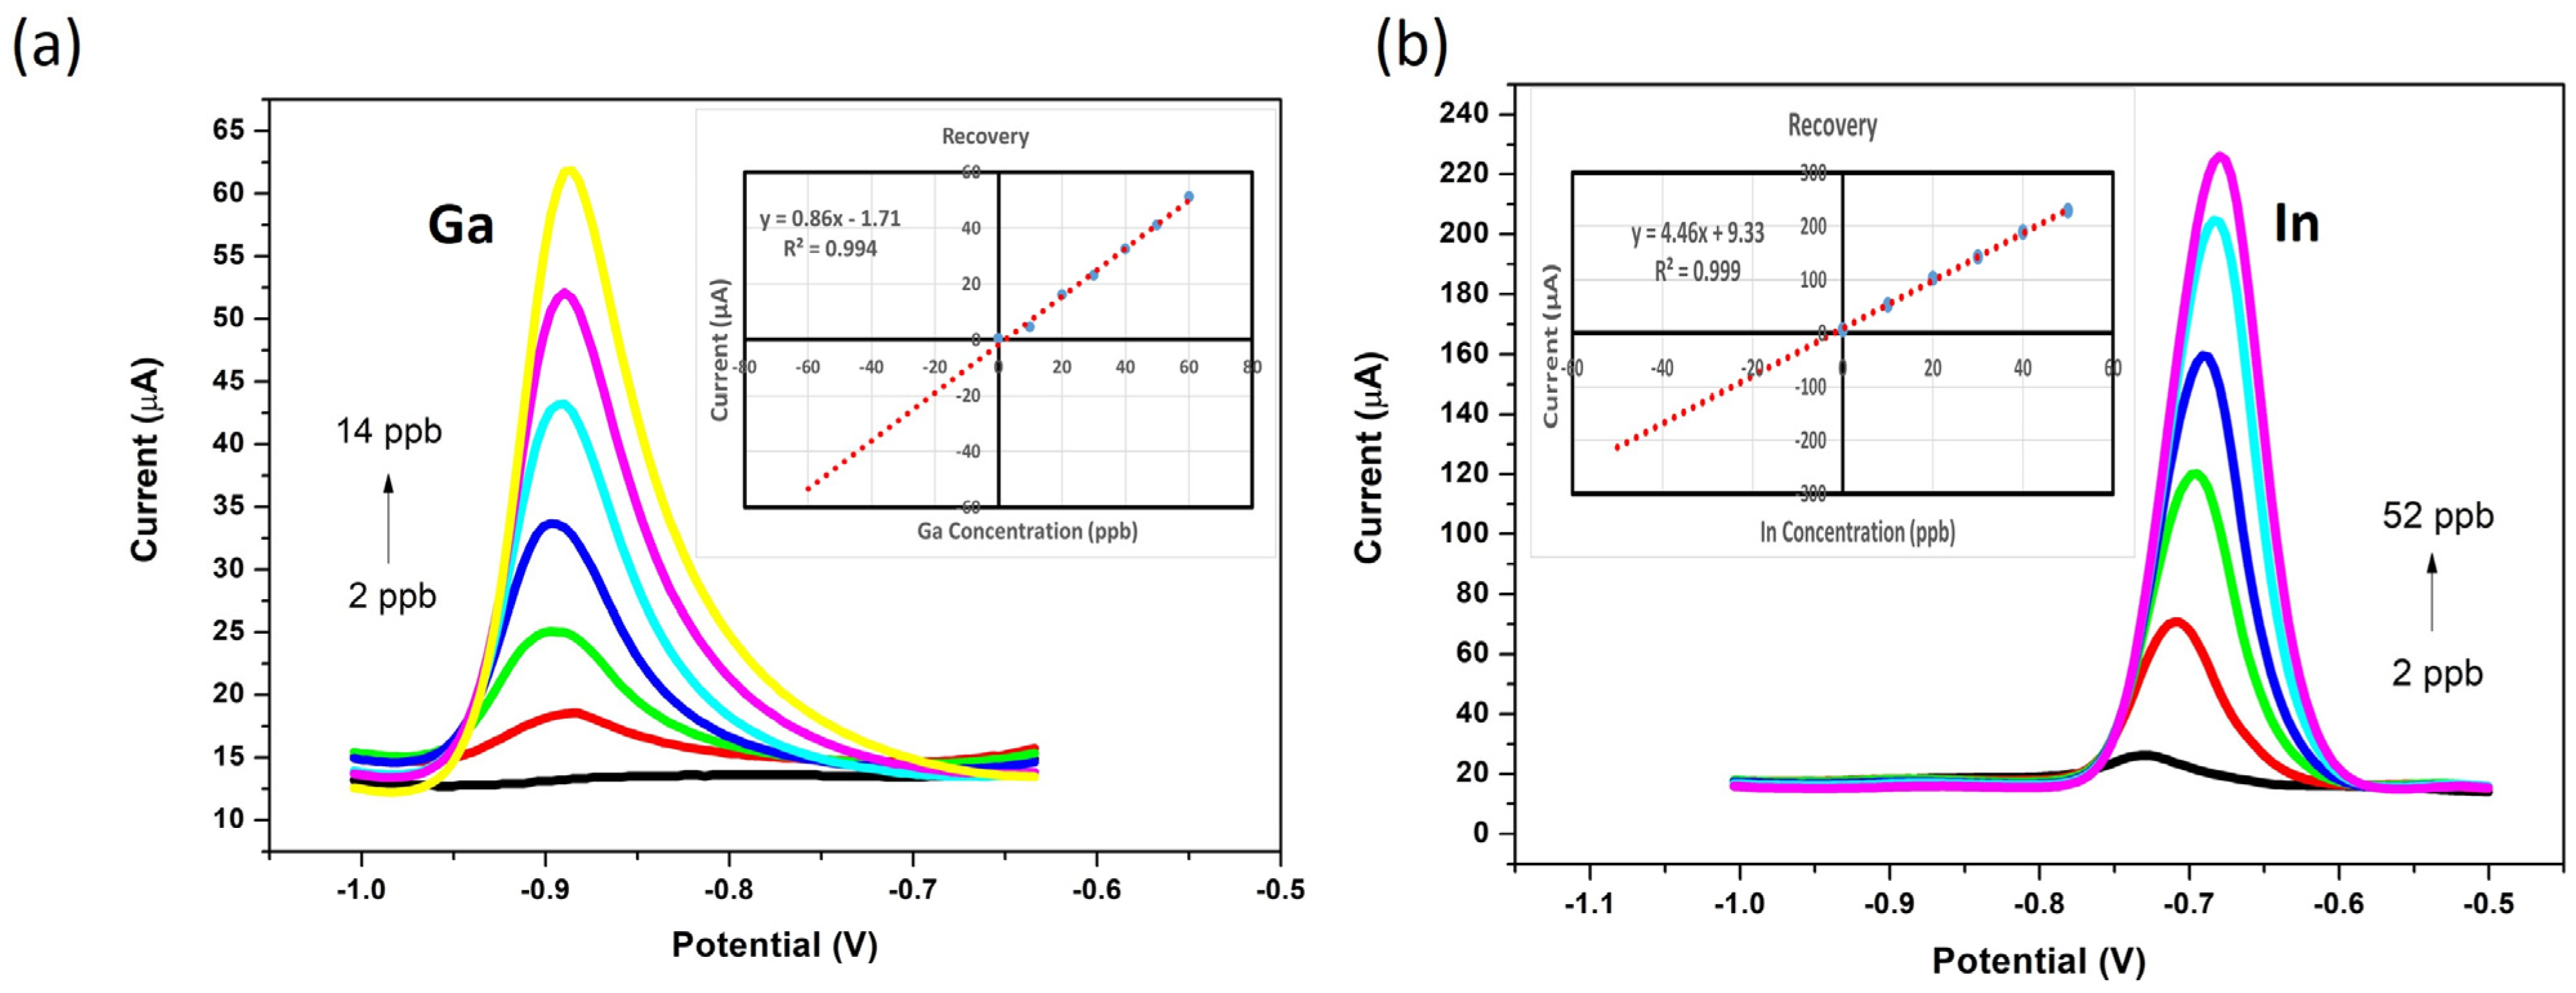
The potential and applicability of the ERGO-Bi/HgF–PGE sensors were assessed for the individual and simultaneous determination of Ga3+ and In3+ in real water samples. For this assessment, the ERGO-Bi/HgF–PGE was employed to quantify Ga3+ and In3+ concentrations in tap water samples, prepared as described in the experimental procedures. The analysis of Ga3+ and In3+ in these samples was carried out in triplicate, both individually and simultaneously, using the standard addition method, as depicted in Figure 8 and Figure 9. Recovery studies were performed in test solutions and measured the ability of the sensor to accurately detect known concentrations of Ga3+ and In3+. Test solutions containing 2 ppb of Ga3+ and In3+ were prepared separately. The concentrations were determined via standard addition, wherein samples were spiked with fixed quantities of the target metal cation, and the concentration was determined from the obtained calibration curve (inset). Recovery percentages, calculated as the ratio of detected to known concentrations (Equation (4)), ranged from 90.1% to 103.8% for Ga3+ and In3+, respectively, demonstrating the sensor’s accuracy and reliability in test samples. A recovery percentage above or below 100%, indicates minor deviations in sensor accuracy. Recovery percentages greater than 100% can result from several factors, including matrix effects, where other substances present in the water sample may interfere with the ion detection process, or slight variations in the sensor’s sensitivity/reproducibility. In such cases, the sensor may amplify the response, leading to an overestimation of ion concentration. Recovery values close to 100% are generally considered favorable, as they indicate reliable performance with minimal bias in real-world sample conditions. Moreover, the relative standard deviations (RSD) were determined to be in the range of 3–5% for the oxidation peak of Ga3+ when measured individually and 1.8–3.4% for In3+ under the same conditions. These findings are further summarized in Table 3.
R e c o v e r y   % = ( D e t e r m i n e d   C o n c e n t r a t i o n ) ( S p i k e d   C o n c e n t r a t i o n ) × 100 %
The simultaneous determination of Ga3+ and In3+ in tap water samples using the ERGO-Bi/HgF-PGE also yielded favorable results, with recovery percentages ranging from 95% to 106% for Ga3+ and In3+, respectively. The RSD for the quantification of Ga3+ and In3+ simultaneously in tap water samples remained less than 5%, indicating the precision and robustness of the electrode for concurrent analysis in a real-world sample matrix. The findings from Table 3 and Table 4 show that both individual and simultaneous detection of Ga3+ and In3+ is possible with good accuracy. Simultaneous detection of In3+ proved to be more difficult, and higher concentrations were required.

4. Conclusions

The electrochemically reduced graphene oxide pencil graphite electrode with an in situ plated bismuth–mercury film (ERGO-PG-Bi/HgFe) was for the first time introduced as an effective alternative for the simultaneous quantification of trace amounts of Ga (III) and In (III) in a single measurement using square wave anodic stripping voltammetry. The improved adsorption of Ga3+ and In3+ ions at the Bi/Hg films on the graphene-functionalized electrodes, due to cation-π interactions and fused alloy formation during the preconcentration step, significantly enhanced sensitivity, achieving detection limits of 2.53 nmol L−1 for Ga3+ and 7.27 nmol L−1 for In3+. The preferential accumulation of each post-transition metal, used in transparent displays, to form fused alloys at Bi and Hg films, respectively, is highlighted. This innovative electrode offers a more environmentally friendly and cost-effective approach for the simultaneous determination of gallium and indium, while delivering comparable performance to established techniques described in the literature. The development of these highly sensitive electrochemical sensors has enabled the achievement of well-resolved stripping voltammetric peaks, allowing for the simultaneous analysis of Ga3+ and In3+ in water samples through square wave anodic stripping voltammetry. Moreover, the synergistic effects of the bimetallic film were, for the first time, demonstrated for transition metal targets and demonstrate the improved electron transfer rates and active surface area of the disposable carbon nanostructured surface. The study is the first report to use a bimetallic Bi/Hg film for the detection of In3+ and Ga3+. Moreover, graphite rods were used for the first time as disposable electrodes for the detection of post-transition metals, compared to the costly solid and toxic hanging mercury drop electrodes used in past studies. This is the first report on the use of electrochemically reduced graphene oxide plates for In3+ and Ga3+ detection.

Supplementary Materials

The following supporting information can be downloaded at: https://www.mdpi.com/article/10.3390/c10040095/s1, Figure S1: Stripping peaks of Ga (−0.88 V), In (−0.67 V), Bi (−0.10 V), and Hg (0.21 V) recorded at the ERGO-PGE in 0.1 M Acetate Buffer Solution (pH 4.7) vs. Ag/AgCl saturated reference electrode; Figure S2: Cyclic electrochemical reduction and deposition of Electrochemically Reduced Graphene Oxide (ERGO) onto pencil graphite electrodes (PGE) recorded between −1.5 and 0.3 V (vs. Ag/AgCl sat); Figure S3: HRSEM images of bare PGE (A), and Electrochemically Reduced Graphene Oxide PGE (B) at 100.00 times magnification; Figure S4: (a) SW voltammograms of 0.1 mol. L−1 ABS at pH 4.38 containing 30 ppb Ga3+ and 20 ppb In3+ at ERGO-BiF-PGE and ERGO-HgF-PGE. (b) Comparative bar graphs of the ERGO-BiF-PGE, ERGO-HgF-PGE and ERGO-Bi/HgF-PGE; Figure S5: The change of percentages of the oxidation peak current of 20 ppb of Ga and 5 ppb of In in presence of Zn2+, Cd2+, Pb2+, Ni2+, Co2+, and Cu2+; Figure S6: Ten replications of the response of the ERGO-PGE in the blank solution at gallium and indium oxidation potentials; Table S1: Analytical data for detection limit calculations.

Author Contributions

N.G. was responsible for the conceptualization, data acquisition, formal analysis, investigation, validation, and drafting of the manuscript. Z.A. assisted in data acquisition, formal analysis, and validation. N.J. and K.P. conceived the study and assisted in the formal analysis, review, and editing of the article, as well as the necessary funding acquisition. N.J. and P.G.L.B. assisted in the final review, editing, and clarification of the main ideas in the manuscript, and funding acquisition. All authors have read and agreed to the published version of the manuscript.

Funding

This study was supported by the National Research Foundation (NRF) of South Africa (Ref: TTK2204062362) and the DSI/NRF-SARChI chair in Analytical Systems and Processes for Priority and Emerging Contaminants (ASPPEC).

Institutional Review Board Statement

The work was conducted in accordance with the University of the Western Cape’s ethical clearance guidelines.

Data Availability Statement

All research data can be found within this publication.

Conflicts of Interest

The authors declare that they have NO affiliations with or involvement in any organization or entity with any financial interest in the subject matter or materials discussed in this manuscript.

References

  1. Hassanien, M.M.; Kenawy, I.M.; Mostafa, M.R.; El-Dellay, H. Extraction of gallium, indium and thallium from aquatic media using amino silica gel modified by gallic acid. Microchim. Acta 2011, 172, 137–145. [Google Scholar] [CrossRef]
  2. Mortada, W.I.; Kenawy, I.M.; Hassanien, M.M. A cloud point extraction procedure for gallium, indium and thallium determination in liquid crystal display and sediment samples. Anal. Methods 2015, 7, 2114–2120. [Google Scholar] [CrossRef]
  3. White, S.J.O.; Hemond, H.F. The anthrobiogeochemical cycle of indium: A review of the natural and anthropogenic cycling of indium in the environment. Crit. Rev. Environ. Sci. Technol. 2012, 42, 155–186. [Google Scholar] [CrossRef]
  4. Xiang, C.; Zou, Y.; Xie, J.; Fei, X.; Li, J. Nafion-modified glassy carbon electrode for trace determination of indium. Anal. Lett. 2005, 38, 2045–2055. [Google Scholar] [CrossRef]
  5. Piech, R. Novel Sensitive Voltammetric Detection of Trace Gallium(III) with Presence of Catechol Using Mercury Film Silver Based Electrode. Electroanalysis 2009, 21, 1842–1847. [Google Scholar] [CrossRef]
  6. Moskalyk, R.R. Gallium: The backbone of the electronics industry. Miner. Eng. 2003, 16, 921–929. [Google Scholar] [CrossRef]
  7. Kamat, J.V.; Guin, S.K.; Pillai, J.S.; Aggarwal, S.K. Scope of detection and determination of gallium(III) in industrial ground water by square wave anodic stripping voltammetry on bismuth film electrode. Talanta 2011, 86, 256–265. [Google Scholar] [CrossRef]
  8. González, M.J.G.; Renedo, O.D.; Lomillo, M.A.A.; Martínez, M.J.A. Determination of gallium by adsorptive stripping voltammetry. Talanta 2004, 62, 457–462. [Google Scholar] [CrossRef]
  9. Chitambar, C.R. Medical applications and toxicities of gallium compounds. Int. J. Environ. Res. Public Health 2010, 7, 2337–2361. [Google Scholar] [CrossRef]
  10. Grabarczyk, M.; Wlazlowska, E. An Activated Bismuth Layer Formed In Situ on a Solid Bismuth Microelectrode for Electrochemical Sensitive Determination of Ga(III). Membranes 2022, 12, 1267. [Google Scholar] [CrossRef]
  11. Grabarczyk, M.; Wasąg, J. Determination of trace amounts of Ga(III) by adsorptive stripping voltammetry with in situ plated bismuth film electrode. Talanta 2015, 144, 1091–1095. [Google Scholar] [CrossRef] [PubMed]
  12. Grabarczyk, M.; Wasąg, J. Adsorptive Cathodic Stripping Voltammetric Method for Determination of Gallium Using an In Situ Plated Lead Film Electrode. Electroanalysis 2015, 27, 2596–2600. [Google Scholar] [CrossRef]
  13. Grabarczyk, M.; Adamczyk, M.; Wardak, C. Simultaneous AdSV determination of Ga and In on Hg(Ag)FE electrode by AdSV in presence of cupferron. Ionics 2020, 26, 1019–1027. [Google Scholar] [CrossRef]
  14. Chung, Y.; Lee, C.-W. Electrochemistry of Gallium. J. Electrochem. Sci. Technol. 2013, 4, 1–18. [Google Scholar] [CrossRef]
  15. Paolicchi, I.; Renedo, O.D.; Alonso Lomillo, M.A.; Arcos Martínez, M.J. Application of an optimization procedure in adsorptive stripping voltammetry for the determination of trace contaminant metals in aqueous medium. Anal. Chim. Acta 2004, 511, 223–229. [Google Scholar] [CrossRef]
  16. Gomdje, V.H.; Rosie, T.; Ngono, L.; Najih, R.; Chtaini, A. Electroanalytical Determination of Lead with Carbon Paste Modified Steel Electrode. Acta Tech. Corviniensis-Bull. Eng. 2013, 6, 139. [Google Scholar]
  17. Pokpas, K.; Zbeda, S.; Jahed, N.; Mohamed, N.; Baker, P.G.; Iwuoha, E.I. Electrochemically reduced graphene oxide pencil-graphite in situ plated bismuth-film electrode for the determination of trace metals by anodic stripping voltammetry. Int. J. Electrochem. Sci. 2014, 9, 736–759. [Google Scholar] [CrossRef]
  18. Wang, J.; Lu, J.; Kirgöz, Ü.A.; Hocevar, S.B.; Ogorevc, B. Insights into the anodic stripping voltammetric behavior of bismuth film electrodes. Anal. Chim. Acta 2001, 434, 29–34. [Google Scholar] [CrossRef]
  19. Franke, J.P.; de Zeeuw, R.A. Differential pulse anodic stripping voltammetry as a rapid screening technique for heavy metal intoxications. Arch. Toxicol. 1976, 37, 47–55. [Google Scholar] [CrossRef]
  20. Pokpas, K.; Jahed, N.; Tovide, O.; Baker, P.G.; Iwuoha, E.I. Nafion-graphene nanocomposite in situ plated bismuth-film electrodes on pencil graphite substrates for the determination of trace heavy metals by anodic stripping voltammetry. Int. J. Electrochem. Sci. 2014, 9, 5092–5115. [Google Scholar] [CrossRef]
  21. Ghaffari, N.; Pokpas, K.; Iwuoha, E.; Jahed, N. Sensitive Electrochemical Determination of Bisphenol a Using a Disposable, Electrodeposited Antimony-Graphene Nanocomposite Pencil Graphite Electrode (PGE) and Differential Pulse Voltammetry (DPV). Anal. Lett. 2023, 57, 1008–1025. [Google Scholar] [CrossRef]
  22. Li, F.; Li, J.; Feng, Y.; Yang, L.; Du, Z. Electrochemical behavior of graphene doped carbon paste electrode and its application for sensitive determination of ascorbic acid. Sens. Actuators B Chem. 2011, 157, 110–114. [Google Scholar] [CrossRef]
  23. Dervin, S.; Ganguly, P.; Dahiya, R.S. Disposable Electrochemical Sensor Using Graphene Oxide-Chitosan Modified Carbon-Based Electrodes for the Detection of Tyrosine. IEEE Sens. J. 2021, 21, 26226–26233. [Google Scholar] [CrossRef]
  24. Annu; Sharma, S.; Jain, R.; Raja, A.N. Review—Pencil Graphite Electrode: An Emerging Sensing Material. J. Electrochem. Soc. 2020, 167, 037501. [Google Scholar] [CrossRef]
  25. Özcan, A. Synergistic Effect of Lithium Perchlorate and Sodium Hydroxide in the Preparation of Electrochemically Treated Pencil Graphite Electrodes for Selective and Sensitive Bisphenol A Detection in Water Samples. Electroanalysis 2014, 26, 1631–1639. [Google Scholar] [CrossRef]
  26. Demetriades, D.; Economou, A.; Voulgaropoulos, A. A study of pencil-lead bismuth-film electrodes for the determination of trace metals by anodic stripping voltammetry. Anal. Chim. Acta 2004, 519, 167–172. [Google Scholar] [CrossRef]
  27. David, I.G.; Buleandra, M.; Popa, D.E.; Cheregi, M.C.; David, V.; Iorgulescu, E.E.; Tartareanu, G.O. Recent Developments in Voltammetric Analysis of Pharmaceuticals Using Disposable Pencil Graphite Electrodes. Processes 2022, 10, 472. [Google Scholar] [CrossRef]
  28. David, I.G.; Litescu, S.C.; Moraru, R.; Albu, C.; Buleandra, M.; Popa, D.E.; Riga, S.; Ciobanu, A.M.; Noor, H. Electroanalysis of Naringin at Electroactivated Pencil Graphite Electrode for the Assessment of Polyphenolics with Intermediate Antioxidant Power. Antioxidants 2022, 11, 2306. [Google Scholar] [CrossRef]
  29. Ishtiaq, S.; Sohail, M.; Rasul, S.; Zia, A.W.; Siller, L.; Chotana, G.A.; Sharif, M.; Nafady, A. Selenium Nanoneedles Deposited on a Pencil Graphite Electrode for Hydrazine Sensing. ACS Appl. Nano Mater. 2022, 5, 14336–14346. [Google Scholar] [CrossRef]
  30. Buleandră, M.; Popa, D.E.; Popa, A.; Codreanu, N.A.M.; David, I.G. Multi-Analyte Sensor Based on Pencil Graphite Electrode for Riboflavin and Pyridoxine Determination. J. Electrochem. Soc. 2022, 169, 017517. [Google Scholar] [CrossRef]
  31. Kumar Naik, T.S.S.; Kesavan, A.V.; Swamy, B.E.K.; Singh, S.; Anil, A.G.; Madhavi, V.; Ramamurthy, P.C. Low cost, trouble-free disposable pencil graphite electrode sensor for the simultaneous detection of hydroquinone and catechol. Mater. Chem. Phys. 2022, 278, 125663. [Google Scholar] [CrossRef]
  32. Zbeda, S.; Pokpas, K.; Titinchi, S.; Jahed, N.; Baker, P.G.; Iwuoha, E.I. Few-layer binder free graphene modified mercury film electrode for trace metal analysis by square wave anodic stripping voltammetry. Int. J. Electrochem. Sci. 2013, 8, 11125–11141. [Google Scholar] [CrossRef]
  33. Bunch, J.S.; Verbridge, S.S.; Alden, J.S.; Van Der Zande, A.M.; Parpia, J.M.; Craighead, H.G.; McEuen, P.L. Impermeable atomic membranes from graphene sheets. Nano Lett. 2008, 8, 2458–2462. [Google Scholar] [CrossRef] [PubMed]
  34. Noveslov, K.S.; Geim, A.K.K.; Morozov, S.V.V.; Jiang, D.; Zhang, Y.; Dubonos, S.V.V.; Grigorieva, I.V.V.; Firsov, A.A.A.; Novoselov, K.S.; Geim, A.K.K.; et al. Electric Field Effect in Atomically Thin Carbon Films. Science 2004, 306, 666–669. [Google Scholar] [CrossRef] [PubMed]
  35. Geim, A.K.; Novoselov, K.S. The rise of graphene. Nat. Mater. 2007, 6, 183–191. [Google Scholar] [CrossRef]
  36. Neto, A.C.; Guinea, F.; Peres, N.M. Drawing conclusions from graphene. Phys. World 2006, 19, 33–37. [Google Scholar] [CrossRef]
  37. Park, H.J.; Meyer, J.; Roth, S.; Skákalová, V. Growth and properties of few-layer graphene prepared by chemical vapor deposition. Carbon 2010, 48, 1088–1094. [Google Scholar] [CrossRef]
  38. Reina, A.; Thiele, S.; Jia, X.; Bhaviripudi, S.; Dresselhaus, M.S.; Schaefer, J.A.; Kong, J. Growth of large-area single- and Bi-layer graphene by controlled carbon precipitation on polycrystalline Ni surfaces. Nano Res. 2009, 2, 509–516. [Google Scholar] [CrossRef]
  39. Voutilainen, M.; Seppala, E.T.; Pasanen, P.; Oksanen, M. Graphene and carbon nanotube applications in mobile devices. IEEE Trans. Electron Devices 2012, 59, 2876–2887. [Google Scholar] [CrossRef]
  40. Patel, M.; Bisht, N.; Prabhakar, P.; Sen, R.K.; Kumar, P.; Dwivedi, N.; Ashiq, M.; Mondal, D.P.; Srivastava, A.K.; Dhand, C. Ternary nanocomposite-based smart sensor: Reduced graphene oxide/polydopamine/alanine nanocomposite for simultaneous electrochemical detection of Cd2+, Pb2+, Fe2+, and Cu2+ ions. Environ. Res. 2023, 221, 115317. [Google Scholar] [CrossRef]
  41. Rahman, H.A.; Rafi, M.; Putra, B.R.; Wahyuni, W.T. Electrochemical Sensors Based on a Composite of Electrochemically Reduced Graphene Oxide and PEDOT:PSS for Hydrazine Detection. ACS Omega 2023, 8, 3258–3269. [Google Scholar] [CrossRef] [PubMed]
  42. Pichún, B.; Núñez, C.; Arancibia, V.; Martí, A.A.; Aguirre, M.J.; Pizarro, J.; Segura, R.; Flores, E. Enhanced voltammetric sensing platform based on gold nanorods and electrochemically reduced graphene oxide for As(III) determination in seafood samples. J. Appl. Electrochem. 2024, 54, 1595–1606. [Google Scholar] [CrossRef]
  43. Economou, A.; Fielden, P.R. Mercury film electrodes: Developments, trends and potentialities for electroanalysis. Analyst 2003, 128, 205–213. [Google Scholar] [CrossRef] [PubMed]
  44. Sánchez-Calvo, A.; Blanco-López, M.C.; Costa-García, A. Paper-based working electrodes coated with mercury or bismuth films for heavy metals determination. Biosensors 2020, 10, 52. [Google Scholar] [CrossRef] [PubMed]
  45. Tefera, M.; Tessema, M.; Admassie, S.; Guadie, A. Electrochemical determination of endosulfan in vegetable samples using mercury film modified glassy carbon electrode. Sens. Bio-Sens. Res. 2021, 33, 100431. [Google Scholar] [CrossRef]
  46. Piech, R.; Bas, B. Sensitive voltammetric determination of gallium in aluminium materials using renewable mercury film silver based electrode. Int. J. Environ. Anal. Chem. 2011, 91, 410–420. [Google Scholar] [CrossRef]
  47. Kudr, J.; Nguyen, H.V.; Gumulec, J.; Nejdl, L.; Blazkova, I.; Ruttkay-Nedecky, B.; Hynek, D.; Kynicky, J.; Adam, V.; Kizek, R. Simultaneous automatic electrochemical detection of zinc, cadmium, copper and lead ions in environmental samples using a thin-film mercury electrode and an artificial neural network. Sensors 2015, 15, 592–610. [Google Scholar] [CrossRef]
  48. Yıldız, C.; Eskiköy Bayraktepe, D.; Yazan, Z. Highly sensitive direct simultaneous determination of zinc(II), cadmium(II), lead(II), and copper(II) based on in-situ-bismuth and mercury thin-film plated screen-printed carbon electrode. Monatshefte Fuer Chem./Chem. Mon. 2021, 152, 1527–1537. [Google Scholar] [CrossRef]
  49. Sanga, N.A.; Jahed, N.; Leve, Z.; Iwuoha, E.I.; Pokpas, K. Simultaneous Adsorptive Stripping Voltammetric Analysis of Heavy Metals at Graphenated Cupferron Pencil Rods. J. Electrochem. Soc. 2022, 169, 017502. [Google Scholar] [CrossRef]
  50. Pokpas, K.; Jahed, N.; Iwuoha, E. Tuneable, Pre-stored Paper-Based Electrochemical Cells (μPECs): An Adsorptive Stripping Voltammetric Approach to Metal Analysis. Electrocatalysis 2019, 10, 352–364. [Google Scholar] [CrossRef]
  51. Pokpas, K.; Jahed, N.; Bezuidenhout, P.; Smith, S.; Land, K.; Iwuoha, E. Nickel contamination analysis at cost-effective silver printed paper-based electrodes based on carbon black dimethyl-glyoxime ink as electrode modifier. J. Electrochem. Sci. Eng. 2022, 12, 153–164. [Google Scholar] [CrossRef]
  52. Finšgar, M.; Kovačec, L. Copper-bismuth-film in situ electrodes for heavy metal detection. Microchem. J. 2020, 154, 104635. [Google Scholar] [CrossRef]
  53. Albalawi, I.; Hogan, A.; Alatawi, H.; Moore, E. A sensitive electrochemical analysis for cadmium and lead based on Nafion-Bismuth film in a water sample. Sens. Bio-Sens. Res. 2021, 34, 100454. [Google Scholar] [CrossRef]
  54. Li, H.; Zhao, J.; Zhao, S.; Cui, G. Simultaneous determination of trace Pb(II), Cd(II), and Zn(II) using an integrated three-electrode modified with bismuth film. Microchem. J. 2021, 168, 106390. [Google Scholar] [CrossRef]
  55. Ai, Y.; Yan, L.; Zhang, S.; Ye, X.; Xuan, Y.; He, S.; Wang, X.; Sun, W. Ultra-sensitive simultaneous electrochemical detection of Zn(II), Cd(II) and Pb(II) based on the bismuth and graphdiyne film modified electrode. Microchem. J. 2023, 184, 108186. [Google Scholar] [CrossRef]
  56. Rojas-Romo, C.; Aliaga, M.E.; Arancibia, V.; Gomez, M. Determination of Pb(II) and Cd(II) via anodic stripping voltammetry using an in-situ bismuth film electrode. Increasing the sensitivity of the method by the presence of Alizarin Red S. Microchem. J. 2020, 159, 105373. [Google Scholar] [CrossRef]
  57. Yaman, B.; Zaman, B.T.; Bakırdere, S.; Dilgin, Y. Sensitive, Accurate and Selective Determination of Cd(II) Using Anodic Stripping Voltammetry with in-situ Hg-Bi Film Modified Pencil Graphite Electrode After Magnetic Dispersive Solid Phase Microextraction. Electroanalysis 2021, 33, 2161–2168. [Google Scholar] [CrossRef]
  58. Ouyang, R.; Zhu, Z.; Tatum, C.E.; Chambers, J.Q.; Xue, Z.L. Simultaneous stripping detection of Zn(II), Cd(II) and Pb(II) using a bimetallic Hg–Bi/single-walled carbon nanotubes composite electrode. J. Electroanal. Chem. 2011, 656, 78–84. [Google Scholar] [CrossRef]
  59. Sharifian, P.; Aliakbar, A. Determination of Se(IV) by adsorptive cathodic stripping voltammetry at a Bi/Hg film electrode. Anal. Methods 2015, 7, 2121–2128. [Google Scholar] [CrossRef]
  60. William, S.; Hummers, J.; Offeman, R.E. Preparation of Graphitic Oxide. J. Am. Chem. Soc. 1958, 80, 1339. [Google Scholar] [CrossRef]
  61. Silva, R.M.; Sperandio, G.H.; da Silva, A.D.; Okumura, L.L.; da Silva, R.C.; Moreira, R.P.L.; Silva, T.A. Electrochemically reduced graphene oxide films from Zn-C battery waste for the electrochemical determination of paracetamol and hydroquinone. Microchim. Acta 2023, 190, 273. [Google Scholar] [CrossRef] [PubMed]
  62. Leve, Z.D.; Jahed, N.; Sanga, N.A.; Iwuoha, E.I.; Pokpas, K. Determination of paracetamol at the electrochemically reduced graphene oxide-antimony nanocomposite modified pencil graphite electrode using adsorptive stripping differential pulse voltammetry. Sensors 2022, 22, 5784. [Google Scholar] [CrossRef] [PubMed]
  63. Chen, H.; Guo, B.; Gong, D.; Fan, J.; Li, Z.; Wang, C.; Wang, L.; Yu, C.; Wang, C.; Zeng, G. A cation–π interaction confined graphene oxide membrane for separation of light paraffins and olefins. Chem. Commun. 2023, 59, 5257–5260. [Google Scholar] [CrossRef] [PubMed]
  64. Zhao, G.; Zhu, H. Cation–π Interactions in Graphene-Containing Systems for Water Treatment and Beyond. Adv. Mater. 2020, 32, 1905756. [Google Scholar] [CrossRef]
  65. Medvecký, L.; Briančin, J. Possibilities of simultaneous determination of indium and gallium in binary InGa alloys by anodic stripping voltammetry in acetate buffer. Chem. Pap. 2004, 58, 93–100. [Google Scholar]
  66. Qu, L.; Jin, W. Adsorption voltammetry of the gallium morin system. Anal. Chim. Acta 1993, 274, 65–70. [Google Scholar] [CrossRef]
  67. Udisti, R.; Piccardi, G. Determination of gallium traces by differential pulse anodic stripping voltammetry. Anal. Bioanal. Chem. 1988, 331, 35–38. [Google Scholar] [CrossRef]
  68. Li, Y.H.; Zhao, Q.L.; Huang, M.H. Cathodic Adsorptive Voltammetry of the Gallium-Alizarin Red S Complex at a Carbon Paste Electrode. Electroanalysis 2005, 17, 343–347. [Google Scholar] [CrossRef]
  69. East, G.; Cofre, P. Determination of gallium by square-wave voltammetry anodic stripping, based on the electrocatalytic action of 2,2′-bipyridine in dimethylsulphoxide: Comparison with an aqueous NaSCN/NaClO4 electrolyte. Talanta 1993, 40, 1273–1281. [Google Scholar] [CrossRef]
  70. Farias, P.A.M.; Martin, C.M.L.; Ohara, A.K.; Gold, J.S. Cathodic adsorptive stripping voltammetry of indium complexed with morin at a static mercury drop electrode. Anal. Chim. Acta 1994, 293, 29–34. [Google Scholar] [CrossRef]
  71. Benvidi, A.; Ardakani, M.M. Subnanomolar Determination of Indium by Adsorptive Stripping Differential Pulse Voltammetry Using Factorial Design for Optimization. Anal. Lett. 2009, 42, 2430–2443. [Google Scholar] [CrossRef]
  72. Nosal-Wiercińska, A.; Dalmata, G. Application of the catalytic properties of N-methylthiourea to the determination of In(III) at low levels by square wave voltammetry. Monatshefte Fuer Chem./Chem. Mon. 2009, 140, 1421–1424. [Google Scholar] [CrossRef]
  73. Bobrowski, A.; Putek, M.; Zarebski, J. Antimony Film Electrode Prepared In Situ in Hydrogen Potassium Tartrate in Anodic Stripping Voltammetric Trace Detection of Cd(II), Pb(II), Zn(II), Tl(I), In(III) and Cu(II). Electroanalysis 2012, 24, 1071–1078. [Google Scholar] [CrossRef]
  74. Florence, T.M.; Batley, G.E.; Farrar, Y.J. The determination of indium by anodic stripping voltammetry: Application to natural waters. J. Electroanal. Chem. Interfacial Electrochem. 1974, 56, 301–309. [Google Scholar] [CrossRef]
  75. Taher, M.A. Differential pulse polarography determination of indium after column preconcentration with [1-(2-pyridylazo)-2-naphthol]-naphthalene adsorbent or its complex on microcrystalline naphthalene. Talanta 2000, 52, 301–309. [Google Scholar] [CrossRef]
  76. Zhang, J.; Shan, Y.; Ma, J.; Xie, L.; Du, X. Simultaneous determination of indium and thallium ions by anodic stripping voltammetry using antimony film electrode. Sens. Lett. 2009, 7, 605–608. [Google Scholar] [CrossRef]
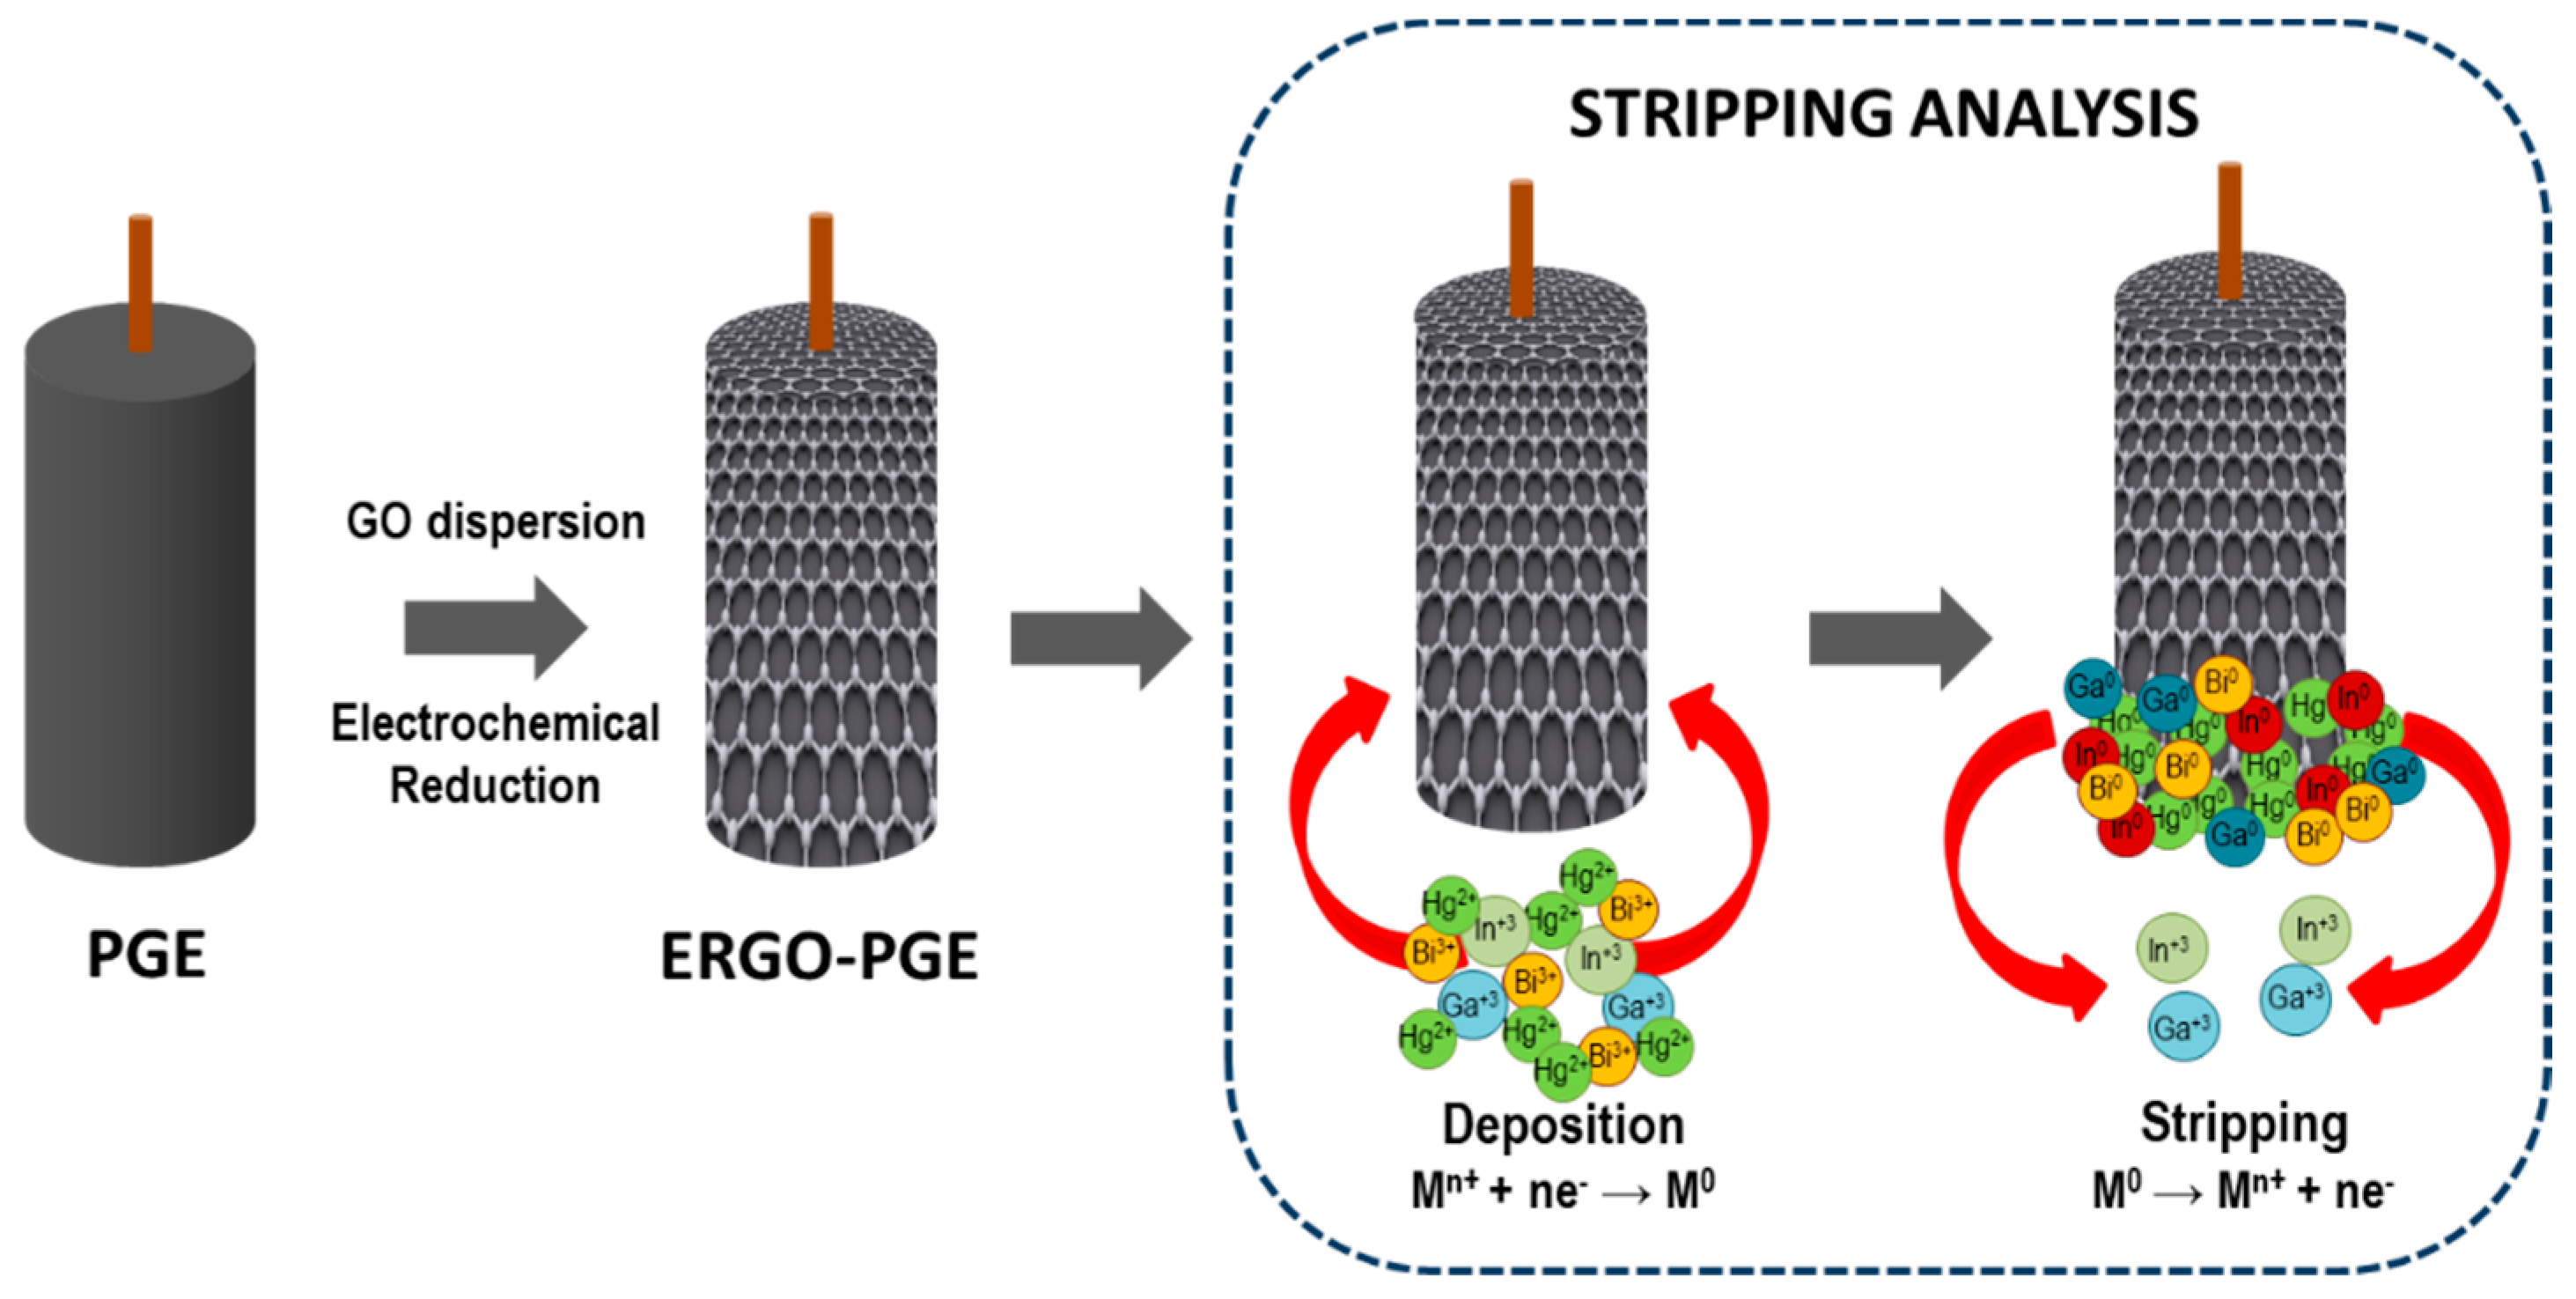
Scheme 1. Schematic illustration of the preferential stripping analysis of post-transition metals (In and Ga) at Bi/Hg films electroplated on graphene-functionalized graphite rods. Typically, electrochemically reduced graphene oxide (ERGO) nanoplatelets were electrochemically deposited on graphitic rods through successive fixed potential (−1.4 V, vs. Ag/AgCl sat) and cyclic reduction (five cycles) before the electroplating of bimetallic Bi/Hg-films. The ERGO-Bi/Hg-film-functionalized PGEs were then applied to the stripping analysis of In3+ and Ga3+ in wastewater samples.
Carbon 10 00095 sch001
Figure 1. (a) Comparative CV voltammograms of bare PGE (black) and ERGO-PGE (red) recorded in 5 mM [Fe(CN) 6]3−/4− with 0.1 M KCl as supporting electrolyte. Inset: HRTEM images of ERGO-nanoplatelets deposited on PGE surfaces. (b) Scan rate dependence (10 to 100 mV s−1) of ERGO-PGE recorded in the presence of redox probe and inset of the recorded currents vs. square root of scan rate. (c) SWASV voltammograms of 20 ppb Ga3+ and 20 ppb In3+ in 0.1 M acetate buffer solution (pH: 4.38) at ERGO-Bi/HgF-PGE with different numbers of GO deposition cycles from 1 to 9 cycles. (d) Corresponding plot of the effect of ERGO reduction cycles on peak currents of Ga3+ and In3+ at the ERGO-Bi/HgF-PGE in 0.1 M acetate buffer solution (pH 4.38).
Carbon 10 00095 g001
Figure 2. (a) The comparison of SWASV measurements of 0.1 mol L−1 ABS at pH 4.38 containing 30 ppb Ga3+ and 20 ppb In3+ at bare PGE, ERGO-PGE and ERGO-Bi/HgF-PGE. (b) Schematic illustration of anodic stripping voltammetry detection of In3+ and Ga3+.
Carbon 10 00095 g002
Figure 3. Effect of (a) electrochemically cleaning time (60–300 s), (b) pH (4.1–4.6), and (c) deposition potential (−1 to −1.7 V (vs. Ag/AgCl sat)) on the oxidation peak currents of Ga3+ and In3+ at the ERGO-Bi/HgF-PGE in a 0.1 M ABS (pH 4.38) containing 10 ppb Ga3+ and 2 ppb In3+.
Carbon 10 00095 g003
Figure 4. The effect of (a) Ga3+ concentration, and (b) In3+ concentration on Hg and Bi film formation.
Carbon 10 00095 g004
Figure 5. Voltammograms and corresponding scatter plots of Ga3+ and In3+ at the ERGO-Bi/HgF-PGE in 0.1 M acetate buffer (pH 4.38) with (a,b) 80 ppb In3+ concentration and Ga3+ concentration varied between 0 ppb to 60 ppb, and (c,d) 70 ppb Ga3+ concentration and In3+ concentration varied between 0 ppb and 70 ppb.
Carbon 10 00095 g005
Figure 6. SWAS voltammograms of the individual analysis of (a) Ga3+ between 30 and 70 ppb and (b) In3+ between 30 and 80 ppb recorded at ERGO-Bi/HgF-PGE, under optimized parameters. The corresponding calibration curves are shown as insets.
Carbon 10 00095 g006
Figure 7. (a) SWAS voltammograms, and (b) corresponding calibration curves for ERGO-Bi/Hg-Film-PGE, with the optimized parameters (a). The Ga3+ concentrations range from 30 µmol L−1 to 80 ppb and the In3+ concentrations range from 20 to 70 ppb.
Carbon 10 00095 g007
Figure 8. Analysis of 2 ppb of (a) Ga3+ and (b) In3+ in tap water (pH 4.38). The recorded voltammograms and standard addition plots are provided.
Carbon 10 00095 g008
Figure 9. Voltammograms and standard addition plots observed for the simultaneous detection of 2 ppb of In3+ and 10 ppb Ga3+ in tap water.
Carbon 10 00095 g009
Table 1. Comparison of the proposed method with some of the previous electrochemical stripping techniques used for the determination of gallium.
Target AnalyteElectrodeLinear Range (mol. L−1)Detection Limit (mol. L−1)Reference
GaHg(Ag)FE2 × 10−9–1 × 10−71.0 × 10−10[5]
GaBiFe3 × 10−10–3 × 10−71 × 10−10[7]
GaHDME1.4 × 10−8–2.7 × 10−75 × 10−8 [8]
GaBiSME 2 × 10⁻⁸ – 2 × 10⁻⁶ 7 × 10⁻⁹[10]
GaPbFE1 × 10−8–2 × 10−73.8 × 10−9[11]
GaHg(Ag)FE1.25 × 10−9–9 × 10−81.6 × 10−9[13]
GaAg-HgFE5 × 10−9–8×10−81.4 × 10−9[46]
GaHMDE1×10−9–1 × 10−74 × 10−10[66]
GaHDME1 × 10−8–1.7 × 10−65.7 × 10−11[67]
GaCPE2.9 × 10−10–8.6 × 10−81.4 × 10−10[68]
GaHMDE1 × 10−4–1 × 10−52 × 10−8[69]
GaERGO-Bi/HgF–PGE0.43 × 10−6–1.14 × 10−62.53 × 10−9This study
Table 2. Comparison of the proposed method with some of the previous electrochemical stripping techniques used to determine indium.
Target AnalyteElectrodeLinear Range (mol. L−1)Detection Limit (mol. L−1)Reference
InNafion-GCE1.0 × 10−10–1.0 × 10−97.5 × 10−10 [4]
InHg(Ag)FE1.25 × 10−9–9 × 10⁻⁸ 1.4 × 10⁻⁹ [13]
InStatic Hg drop34–340 × 10−94.3 × 10−11 [70]
InHMDE3.4–87 × 10−101.1 × 10⁻¹² [71]
InHDME3.9 × 10−7–5 × 10⁻⁴ 1 × 10⁻⁷ [72]
InSbFe8.4–84 × 10−101.2 × 10⁻¹¹[73]
InTMFE-1 × 10⁻¹⁴ [74]
InHMDE0 –3.2 × 10−71.7 × 10−9[75]
InMetal thin-film4.3–21.7 ×10−60.012[65]
InSbFe1.7–17 × 10−76.9 × 10−11[76]
InERGO-Bi/HgF–PGE0.17 × 10−6–0.60 × 10−67.27 × 10−9This study
Table 3. Recovery for the individual determination of gallium and indium in tap water samples using ERGO-Bi/HgF-PGE.
Target AnalyteRepetitive Cycles Original (ppb)Added (ppb)Found (ppb)RSD (%)Recovery (%)
GalliumFirstND *22.072.43103.5
SecondND *21.951.7997.5
ThirdND *22.13.45105
IndiumFirstND *21.93.6295
SecondND *22.051.74102.5
ThirdND *21.951.7997.5
* ND = Not detected.
Table 4. Recovery for the simultaneous determination of gallium and indium in tap water samples using ERGO-Bi/HgF-PGE.
Target AnalyteRepetitive CyclesOriginal (ppb)Added (ppb)Found (ppb)RSD (%)Recovery (%)
IndiumFirstND *22.082.77104
SecondND *22.113.78105.5
ThirdND *21.93.6295
GalliumFirstND *1010.53.45105
SecondND *109.62.8896
ThirdND *102.11.40102
* ND = Not Detected.
Disclaimer/Publisher’s Note: The statements, opinions and data contained in all publications are solely those of the individual author(s) and contributor(s) and not of MDPI and/or the editor(s). MDPI and/or the editor(s) disclaim responsibility for any injury to people or property resulting from any ideas, methods, instructions or products referred to in the content.