Article

A Universal Strategy for the Efficient Expression of Nanobodies in Pichia pastoris

1
Institute of Veterinary Immunology & Engineering, Jiangsu Academy of Agricultural Sciences, Nanjing 210014, China
2
College of Food and Bioengineering, Henan University of Science and Technology, Luoyang 471000, China
3
College of Bioscience and Bioengineering, Jiangxi Agricultural University, Nanchang 330045, China
4
Key Laboratory for Waste Plastics Biocatalytic Degradation and Recycling, College of Biotechnology and Pharmaceutical Engineering, Nanjing Tech University, Nanjing 211800, China
*
Author to whom correspondence should be addressed.
Fermentation 2024, 10(1), 37; https://doi.org/10.3390/fermentation10010037
Submission received: 15 December 2023 / Revised: 28 December 2023 / Accepted: 29 December 2023 / Published: 2 January 2024
(This article belongs to the Special Issue Research on Microbial Protein Synthesis)

Abstract

:
In recent years, nanobodies have played an increasingly crucial role in virus neutralization, ELISA detection, and medical imaging. This study aimed to explore a universal expression strategy in Pichia pastoris using three nanobodies, denoted Va, Vb, and Vc, as model proteins. Initially, plasmids pLD-AOXα and pLD-AOX were engineered to minimize the risk of antibiotic resistance gene drift. Optimization of promoters and signal peptides resulted in a 1.38-fold and 1.89-fold increase in Va production. Further optimization of gene dosage led to an additional 1.39-fold enhancement in Va yield. Subsequently, 25 molecular chaperones were co-expressed with Va under the control of the wild-type AOX1 promoter, with HAC1 further increasing Va yield by 1.5-fold. By fine-tuning the promoter strength for HAC1, Va production was increased by 2.41-fold under the control of the 55p promoter. Finally, through high-density fermentation, the Va yield reached 2.13 g/L, representing a 49.8-fold increase compared to the initial strain 1-AOXα-Va in shake-flask culture. Integration of pLD-55p-HAC1 into the GS115 genome resulted in the H55 host, and the transformation of multicopy plasmids into this host led to a 1.98-fold increase in Vb yield and a 2.34-fold increase in Vc yield, respectively. The engineering of antibiotic-free parental plasmids, modification of expression components, gene dosage optimization, and the H55 host are regarded as a composite strategy which will pave the way for efficient expression of nanobodies in the future.

1. Introduction

Antibodies with naturally occurring light chain deficiency were incidentally discovered in the sera of animals belonging to the camelid and shark families. In these antibodies, the variable region of the heavy chain serves as the minimal unit known to effectively bind complete antigenic fragments, thus termed nanobodies or VHHs [1]. In recent years, nanobodies have made significant advancements in disease treatment, imaging diagnostics, virus neutralization, and ELISA detection. For instance, the bispecific nanobody V56B2 was used to treat inflammatory bowel diseases (IBDs), exhibiting higher safety and efficacy in a larger proportion of patients compared to traditional monoclonal antibody therapies [2]. The nanobody Ty1 specifically targets the receptor binding domain (RBD) of the SARS-CoV-2 spike, directly impeding the interaction between the spike glycoprotein and the angiotensin-converting enzyme 2 (ACE2) receptor [3]. The radiolabeled nanobody [18F]RL-I-2Rs15d was employed in positron emission tomography (PET) imaging, rendering intracranial metastases of breast cancer visible [4]. Also, a nanobody–horseradish peroxidase fusion protein (NB5-HRP) has been designed for detecting anti-Newcastle disease virus (NDV) antibodies in chicken sera [5]. These successful cases highlight the crucial application value of developing a universal strategy for efficient expression of nanobodies.
In the biopharmaceutical industry, stringent control of antibiotic resistance gene drift is a major concern. The evolution of antibiotic resistance has diverse causes, including antibiotic misuse, organic fertilization [6], and other factors such as biofilm [7], efflux [8], and protists [9]. Evidently, eliminating antibiotic resistance genes in recombinant host cells aids in reducing the spread of these genes, thereby promoting drug approval and streamlining downstream waste treatment processes. Pichia pastoris, with its absence of endotoxin risks and strong secretion capabilities, is considered an ideal host for nanobody production. The engineering modification of expression components generally facilitates the production of the target protein. Qin et al. discovered a series of GAP promoter mutants with activities ranging from approximately 0.6% to 19.6 times that of the wild-type promoter [10], while Hartner reported a mutant library of the AOX1 promoter, demonstrating activities spanning from 6% to 160% of the wild-type promoter activity [11]. These fine-tuned promoters offer convenient tools for the expression of diverse proteins. Signal peptide optimization also enhances the secretion of target proteins. For instance, compared to the commonly used α-factor signal peptide, the MF4I signal peptide resulted in a seven-fold increase in phytase production [12]. The α-factor Δ57–70 signal peptide led to a 1.59-fold increase in HRP production [13]. Moreover, fusing the α-factor Δ57–70 with the HL28 short peptide further increased trypsin production by 1.3-fold [14]. Additionally, the nSB signal peptide resulted in a 3-fold increase in CalB production [15], whereas the Dse4 signal peptide led to a 1.5-fold increase in EGFP production [16]. Lastly, the Msb2 and Gas1 signal peptides increased Gal production by 8.0 and 16.8-fold, respectively [17].
Optimizing gene dosage and co-expressing molecular chaperones offers an alternative strategy to improve protein secretion. When the target protein is intracellular, the gene dosage typically shows a linear correlation with protein yield [18]. In contrast, for secreted proteins, the relationship between gene dosage and protein yield follows a bell-shaped curve, with the optimal copy number at the vertex [19]. It is speculated that overexpression of precursor proteins may deplete cellular resources for helper factors and induce stress in the endoplasmic reticulum (ER) [20]. Co-expression of molecular chaperones can alleviate cellular stress and restore homeostasis. For instance, HAC1, a crucial transcription regulator, upregulates the synthesis of ER-resident proteins essential for protein folding and components of the secretory pathway [21,22]. PDI functions independently to isomerize disulfide bonds and facilitate protein folding [23], while BiP, acting as a “molecular ratchet”, consumes ATP while translocating polypeptide chains into the ER lumen [24]. Nevertheless, these strategies often require trial and error due to the unpredictable nature of the bottleneck in protein secretion.
This study addressed the lack of systematic investigation into nanobody expression optimization by creating antibiotic-free parental plasmids and conducting a thorough exploration of the effects of promoters, signal peptides, gene dosage, and molecular chaperones on model nanobody expression. Subsequently, these findings led to the development of a packaging strategy aimed at significantly enhancing nanobody production within a short timeframe. Importantly, this strategy will yield valuable insights for future research on recombinant nanobody expression.

2. Materials and Methods

2.1. Strains, Plasmids, and Culture Medium

P. pastoris strain GS115 and E. coli strain DH5α were purchased from Invitrogen (Carlsbad, CA, USA). Plasmids pMCO-AOXα and pMCO-AOX were stocked in this lab. E. coli strains were cultured in Luria-Bertani (LB) medium (1% (w/v) NaCl, 1% (w/v) tryptone, and 0.5% (w/v) yeast extract, pH 7.0). P. pastoris culture was carried out using yeast extract peptone dextrose (YPD) medium (2% (w/v) peptone, 2% (w/v) dextrose, 1% (w/v) yeast extract), while YPDZ plates (YPD plus 100 μg/mL Zeocin) were employed for the selection of positive P. pastoris transformants. The P. pastoris transformants were grown in buffered glycerol-complex medium (BMGY) (2% (w/v) peptone, 1.34% (w/v) yeast nitrogen base, 1% (w/v) yeast extract, 1% (w/v) glycerol) and were subsequently transferred to buffered methanol-complex medium (BMMY) (2% (w/v) peptone, 1.34% (w/v) yeast nitrogen base, 1% (w/v) yeast extract, 1% (w/v) methanol) to induce the expression of the target protein. All reagents used were purchased from Sangon Biotech (Shanghai, China).

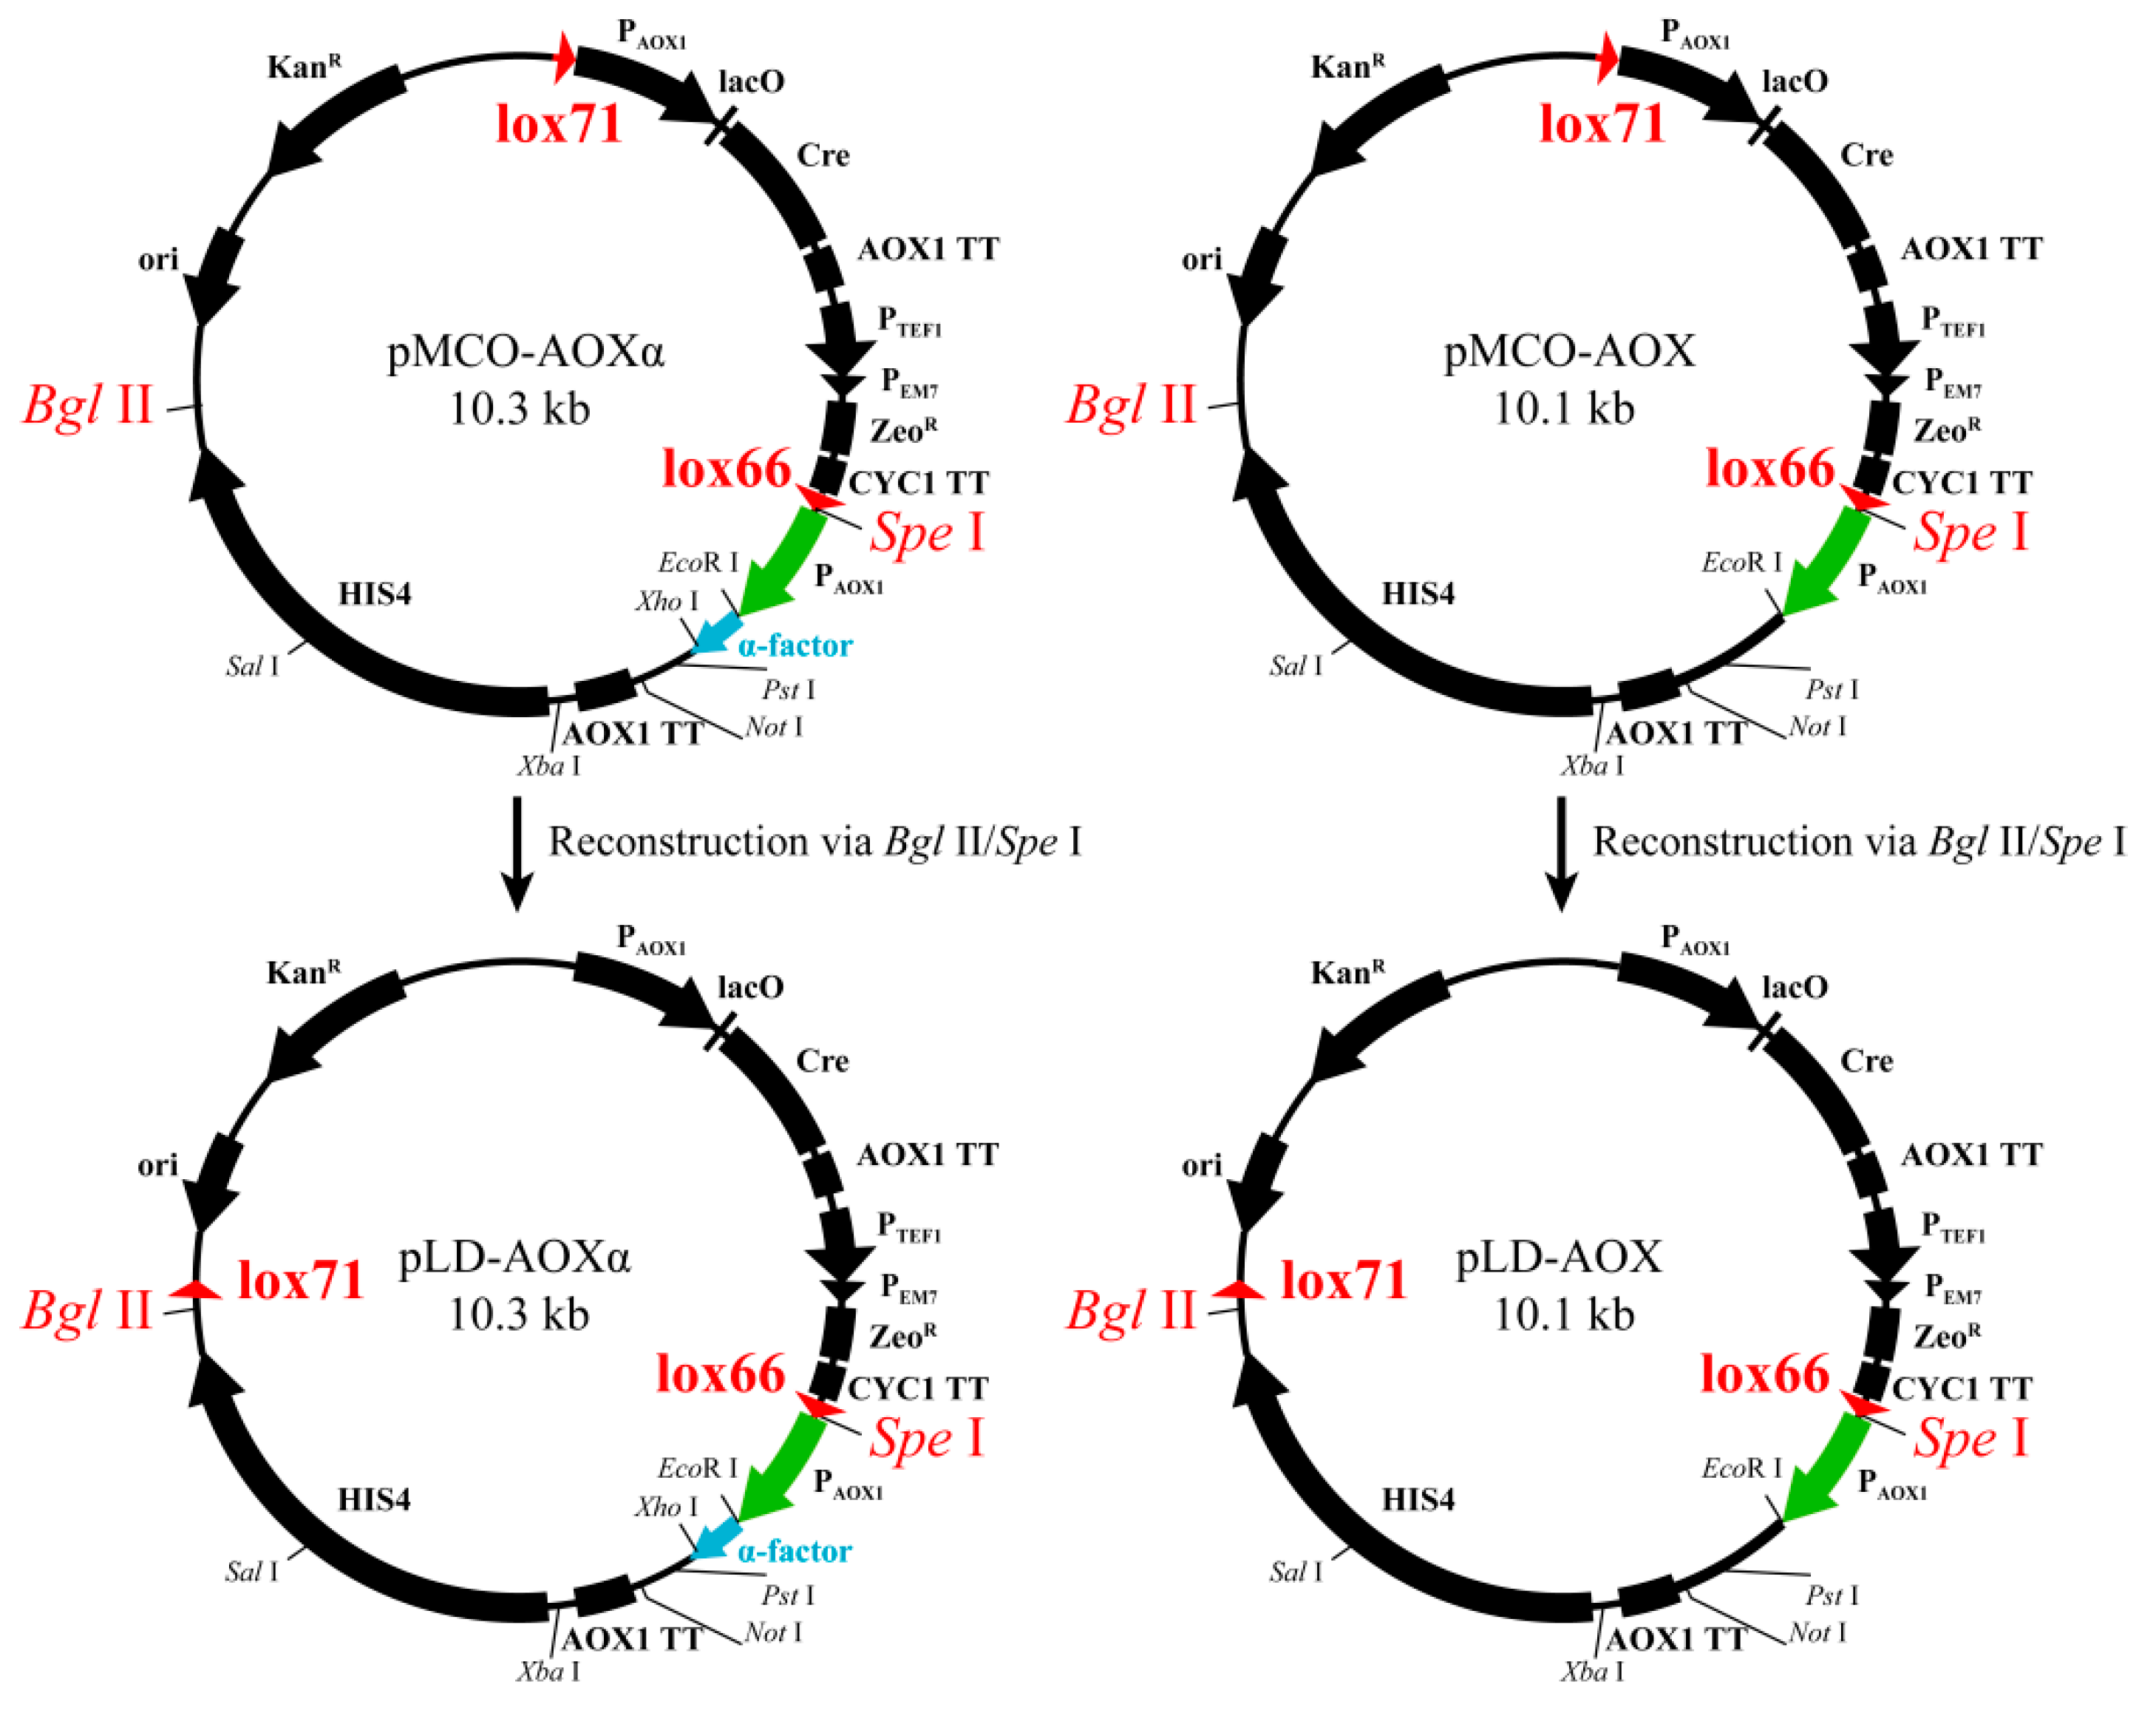
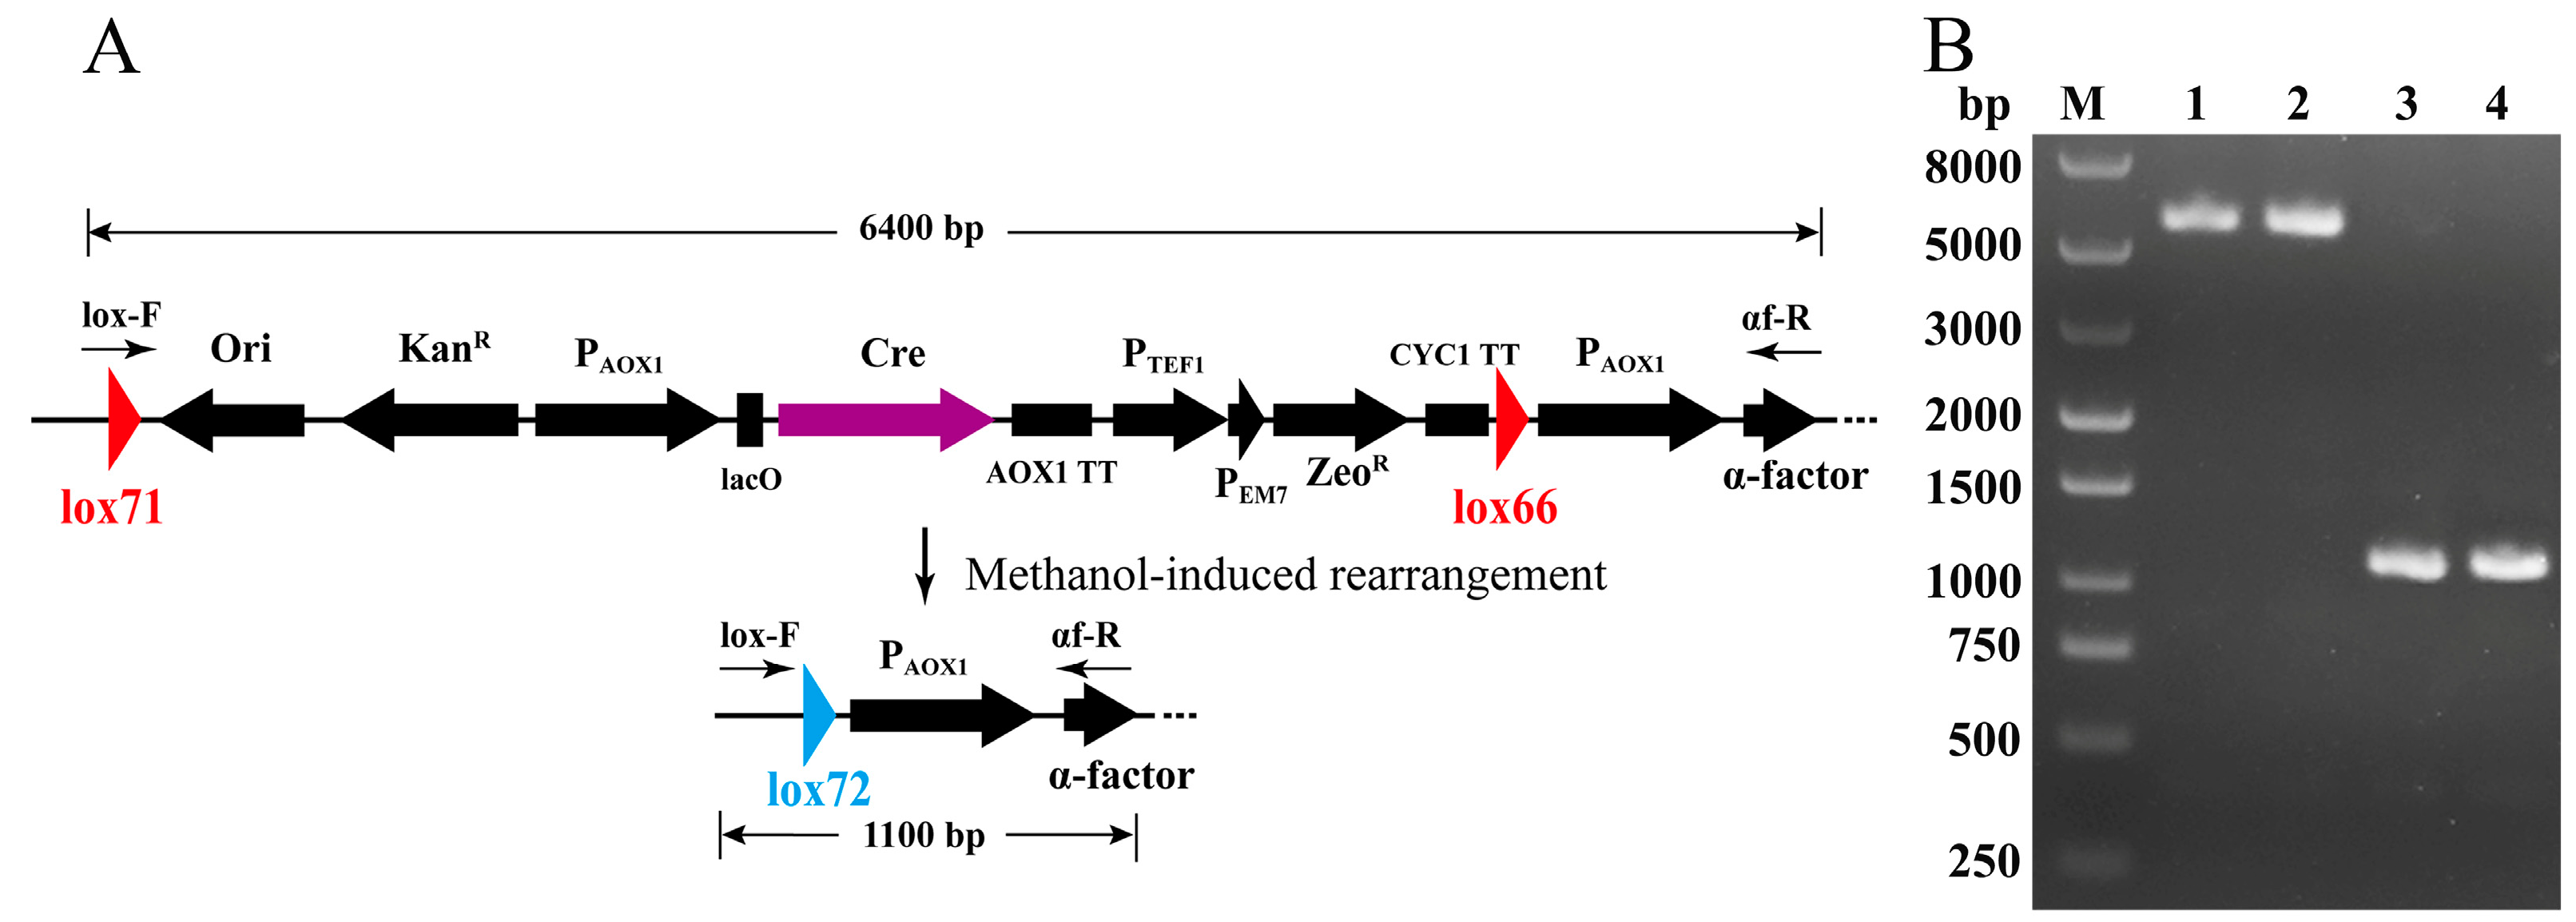
2.2. Construction of pLD-AOXα and pLD-AOX and Identification of Cre-loxP-Mediated Genetic Rearrangement

The DNA fragment of lox71-ori-KanR-PAOX1-lacO-Cre-AOX1TT-PTEF1-PEM7-ZeoR-CYC1TT-lox66 was synthesized in vitro and integrated into pMCO-AOXα and pMCO-AOX via Bgl II/Spe I, resulting in the formation of pLD-AOXα and pLD-AOX, as illustrated in Figure 1. After linearization by Sal I, both recombinant plasmids were transformed into P. pastoris GS115 via electroporation, generating the positive transformants designated as G-pLD-AOXαR and G-pLD-AOXR. These Zeocin-resistant strains were then cultured in BMMY medium in test tubes for 24 h to induce the expression of Cre recombinase, which mediates the genetic rearrangement of lox71-ori-KanR-PAOX1-lacO-Cre-AOX1TT-PTEF1-PEM7-ZeoR-CYC1TT-lox66. Following this, the 24 h BMMY cultures were streaked onto YPD plates and single colonies were subsequently transferred to YPD and YPDZ plates, followed by incubation at 28 °C overnight. The Zeocin-sensitive colonies, denoted as G-pLD-AOXαS and G-pLD-AOXS, were isolated and subjected to colony PCR using the primers lox-F and αf-R (detailed in Supplementary Table S1).

2.3. Construction of Plasmids with Alternative Promoters and Signal Peptides

Hartner reported a series of mutations of the AOX1 promoter, resulting in transcriptional levels ranging from 6% to 160%. These mutant variants, denoted by their promoter strength (e.g., 6p, 160p), were subsequently integrated into pLD-AOXα and pLD-AOX, yielding pLD-P1α, pLD-P2α, pLD-6p, pLD-14p, pLD-30p, and other recombinant plasmids (as shown in Table 1). The signal peptides utilized in this study, as listed in Table 1, were subjected to codon optimization, followed by in vitro synthesis. Subsequently, they were subcloned into pLD-P2α via EcoR I and Xho I (shown in Figure 1), resulting in the generation of pLD-P2S1, pLD-P2S2, and other recombinant plasmids, as indicated in Table 1.

2.4. Construction of Single-Copy Expression Plasmids and Yeast Transformants

Three nanobodies, Ty1 [3], 2Rs15d [4], and NB5 [5], designated as Va, Vb, and Vc in this study, were employed as model or reporter proteins to explore a universal nanobody expression technique. This technique was initially developed based on Va and further validated by Vb and Vc. Initially, Va, fused with a C-terminal His-tag, underwent codon optimization and in vitro synthesis before being integrated into the plasmids pLD-AOXα, pLD-P1α, pLD-P2α, and pLD-P2S1 to pLD-P2S7 via Xho I/Pst I. The resulting plasmids were labeled as pLD-AOXα-Va, pLD-P1α-Va, pLD-P2α-Va, and pLD-P2S1-Va to pLD-P2S7-Va. These plasmids were then linearized by Sal I and transformed into P. pastoris GS115 by electroporation. The resulting transformants harboring a single-copy target gene were referred to as 1-AOXα-Va, 1-P1α-Va, 1-P2α-Va, and 1-P2S1-Va to 1-P2S7-Va, respectively. Following shake-flask culture and expression identification, Vb and Vc underwent codon optimization, in vitro synthesis, and subcloning into pLD-P2S2 via Xho I/Pst I. The resulting plasmids were designated as pLD-P2S2-Vb and pLD-P2S2-Vc. The plasmid pLD-AOXα was transformed into GS115 for generating a negative control (designated as NC).

2.5. Shake-Flask Culture and Semi-Quantitative Analysis

Positive transformants selected on YPDZ plates were inoculated into 50 mL of BMGY liquid medium in a 250 mL shake flask and incubated at 29 °C overnight until the yeast cells reached the stationary phase. Subsequently, the yeast cells were harvested and resuspended in 50 mL of BMMY liquid medium in a 250 mL shake flask. Methanol (500 μL) was added every 24 h to maintain induction. Following 96 h of induction, the supernatants of the medium were obtained by centrifugation. Equal volumes of each supernatant sample were loaded onto each lane of the SDS-PAGE gel (YoungPAGE™ Precast Gels, Cat# M00928, GenScript, Nanjing, China) with Coomassie Brilliant Blue. The gray intensity value of each positive band was measured by ImageJ 1.48v (National Institutes of Health, Bethesda, MD, USA).

2.6. Construction of the Tandem Multicopy Expression Plasmids and Yeast Transformants

Plasmid pLD-P2S2-Va was digested by Spe I and Xba I to generate a 2.5 kb expression cassette. Simultaneously, pLD-P2S2-Va was digested by Xba I. These two fragments were ligated by T4 ligase to construct the plasmid pLD-2-P2S2-Va harboring 2-copy target gene. Likewise, plasmid pLD-4-P2S2-Va and other multicopy plasmids for Vb and Vc were created using the same methodology and nomenclature.
The plasmids pLD-2-P2S2-Va and pLD-4-P2S2-Va were transformed into P. pastoris GS115 by electroporation, the resultant transformants were designated as 2-P2S2-Va and 4-P2S2-Va. The copy numbers of target genes in multicopy transformants were confirmed by real-time quantitative PCR (qPCR) and the 2−ΔΔCT method, as described by Li et al. [25]. Primers used for qPCR were shown in Supplementary Table S1. The housekeeping gene GAPDH was chosen as the reference gene. Due to the fusion of Va, Vb, and Vc with an α-factor Δ57–70 signal peptide within one open reading frame (ORF), α-factor Δ57–70 was selected as the target gene for operational convenience.

2.7. Obliteration of Resistance towards Zeocin for P. pastoris Transformants

Yeast strain 2-P2S2-Va was cultured in BMMY medium in a test tube for 24 h to induce the expression of Cre recombinase, which mediates the genetic rearrangement of lox71-ori-KanR-PAOX1-lacO-Cre-AOX1TT-PTEF1-PEM7-ZeoR-CYC1TT-lox66 fragment (as shown in Figure 1). The 24 h BMMY cultures were streaked onto YPD plates. Single colonies were transferred to YPD and YPDZ plates and incubated at 28 °C overnight. The strains sensitive to Zeocin were isolated to generate electrocompetent cells.

2.8. Construction of Recombinant Plasmids with Various Molecular Chaperones

Molecular chaperone genes were amplified using the primers specified in Supplementary Table S1 and then subcloned into pLD-AOX via EcoR I and Not I, as illustrated in Figure 1. The resulting plasmids, which intracellularly co-express molecular chaperones, were designated as pLD-AOX-AFT1, pLD-AOX-eIF4A, and so on. Given that the HAC1 gene contains an intron, hindering its expression due to its secondary structure, the spliced HAC1 gene was synthesized in vitro and subsequently subcloned into pLD-AOX via EcoR I and Not I as previously described [21,22]. The resulting plasmid was labeled as pLD-AOX-HAC1. Plasmids pLD-6p-HAC1 to pLD-160p-HAC1 were constructed following the same procedure.

2.9. Generation of Multicopy Recombinants Co-Expressing Molecular Chaperones

The plasmids pLD-AOX-HAC1 and pLD-AOX-AFT1 to pLD-AOX-KEX2 (the applied molecular chaperones are shown in Supplementary Table S1) were linearized and then introduced into Zeocin-sensitive 2-P2S2-Va electrocompetent cells. The resulting yeast strains were designated as 2-P2S2-Va-HAC1, 2-P2S2-Va-AFT1, and so forth.
Upon verification of the production of the target protein, plasmids pLD-6p-HAC1 to pLD-160p-HAC1 were linearized and then introduced into Zeocin-sensitive 2-P2S2-Va electrocompetent cells. The resulting yeast strains were designated as 2-P2S2-Va-6p-HAC1, 2-P2S2-Va-55p-HAC1, 2-P2S2-Va-160p-HAC1, and so on.

2.10. High-Density Fermentation

The strain 2-P2S2-Va-55p-HAC1 was used in a high-density fermentation assay following the protocol described by Teng et al. [26]. A 200 mL supernatant from the 3 L high-density fermentation broth was collected and subjected to affinity chromatography for purification. The purified Va was then diluted to 200 mL and its protein concentration was measured using the BCA assay kit (Thermo Fisher Scientific, Waltham, MA, USA). This concentration corresponded to the Va concentration in the high-density fermentation supernatant. Additionally, the supernatant from a 200 mL shake flask culture of the initial strain 1-AOXα-Va was harvested and purified in the same manner for comparative yield assessment.

2.11. Generation and Validation of Yeast Strains with Pre-Integrated Attenuated HAC1

The plasmid pLD-55p-HAC1 was linearized and then transformed into the GS115 strain to generate positive recombinant colonies. These colonies were cultured in BMMY medium to induce genetic rearrangement, resulting in the isolation of the Zeocin-sensitive yeast strain designated as H55. Subsequently, the plasmids pLD-P2S2-Va, pLD-2-P2S2-Va, and pLD-4-P2S2-Va were linearized and transformed into both GS115 and H55 strains, resulting in the yeast strains designated as G-1-Va, G-2-Va, and G-4-Va; and H55-1-Va, H55-2-Va, and H55-4-Va, respectively. These six strains were collectively treated as a group, and similar groups for Vb and Vc were constructed using identical methodology and nomenclature. The expression levels of Va, Vb, and Vc were assessed through shake-flask cultivation and semi-quantitative analysis.

2.12. Statistical Analysis

Statistical differences were examined using one-way ANOVA and the t-test. Statistical significance was determined at p < 0.05. The experiments were conducted at least three times, and all data are expressed as mean ± SD.

3. Results

3.1. Construction of pLD-AOXα and pLD-AOX and Identification of Cre-loxP Mediated Genetic Rearrangement

The parental plasmid pMCO-AOXα and pMCO-AOX contain ori-KanR-lox71-PAOX1-lacO-Cre-AOX1TT-PTEF1-PEM7-ZeoR-CYC1TT-lox66 fragments, as depicted in Figure 1. Upon transformation and methanol culture, Cre recombinase induced genetic rearrangement between lox71 and lox66 in the transformants, leading to the removal of ZeoR and the persistence of KanR. In response, the position of lox71 on the plasmids pLD-AOXα and pLD-AOX was adjusted (as shown in Figure 1) to ensure the simultaneous deletion of ZeoR and KanR after gene rearrangement in the yeast genome. As shown in Figure 2, a 6.4 kb fragment was amplified from the strains G-pLD-AOXαR and G-pLD-AOXR using primers lox-F and αf-R. Subsequently, a 1.1 kb fragment was amplified from G-pLD-AOXαS and G-pLD-AOXS after methanol induction. This demonstrates the complete deletion of the ZeoR and KanR genes due to genetic rearrangement.

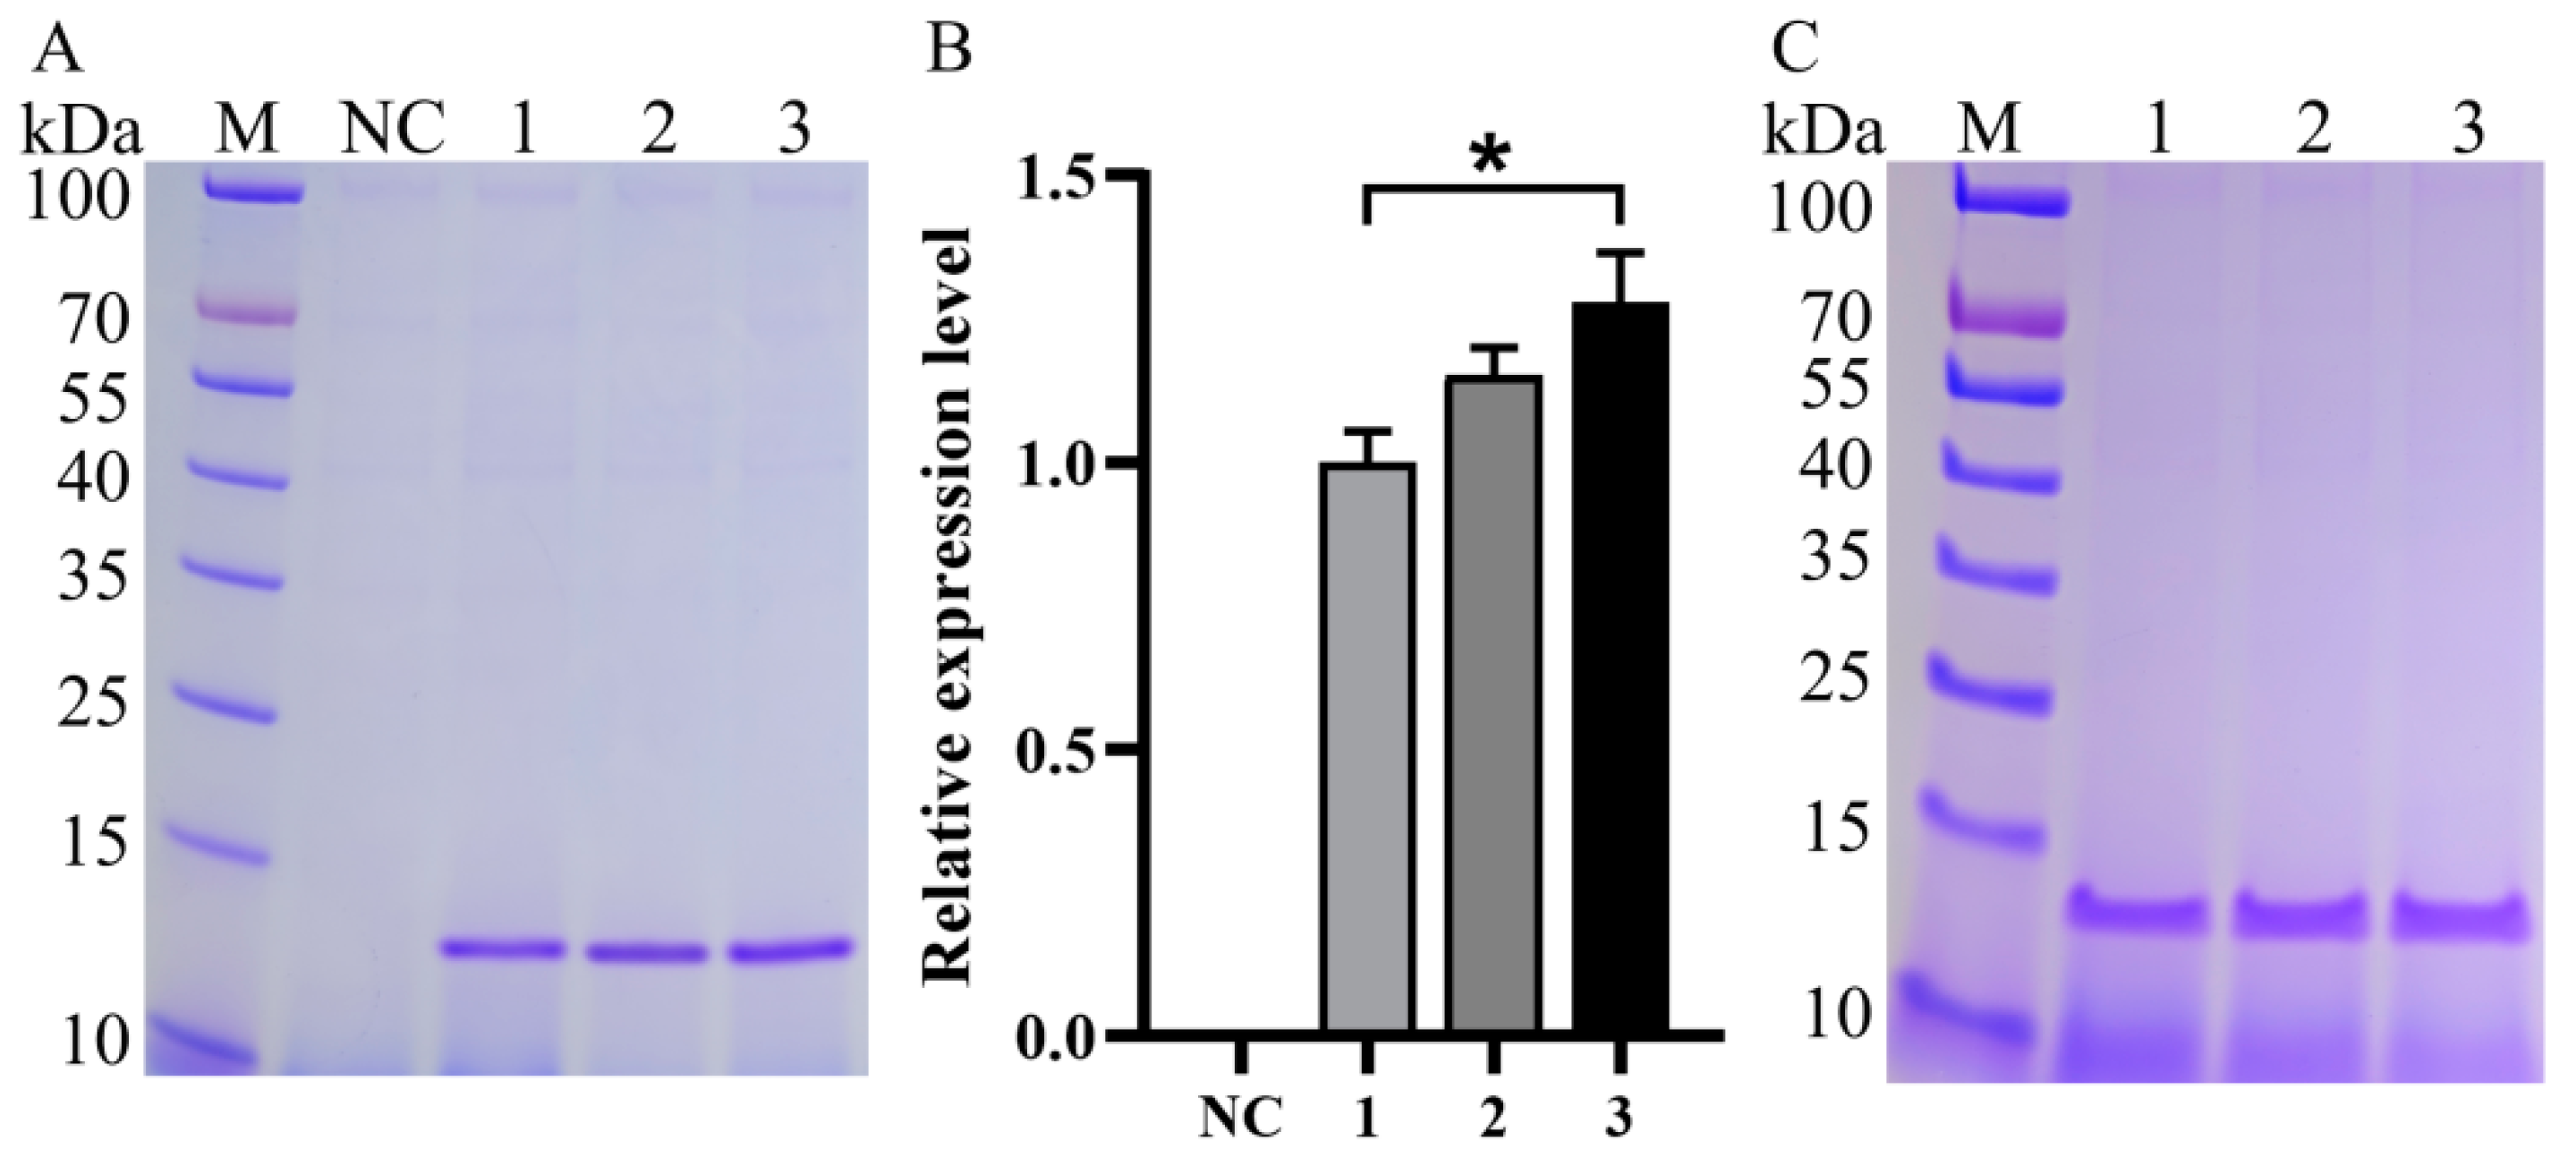
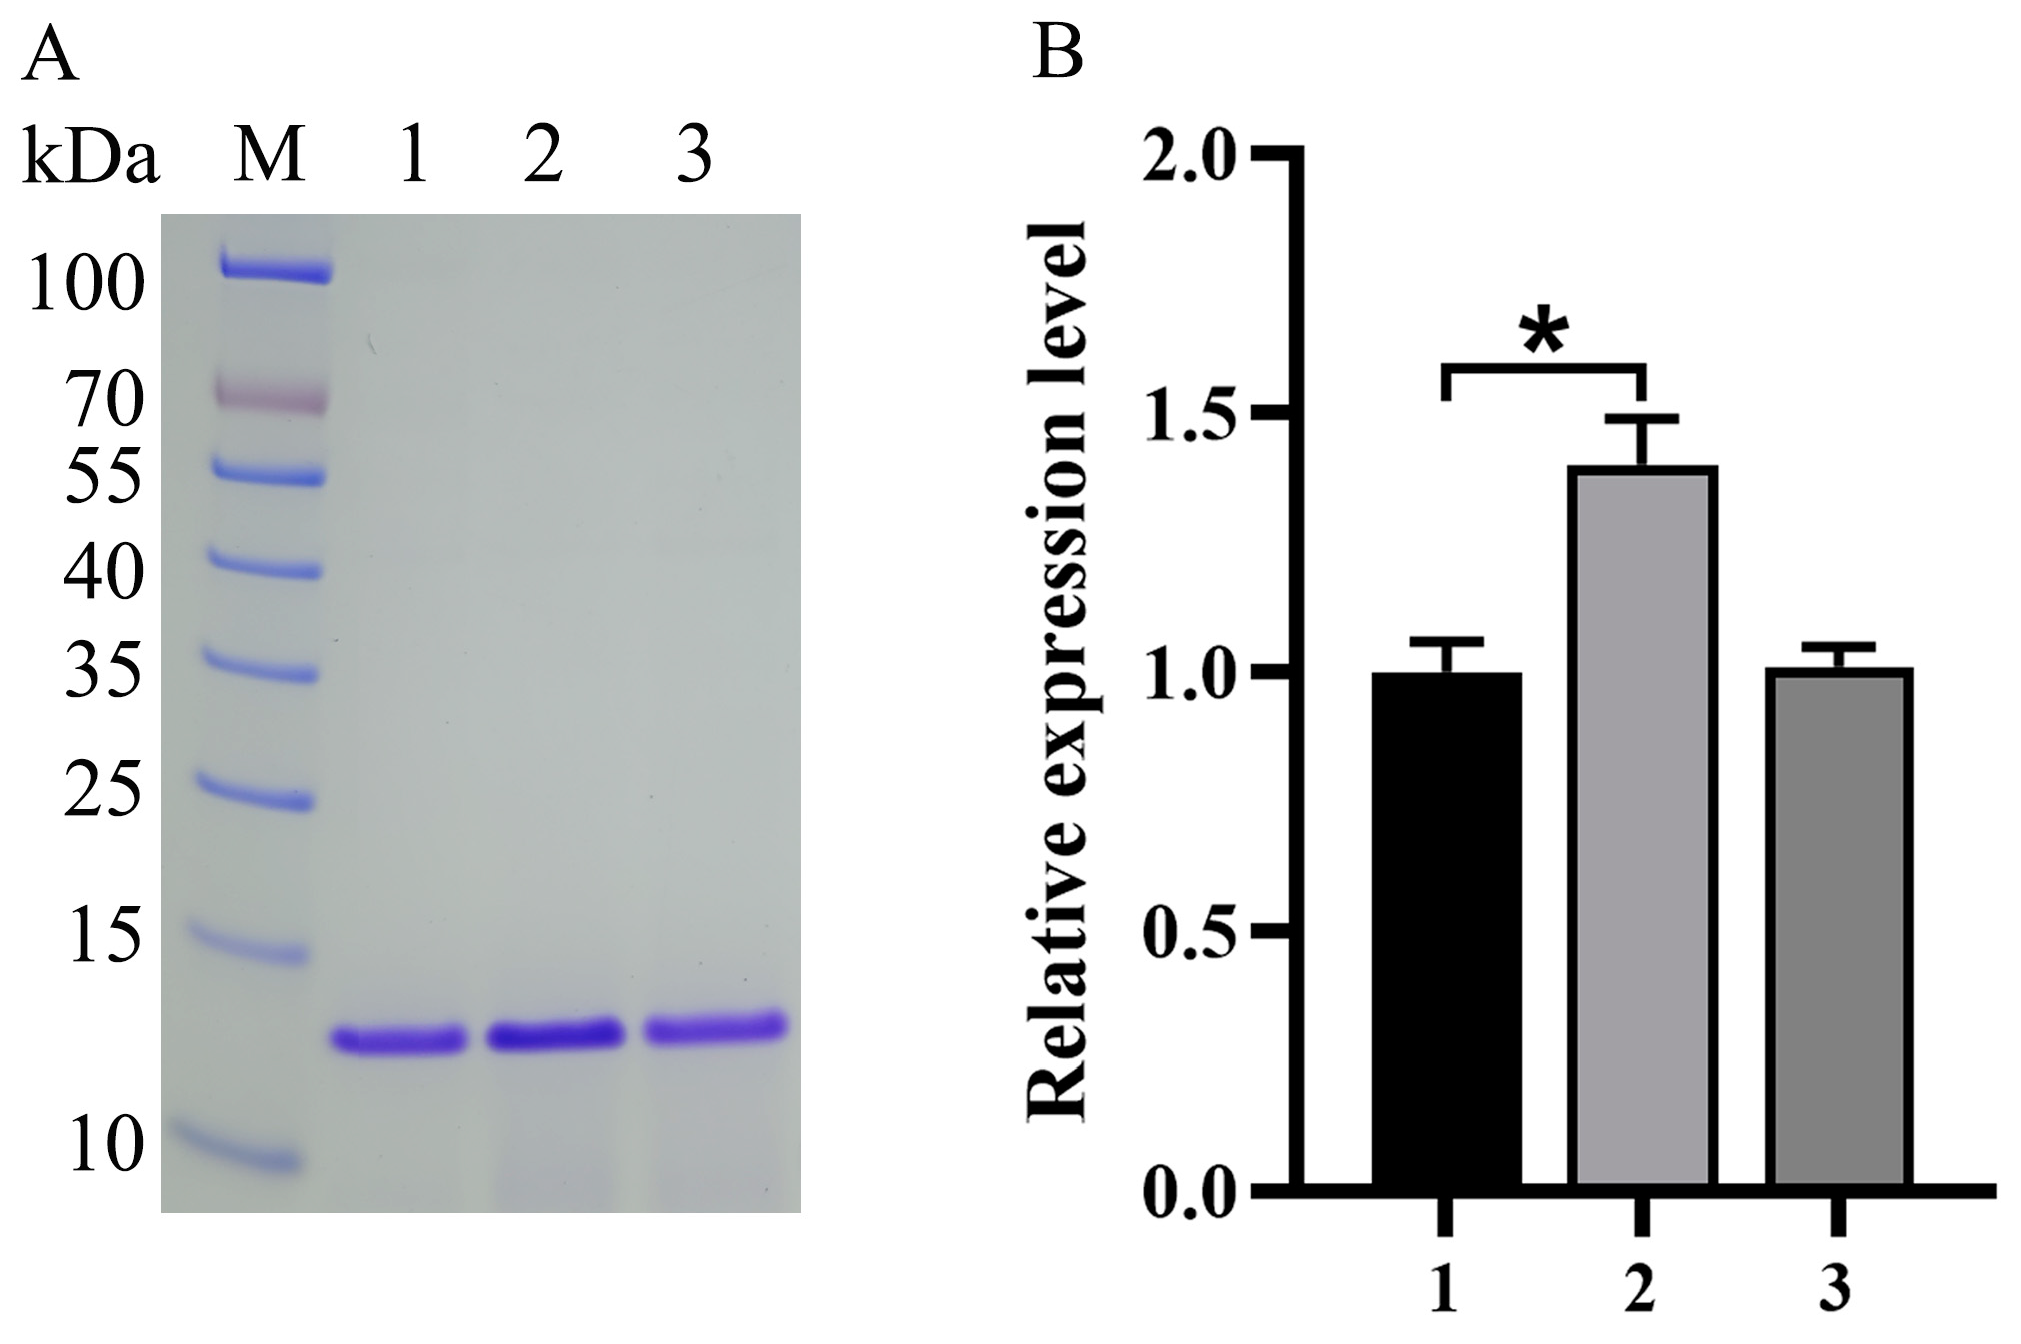
3.2. Impact of Expression Component Optimization on Va Production

The presence of distinct and well-defined protein bands is crucial for semi-quantitative analysis. Loading a 20 µL sample onto each lane of the SDS-PAGE gel resulted in smeared target protein bands (Figure 3C), whereas a 10 µL sample yielded specific and prominent protein bands (Figure 3A). Consequently, a consistent sample volume of 10 µL for each supernatant was adopted in subsequent experiments. Semi-quantitative analysis revealed a 1.25-fold increase in Va production when using the 133p promoter and a 1.38-fold increase when using the 160p promoter. Therefore, the pLD-P2α plasmid was employed for subsequent signal peptide engineering.
Seven different signal peptides were tested as candidates to enhance the production of Va, resulting in the generation of plasmids pLD-P2S1 to pLD-P2S7. Semi-quantitative analysis indicated that the Msb2 signal peptide led to a reduction in Va production (Figure 4, Lane 7), while the nSB and Gas1 signal peptides had minimal improvement (Figure 4, Lanes 5 and 8). In contrast, the MF4I and Dse4 signal peptides increased Va production by 1.36 and 1.25 times, respectively (Figure 4, Lanes 1 and 6). Significantly, the α-factor Δ57–70 signal peptide notably increased Va production by 1.89 times (Figure 4, Lane 3). However, a slight decrease in Va production was observed when the HL28 polypeptide was used in combination with the α-factor Δ57–70 signal peptide (Figure 4, Lane 4), suggesting that this combination may not always be universally effective. Thus, the α-factor Δ57–70 signal peptide was identified as the most effective signal peptide for the secretion of Va. As for Vb and Vc, the other two reporter proteins, they underwent codon optimization, in vitro synthesis, and subcloning into pLD-P2S2, resulting in the generation of pLD-P2S2-Vb and pLD-P2S2-Vc. These three plasmids were utilized for the in vitro construction of multicopy plasmids.

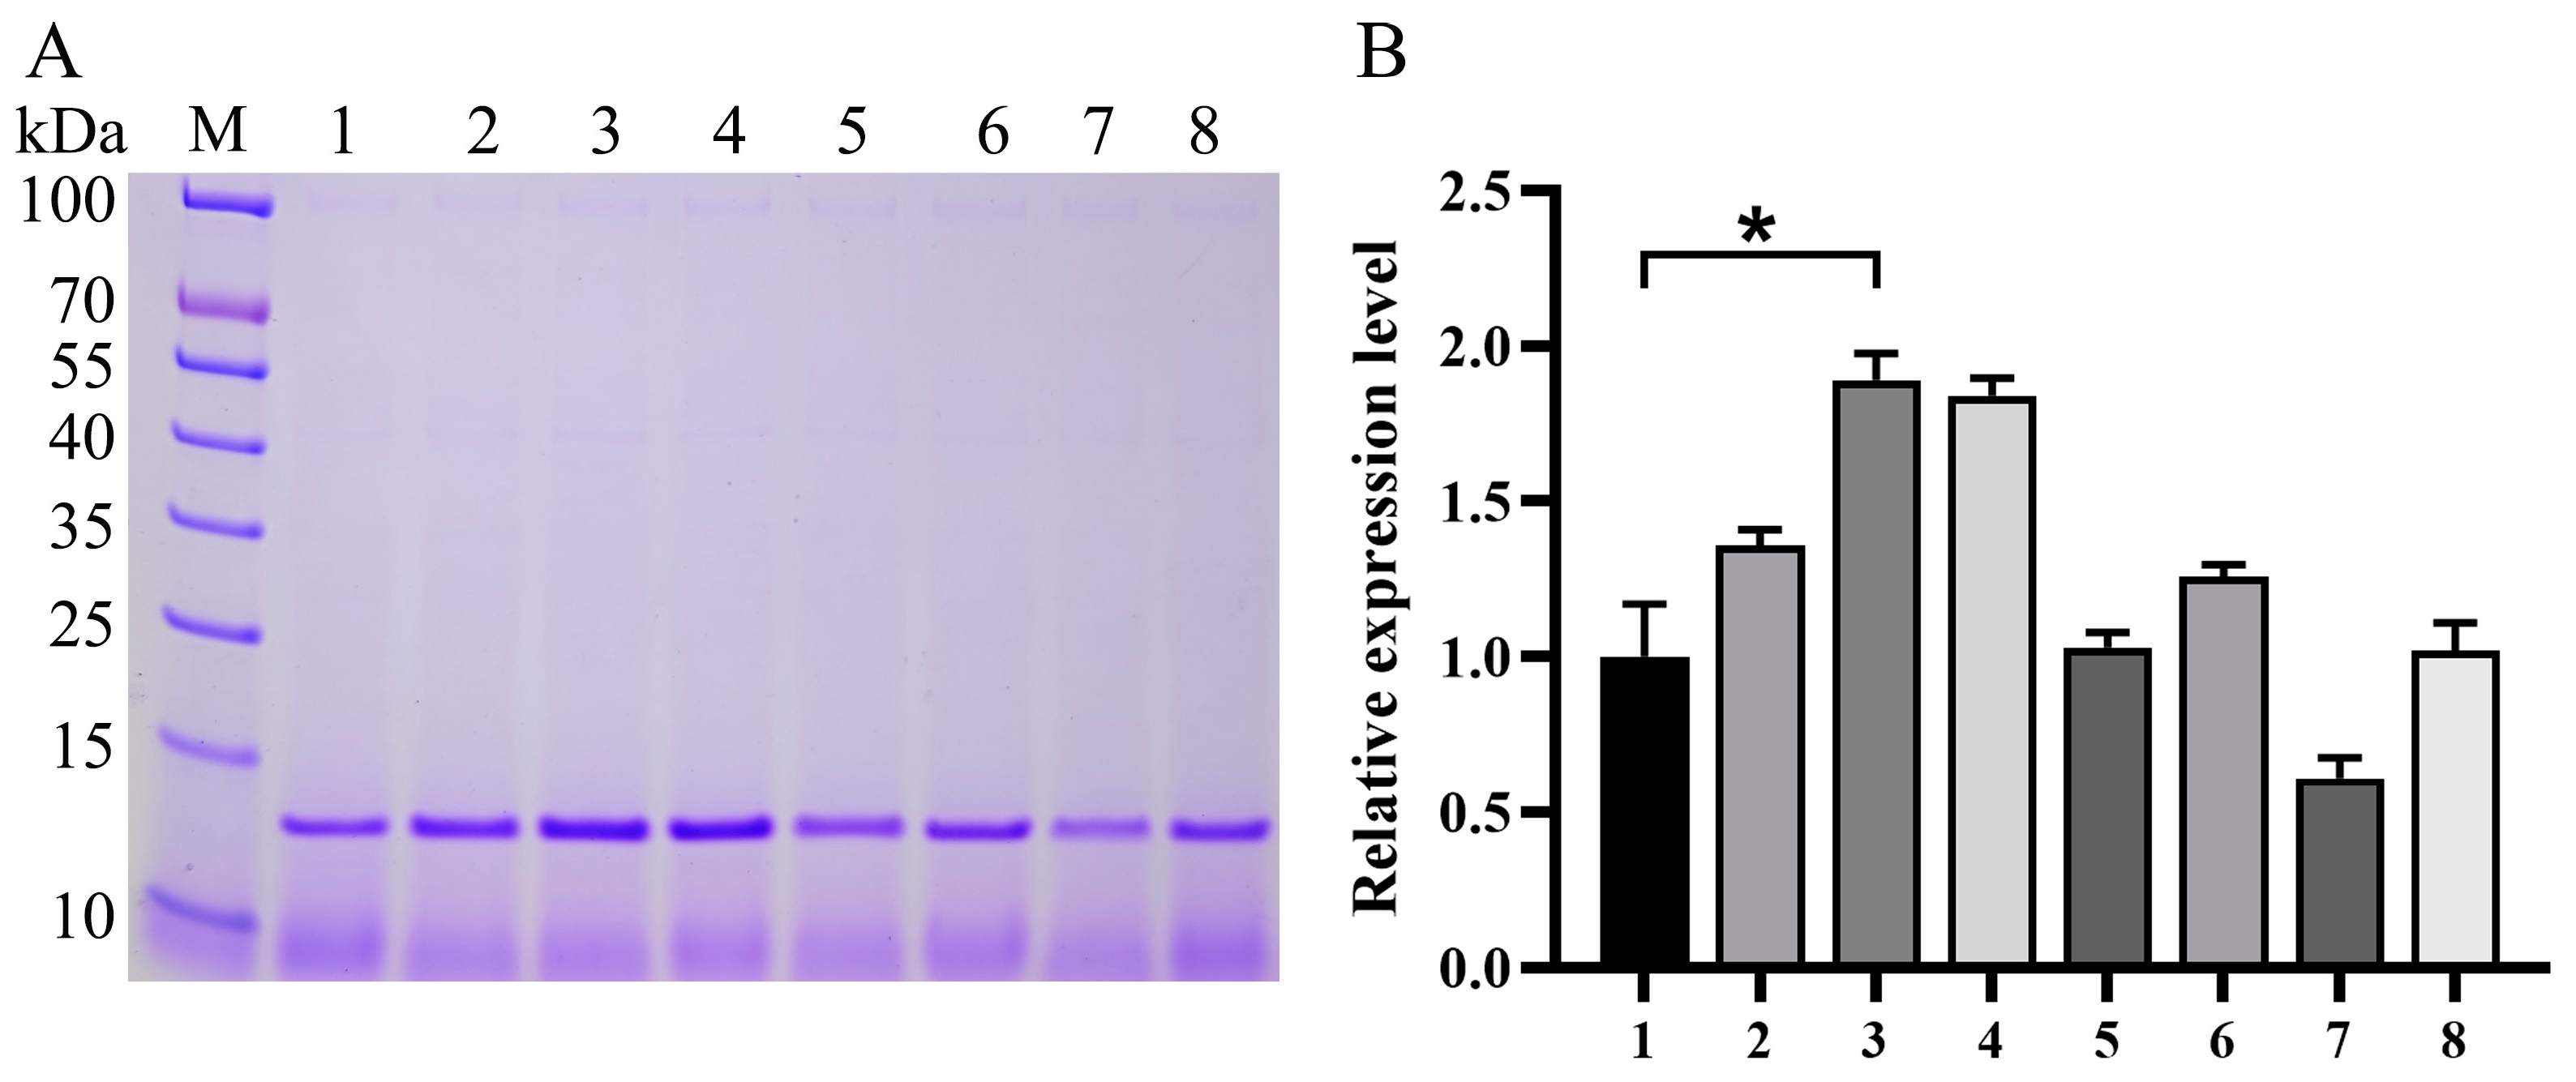
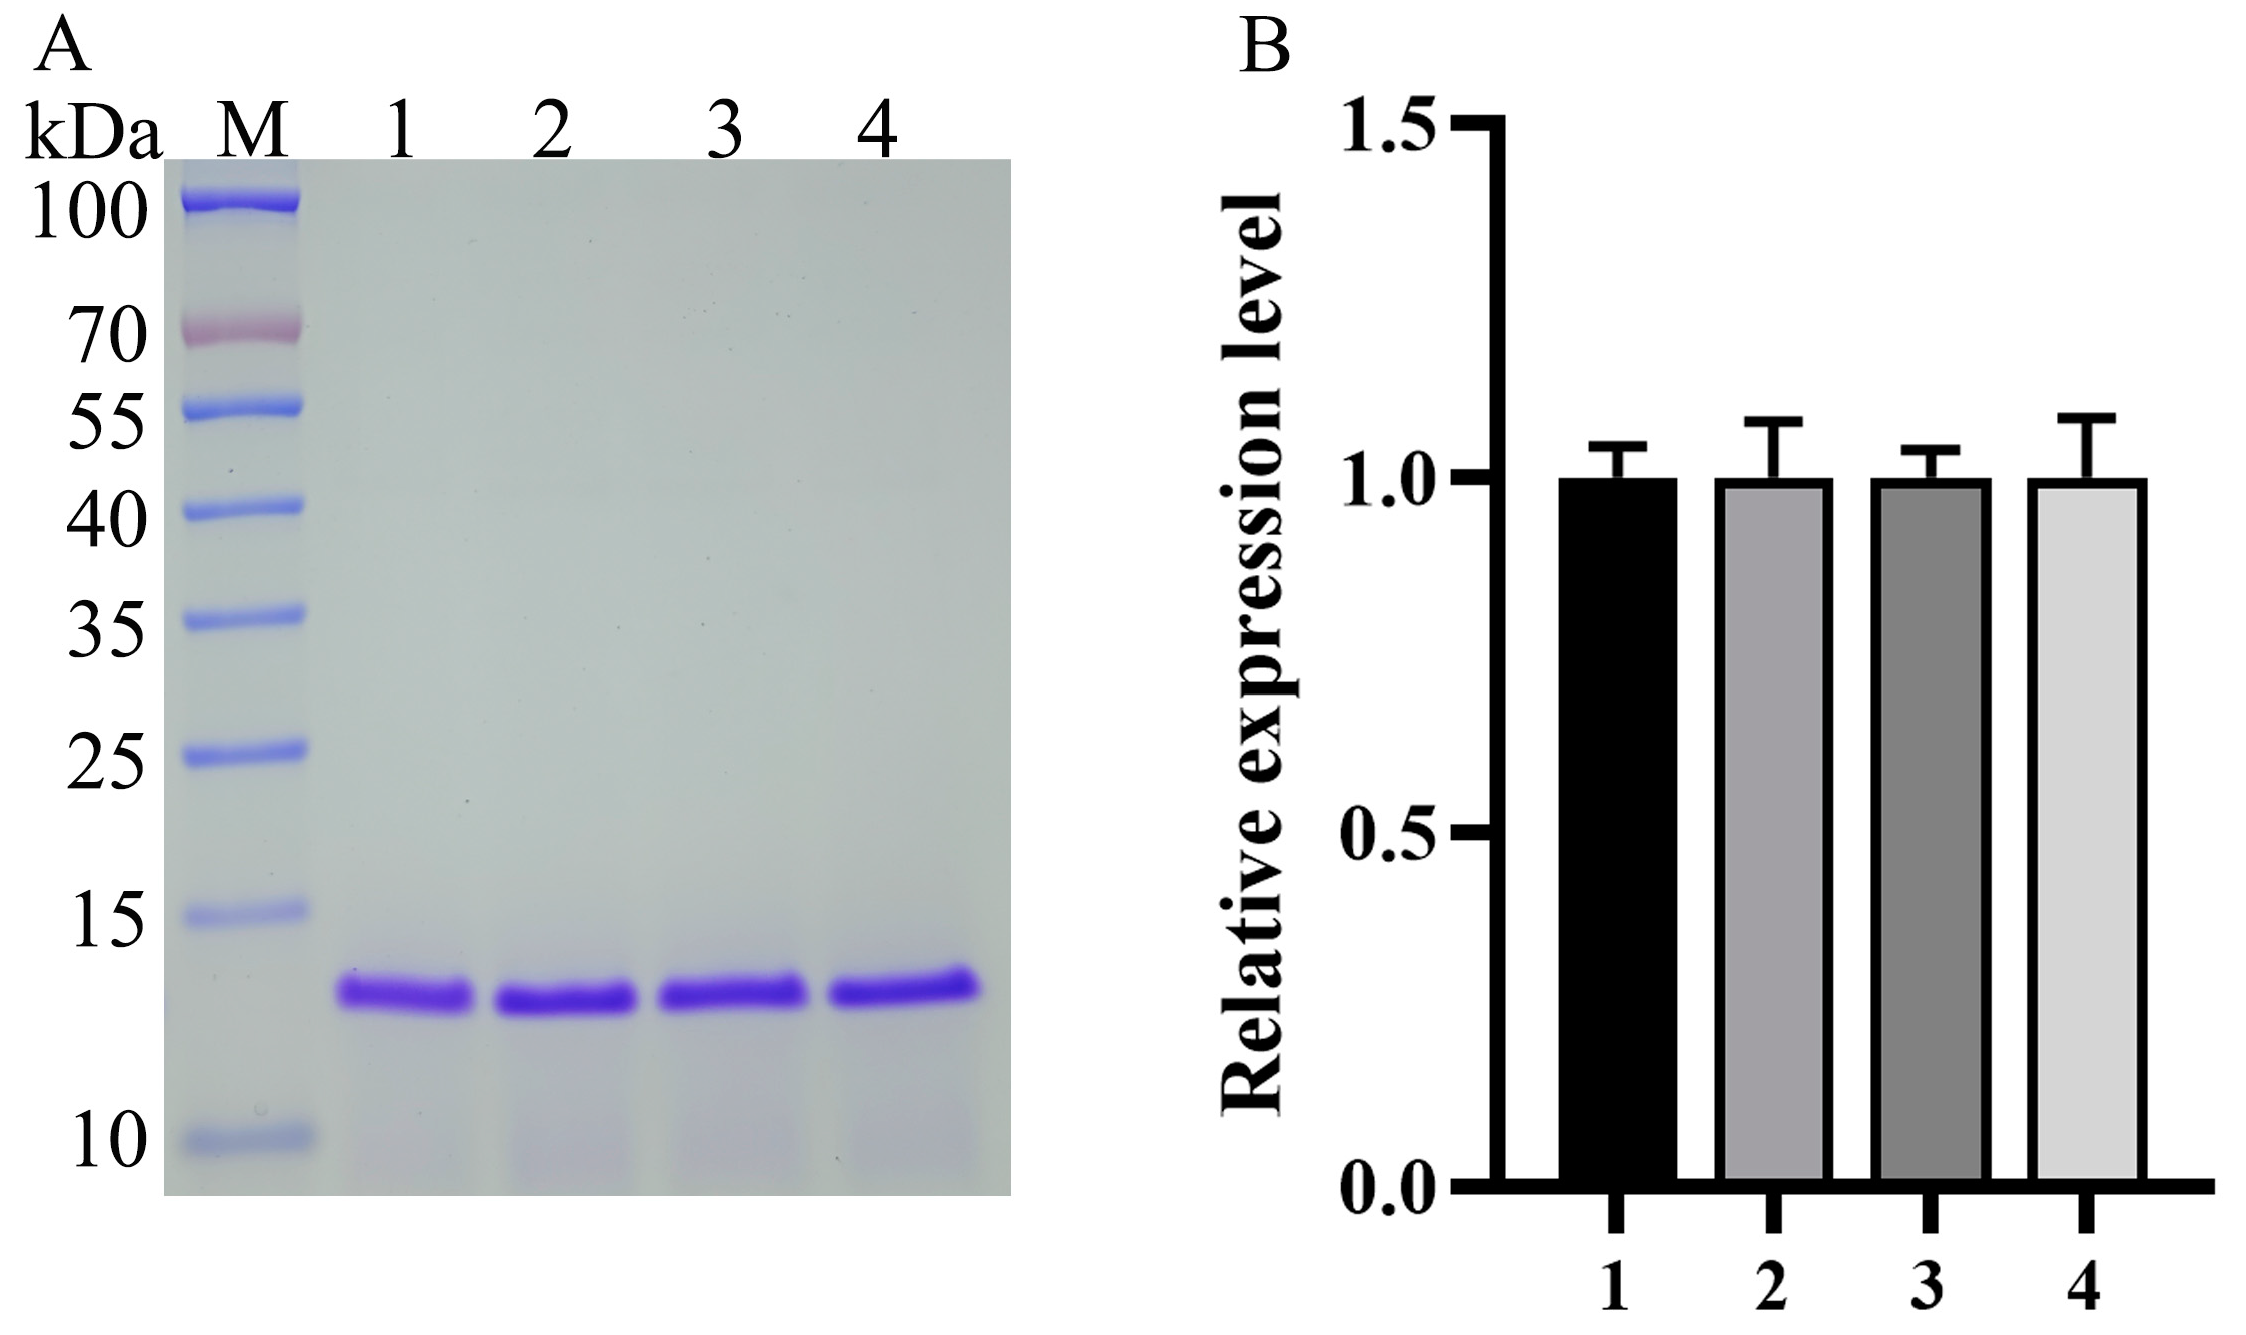
3.3. Generation and Identification of the Tandem Multicopy Expression Plasmids and Transformants

The isocaudamer method was utilized to construct multicopy plasmids for Va, Vb, and Vc, as previously described [27]. To confirm the appropriate integration of expression cassettes, the multicopy plasmids underwent digestion with Spe I and Xba I. Subsequent gel electrophoresis analysis revealed a progressive increase in molecular weight for the inserted expression cassettes, while the molecular weight of the vector frame remained approximately 7.6 kb (arrow, Figure 5). This outcome validated the precise construction of the multicopy plasmids.
The multicopy plasmids for Va were linearized and transformed into P. pastoris GS115, followed by flask culture. The copy number of Va genes in the multicopy yeast strains was confirmed by qPCR using the 2−ΔΔCT method. The semi-quantitative analysis revealed that the Va production in the 2-P2S2-Va strain was 1.39 times higher than that in the 1-P2S2-Va strain (Figure 6), while the production in the 4-P2S2-Va strain was slightly lower than in the 1-P2S2-Va strain. This difference may be attributed to the overexpression of the precursor protein, which hinders proper protein folding and transport, thereby imposing stress on the host cells.

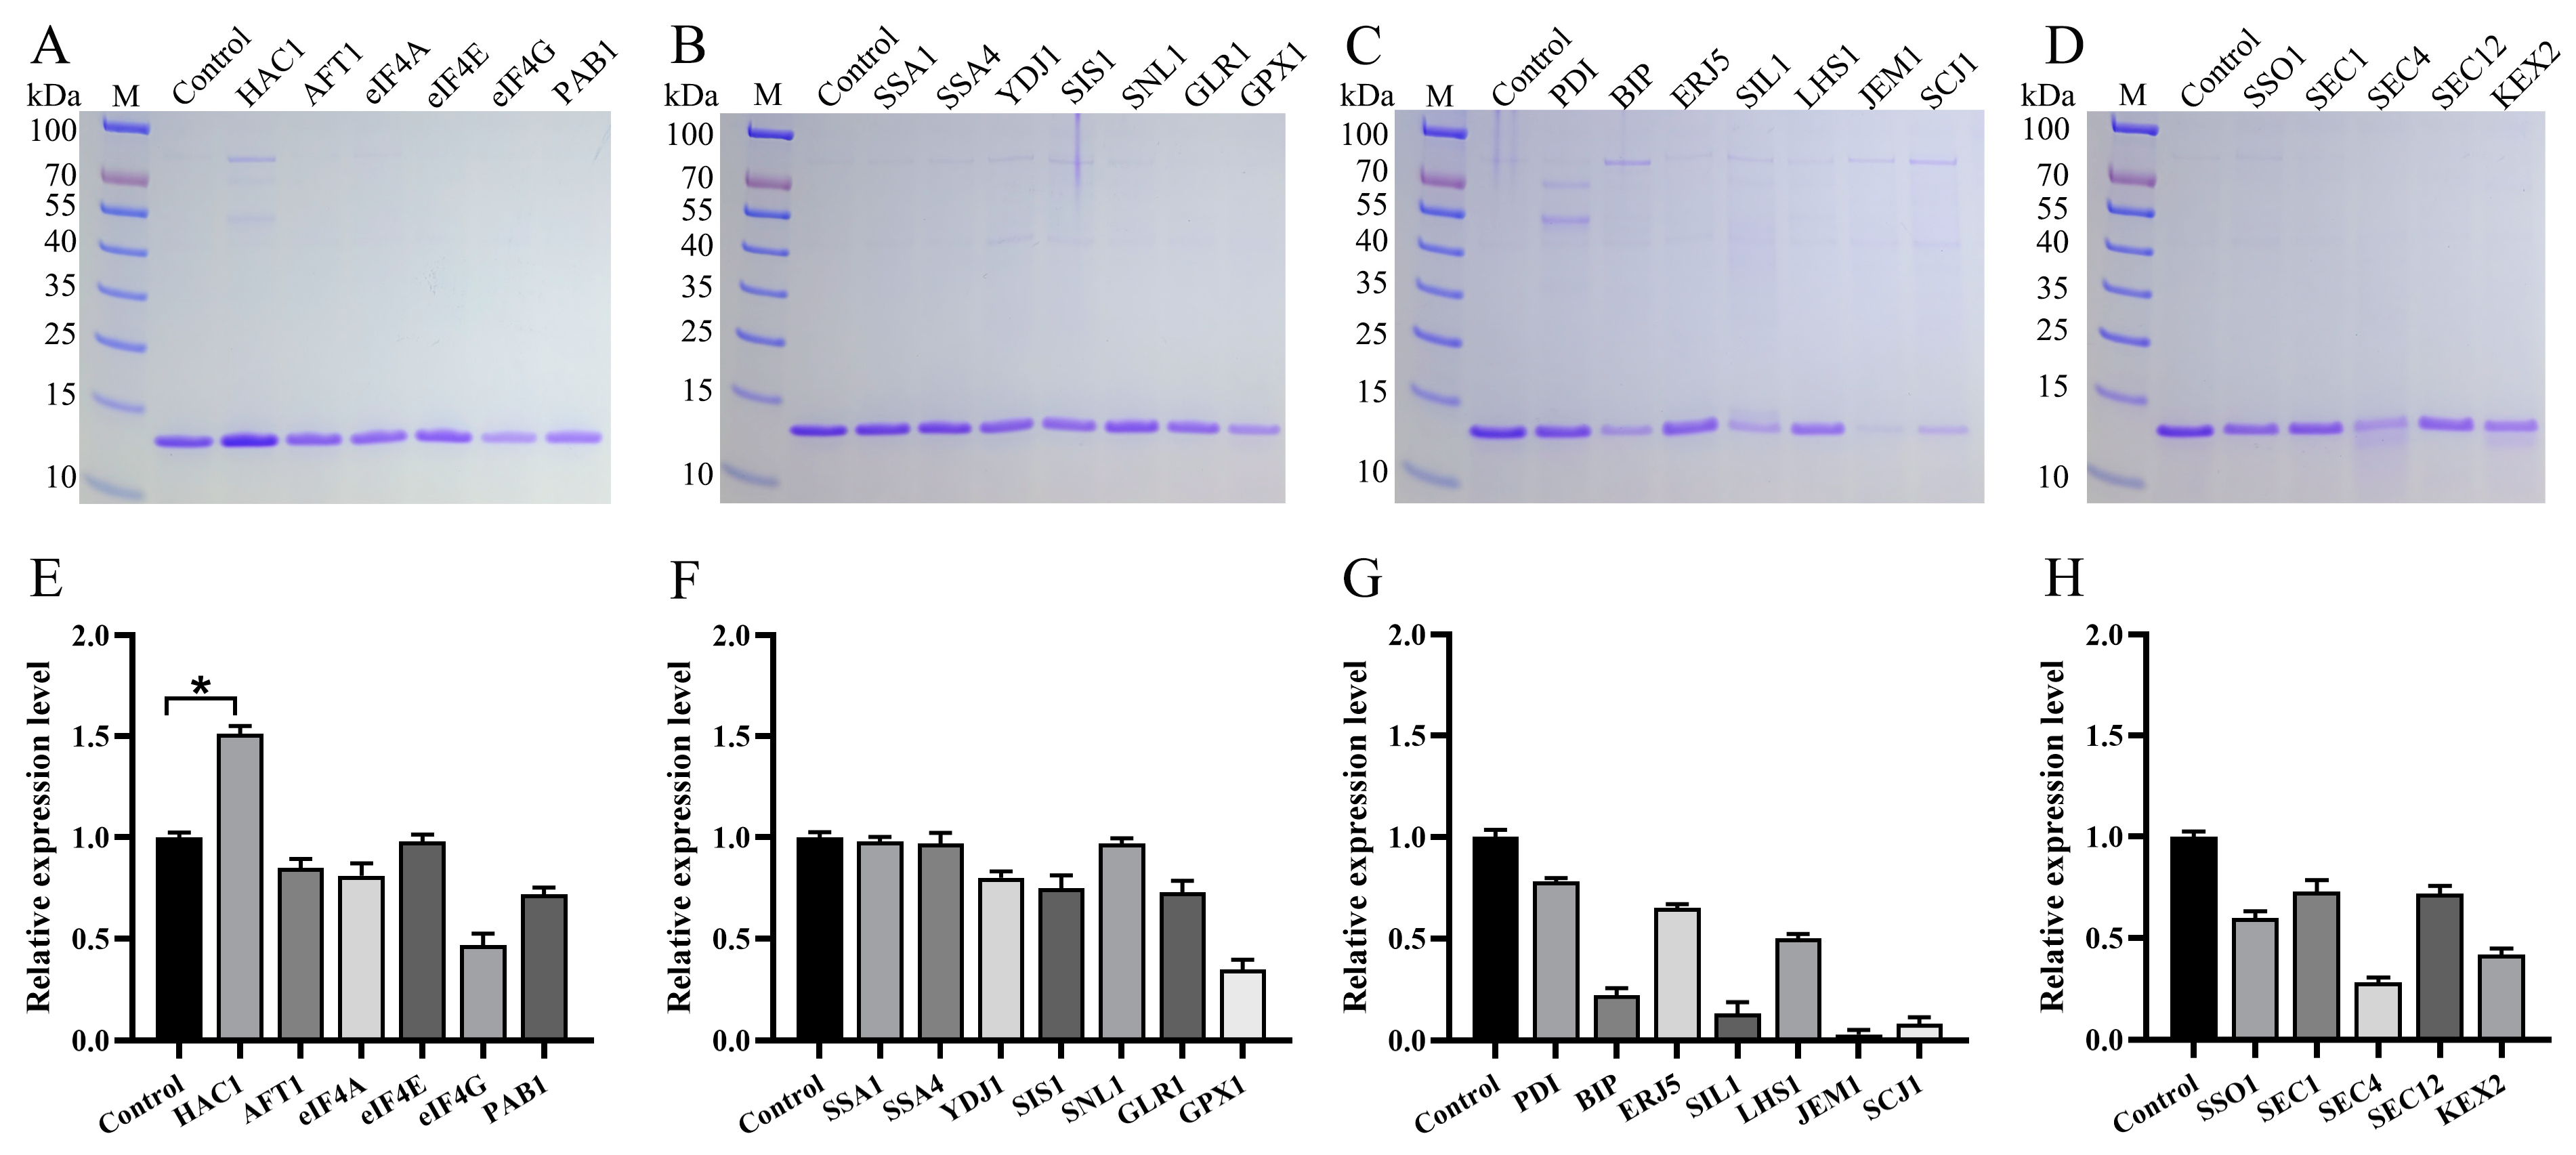
3.4. Impact of Molecular Chaperones on Va Production

Three Zeocin-sensitive colonies, designated as 2-P2S2-Va-S#3, 2-P2S2-Va-S#18, and 2-P2S2-Va-S#24, were randomly selected from the BMMY culture as previously described. These strains were subsequently subjected to shake-flask culture and SDS-PAGE analysis, which revealed a consistent Va yield (Figure 7). Therefore, the 2-P2S2-Va-S#3 strain was utilized to generate competent cells.
The 25 molecular chaperones can be classified into four groups based on their subcellular locations: nucleus, cytoplasm, endoplasmic reticulum (ER), and Golgi (as shown in Table 2). Functionally, they are primarily grouped as transcription factors, Hsp70s, Hsp40s, and nucleotide exchange factors (NEFs). The corresponding plasmids, such as pLD-AOX-HAC1, pLD-AOX-AFT1, and pLD-AOX-eIF4A to pLD-AOX-KEX2, were linearized and transformed into the 2-P2S2-Va-S#3 strain. The resulting transformants, harboring a two-copy target gene in conjunction with individual molecular chaperones, were named 2-P2S2-Va-HAC1, 2-P2S2-Va-AFT1 and 2-P2S2-Va-eIF4A to 2-P2S2-Va-KEX2, respectively. These yeast strains were then subjected to shake-flask culture and SDS-PAGE analysis. Surprisingly, the majority of the molecular chaperones did not significantly enhance Va production (as shown in Figure 8). Co-expression of eIF4E, SSA1, SSA4, and SNL1 had minimal impact on Va levels, while co-expression of GPX1, BIP, SIL1, JEM1, and SCJ1 led to a decrease of over 70% in Va production. Only the co-expression of HAC1 led to a substantial increase in Va production by approximately 1.5-fold. Consequently, the impact of HAC1 expression on Va production was further verified in subsequent experiments.

3.5. Impact of Attenuated HAC1 on Va Production

The expression level of HAC1 was successively decreased using different AOX1 promoter mutants (e.g., 6p, 30p, etc.; see Table 1), generating a range of recombinant yeast strains with varying HAC1 expression levels. Semi-quantitative analysis revealed that under the control of the 160p promoter (Figure 9, Lane 8), HAC1 did not significantly enhance Va production compared to the control strain 2-P2S2-Va (Figure 9, Lane 1). In contrast, expression of HAC1 under the control of the 6p, 14p, 30p, 55p, 75p, and the wild-type AOX1 promoter resulted in increased Va production. Interestingly, the 30p, 55p, and 75p promoters led to higher Va production than the wild-type AOX1 promoter (Figure 9, Lane 7). The Va production of strain 2-P2S2-Va-55p-HAC1 (Figure 9, Lane 5) was the highest, being 1.66 times that of the 2-P2S2-Va-HAC1 strain (using the wild-type AOX1 promoter) and 2.41 times that of the 2-P2S2-Va strain (without co-expression of HAC1). As a result, strain 2-P2S2-Va-55p-HAC1 was selected for subsequent high-density fermentation experiments.

3.6. High-Density Fermentation

Due to the absence of protein quantification methods such as ELISA, the quantification of nanobody production in this study could only be achieved through SDS-PAGE and semi-quantitative analysis. Given the substantial disparity in molecular weight between BSA and Va (approximately six-fold), the final yield of Va was indirectly determined by protein purification rather than comparing the intensity of the protein bands for BSA and Va on the SDS-PAGE gels. The supernatant from a 200 mL high-density fermentation culture (Figure 10, Lane 7) underwent affinity chromatography with imidazole removal by dialysis. The purified Va was then diluted to the initial volume (200 mL), resulting in a measured Va concentration of 2.13 g/L. It is thus inferred that the supernatant from the 3 L high-density fermentation culture contains at least 2.13 g/L of Va. Similarly, the supernatant from a 200 mL shake-flask culture of the 1-AOXα-Va strain (Figure 10, Lane 9) was purified, and the initial expression level of Va in the 1-AOXα-Va strain shake-flask culture was consequently evaluated to be 42.7 mg/L. In conclusion, the yield of Va was increased by 49.8-fold through modification of expression components, optimization of gene dosage, co-expression of molecular chaperones, and high-density fermentation.

3.7. Generation and Validation of the Packaging Strategy of High-Yielding Strain Construction

Among all the molecular chaperones tested in this study, 55p-HAC1 showed the most significant improvement in Va production. As a result, the aforementioned optimization pathway was anticipated to become a universal and efficient method for nanobody expression in P. pastoris. To achieve this, the plasmid pLD-55p-HAC1 was linearized and integrated into the GS115 genome. After eliminating the resistance to Zeocin and Kanamycin, the resulting recombinant strain was designated as H55. Subsequently, multicopy plasmids for Va, Vb, and Vc were linearized and transformed into both GS115 and H55 strains to observe variations in nanobody production. This engineering approach, encompassing in vitro construction of two-copy and four-copy plasmids followed by transformation into two hosts, is denoted as the “packaging strategy of high-yielding strain construction”.
Similar to the previous observations, the yield of Va was found to be increased, with semi-quantitative analysis revealing that the yield of H55-2-Va was 1.78 times that of G-1-Va (Figure 11A,D). Furthermore, the Vb yield of H55-1-Vb was 1.87 times that of G-1-Vb, and the yield of H55-2-Vb was 1.98 times that of G-1-Vb (Figure 11B,E). Additionally, the Vc yield of H55-1-Vc was 2.34 times that of G-1-Vc (Figure 11C,F). Interestingly, under the same gene dosage conditions, all strains derived from H55 exhibited higher Va (Vb or Vc) production compared to those derived from GS115. However, the production of the target protein in high-copy strains is not necessarily higher than in one-copy strains, as the productions of the target protein in all four-copy strains were lower than that in the corresponding one-copy strains. Notably, the Vc yield of H55-1-Vc was higher than that of H55-2-Vc and H55-4-Vc (Figure 11C,F), indicating the presence of other unidentified bottlenecks in Vc secretion.

4. Discussion

Various hosts are utilized for the production of nanobodies. For example, Caplacizumab (ALX-0081), used in the treatment of acquired thrombotic thrombocytopenic purpura, and Ozoralizumab, used to treat rheumatoid arthritis, are manufactured in E. coli and are already on the market [28,29]. Additionally, ALX-0651, IBI322, and IBI323, produced in mammalian cells for treating tumors, have entered the clinical stage [30,31,32]. Moreover, nanobodies produced in P. pastoris, such as ALX-0061, ALX-0171, and Everestmab, have also reached the clinical stage [33,34,35]. Increasing the yield of these nanobodies evidently contributes to enhanced profitability and generates more value, which serves as the primary concern of this research.
P. pastoris is unsuitable for expressing the Fc fragment due to its specific glycosylation pattern. However, the aforementioned monovalent/multivalent nanobodies at the clinical stage confirm the effectiveness of this host. P. pastoris cells do not generate endotoxins and can secrete nanobodies into the culture supernatant, simplifying downstream purification processes. This host can conduct high-density fermentation at a low cost, and the yield of some nanobodies has reached significant levels. For instance, the high-density fermentation yield of the nanobody Nb11-59 has reached 20 g/L [36]. Considering that this yield has reached such a high level without optimization, the high productivity is attributed to protein specificity, thus limiting its reference value.
This research aims to investigate an advanced, universal, and efficient expression platform for producing nanobodies in P. pastoris. Considering the significant prospects of nanobodies in the pharmaceutical industry, the concern about the antibiotic resistance gene drift was prioritized. Despite the absence of independent plasmids in P. pastoris cells, the potential for cell lysis followed by the release of genomic DNA poses a risk of spreading resistance genes into the external environment. Hence, the lox71-ori-KanR-PAOX1-lacO-Cre-AOX1TT-PTEF1-PEM7-ZeoR-CYC1TT-lox66 segment replaced the homologous segments on the pMCO-AOXα and pMCO-AOX plasmids, yielding the pLD-AOXα and pLD-AOX plasmids, respectively. The colony PCR assay revealed that methanol-inducible Cre recombinase facilitated genetic rearrangement, resulting in the simultaneous removal of KanR and ZeocinR genes. Therefore, the pLD-AOXα plasmid for secretory expression and the pLD-AOX plasmid for intracellular expression were utilized for subsequent vector modifications.
Obviously, optimizing the promoter and signal peptide is beneficial for enhancing the secretion of nanobodies. However, the prioritization of related engineering modifications has not been sufficiently emphasized. When constructing multicopy strains, the components of the expression cassette, such as the promoter, signal peptide, target gene, and terminator, are amplified. In other words, it is essential to identify which promoter or signal peptide can yield the best expression before attempting to increase gene dosage. In this study, the AOX1 promoter mutants 133p and 160p were employed to enhance the expression of Va, and the 160p promoter led to a 1.38-fold increase in Va yield. Despite the absence of mRNA-level analysis, it is inferred from the findings of Hartner et al. [11] and the experimental phenomena in this study that the use of the 160p promoter improved Va production by enhancing transcription levels. Liu et al. demonstrated an improved transcriptional signal amplification device (iTSAD) that boosted the transcription level of the AOX1 promoter by 5.2-fold [37]. This suggests the potential for increased target protein production using this hybrid promoter. However, in this study, the production of the target protein in the four-copy strains was consistently lower than that in the corresponding two-copy strains, and notably, the Vc yield of H55-2-Vc was even lower than that of H55-1-Vc. It can be inferred that the use of iTSAD may not optimize nanobody production due to excessive promoter strength. Accordingly, the use of appropriately enhanced promoters is imperative for the efficient expression of nanobodies. Another crucial element in the expression cassette is the signal peptides. Seven signal peptides were evaluated to augment Va secretion, with four resulting in higher Va yield (Figure 4). In particular, the α-factor Δ57–70 signal peptide exhibited the most significant effect, boosting Va production by 1.89 times. Therefore, the pLD-P2S2 plasmid containing the 160p promoter and α-factor Δ57–70 signal peptide was employed for the expression of Va, Vb, and Vc.
After optimizing the gene dosage, the changes in the production of target nanobodies were inconsistent. Specifically, for Va and Vb, strains with a medium copy number (2 copies) exhibited higher production of target proteins compared to strains with low copy numbers (one copy) and high copy numbers (four copies), as shown in Figure 11. Similar phenomena have been observed in other studies. For instance, the production of porcine insulin precursor (PIP) in strains with 12 copies was higher than in strains with 3 copies [19]. However, as the gene dosage continued to increase to 18, 29, and 52, the PIP production further decreased, thus resulting in a bell-shaped curve relationship between gene dosage and protein production. The transcriptional analysis of KAR2 (BIP) indicated that strains with higher copy numbers were experiencing more ER stress [19]. Therefore, we believe that an appropriate gene dosage is essential for the efficient expression of nanobodies, with the peak of the bell-shaped curve representing the optimal copy number. Furthermore, the Vc yield of G-1-Vc was higher than that of G-2-Vc and G-4-Vc (Figure 11C,F), suggesting the presence of unidentified bottlenecks in Vc secretion that require further resolution.
Molecular chaperones are vital for facilitating the folding and transport of target proteins. Alongside well-established chaperones such as HAC1, SSA1, YDJ1, PDI, BIP, and SSO1, some recently documented instances were referenced where the corresponding molecular chaperones were used in this study to boost the Va yield. Aft1, annotated as an activator of ferrous transport, led to a secretion of up to 2.5-fold more carboxylesterase [38] and 1.47-fold more Leech hyalidase (LHyal) [39]. Closed-loop associated factors included the eIF4F complex (eIF4E, eIF4A, eIF4G) and PAB1. Co-expression of eIF4G or PAB1 alone resulted in a 2-fold increase in the target protein production, while co-expression of eIF4E, eIF4A, eIF4G, and PAB1 led to a 2.5-fold increase [40]. A push-and-pull strategy has recently been implemented to enhance the secretory expression of heterologous proteins [41]. The co-expression of Hsp70s, Hsp40s, and NEFs improved the translocation competence of the recombinant protein and its targeting to the ER membrane (push), while also increasing the driving force for protein import into the ER and subsequent folding on the opposite side of the membrane (pull). Ultimately, the co-expression of SSA1, YDJ1, SNL1, KAR2, and LHS1 resulted in a 2.75-fold increase in carboxylesterase (CES) production. In a study on the rabies virus glycoprotein (RABV-G), the co-expression of oxidative folding proteins such as PDI or ERO1, along with the glutathione-related genes GPX1 or GLR1, resulted in significant improvements in RABV-G secretion: 9.5-fold, 3.3-fold, 8.2-fold, and 1.2-fold, respectively [42]. Furthermore, the co-expression of SEC1, SEC4, and KEX2 led to increases in the target protein yield by 2.5-fold [43], 1.79-fold [44], and 1.98-fold [45], respectively. However, among the 25 molecular chaperones tested, only HAC1 increased Va production by 1.5-fold (Figure 8). Considering previous studies that reported cellular abundances of approximately 300,000 for BIP, 2400 for SIL1, and 140 for LHS1 [46], it is speculated that uniformly regulating the expression of different molecular chaperones using the AOX1 promoter may not be entirely suitable. This may be an expression of other molecular partners not leading to an increase in Va production. Based on the above situation, the promoter of HAC1 was fine-tuned to range from 6% to 160%. Semi-quantitative analysis revealed that excessive or insufficient promoter strength for HAC1 led to minimal variation in Va production, whereas the presence of 55p-HAC1 caused a no Table 2.41-fold enhancement in Va production (Figure 9). Consequently, the 2-P2S2-Va-55p-HAC1 strain was utilized for high-density fermentation, achieving a final yield of 2.13 g/L.
Subsequently, Vb and Vc were utilized to further verify the universality and effectiveness of the aforementioned optimization strategies. The in vitro construction of two-copy and four-copy plasmids generally took 10 days, while transformation in both GS115 and H55 hosts, followed by shake-flask induction, typically required 11 days. A total of approximately three weeks was consumed to obtain high-yielding yeast strains with the optimal gene dosage and molecular chaperone (55p-HAC1). This time-efficient engineering method, which involves in vitro construction of two-copy and four-copy plasmids as well as transformation into two hosts, is referred to as the “packaging strategy of high-yielding strain construction”. While the high-yielding strains hold potential for further enhancement and can serve as the parental strain for subsequent optimization, some significant application scenarios need to be acknowledged. When dozens of nanobodies targeting a specific epitope have been initially screened, only the nanobodies demonstrating both high affinity and high yield are likely to progress to the next stage of development. The universal and efficient expression optimization strategy established in this study may be the most potent tool to meet this application scenario.
In this investigation, each optimization strategy individually led to a moderate increase in the Va production, ranging from 1.38-fold to 2.41-fold. This observation can be attributed to the protein specificity and the initial yield of the target protein. For instance, the phytase production in a six-copy strain was 2.41 times higher than in a one-copy strain, and co-expression of HAC1 further boosted the yield by 1.4 times, ultimately achieving a high-density fermentation yield of 9.58 g/L [47]. Similarly, the production of glucose oxidase in a two-copy strain was improved by 1.3-fold, and co-expression of HAC1 subsequently increased the yield by 1.59-fold, resulting in a high-density fermentation yield of 2125.3 U/mL, the highest reported level for glucose oxidase at the time of publication [48]. Additionally, lower initial yield of the target protein correlated with a greater increase in yield after optimization. For example, the initial production of Rhizopus oryzae glucoamylase (GA) was 3.085 µg/mL, and signal peptide modification, gene dosage optimization, and co-expression of SEC4 led to a 100.151-fold increase in GA production [44]. Similarly, the initial production of full-length human IgG1 was less than 1 mg/L, and after optimization, its yield increased by 180-fold [49]. Consequently, we affirm that the various optimization strategies employed in this study are effective and reliable.
In future research, certain details and improvements merit further exploration. Firstly, in certain studies, the highest level of target protein secretion was achieved by strains containing 12 [19] or even 19 copies [50], while our study’s optimal gene dosage was merely 1 or 2 copies. This necessitates investigation into potential reasons such as protein specificity, promoters, or plasmid integration sites. Additionally, in our previous study, some nanobodies could not be secreted in P. pastoris, possibly attributable to their complex spatial structure. The pre-Ost1-pro-α-factor signal peptide directs the target protein to the co-translational translocation pathway, resulting in a 20-fold increase in tetrameric red fluorescent protein (E2-Crimson) production. Exploring the use of this signal peptide could facilitate the secretory expression of nanobodies that were originally unexpressed in P. pastoris. Finally, despite positive evidence from previous studies [15,17], this study did not conduct corresponding mRNA level tests. Subsequent research should include mRNA detection to further elucidate the mechanism behind the increase in nanobody production.

5. Conclusions

This study aims to establish a universal strategy for achieving efficient secretory expression of nanobodies in P. pastoris. Va, Vb, and Vc were used as model proteins. Initially, plasmids pLD-AOXα (for secretion expression) and pLD-AOX (for intracellular expression) were constructed, enabling the resulting transformants to lose the kanamycin and Zeocin resistance genes through methanol induction. Subsequently, promoter modification and signal peptide optimization led to a 1.38-fold and 1.89-fold increase in Va yield, respectively. Additional gene dosage optimization further increased the yield by 1.39-fold, and co-expression of HAC1 resulted in a 1.5-fold increase. A substantial 2.41-fold increase was achieved by using the attenuated 55p promoter to express HAC1, ultimately yielding 2.13 g/L for Va in high-density fermentation. Implementing the packaging strategy elevated the yields of Vb and Vc by 1.98-fold and 2.34-fold, respectively, confirming the universality and effectiveness of this expression optimization strategy.

Supplementary Materials

The following supporting information can be downloaded at: https://www.mdpi.com/article/10.3390/fermentation10010037/s1, Table S1: Primers used in this study.

Author Contributions

Conceptualization, D.L.; methodology, Y.Z. and B.L.; validation, Y.Z., S.Z. and J.L.; formal analysis, Y.Z.; investigation, Y.Z.; resources, D.L.; data curation, Y.Z. and D.L.; writing—original draft preparation, Y.Z.; writing—review and editing, Y.Z. and D.L.; supervision, D.L.; project administration, D.L.; funding acquisition, D.L. All authors have read and agreed to the published version of the manuscript.

Funding

This work was funded by the National Natural Science Foundation of China (Grant No. 32002316, 31961133017).

Institutional Review Board Statement

Not applicable.

Informed Consent Statement

Not applicable.

Data Availability Statement

Data are contained within the article and supplementary materials.

Conflicts of Interest

The authors declare no conflicts of interest.

References

  1. Hamers-Casterman, C.; Atarhouch, T.; Muyldermans, S.; Robinson, G.; Hammers, C.; Songa, E.B.; Bendahman, N.; Hammers, R. Naturally occurring antibodies devoid of light chains. Nature 1993, 363, 446–448. [Google Scholar] [CrossRef] [PubMed]
  2. Roberts, K.J.; Cubitt, M.F.; Carlton, T.M.; Rodrigues-Duarte, L.; Maggiore, L.; Chai, R.; Clare, S.; Harcourt, K.; MacDonald, T.T.; Ray, K.P.; et al. Preclinical development of a bispecific TNFα/IL-23 neutralising domain antibody as a novel oral treatment for inflammatory bowel disease. Sci. Rep. 2021, 11, 19422. [Google Scholar] [CrossRef] [PubMed]
  3. Hanke, L.; Vidakovics Perez, L.; Sheward, D.J.; Das, H.; Schulte, T.; Moliner-Morro, A.; Corcoran, M.; Achour, A.; Karlsson Hedestam, G.B.; Hällberg, B.M. An alpaca nanobody neutralizes SARS-CoV-2 by blocking receptor interaction. Nat. Commun. 2020, 11, 4420. [Google Scholar] [CrossRef]
  4. Zhou, Z.; Vaidyanathan, G.; McDougald, D.; Kang, C.M.; Balyasnikova, I.; Devoogdt, N.; Ta, A.N.; McNaughton, B.R.; Zalutsky, M.R. Fluorine-18 labeling of the HER2-targeting single-domain antibody 2Rs15d using a residualizing label and preclinical evaluation. Mol. Imaging Biol. 2017, 19, 867–877. [Google Scholar] [CrossRef] [PubMed]
  5. Sheng, Y.; Wang, K.; Lu, Q.; Ji, P.; Liu, B.; Zhu, J.; Liu, Q.; Sun, Y.; Zhang, J.; Zhou, E.-M.; et al. Nanobody-horseradish peroxidase fusion protein as an ultrasensitive probe to detect antibodies against Newcastle disease virus in the immunoassay. J. Nanobiotechnol. 2019, 17, 35. [Google Scholar] [CrossRef] [PubMed]
  6. Wei, Z.; Shen, W.; Feng, K.; Feng, Y.; He, Z.; Li, Y.; Jiang, C.; Liu, S.; Zhu, Y.-G.; Deng, Y. Organic fertilizer potentiates the transfer of typical antibiotic resistance gene among special bacterial species. J. Hazard. Mater. 2022, 435, 128985. [Google Scholar] [CrossRef]
  7. Trubenová, B.; Roizman, D.; Moter, A.; Rolff, J.; Regoes, R.R. Population genetics, biofilm recalcitrance, and antibiotic resistance evolution. Trends Microbiol. 2022, 30, 841–852. [Google Scholar] [CrossRef]
  8. Bhattacharyya, S.; Bhattacharyya, M.; Pfannenstiel, D.M.; Nandi, A.K.; Hwang, Y.; Ho, K.; Harshey, R.M. Efflux-linked accelerated evolution of antibiotic resistance at a population edge. Mol. Cell 2022, 82, 4368–4385.e6. [Google Scholar] [CrossRef]
  9. Nguyen, B.-A.T.; Chen, Q.-L.; He, J.-Z.; Hu, H.-W. Microbial regulation of natural antibiotic resistance: Understanding the protist-bacteria interactions for evolution of soil resistome. Sci. Total Environ. 2020, 705, 135882. [Google Scholar] [CrossRef]
  10. Qin, X.; Qian, J.; Yao, G.; Zhuang, Y.; Zhang, S.; Chu, J. GAP promoter library for fine-tuning of gene expression in Pichia pastoris. Appl. Environ. Microbiol. 2011, 77, 3600–3608. [Google Scholar] [CrossRef]
  11. Hartner, F.S.; Ruth, C.; Langenegger, D.; Johnson, S.N.; Hyka, P.; Lin-Cereghino, G.P.; Lin-Cereghino, J.; Kovar, K.; Cregg, J.M.; Glieder, A. Promoter library designed for fine-tuned gene expression in Pichia pastoris. Nucleic Acids Res. 2008, 36, e76. [Google Scholar] [CrossRef] [PubMed]
  12. Xiong, A.S.; Yao, Q.H.; Peng, R.H.; Han, P.L.; Cheng, Z.M.; Li, Y. High level expression of a recombinant acid phytase gene in Pichia pastoris. J. Appl. Microbiol. 2005, 98, 418–428. [Google Scholar] [CrossRef] [PubMed]
  13. Lin-Cereghino, G.P.; Stark, C.M.; Kim, D.; Chang, J.; Shaheen, N.; Poerwanto, H.; Agari, K.; Moua, P.; Low, L.K.; Tran, N.; et al. The effect of α-mating factor secretion signal mutations on recombinant protein expression in Pichia pastoris. Gene 2013, 519, 311–317. [Google Scholar] [CrossRef] [PubMed]
  14. Zhang, Y.; Huang, H.; Yao, X.; Du, G.; Chen, J.; Kang, Z. High-yield secretory production of stable, active trypsin through engineering of the N-terminal peptide and self-degradation sites in Pichia pastoris. Bioresour. Technol. 2018, 247, 81–87. [Google Scholar] [CrossRef] [PubMed]
  15. Vadhana, A.K.P.; Samuel, P.; Berin, R.M.; Krishna, J.; Kamatchi, K.; Meenakshisundaram, S. Improved secretion of Candida antarctica lipase B with its native signal peptide in Pichia pastoris. Enzyme Microb. Technol. 2013, 52, 177–183. [Google Scholar] [CrossRef]
  16. Liang, S.; Li, C.; Ye, Y.; Lin, Y. Endogenous signal peptides efficiently mediate the secretion of recombinant proteins in Pichia pastoris. Biotechnol. Lett. 2013, 35, 97–105. [Google Scholar] [CrossRef]
  17. Duan, G.; Ding, L.; Wei, D.; Zhou, H.; Chu, J.; Zhang, S.; Qian, J. Screening endogenous signal peptides and protein folding factors to promote the secretory expression of heterologous proteins in Pichia pastoris. J. Biotechnol. 2019, 306, 193–202. [Google Scholar] [CrossRef]
  18. Aw, R.; Polizzi, K.M. Can too many copies spoil the broth? Microb. Cell Fact. 2013, 12, 128. [Google Scholar] [CrossRef]
  19. Zhu, T.; Guo, M.; Tang, Z.; Zhang, M.; Zhuang, Y.; Chu, J.; Zhang, S. Efficient generation of multi-copy strains for optimizing secretory expression of porcine insulin precursor in yeast Pichia pastoris. J. Appl. Microbiol. 2009, 107, 954–963. [Google Scholar] [CrossRef]
  20. Delic, M.; Valli, M.; Graf, A.B.; Pfeffer, M.; Mattanovich, D.; Gasser, B. The secretory pathway: Exploring yeast diversity. FEMS Microbiol. Rev. 2013, 37, 872–914. [Google Scholar] [CrossRef]
  21. Bankefa, O.E.; Wang, M.; Zhu, T.; Li, Y. Hac1p homologues from higher eukaryotes can improve the secretion of heterologous proteins in the yeast Pichia pastoris. Biotechnol. Lett. 2018, 40, 1149–1156. [Google Scholar] [CrossRef]
  22. Guerfal, M.; Ryckaert, S.; Jacobs, P.P.; Ameloot, P.; Van Craenenbroeck, K.; Derycke, R.; Callewaert, N. The HAC1 gene from Pichia pastoris: Characterization and effect of its overexpression on the production of secreted, surface displayed and membrane proteins. Microb. Cell Fact. 2010, 9, 49. [Google Scholar] [CrossRef] [PubMed]
  23. Ahmad, M.; Hirz, M.; Pichler, H.; Schwab, H. Protein expression in Pichia pastoris: Recent achievements and perspectives for heterologous protein production. Appl. Microbiol. Biotechnol. 2014, 98, 5301–5317. [Google Scholar] [CrossRef] [PubMed]
  24. Brodsky, J.L.; Goeckeler, J.; Schekman, R. BiP and Sec63p are required for both co-and posttranslational protein translocation into the yeast endoplasmic reticulum. Proc. Natl. Acad. Sci. USA 1995, 92, 9643–9646. [Google Scholar] [CrossRef] [PubMed]
  25. Li, D.; Wu, J.; Chen, J.; Zhang, D.; Zhang, Y.; Qiao, X.; Yu, X.; Zheng, Q.; Hou, J. Optimized expression of classical swine fever virus E2 protein via combined strategy in Pichia pastoris. Protein Expr. Purif. 2020, 167, 105527. [Google Scholar] [CrossRef] [PubMed]
  26. Teng, D.; Xi, D.; Zhang, J.; Wang, X.; Mao, R.; Zhang, Y.; Wang, J. Multiple copies of the target gene enhances plectasin secretion in Pichia pastoris X-33. Process Biochem. 2015, 50, 553–560. [Google Scholar] [CrossRef]
  27. Li, D.; Zhang, B.; Li, S.; Zhou, J.; Cao, H.; Huang, Y.; Cui, Z. A novel vector for construction of markerless multicopy overexpression transformants in Pichia pastoris. Front. Microbiol. 2017, 8, 1698. [Google Scholar] [CrossRef]
  28. Ulrichts, H.; Silence, K.; Schoolmeester, A.; de Jaegere, P.; Rossenu, S.; Roodt, J.; Priem, S.; Lauwereys, M.; Casteels, P.; Van Bockstaele, F.; et al. Antithrombotic drug candidate ALX-0081 shows superior preclinical efficacy and safety compared with currently marketed antiplatelet drugs. Blood J. Am. Soc. Hematol. 2011, 118, 757–765. [Google Scholar] [CrossRef]
  29. Coppieters, K.; Dreier, T.; Silence, K.; Haard, H.D.; Lauwereys, M.; Casteels, P.; Beirnaert, E.; Jonckheere, H.; Wiele, C.V.D.; Staelens, L.; et al. Formatted anti-tumor necrosis factor α VHH proteins derived from camelids show superior potency and targeting to inflamed joints in a murine model of collagen-induced arthritis. Arthritis. Rheum. 2006, 54, 1856–1866. [Google Scholar] [CrossRef]
  30. Bobkov, V.; Zarca, A.M.; Van Hout, A.; Arimont, M.; Doijen, J.; Bialkowska, M.; Toffoli, E.; Klarenbeek, A.; van der Woning, B.; van der Vliet, H.J.; et al. Nanobody-Fc constructs targeting chemokine receptor CXCR4 potently inhibit signaling and CXCR4-mediated HIV-entry and induce antibody effector functions. Biochem. Pharmacol. 2018, 158, 413–424. [Google Scholar] [CrossRef]
  31. Jiang, H.; Ni, H.; Zhang, P.; Guo, X.; Wu, M.; Shen, H.; Wang, J.; Wu, W.; Wu, Z.; Ding, J.; et al. PD-L1/LAG-3 bispecific antibody enhances tumor-specific immunity. Oncoimmunology 2021, 10, 1943180. [Google Scholar] [CrossRef] [PubMed]
  32. Wang, Y.; Ni, H.; Zhou, S.; He, K.; Gao, Y.; Wu, W.; Wu, M.; Wu, Z.; Qiu, X.; Zhou, Y. Tumor-selective blockade of CD47 signaling with a CD47/PD-L1 bispecific antibody for enhanced anti-tumor activity and limited toxicity. Cancer Immunol. Immunother. 2021, 70, 365–376. [Google Scholar] [CrossRef] [PubMed]
  33. Van Roy, M.; Ververken, C.; Beirnaert, E.; Hoefman, S.; Kolkman, J.; Vierboom, M.; Breedveld, E.; ‘t Hart, B.; Poelmans, S.; Bontinck, L.; et al. The preclinical pharmacology of the high affinity anti-IL-6R Nanobody® ALX-0061 supports its clinical development in rheumatoid arthritis. Arthritis Res. Ther. 2015, 17, 135. [Google Scholar] [CrossRef] [PubMed]
  34. Detalle, L.; Stohr, T.; Palomo, C.; Piedra, P.A.; Gilbert, B.E.; Mas, V.; Millar, A.; Power, U.F.; Stortelers, C.; Allosery, K.; et al. Generation and characterization of ALX-0171, a potent novel therapeutic nanobody for the treatment of respiratory syncytial virus infection. Antimicrob. Agents Chemother. 2016, 60, 6–13. [Google Scholar] [CrossRef]
  35. Pan, H.; Su, Y.; Xie, Y.; Wang, W.; Qiu, W.; Chen, W.; Lu, W.; Lu, Z.; Wang, W.; Shang, A. Everestmab, a novel long-acting GLP-1/anti GLP-1R nanobody fusion protein, exerts potent anti-diabetic effects. Artif. Cells Nanomed. Biotechnol. 2020, 48, 854–866. [Google Scholar] [CrossRef] [PubMed]
  36. Gai, J.; Ma, L.; Li, G.; Zhu, M.; Qiao, P.; Li, X.; Zhang, H.; Zhang, Y.; Chen, Y.; Ji, W. A potent neutralizing nanobody against SARS-CoV-2 with inhaled delivery potential. MedComm 2021, 2, 101–113. [Google Scholar] [CrossRef] [PubMed]
  37. Liu, Q.; Song, L.; Peng, Q.; Zhu, Q.; Shi, X.; Xu, M.; Wang, Q.; Zhang, Y.; Cai, M. A programmable high-expression yeast platform responsive to user-defined signals. Sci. Adv. 2022, 8, eabl5166. [Google Scholar] [CrossRef]
  38. Ruth, C.; Buchetics, M.; Vidimce, V.; Kotz, D.; Naschberger, S.; Mattanovich, D.; Pichler, H.; Gasser, B. Pichia pastoris Aft1-a novel transcription factor, enhancing recombinant protein secretion. Microb. Cell Fact. 2014, 13, 120. [Google Scholar] [CrossRef]
  39. Huang, H.; Liang, Q.; Wang, Y.; Chen, J.; Kang, Z. High-level constitutive expression of leech hyaluronidase with combined strategies in recombinant Pichia pastoris. Appl. Microbiol. Biotechnol. 2020, 104, 1621–1632. [Google Scholar] [CrossRef]
  40. Staudacher, J.; Rebnegger, C.; Dohnal, T.; Landes, N.; Mattanovich, D.; Gasser, B. Going beyond the limit: Increasing global translation activity leads to increased productivity of recombinant secreted proteins in Pichia pastoris. Metab. Eng. 2022, 70, 181–195. [Google Scholar] [CrossRef]
  41. Zahrl, R.J.; Prielhofer, R.; Ata, Ö.; Baumann, K.; Mattanovich, D.; Gasser, B. Pushing and pulling proteins into the yeast secretory pathway enhances recombinant protein secretion. Metab. Eng. 2022, 74, 36–48. [Google Scholar] [CrossRef] [PubMed]
  42. Ben Azoun, S.; Belhaj, A.E.; Göngrich, R.; Gasser, B.; Kallel, H. Molecular optimization of rabies virus glycoprotein expression in Pichia pastoris. Microb. Biotechnol. 2016, 9, 355–368. [Google Scholar] [CrossRef] [PubMed]
  43. Guan, B.; Chen, F.; Su, S.; Duan, Z.; Chen, Y.; Li, H.; Jin, J. Effects of co-overexpression of secretion helper factors on the secretion of a HSA fusion protein (IL2-HSA) in Pichia pastoris. Yeast 2016, 33, 587–600. [Google Scholar] [CrossRef]
  44. Liu, S.H.; Chou, W.I.; Sheu, C.C.; Chang, M.D. Improved secretory production of glucoamylase in Pichia pastoris by combination of genetic manipulations. Biochem. Biophys. Res. Commun. 2005, 326, 817–824. [Google Scholar] [CrossRef] [PubMed]
  45. Yang, S.; Kuang, Y.; Li, H.; Liu, Y.; Hui, X.; Li, P.; Jiang, Z.; Zhou, Y.; Wang, Y.; Xu, A.; et al. Enhanced production of recombinant secretory proteins in Pichia pastoris by optimizing Kex2 P1’site. PLoS ONE 2013, 8, e75347. [Google Scholar] [CrossRef] [PubMed]
  46. de Ruijter, J.C.; Koskela, E.V.; Frey, A.D. Enhancing antibody folding and secretion by tailoring the Saccharomyces cerevisiae endoplasmic reticulum. Microb. Cell Fact. 2016, 15, 87. [Google Scholar] [CrossRef] [PubMed]
  47. Li, C.; Lin, Y.; Zheng, X.; Pang, N.; Liao, X.; Liu, X.; Huang, Y.; Liang, S. Combined strategies for improving expression of Citrobacter amalonaticus phytase in Pichia pastoris. BMC Biotechnol. 2015, 15, 88. [Google Scholar] [CrossRef]
  48. Yu, S.; Miao, L.; Huang, H.; Li, Y.; Zhu, T. High-level production of glucose oxidase in Pichia pastoris: Effects of Hac1p overexpression on cell physiology and enzyme expression. Enzyme Microb. Technol. 2020, 141, 109671. [Google Scholar] [CrossRef]
  49. Rakestraw, J.A.; Sazinsky, S.L.; Piatesi, A.; Antipov, E.; Wittrup, K.D. Directed evolution of a secretory leader for the improved expression of heterologous proteins and full-length antibodies in Saccharomyces cerevisiae. Biotechnol. Bioeng. 2009, 103, 1192–1201. [Google Scholar] [CrossRef]
  50. Clare, J.J.; Romanes, M.A.; Rayment, F.B.; Rowedder, J.E.; Smith, M.A.; Payne, M.M.; Sreekrishna, K.; Henwood, C.A. Production of mouse epidermal growth factor in yeast: High-level secretion using Pichia pastoris strains containing multiple gene copies. Gene 1991, 105, 205–212. [Google Scholar] [CrossRef]
Figure 1. The schematic map of pLD-AOXα and pLD-AOX. The loxP sites and cloning sites associated with vector construction are marked in red. The subsequently replaced promoter and signal peptide are highlighted in blue and green, respectively.
Fermentation 10 00037 g001
Figure 2. The schematic map of methanol-induced genetic rearrangement (A) and the corresponding colony PCR assay (B). Lane 1, G-pLD-AOXαR; Lane 2, G-pLD-AOXR; Lane 3, G-pLD-AOXαS; Lane 4, G-pLD-AOXS. The loxP sites are marked in red and blue, and the Cre recombinase is marked in purple. Methanol induced the expression of the Cre recombinase, which then facilitated the rearrangement (deletion) of the DNA fragment between lox71 and lox66.
Fermentation 10 00037 g002
Figure 3. Impact of promoter optimization on Va production. (A) SDS-PAGE analysis. A 10 µL supernatant sample was loaded onto each lane. (B) Semi-quantitative analysis. (C) SDS-PAGE analysis. A 20 µL supernatant sample was loaded onto each lane. NC, negative control. Lane 1, 1-AOXα-Va; Lane 2, 1-P1α-Va; Lane 3, 1-P2α-Va. * p < 0.05.
Fermentation 10 00037 g003
Figure 4. Impact of signal peptide optimization on Va production. (A) SDS-PAGE analysis. Equal volume of each supernatant sample (10 µL) was loaded onto each lane. (B) Semi-quantitative analysis. Lane 1, 1-P2α-Va; Lane 2, 1-P1S1-Va; Lane 3, 1-P2S2-Va; Lane 4, 1-P2S3-Va; Lane 5, 1-P2S4-Va; Lane 6, 1-P2S5-Va; Lane 7, 1-P2S6-Va; Lane 8, 1-P2S7-Va. * p < 0.05.
Fermentation 10 00037 g004
Figure 5. Gel electrophoresis analysis of multicopy plasmids digested with Spe I and Xba I. Lane 1, pLD-P2S2-Va; Lane 2, pLD-2-P2S2-Va; Lane 3, pLD-4-P2S2-Va; Lane 4, pLD-P2S2-Vb; Lane 5, pLD-2-P2S2-Vb; Lane 6, pLD-4-P2S2-Vb; Lane 7, pLD-P2S2-Vc; Lane 8, pLD-2-P2S2-Vc; Lane 9, pLD-4-P2S2-Vc. The vector frame is indicated by an arrow.
Fermentation 10 00037 g005
Figure 6. Impact of gene dosage on Va production. (A) SDS-PAGE analysis. Equal volume of each supernatant sample (10 µL) was loaded onto each lane. (B) Semi-quantitative analysis. Lane 1, 1-P2S2-Va; Lane 2, 2-P2S2-Va; Lane 3, 4-P2S2-Va. * p < 0.05.
Fermentation 10 00037 g006
Figure 7. Validation of Va production for Zeocin-sensitive strains. (A) SDS-PAGE analysis. Equal volume of each supernatant sample (10 µL) was loaded onto each lane. (B) Semi-quantitative analysis. Lane 1, 2-P2S2-Va; Lane 2, 2-P2S2-Va-S#3; Lane 3, 2-P2S2-Va-S#18; Lane 4, 2-P2S2-Va-S#24.
Fermentation 10 00037 g007
Figure 8. Impact of co-expression of molecular chaperones on Va production. (AD) SDS-PAGE analysis. Equal volume of each supernatant sample (10 µL) was loaded onto each lane. The names of all co-expressed molecular chaperones in the 2-P2S2-Va strain were labeled in each lane to aid understanding. Control, 2-P2S2-Va. (EH) Semi-quantitative analysis. * p < 0.05.
Fermentation 10 00037 g008
Figure 9. Fine-tuning the promoter strength for HAC1 and its impact on Va production. (A) SDS-PAGE analysis. Equal volume of each supernatant sample (10 µL) was loaded onto each lane. (B) Semi-quantitative analysis. Lane 1, the control strain 2-P2S2-Va. Lane 2, 2-P2S2-Va-6p-HAC1; Lane 3, 2-P2S2-Va-14p-HAC1; Lane 4, 2-P2S2-Va-30p-HAC1; Lane 5, 2-P2S2-Va-55p-HAC1; Lane 6, 2-P2S2-Va-75p-HAC1; Lane 7, 2-P2S2-Va-HAC1 (with the wild-type PAOX1); Lane 8, 2-P2S2-Va-160p-HAC1. * p < 0.05.
Fermentation 10 00037 g009
Figure 10. High-density fermentation assay. Lanes 1–7, supernatants of strain 2-P2S2-Va-55p-HAC1 in 3 L high-density fermentation culture. Samples were collected at 24, 48, 72, 96, 120, 144, and 168 h after methanol induction. Lane 8, supernatant of strain 2-P2S2-Va-55p-HAC1 in shake-flask culture. Lane 9, supernatant of the initial strain 1-AOXα-Va in shake-flask culture.
Fermentation 10 00037 g010
Figure 11. Variations in the yields of Va, Vb, and Vc through the implementation of “packaging strategy”. (AC) SDS-PAGE analysis. Equal volume of each supernatant sample (10 µL) was loaded onto each lane. (DF) Semi-quantitative analysis. Lanes 1–3, G-n-Va (n = 1, 2, 4); Lanes 4–6, H55-n-Va (n = 1, 2, 4); Lanes 7–9, G-n-Vb (n = 1, 2, 4); Lanes 10–12, H55-n-Vb (n = 1, 2, 4); Lanes 13–15, G-n-Vc (n = 1, 2, 4); Lanes 16–18, H55-n-Vc (n = 1, 2, 4). NC, negative control. To aid understanding, the target protein, host, and gene copy numbers have all been labeled. * p < 0.05.
Fermentation 10 00037 g011
Table 1. Recombinant plasmids used in this study.
Plasmid NameAbbreviated Names of the PAOX1 MutantsPromoter StrengthSignal Peptide
pLD-AOXαAOX1 (WT)100% (WT)α-factor
pLD-P1α133p133%α-factor
pLD-P2α160p160%α-factor
pLD-P2S1160p160%MF4I
pLD-P2S2160p160%α-factor Δ57–70
pLD-P2S3160p160%α-factor Δ57–70 plus HL28
pLD-P2S4160p160%nSB
pLD-P2S5160p160%Dse4
pLD-P2S6160p160%Msb2
pLD-P2S7160p160%Gas1
pLD-AOXAOX1 (WT)100% (WT)None
pLD-6p6p6%None
pLD-14p14p14%None
pLD-30p30p30%None
pLD-55p55p55%None
pLD-75p75p75%None
pLD-160p160p160%None
The parental plasmids are indicated in bold type.
Table 2. Molecular chaperones used in this study.
NameFunctionMajor Subcellular
Localization
Genomic Number
HAC1Transcription factorNucleusPAS_chr1-1_0381
AFT1Transcription factorNucleusPAS_chr1-4_0361
eIF4AEukaryotic translation initiation factorCytoplasmPAS_chr3_0595
eIF4EEukaryotic translation initiation factorCytoplasmPAS_chr3_0972
eIF4GEukaryotic translation initiation factorCytoplasmPAS_chr1-1_0053
PAB1Poly(A) binding proteinCytoplasmPAS_chr2-1_0097
SSA1Hsp70CytoplasmPAS_chr4_0552
SSA4Hsp70CytoplasmPAS_chr3_0230
YDJ1Hsp40CytoplasmPAS_chr2-2_0066
SIS1Hsp40CytoplasmPAS_chr2-2_0151
SNL1Nucleotide exchange factorCytoplasmPAS_chr1-4_0091
GPX1Glutathione peroxidaseCytoplasmPAS_chr2-2_0382
GLR1Glutathione reductaseMitochondrionPAS_chr3_1011
PDIDisulfide isomeraseERPAS_chr4_0844
BIPHsp70ERPAS_chr2-1_0140
SIL1Nucleotide exchange factorERPAS_chr1-1_0237
LHS1Nucleotide exchange factorERPAS_chr1-3_0063
ERJ5Hsp40ERPAS_chr1-3_0134
JEM1Hsp40ERPAS_chr2-2_0015
SCJ1Hsp40ERPAS_chr1-3_0174
SSO1Plasma membrane t-SNARE proteinGolgiPAS_chr1-4_0294
SEC1Plasma membrane t-SNARE proteinGolgiPAS_chr4_0134
SEC4Rab family of GTP binding proteinGolgiPAS_chr3_0143
SEC12Nucleotide exchange factorGolgiPAS_chr4_0606
KEX2EndoproteaseGolgiPAS_chr2-1_0304
Disclaimer/Publisher’s Note: The statements, opinions and data contained in all publications are solely those of the individual author(s) and contributor(s) and not of MDPI and/or the editor(s). MDPI and/or the editor(s) disclaim responsibility for any injury to people or property resulting from any ideas, methods, instructions or products referred to in the content.

